Reading the Tea Leaves of Gold's Upcoming Move / Commodities / Gold & Silver 2020

To be bullish or not to be – thatis the question. Or it might have been the question, if someonenamed Shakespeare wrote a piece titled Investhamlet.
The choice whether to be bullish or bearish orneutral on a given asset should be made each day, each time based on theinformation that is currently available. Let’s check the new signs that we sawyesterday.
First of all, we just saw a bearish sign from thegeneral stocks market.
The Sign from Stocks
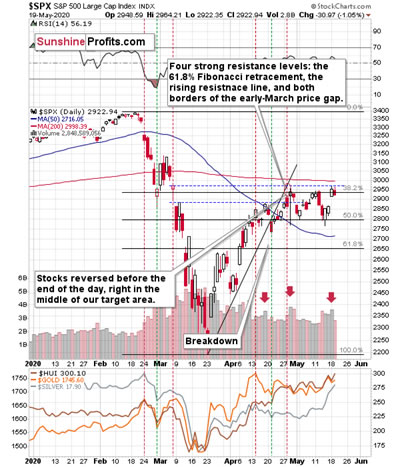
The huge price gap that we saw on Monday seems veryencouraging, but please keep in mind that the S&P500 once again failed to close the bearish price gap that it hadopened in the first half of March. So, should one trust Monday’s bullish pricegap? It seems too early in our view. The above-mentioned resistance isstrengthened by the late-April high, and the S&P 500 futures moved loweryesterday.
And by “moved lower yesterday” we actually mean,they reversed in a way that’s quite profound in case of the S&P 500futures.
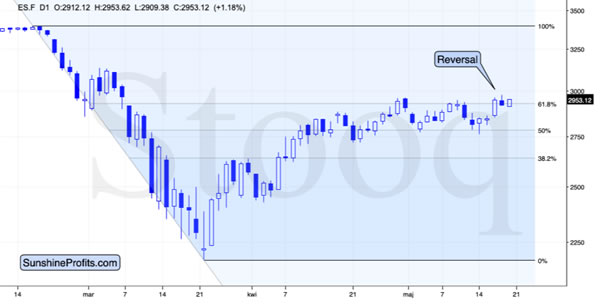
The shooting star candlestick in the stock market futures points to a change in the trend, especially since stocks invalidatedthe tiny breakout above the late-April high and the 61.8% Fibonacci retracementlevel.
Also, please note the increase in volume on theprevious chart – we saw the same thing at two April highs. Perhaps we’re seeingyet another high, instead of a beginning of a new upswing. We shall know soonenough – stocks are trading between the price gaps and they are likely to breakout or break down sooner rather than later.
The implications for silver and mining stocks –which are more connected with the general stock market than gold is – arebearish.
While stocks reversed, the USD Index moved loweronce again.
The USDX Bidding Its Time
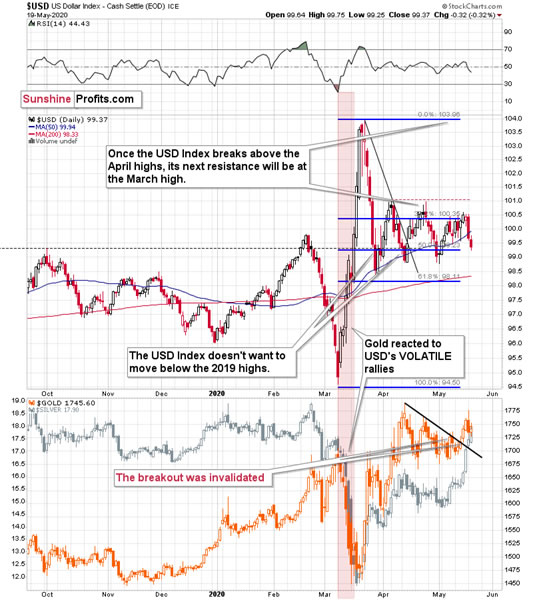
The USDX moved below its 50-day movingaverage (marked with blue) and it closed there for the second day.That’s important, because that’s USD’s fourth attempt to break below thismoving average and confirm the breakdown. The first two attempts took place inlate March and in early April, and the breakdowns were invalidated on the nexttrading day in both cases. The third attempt took place about 3 weeks ago, andthis time the breakdown was invalidated on the third day.
Will this time be different and the breakdown belowthe 50-day MA gets confirmed? We doubt it. The history repeats itself, afterall, and a given pattern remains in place until it is clearly broken. Thistime, it seems that the USD Index will reverse once again, especially given itslong-term breakout. The latter is likely to make the USD Index movemuch higher in the following months (possibly years), not only weeks. Thisdoesn’t mean that we expect gold to decline in the long run, though. We thinkthat a quicker 1-3-week-long decline is in the cards, but nothing more. It’slikely to be significant, though.
The implications of the most recent developments inthe USD Index are bearish for the precious metals market.
As you can see in the lower part of the abovechart, gold moved higher yesterday, but it moved up rather insignificantly. Goldfutures were up by precisely $11.20, which means that they didn’terase Monday’s decline.
Meanwhile in Precious Metals
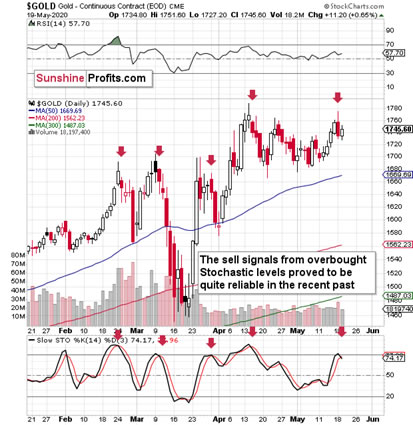
Gold’s unwillingness to react to USD’s bullish leadcan be viewed as bearish. The same goes for the sell signal from the Stochasticindicator. These signals that took place after Stochastic was close to the 80level, were followed by quite visible declines in gold.
Consequently, the implications of yesterday’ssession – and this week’s developments in gold – are bearish.
Then there’s silver that’s soaring like there’s notomorrow and miners that just confirmed their breakout above the previous Mayhighs.
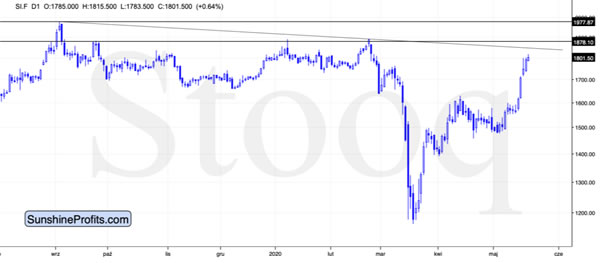
Silver moved higher right after forming the daily reversal and it even moved above the intraday high earlier today. Silver is clearlyoutperforming gold. In case of the goldto silver ratio that’s based on futures, we saw a move slightlybelow 100, and in case of the ratio based on the spot prices, the ratio justtouched the 100 level a few hours ago, and then it moved back up.
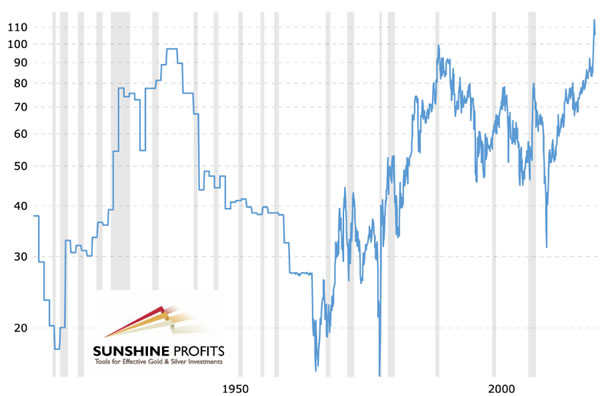
On one hand, the breakout above the 100 level inthe gold to silver ratio seems to have been just verified, and it’s bullish.
On the other hand, silver reversed slightly above$18, which doesn’t correspond to a major resistance level. This means that thewhite metal could still move higher before topping. There are severalresistance levels visible on the previous silverchart – between about $18,50 and about $20. Will silver really moveas high shortly?
If the USD Index is bottoming and the general stockmarket is topping, then the above is very doubtful. In fact, silver’s relativestrength on its own makes the short-term picture for the precious metals marketrather bearish, because silver usually plays major catch-ups with gold in thefinal part of the rally. It definitely happened already and the extent to whichsilver outperformed gold, was clear and loud. Consequently, the top mightalready be in after all, as the 100 level in the gold to silver ratio is moreimportant than any of the above-market individual silver resistance levels.
This leaves us with the bullish implications ofyesterday’s move in the miningstocks.
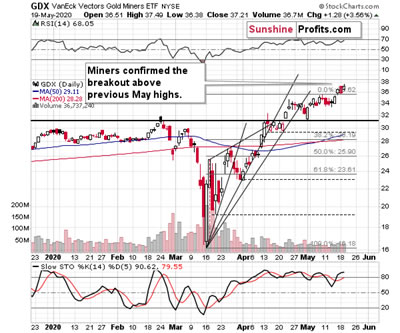
There are two possibilities at this moment. Eitherthe GDX ETF is breaking substantially higher here… Or it’s providing us withfake strength at the very end of the move.
Yes, the link between gold and gold miners is notas straightforward as it seems at first sight. On average, miners do tend to beweak sooner than gold during its rallies. However, there’s also this very finalpart of the upswing, in which miners fake their strength. Let’s take a closerlook at this phenomenon. The chart below features gold and the HUIIndex – proxy for goldstocks.
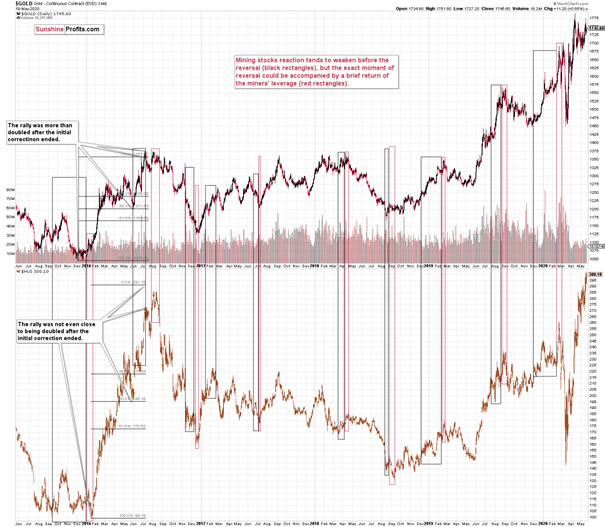
The above-mentioned link works both ways. That’show the 2015/2016 decline ended. Miners underperformed in the first days ofJanuary and this was a fake move. That’s also how the February-March declinestarted – with gold miners’ outperformance. And that’s how many other moves ingold and gold miners have ended.
The black rectangles show periods when gold minersrefused to fully follow gold’s lead, and the red rectangles show when goldminers temporarily multiplied gold’ssignals.
So, is miners’ “strength” really “strength” to thefull extent of this word’s definition? Given all the other points made today,this still seems doubtful.
Thankyou for reading the above free analysis. It’s part of today’s extensive Gold& Silver Trading Alert. We encourage you to sign up for our free goldnewsletter – as soon as you do, you'll get 7 days of free access to our premiumdaily Gold & Silver Trading Alerts and you can read the full version of theabove analysis right away. Signup for our free gold newsletter today!
Thank you.
Przemyslaw Radomski, CFA
Founder, Editor-in-chief
Toolsfor Effective Gold & Silver Investments - SunshineProfits.com
Tools für EffektivesGold- und Silber-Investment - SunshineProfits.DE
* * * * *
About Sunshine Profits
SunshineProfits enables anyone to forecast market changes with a level of accuracy thatwas once only available to closed-door institutions. It provides free trialaccess to its best investment tools (including lists of best gold stocks and best silver stocks),proprietary gold & silver indicators, buy & sell signals, weekly newsletter, and more. Seeing is believing.
Disclaimer
All essays, research and information found aboverepresent analyses and opinions of Przemyslaw Radomski, CFA and SunshineProfits' associates only. As such, it may prove wrong and be a subject tochange without notice. Opinions and analyses were based on data available toauthors of respective essays at the time of writing. Although the informationprovided above is based on careful research and sources that are believed to beaccurate, Przemyslaw Radomski, CFA and his associates do not guarantee theaccuracy or thoroughness of the data or information reported. The opinionspublished above are neither an offer nor a recommendation to purchase or sell anysecurities. Mr. Radomski is not a Registered Securities Advisor. By readingPrzemyslaw Radomski's, CFA reports you fully agree that he will not be heldresponsible or liable for any decisions you make regarding any informationprovided in these reports. Investing, trading and speculation in any financialmarkets may involve high risk of loss. Przemyslaw Radomski, CFA, SunshineProfits' employees and affiliates as well as members of their families may havea short or long position in any securities, including those mentioned in any ofthe reports or essays, and may make additional purchases and/or sales of thosesecurities without notice.
Przemyslaw Radomski Archive |
© 2005-2019 http://www.MarketOracle.co.uk - The Market Oracle is a FREE Daily Financial Markets Analysis & Forecasting online publication.