Rising Gold And Oil Amid Corrections
Dollar intrinsic or intrinsic value analysis is helpful in determining the true value of assets and as a leading indicator.
Higher percentage allocations of precious metals in cash equivalents during times of geopolitical unrest.
Increase gold/metal miners and oil companies to higher percentages due to improved profit margins.
Hypothesis: Dollar intrinsic or intrinsic analysis of a market, the US Dollar being the dominant currency in the global Fiat system, is a way to view the market through a different lens that represents the true worth by including the value of the dollar. The analysis may provide a shortcut to show the real worth, and sometimes is useful as a leading indicator to warn about the future of a market.
Introduction
By observing from the distance and rolling back time, thinking in basics and using data to perform analysis as charts that are visually revealing, are the proper approaches to seek the truth in solving many problems. I think that is the secret to the success of Einstein. I try to tackle the financial markets with the same mindset.
Both bonds and stocks have experienced drastic changes since my last article at the end of January. The escalation of geopolitical events is exerting stress on the stock market. This article serves to address many underlying facts and attempts to project the outlook for gold and oil.
Dollar Intrinsic Or Intrinsic Analysis With Dollar Index
The US Dollar Index (NYSEARCA: UUP) is a measure of the value of the US dollar relative to a basket of foreign currencies.
The intrinsic value of an asset is simply the product of the asset with UUP. Generally, all other assets behave inversely with UUP but to a different degree. The change of individual asset value depends on many other factors. New charts in this article are used to track the trends of the assets; the ability to interpret the charts correctly can lead to investment success.
Estimating Real Inflation
It may be better to relax and broaden the scope about understanding inflation, or general inflation, by considering both asset price inflation, such as stocks, bonds and real estate, and the growth of money as tracked by M3 instead of M2. In this light, the asset price inflation is the sole benefiter of the historic money growth for the past 10 years while keeping consumer prices suppressed by over-production of goods.
The late cycle of money growth effects of rising interest rate, together with increases in rent and wages, likely will transfer higher inflation from asset prices to consumer goods and commodities. Profit for the rich and debt for the poor remain to be the lasting consequence.
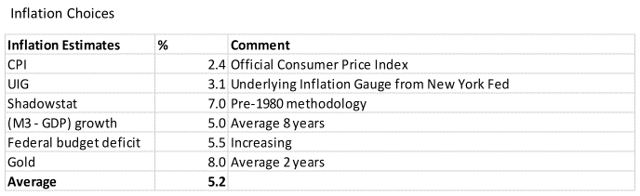
The Underlying Inflation Gauge (UIG) from the New York Fed, using the "full data set" is the most honest government gauge on inflation. Lately, UIG is heading up to 3.1%, which will lead to higher interest rates.
The suggestion above is an estimation of real inflation by averaging many forms of inflation gauges instead of believing the official CPI. The devaluation of the Dollar, which cause higher import prices, can also be regarded as another form of inflation.
Estimating a real inflation figure is beneficial to preserve real worth, by focusing on investments that have higher real returns, such as gold.
Inflation And Oil Price Projection
ROPEC, the merger of Russia and OPEC as the cartel of major oil exporters, marked the dawn of rising oil price for years to come. The new solidarity expressed itself with over 100% compliance of quotas, which was unprecedented in OPEC history. The common consensus of the new cartel is to control supply with the goal of setting the oil price up to the advantage of ROPEC. Pricing power has been transferred from the oil importers to the exporters. The almost certain rise in price of oil will bring about more global inflation that will become more apparent in the coming months.
The situation is improving for oil price. Growth in supply will be weaker than expected mostly because of the lack of capital expenditure for the preceding 3 years. Global demand continues to be strong this year and is projected to increase another 1.5 million BOPD. The start of the driving season is right on schedule and gasoline inventory is falling. These are tailwinds that can carry oil price higher.
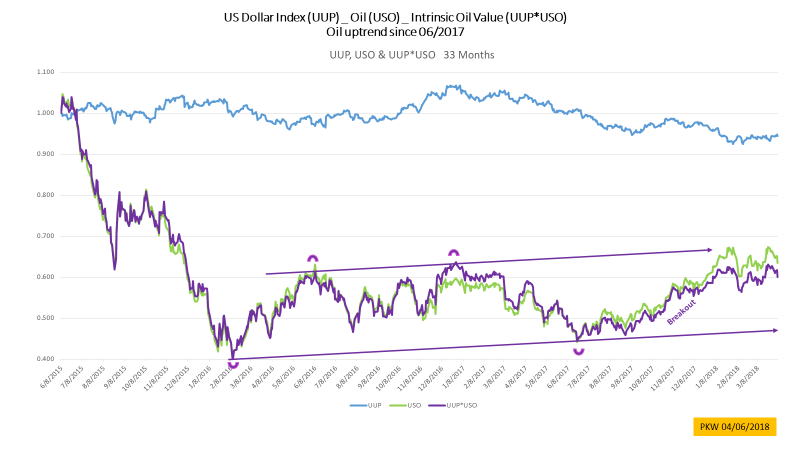
The decline of the dollar is helping the oil price, which is shown as USO. The chart below shows that the uptrend is intact. Dollar Oil, dollar index multiplying oil or UUP*USO in purple color, offers another view representing the real value of oil. The higher lows since June 2017 shows the continuation of the breakout.
Oil company earnings for Q1 2018 will be much better than Q4 2017, because of higher oil prices. Somehow, oil companies have been lagging oil price in performance. Positive earnings surprises will begin in a couple of weeks to propel the stock price of oil companies.
Merger and acquisition opportunities should be considered by every oil and gas company. Now is the best of times after the emergence from the low. Profitability instead of the antiquated notion of reserve growth should have been the primary goal for the executives. The industry suffered many years of poor returns because of the misguided emphasis by over-producing.
Recently, a major's announcement of increased production was met with a quick punishment of the stock price, which illustrated the point above. Company reserve and production growth are best served by acquisition. Due to the decimation of stock prices of many companies, especially the major gas companies, some offer huge potentials as acquisition targets at this off-season time.
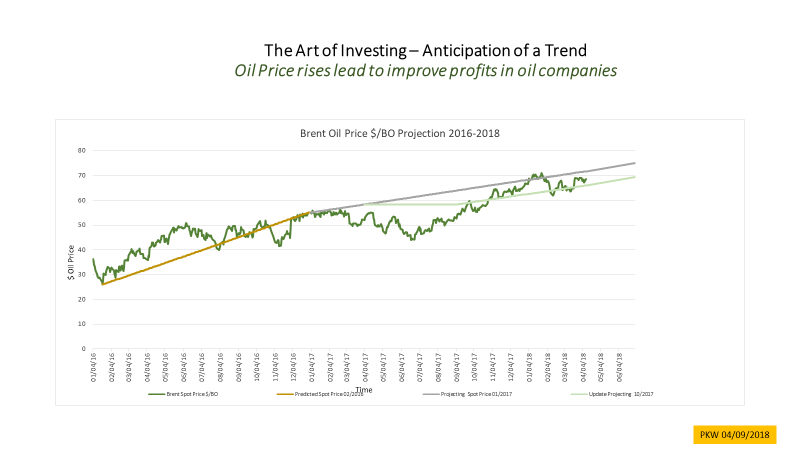
My prediction on the oil price started 27 months ago with the first published article, opposing the views of the investment banks. My opinion on oil price has been consistent and optimistic. The following chart serves as a good way to track the oil price towards July 2018. Most likely the oil price will be closer to the upper bound of the prediction.
Debt And Interest Rates
The national debt surpassed 21 trillion, with the last trillion added in just 6 months. The unpalatable record seems to repeat itself in the future. The budget deficit is rising towards $1.2 trillion by 2019. There is a huge increase of new treasury bonds offering this year to fund this deficit. Ultimately, the bond buyers will dictate and demand ever higher interest rates. Rapid increase in national debt will shake the faith and confidence of the bondholders and will affect the dollar negatively in due course.
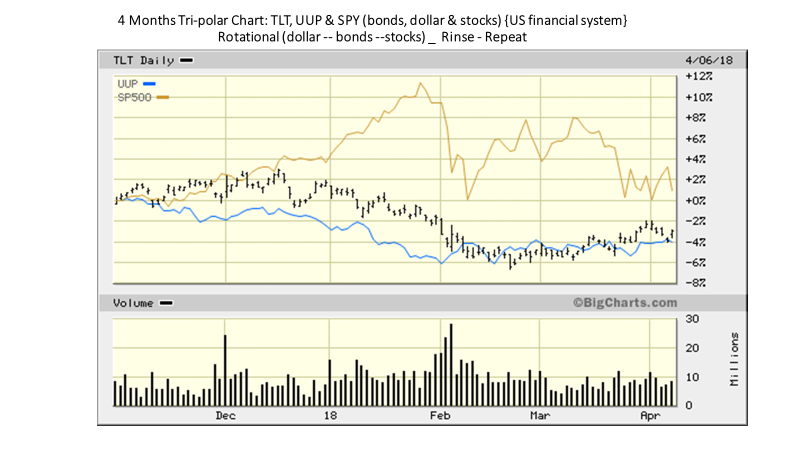
The tri-polar chart below consists of bonds, dollar and stock, as represented by TLT, UUP and SPY. Each of these items as pillars of the financial system behaves somewhat inverse to the others. The stock peak in January was reversed by prolonged weakness in the dollar and long-term bond. When the stock dropped, the dollar bounced from the low and has been trading in a range. The recent weakness in the stock caused some flows to the long-term bond. The chart is useful in seeing the relations and changes of the items.
Stock Market Overvaluation
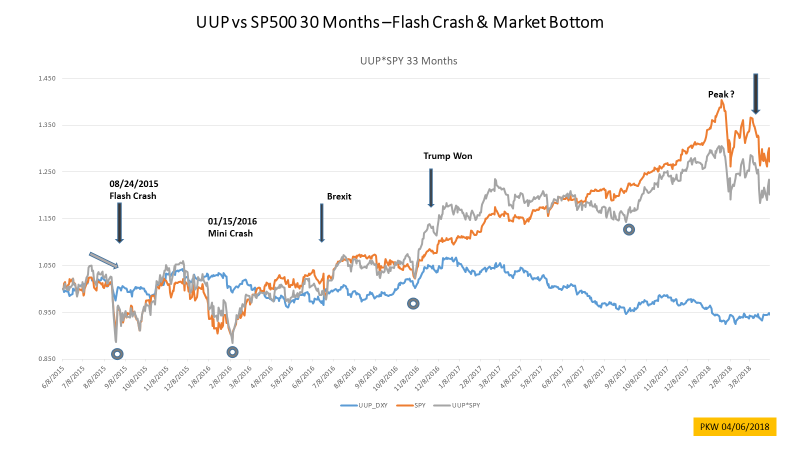
The major stock market indexes have declined about 10% from the peak, with SPY in orange, which represents the S&P 500. But according to the Dollar S&P5 00, UUP*SPY in the gray color line above, the real value of the stock market is ascending less because of the dollar's loss in value.
For the past 50 years, each of the stock bear markets was preceded by rising interest rates and/or a falling US dollar, both are occurring currently. These conditions are the cumulative effect of excess in money printing together with budget and trade deficits; the entire set-up is deteriorating for stocks. Tracking the Dollar S&P 500 is becoming more meaningful in times of the falling dollar.
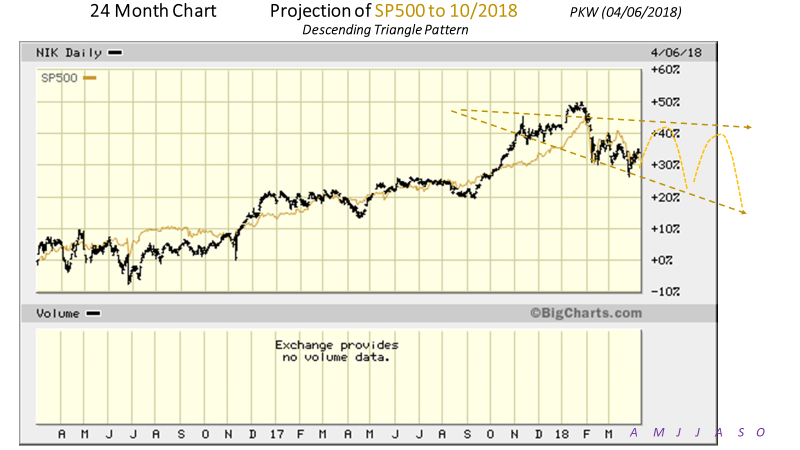
The stock market most likely reached the peak back in January, when rising interest rate spurred the bubble. The latest developments have been negative, such as increasing budget deficit, reduction of liquidity growth rate from central banks, Fed hikes and rising Libor, declining FANG, reduction in revenue and earnings estimate, leading indicators are turning downward and inflation heating up with oil and wages. Adding in the uncertainty of the mid-term election in November, the stock market will likely perform poorly in a descending triangle pattern with a 2-month period as shown below.
Bond Market Overvaluation
The vicious cycle began at the height of global monetary growth, at the lowest point of negative interest rates and when the long-term bond was at the peak back in July 2016. Prolonged quantitative easing (QE) caused financial assets such as bonds and stocks to inflate, while laying the seed of subsequent asset deflation. Over the course when easing is transitioning to tightening, interest rates start to rise, and the virtuous process is reversing itself.
Long-term treasury bond prices, being the most sensitive, was the first to decline. The downtrend since then spread to intermediate term, short term, corporate, junk and international bonds of all kinds. All bonds are being negatively affected and the slides have a long way to go, unless there is another round of coordinated global QE after the next crisis. Rising interest rates will incur bond losses. These losses will become more severe as the assets are marked to market and written down in the coming years. It is a good time to flock to other real assets that will increase in value despite inflation.
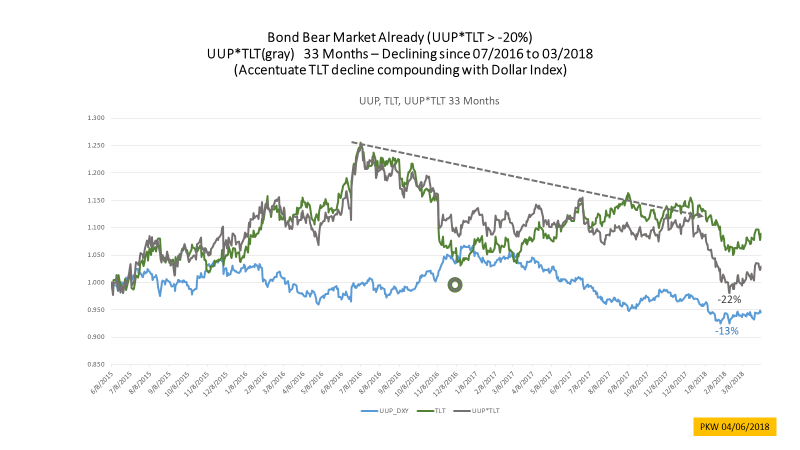
The long-term treasuries, TLT, being the most sensitive to interest rates changes, in green color peaked in July 2016 and is in a downward trend. The intrinsic value which is the Dollar TLT, UUP*TLT in gray color, declined more.
Although TLT bounced back up lately because of the weakness in stocks, the rise of Libor to 2.3% from the low of 0.3% in 2016 is of great concern because Libor is related to the interest rates of most of the global debt, especially the short-term ones. The six-fold increase in forward interest payment within two years surely will affect corporate profitability negatively. Libor movements should be watched more closely instead of the hikes from the Fed, which may be merely following the increase in interest rates of all bonds.
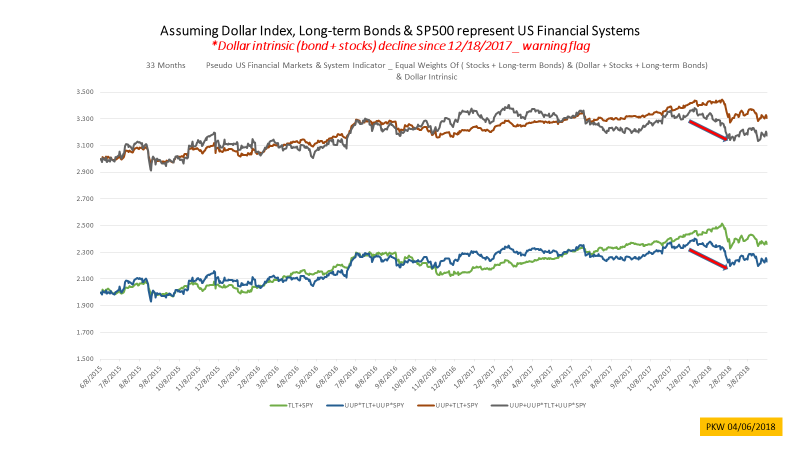
The chart below shows the 33 months' performance of the intrinsic values of the dollar, long-term bond and stocks. The intrinsic analysis revealed interesting results that not only all the markets peaked, some have declined to bear territories. The long-term bond in gray color peaked in July 2016 fell -22% when the dollar is included. The blue color UUP, which is the dollar, peaked in January 2017 and slid 13%.
Generally, the Dollar index is inverse to other markets by a factor of two, or -2X. Dollar index being relative to other currencies, mostly oscillates between 75 and 125 or a range of 50, a 10% fall can be regarded as a 20% drop in other markets. So, the dollar can be thought of being in bear territory too. Being labeled as bear territory is just a benchmark to be aware of.
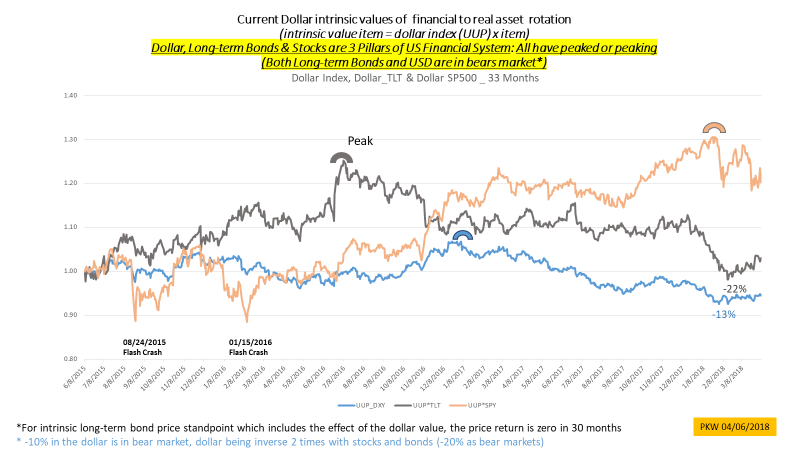
The dollar, long-term bond and stock can represent the US financial system as a simplified system indicator in the chart below. By adding these indexes together with equal weights, we can observe both the nominal and intrinsic values of this indicator. The same can be done to the long-term bond and stock, their sum can be treated as a simplified market indicator. The intrinsic values of the system and market, in gray and blue, showed weakness and started to decline in December 2017, a month before the peak of the stock market. This chart can be useful to gauge the strength of the overall markets and as a leading indicator for stocks or bonds.
Gold And Miners
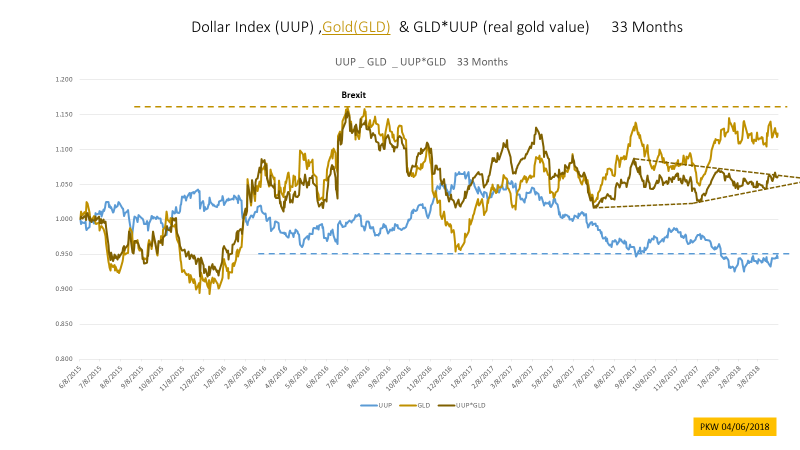
Gold is anti-fiat and anti-stock. Gold is an ideal asset for diversification from stocks and bonds, especially in times of elevated tension such as Brexit 2 years ago.
With bonds going down because of rising interest rates, gold offers a much better future investment profile. Gold has been on a sustained uptrend in the past 2 years and began to accelerate since July 2017.
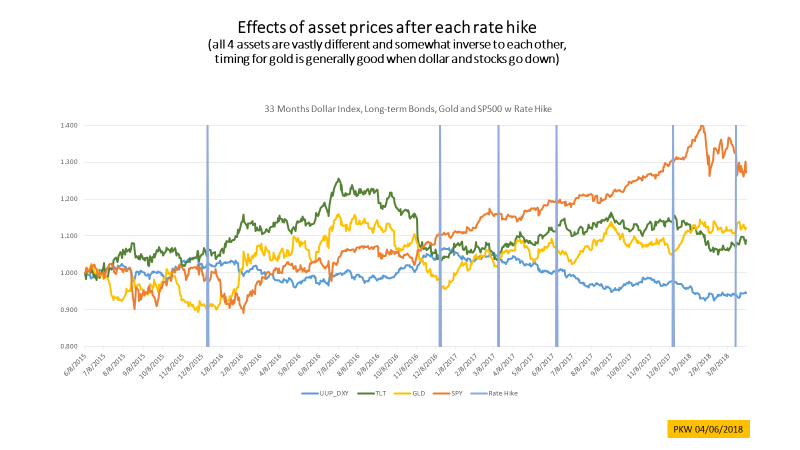
The above chart illustrates the performance of each asset after the Fed rate hike. Each time gold rises nicely.
Escalation of geopolitical tensions and trade wars are positive for gold, when countries protect themselves from currency risks. Many central banks began to accumulate physical gold since 2009 as reserves replacing fiat currencies. This trend will expand further.
The chart below shows that the intrinsic value of gold, in dark brown color, forms a consolidating triangle. Timing appears to be favorable for a breakout in gold for the next 2 months.
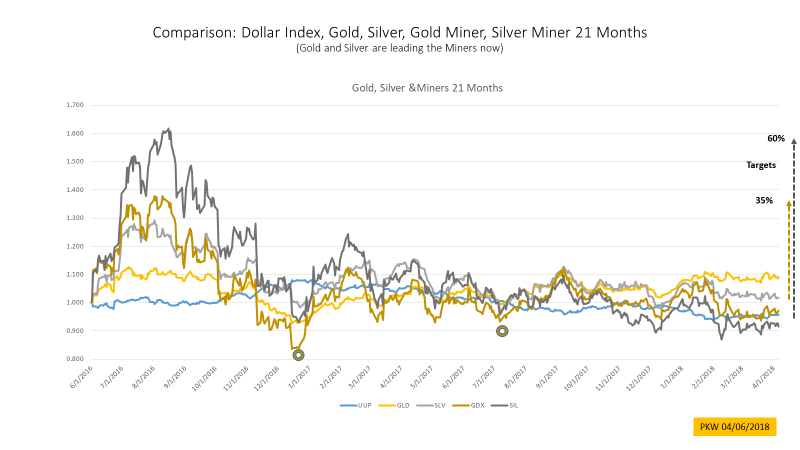
Gold miners have been lagging gold in performance in the past 12 months.
Miners are very profitable at today's gold price. Gold miners' profit will show an improvement of $40 per oz over the previous quarter. The average price of gold is about $1330 in 1Q2018.
The chart below anticipates the potential target for a gold miner. Silver miners will have a bigger potential target if the silver price regains the same high of 2016. Both gold and silver miners trailed the performance of gold widely since January 2018. If gold can break above $1380 per ounce, the miners will catch up to and surpass gold again like 2016.
Conclusion
My anticipation for the rest of 2018 are as follows:
The dollar will start to drift slowly down to 86 by the end of 2018. Bonds will decline throughout 2018. 10-year Treasury will reach 3% before 06/30 and 3.75% by 12/30. Stocks - volatility resumes and forms a descending triangle with a flat top for the next 6 months with the last peak on 01/2018. Gold will break to a new high since 2016 in passing the last peak at $1380 by the end of June 2018. Oil - Brent will reach $75 by the end of June 2018
**The above opinions are for discussion and education purposes only, and not intended for any investment advice.
Disclosure: I am/we are long XLE, GDX.
I wrote this article myself, and it expresses my own opinions. I am not receiving compensation for it. I have no business relationship with any company whose stock is mentioned in this article.
Follow Paul Wong and get email alerts