Stocks Enter the Week at "Must-Bounce" Levels
 SPY rallies back to the freshly broken Fed-day closing levels could be met with selling
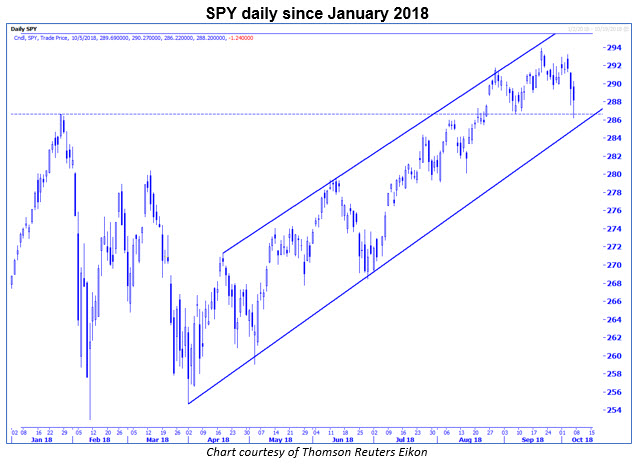
"Amid the current sentiment backdrop and on the heels of last week's monetary policy decision, there would appear to be slightly more risk than reward in the market's short-term status... on the eve of the FOMC's announcement, the SPY closed at $290.75, and on the day of the announcement it closed at $289.88... these FOMC-day closing levels have typically marked resistance in the immediate aftermath of a rate hike. Therefore, if the SPY retreats significantly below this area in the weeks ahead, it is probable that future rally attempts could be halted in the $290 area, which coincidentally aligns with the round 2,900 level on the S&P 500 Index (SPX - 2,913.98)."
-- Monday Morning Outlook, October 1, 2018
As I've observed in this space, the equity market was facing an uphill battle from multiple perspectives going into last week's trading. The blackout period for buybacks ahead of earnings season was one hurdle, especially with buybacks being a major supportive factor for equities during the past few years. Plus, the Federal Open Market Committee (FOMC) had just raised the fed funds rate, which has been a poor time to be in stocks in the following month since the rate-tightening cycle began in December 2015.
What's more, short-term equity option traders -- who have been wrong at various pivot points in the stock market -- were displaying optimism on equities, just as major equity benchmarks were battling psychological round numbers simultaneously. Those major benchmarks include Nasdaq Composite (IXIC - 7,788.45) 8,000, S&P MidCap 400 Index (MID - 1,967.99) 2,000, Russell 2000 Index (RUT - 1,632.11) 1,700, and S&P 500 Index (SPX - 2,885.57) 1,900.
Throw in a surge in the 10-year interest rate to multi-year highs last week and growing probabilities of at least three rate hikes next year, and the short-term overbought condition of equities was finally resolved by a sharp sell-off last week.
"A support level if the SPY retreats is the January high in the $286 area, and further support from a channel line connecting higher lows since March is at $284. In other words, there is major support from $284 to $286 going into this week's trading. This area is equivalent to 2,840 and 2,860 on the SPX, or around the 2,850 half-century mark. If this area breaks in the weeks ahead, we could see a surge in volatility, as the 'wrong-way' Commitments of Traders (CoT) large speculators are still net short Cboe Volatility Index (VIX) futures."
-- Monday Morning Outlook, October 1, 2018
$RUT & $MID at 200-dayMA's as $SPY retests Jan'18 high
- Todd Salamone (@toddsalamone) October 5, 2018It will be critical for the indexes to mount a bounce this week, as they come into the week at support levels that, if broken, could generate sell-offs like we saw in February and March. Friday's RUT low was the site of its January 2018 high and its 200-day moving average, which is just above the round 1,600 level. The MID low on Friday was also around its 200-day moving average and just above the 1,950 half-century mark. The SPDR S&P 500 ETF Trust (SPY - 287.82) low was around its January 2018 high at $286, and well above the channel line that I discussed last week. In other words, stocks bent last week, but didn't break.
$VIX 16.27 is 50% above the 8/8 closing low of 10.85. Looks like volatility sellers came in when it approached this area.
- Todd Salamone (@toddsalamone) October 5, 2018$VIX closing high last year was 16.04. Brief move above this level earlier today, but back below. Similar action to August 15th but concern for bulls is the huge Lg Spec short position on $VIX futures
- Todd Salamone (@toddsalamone) October 5, 2018
Volatility, as measured by the Cboe Volatility Index (VIX - 14.82), surged to a three-month high. Per the chart below and comments I have made occasionally during the past few weeks, the Commitments of Traders (CoT) reports showing that large speculators are in an extreme net short position on VIX futures has been a risk factor for bulls, as this group has long been on the wrong side of major volatility moves for years.
VIX futures are less sensitive to VIX movement, so there wasn't major pain experienced last week, but if the VIX takes out the levels that I tweeted about on Friday and 18.66 -- half the 2018 closing high -- it could be indicative of volatility heading higher in the weeks ahead. That said, I don't expect to see a volatility event like we witnessed earlier in the year, as total open interest in VIX futures positions is 35% below the level of early 2018.

Friday's rally off support was encouraging. But keep in mind that now that we have had a significant break of the SPY FOMC-day closing levels in the $290 area, any rallies back to this area are likely to be met with selling into the end of the month.
Continue reading:
Indicator of the Week: S&P Win Streak Stats Bode Well for BullsThe Week Ahead: Walgreens, Big Banks to Report Earnings Next Week