Trade War and Silver CoT - Details and Implications / Commodities / Gold and Silver 2018

 Goldsoared by the end of the week. Miners didn’t – the HUI didn’t even move abovethe previous March highs. Silver’s performance was rather mixed, but closer tothe one of miners than the one of gold. Why did gold rally? Why didn’t minersrally? How can the silver CoT numbers help in this case?
Let’sstart with the first question. Why did gold rally in the final part of theprevious week? The first reason was likely the increased tension regardinginterest rates and Powell’s first Fed meeting. This was likely to cause onlytemporary volatility and it seems that it did. Based on how mining stocksperformed relative to the gold market, it certainly seems that the preciousmetals market wants to go down. But, there’s another fundamental developmentthat triggered another rally in gold (to a smaller extent) – the trade war.This term is too far-fetched – it’s just a trade battle for now. Let’s focus onthe practical implications for the precious metals market. In short, just likea few threats between the U.S. and NorthKorea,the trade tensions between the U.S. and China are a geopolitical event.
Unlessthe conflict escalates further (and we doubt it), the impact on prices islikely to be only temporary, just like it is the casewith geopolitical events in general. The way the price moves fromhere will depend on two factors: one is based on the way the investors want toreact and the second is based on how the safe-haven factor comes into playbased on the escalation of the trade conflict. The former is something that wecan predict based on the charts and the latter is something that we cannotpredict based on the charts and that depends on individual political decisions.
Thelong-term factors present on the charts are not easily manipulated byshort-term developments like the recent news and they don’t feature anychanges. The outlook remains clearlybearish.
Theshort-term factors present on the charts can be impacted by the fundamentalissues, but that doesn’t make the short-term chart analysis worthless. Most ofthe time, the situation develops unaltered and if it is altered – by importantnews, like it was the case last week – the price path changes from somethingthat was determined by the previous price moves to what is determined by theprice moves that include the news-based moves. In other words, technicalanalysis, cycles and so on do not become useless, once something beyond themmoves the market. They simply work in adifferent way. It’s clearly visible on the goldchart below (charts courtesy of http://stockcharts.com).
Gold’sRally and Price Patterns
Wepreviously had a situation, in which gold was likely to decline and probablybottom before the end of the month. We also described a triple-top and an extraupswing pattern and we discussed how it was similar to what we had seen in thepast.
Didany of the above become entirely invalidated based on last week’s upswing?
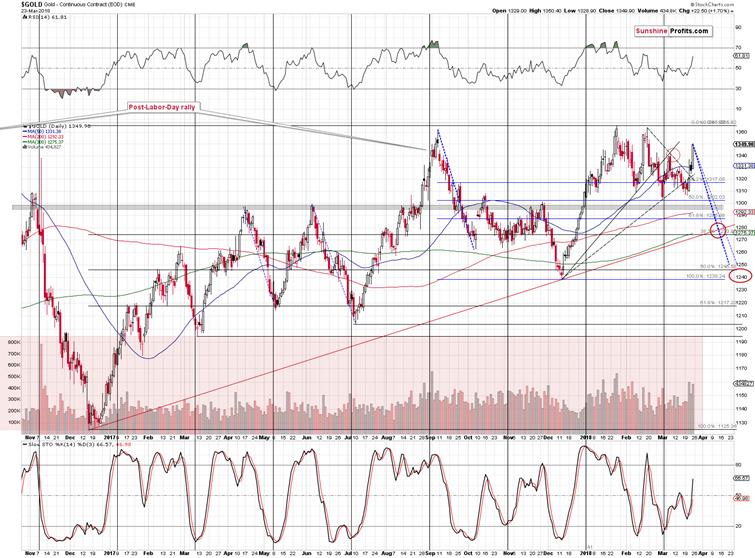
No.As far as the triple-top formation is concerned, it seems that the current top(the one that’s likely forming) is the third one and the early-March top wasnot a part of the formation at all. The analogy remains intact, although in aslightly different shape.
Therally didn’t change the apex-based turning points and it didn’t change the factthat the shapes of the declines are often similar. The only thing that changedis the starting point of the decline. Interestingly, if the price pf golddeclines as it used to decline in the past – in approximately the same way –then we can expect it to reach the rising red support line in the first half ofApril. That’s in perfect tune with the apex-based turning point. Based on thelatter, we expect the next turnaround tobe close to April 9th, which is more or less in tune with theshape of the decline.
Consequently,while the situation is no longer likely to develop in tune with earlier expectations,the price level that we described previously is still likely to be reached –only a bit later. Both mentioned techniques that we described earlier remainup-to-date – their implications are simply adjusted based on the newestinformation.
Long-termResistance Ahead
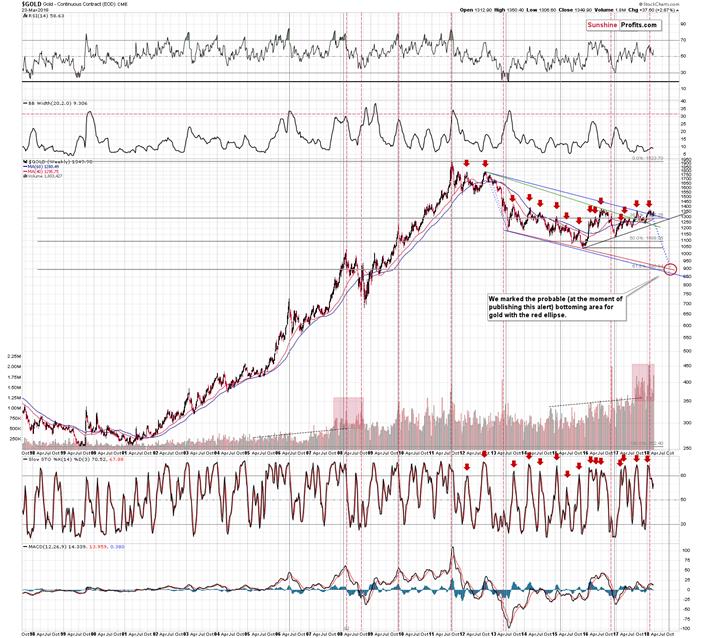
Gold’svery long-term chart shows that even though gold moved higher, the upsidepotential from here is very limited. Multiple previous rallies ended close to$1,350 - $1,360, so the resistance is very strong. We read a few analyses thatsuggested that gold was on a verge of breakout, but please keep in mind that itis very unlikely that any breakout will be confirmed. It’s more likely that itwill not be seen at all. The authors of the bullish analyses suggest that theproximity of the previous highs is the factor making a breakout somethinglikely.
Whileit’s obvious that it’s closer to a breakout with gold at $1,340 than at $1,200,just because gold is below an important resistance is not a reason for one to expect a move above it. Conversely, by thevery definition of what resistance a level is, one should be predictinga decline in gold if the price movesnear to it. That is, until we see a confirmed breakout and we definitelyhaven’t seen one.
SilverReversal in the Making
Inthe case of silver, the situation didn’t change much.
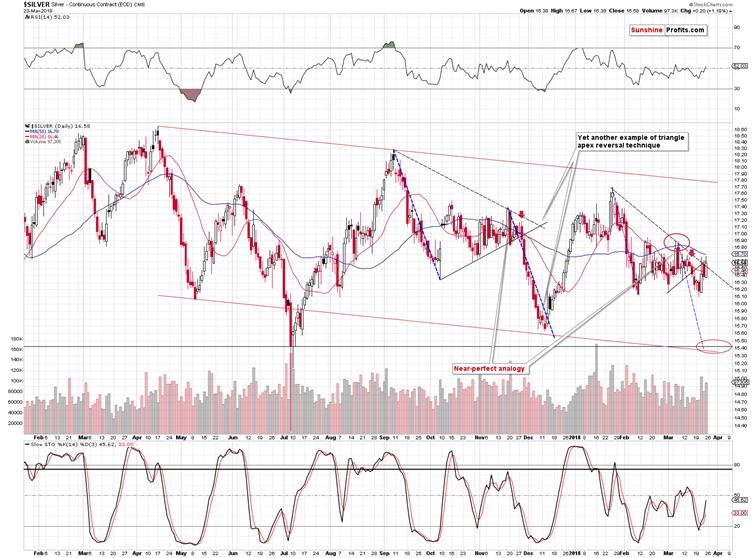
Thewhite metal moved higher on Friday, but the rally was not particularlyspectacular. Silver moved only insignificantly above the Wednesday’s intradayhigh and closed the session very close to the apex of the triangle – below therising short-term resistance line. Speaking of the apex of the triangle – it’sindicating a reversal and the apex isright in the middle between Wednesday’s and Friday’s highs. Consequently,it currently serves as a perfect bearishsignal.
SilverCoT – Really Important?
Beforemoving to mining stocks, we would like to reply to a few questions that we justreceived. Every now and then we are requested to comment on the CoT reports asthey continue to be viewed as a very important tool in determining preciousmetals prices. Just as often, we explain that in our opinion, the usefulness of the CoT reports is overestimated asthere are many other indicators for PM prices that appear more useful indetermining the precious metals’ direction, for instance the RSI.
Agood indicator should have a trading range that’s rather stable and signalsthat are followed by similar action. The former is mostly missing, and thelatter is not coherent.
Let’stake the silver CoT as an example and let’s use CoTLarge Speculators as a proxy for the entire report’s data.
Let’sstart with the big picture, so that we can determine the buy and sell zones.
Whatwas the buy zone? Based on the 2007 – 2012 data, one might think that it’s thelevel of 20,000 contracts as that was when silver’s price reversed. But no –this level didn’t stop silver in 2012 and in the following years. So maybe theinteresting level was about 5,000 contracts as the 2012 bottoms suggested. Nope– the amount decreased below it in mid-2013 and so did the price of silver. Thenumber finally reached about 0 in 2013. “That must have been the true bottom” –the CoT followers stated. Oops – 5 years later and silver is still well belowthe level that it reached in mid-2013. It was about $20, so the white metal iscurrently more than $2 below it.
Beforecontinuing the above discussion of support levels for the number of largespeculators’ positions… You know what else is interesting? The largespeculators’ position in light of silver’s powerful rally in 2010 and 2011.
Ingeneral, if silver’s price goes up, the large speculators’ position goes up. Ifsilver’s price goes down, the large speculators’ position goes down. When thelarge speculators’ position gets to/above a certain level it, becomes overboughtand indicates a downswing and if it gets to/below a certain level, it becomesoversold and indicates an upswing.
Niceand simple, right? The problem is thatthere is no “certain level” during both up- and downswings. You alreadyread about the difficulty regarding the overbought/support levels in theprevious paragraph. The same goes for the overbought/resistance level. The 2016and 2017 levels were well above the previous maximums and using the previousreadings would have generated incorrect signals.
Butthat’s now that main point. The main point is that the entire link broke down during the biggest upswing of the past decade.The large speculators’ position rallied according to the general “rule” and…More or less in the middle of the upswing, it started to decline. The large speculators’ position became totallyuseless in predicting the final top for the rally. If that was the caseduring the key rally of the past decade, then should you really trust this toolwhen it comes to timing the details of the key decline of the decade? It seemsthat we are in the early stage of this kind of movement, so should one reallybother with looking at the CoT numbers, which could be useful… to a point afterwhich they could provide the opposite of useful signals? The way situationdeveloped in 2010 and 2011 should make you really doubt the CoT numbers’usefulness in the following months.
Naturally,the entire previous paragraph assumes that the current price regime isdifferent from the previous months’ back-and-forth trading. If only we had seensomething suggesting that this situation is different than everything else thatwe saw in the past 10 years.
Ohwait, we did.
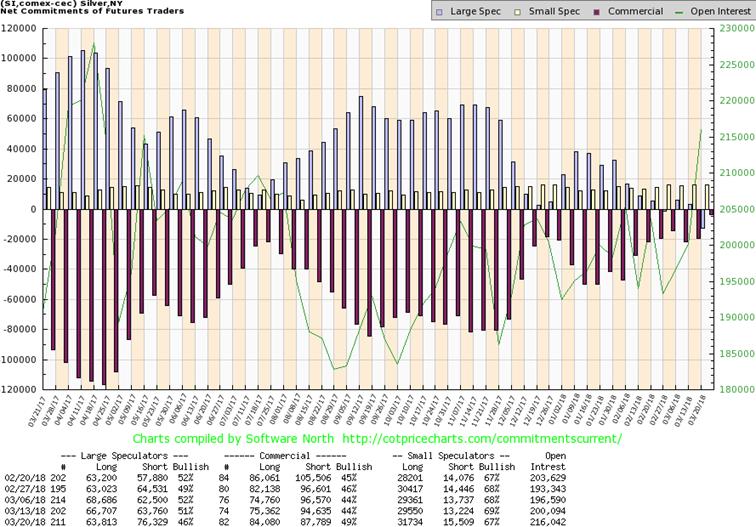
Thelarge speculator’s position just moved below 0, which indicates a new dataregime. In other words, we saw a breakdown in the number of positions of largespeculators, which suggests that… Well, they will move to a new low – butnobody knows what this low would be. That’s the smaller problem, though.
Thebigger problem is that if silver is starting its major – final – decline, then we might not be able to trust the CoT dataat all, just like one shouldn’t have trusted it in 2010 and 2011.
Takingboth factors into account makes any bullish implications of the above chartsrather insignificant at this time.
Bythe way, did you notice how the analyses that discuss the CoT data are almostalways focused on short- or (in the best case) medium term? If you feature thebig picture, you see how incoherent the implications are and why this toolshould be used at best as something that confirms other types of analysis andnot on a stand-alone basis.
GoldStocks: What Rally?
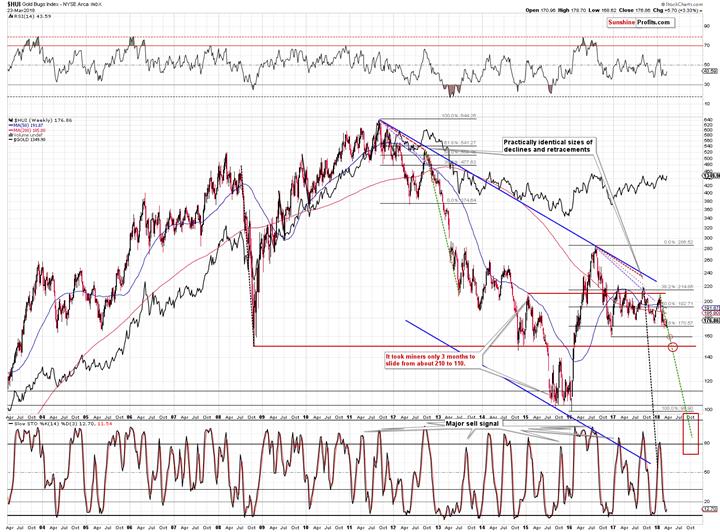
Movingon to the gold stocksshares,if you hadn’t been looking at the market last week, hadn’t heard that there wasa rally in the precious metals sector and you looked at the above long-termchart, what would you say? Most likely something like “what rally?”. Indeed,the upswing is almost invisible from the long-term perspective, which is aclear sign of medium-term underperformance and an indication that the recentupswing in gold is rather accidental – not a true direction in which gold isgoing to move.
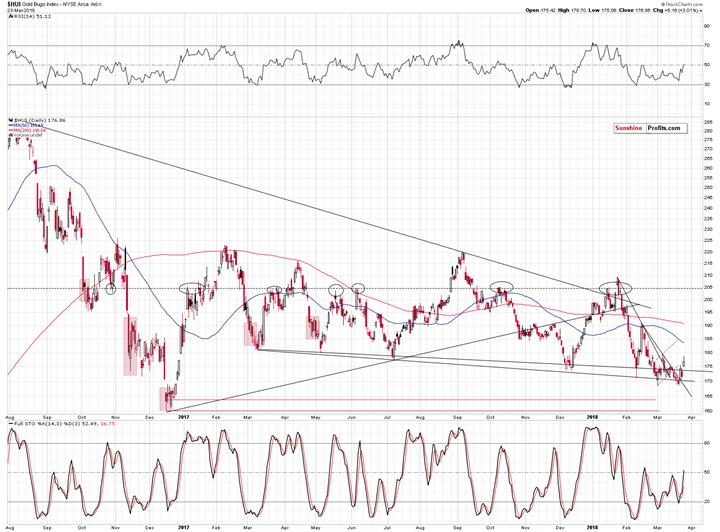
Indeed,gold stocks didn’t manage to move even to the early-March high in terms of boththe intraday extreme and closing price. Gold moved quite close to the previous2018 high and mining stocks are barely a few index points above the Februarylow. The underperformance is truly striking.
Wepreviously wrote about each corrective upswing in gold stocks being smallerthan the previous one – this pattern remains intact.
Somemay say that gold stocks’ weak performance is not really a bearish sign,because it’s only a consequence of the declining stockmarket.
Theremight be some truth to it, but it doesn’t explain the whole story. The generalstock market might have prevented the HUI from moving above 200, but only to185 – 190. The gold stocks’ performance was much weaker than just that – theHUI wasn’t even able to move above 180, let alone close there.
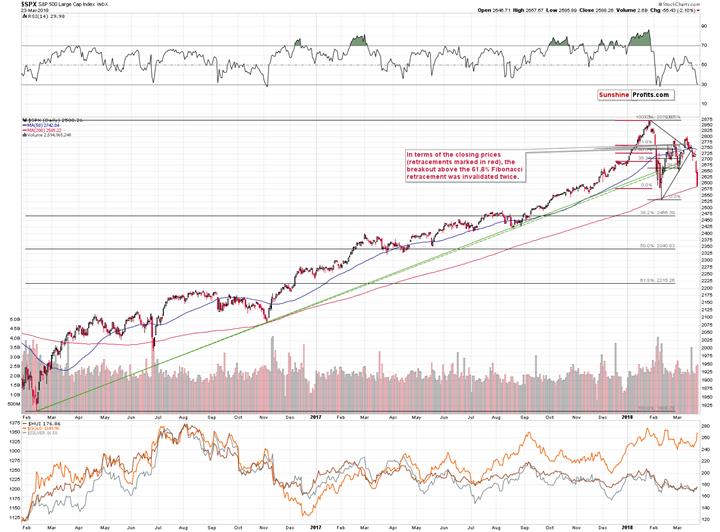
TheS&P 500 Index closed more or less where it had closed on February 8th,so by measuring gold’s and gold stocks’ prices back then and now, we canapproximately check what the relationship between the two is without thegeneral stock market’s impact.
OnFebruary 8th, gold closed at $1,319 and the HUI closed at 178.39.Yesterday, gold closed at $1349.90 (it seems that the real price was severaldollars lower, but this doesn’t change anything here) and the HUI closed at176.86.
Giventhe relatively unchanged stock market, we have gold that’s about $30 lower andthe HUI Index that is about 1.5 index point lower. That’s extremeunderperformance and incredibly strong bearish sign for the medium term.
Bythe way, please note that the above chart shows yet another example of an apex-basedreversal.The tiny move that we saw on March 16th that took place at the apexwas in fact the final reversal before the slide.
Summary
Summingup, gold moved higher on increased geopolitical tensions (possible trade warbetween the U.S. and China), but it doesn’t seem that it changed the currentmedium-term trend, which remains down. The extreme underperformance of miningstocks clearly suggests that the main trend was not changed, and silverstriangle-apex-based reversal suggests that the rally is already over or aboutto be over. All in all, the outlook for the precious metals sector for thefollowing weeks remains bearish.
If you’d like to receive follow-ups to the aboveanalysis, we invite you to sign up to our gold newsletter. You’ll receive ourarticles for free and if you don’t like them, you can unsubscribe in just a fewseconds. Signme up!
Thank you.
Przemyslaw Radomski, CFA
Founder, Editor-in-chief
Toolsfor Effective Gold & Silver Investments - SunshineProfits.com
Tools für EffektivesGold- und Silber-Investment - SunshineProfits.DE
* * * * *
About Sunshine Profits
SunshineProfits enables anyone to forecast market changes with a level of accuracy thatwas once only available to closed-door institutions. It provides free trialaccess to its best investment tools (including lists of best gold stocks and best silver stocks),proprietary gold & silver indicators, buy & sell signals, weekly newsletter, and more. Seeing is believing.
Disclaimer
All essays, research and information found aboverepresent analyses and opinions of Przemyslaw Radomski, CFA and SunshineProfits' associates only. As such, it may prove wrong and be a subject tochange without notice. Opinions and analyses were based on data available toauthors of respective essays at the time of writing. Although the informationprovided above is based on careful research and sources that are believed to beaccurate, Przemyslaw Radomski, CFA and his associates do not guarantee theaccuracy or thoroughness of the data or information reported. The opinionspublished above are neither an offer nor a recommendation to purchase or sell anysecurities. Mr. Radomski is not a Registered Securities Advisor. By readingPrzemyslaw Radomski's, CFA reports you fully agree that he will not be heldresponsible or liable for any decisions you make regarding any informationprovided in these reports. Investing, trading and speculation in any financialmarkets may involve high risk of loss. Przemyslaw Radomski, CFA, SunshineProfits' employees and affiliates as well as members of their families may havea short or long position in any securities, including those mentioned in any ofthe reports or essays, and may make additional purchases and/or sales of thosesecurities without notice.
Przemyslaw Radomski Archive |
© 2005-2018 http://www.MarketOracle.co.uk - The Market Oracle is a FREE Daily Financial Markets Analysis & Forecasting online publication.