December 04, 2023
All-Time Highs
Author - Ben McGregor
Gold reaches all-time highs
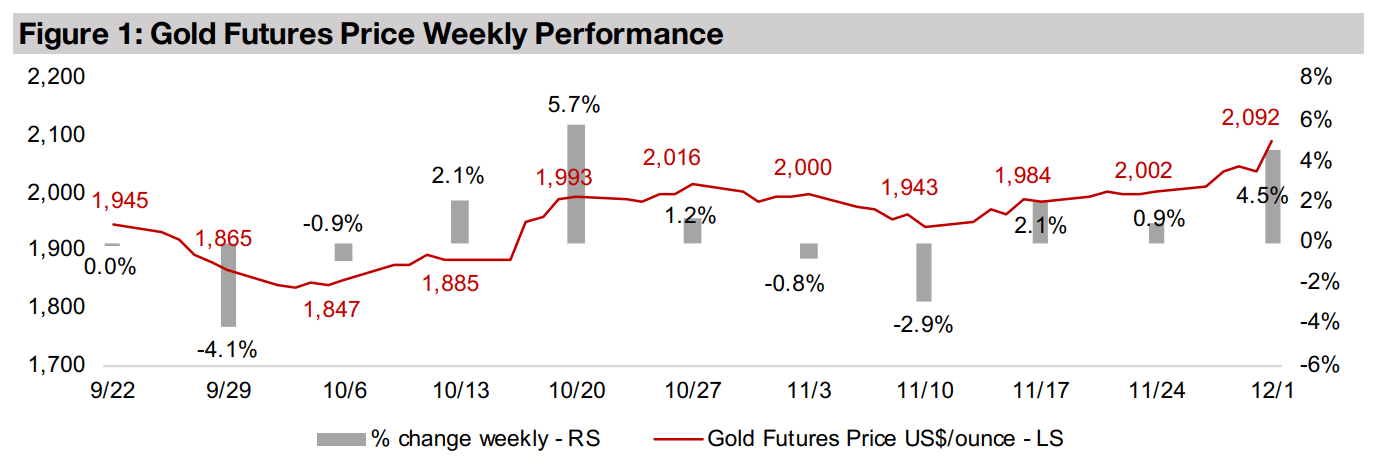
The gold futures price rose 4.5% to US$2,092/oz, and the spot price hit US$2,071/oz, breaking through to all-time highs, as comments from the US Fed Chairman this week led to a sharp increase in market expectations for rate cuts by mid-2024.
WB gold price underestimation and TSXV and TSX mining trends
This week we look the World Bank’s consistent underestimation of the gold price in recent years and monthly trends in the TSXV and TSX mining sectors to October 2023, showing sliding market caps but with equity capital raised still reasonably strong.


All-Time Highs
The gold futures jumped 4.5% to US$2,092/oz, and the spot price hit US$2,071/oz,
reaching all-time highs. This was driven by comments by the US Federal Reserve
Chairman that the market took as indicating that the central bank was done with rate
hikes. The market now sees a high likelihood that that rates could decline by mid-2024, with the odds for a cut by March 2024 at 45% and by May 2024 at 75%. The
larger US markets saw only muted gains, however, with the S&P 500 up 0.9% and
Nasdaq gaining 0.46%, some of this good having already been priced in during the
November ramp up. Also, both these expected rate cuts and the high gold price imply
a weakening economy into next year, which would be negative for equities.
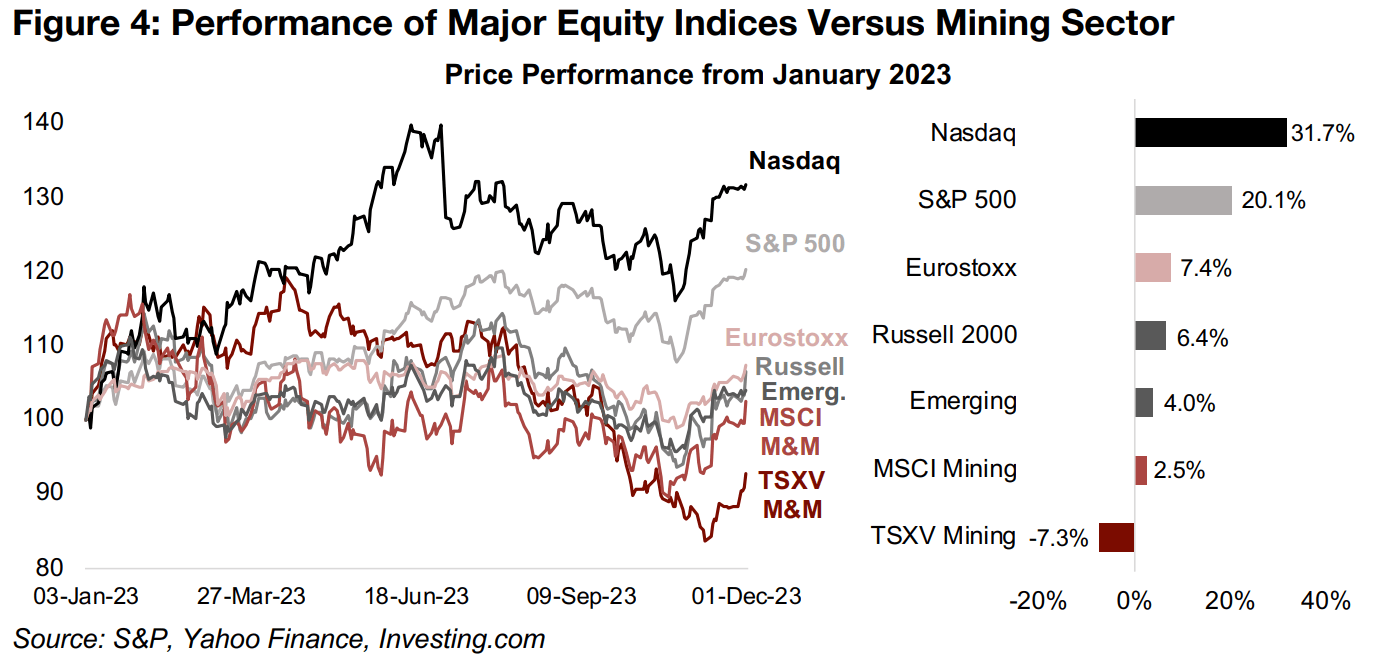
Gold stocks gained on the metal’s rise, with the GDX ETF of gold producers up 8.5%,
far outpacing muted gains in the S&P 500, and the GDXJ ETF of gold juniors rising
10.0%, with support from a rise in broader small caps, with the Russell 2000 Index
up 3.4%. However, year to date, small caps have underperformed, with the Russell
2000 up 6.4% compared to a 31.7% gain for the Nasdaq and 20.1% rise for the S&P
500 (Figure 4). These two major US markets stand out as an anomaly globally, with
European and emerging market stocks only seeing mid-single digit gains this year.
Mining stocks have underperformed the wider equity markets year to date, with the
MSCI Global Metals and Mining ETF up just 2.5% in 2023 and the S&P/TSXV Metals
and Mining Index down -7.3%. While the gold price has performed well this year, up
14.2%, many other metals, including major base metals, have struggled, and dragged
down these indices. The differences in these indices and sector ETFs year to date
aside, November 2023 saw a substantial rebound for all of them.
Will gold finally break out of a four-year trading range?
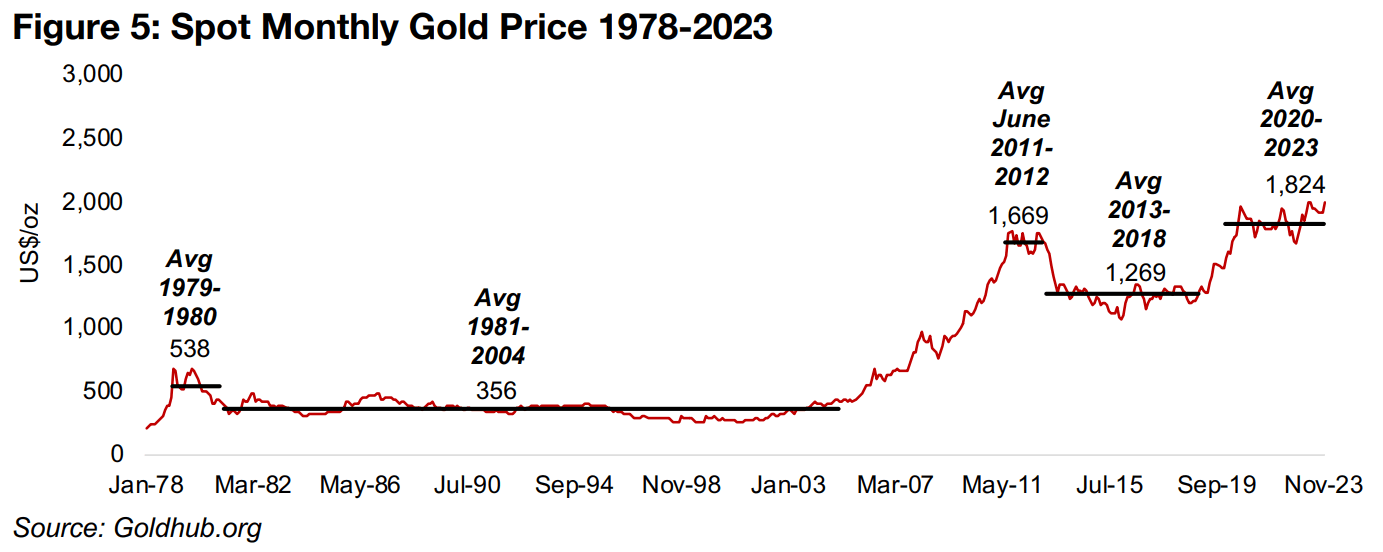
Gold’s new all-time highs raises the question of whether it will finally breakout of a
trading range that has lasted for the past four years with an average of US$1,824/oz
(Figure 5). The metal has historically been stuck around certain levels for far longer
periods, with an average US$1,269/oz persisting for seven years during the bear
market of 2013-2018, and gold not able to break out of a range centered on a
US$356/oz average for well over twenty years from 1981 to 2004.
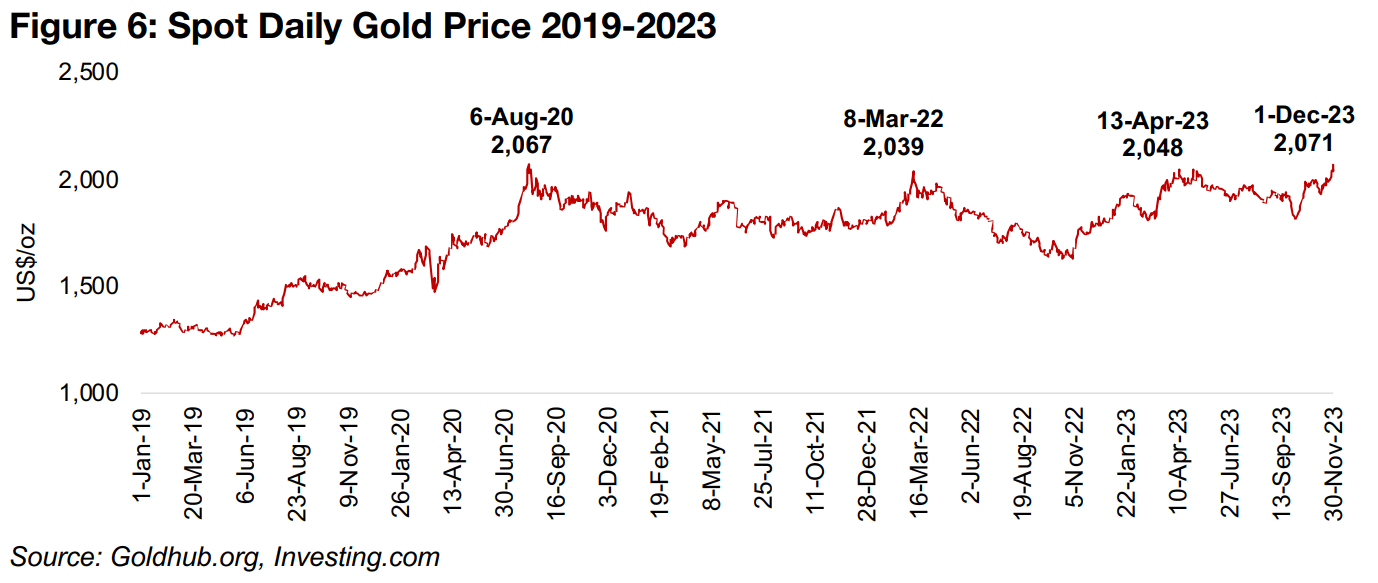
In recent years there have been three other times when the price headed above
U$2,500/oz, but none were sustained for long (Figure 6). All were driven by major
crises, including in August 2020 driven by the global health crisis, in March 2022 after
the Russian invasion and in April 2023 after the banking crisis. While the current run
up was driven initially by the political crisis in the Middle East, it has also been
bolstered by concerns of a global economic downturn in 2024 which is expected in
turn to drive easier monetary policy.
A combination of continued heightened geopolitical tensions and rate cuts in the US
and Europe could certainly be strong drivers for gold into next year. However, the
Fed and ECB have consistently remained more hawkish than expected over the past
two years, and certainly have not expressly indicated rates cuts any time soon. Any
cuts would be provoked by a decline in inflation and employment, but this in turn
indicates a slowing economy. While this could be good for the gold price on a flight
to safety, the outlook for equity markets would be mixed, depending on if a decline
in earnings from an economic slowdown offset any lift to stock prices from falling
rates. For gold stocks specifically to see gains, there would need to be a rise in the
gold price that could offset any broader pressure on equities from a market downturn.
Overall, most fundamental indicators seem to point to a bottoming of gold and gold
stocks, as we have covered in recent weeks. Many relative indicators for gold are at
the low end of long-term ranges while valuations for the stocks are low versus their
history and other equity sectors. Another indicator showing a potential bottoming of
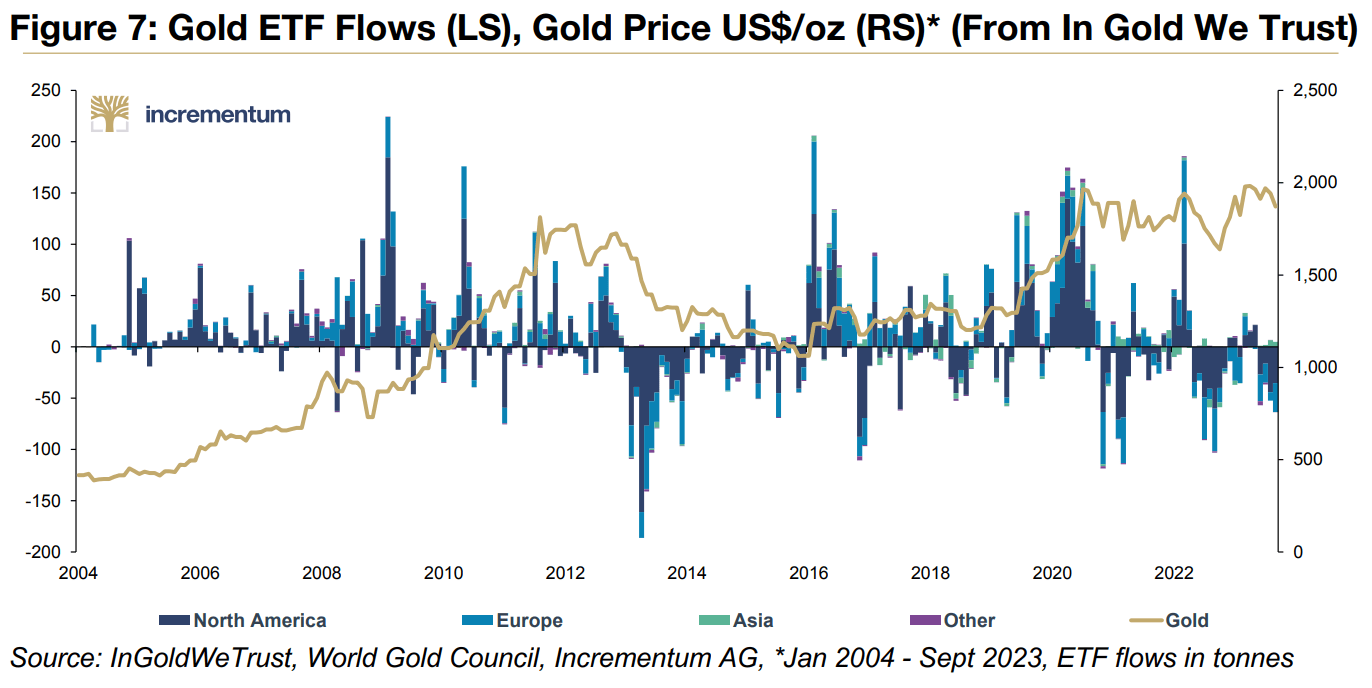
sentiment for the sector this year is gold ETF inflows (Figure 7). While not as severe
as the huge outflows in 2013 during the sector bear market, outflows in 2023 have
still been high historically. While this data only runs to September 2023, the World
Gold Council has reported that ETF outflows diminished in October 2023, and this
trend could have continued over the past month as the gold price has picked up.
World Bank's consistent underestimation of the gold price
While there are a wide range of gold price forecasts, one of the most trackable estimates over time is from the World Bank (WB), and given the organization’s global scope with extensive access to data, it can be considered a reasonable consensus estimate. In Figures 8 to 10 we compare the WB’s forecast for gold, silver, copper and aluminum prices to the realized average price that year from 2018 to 2023. The forecasts are taken from the WB’s October report of the year prior to the forecasted year. This allows for a ‘pure’ forecast as the WB’s other bi-annual reports are in April, so the estimate will be adjusted for events in the first four months of the year. For gold the WB has consistently underestimated the following year’s gold price, and for silver, copper and aluminum it has had a mix of under and overestimation.
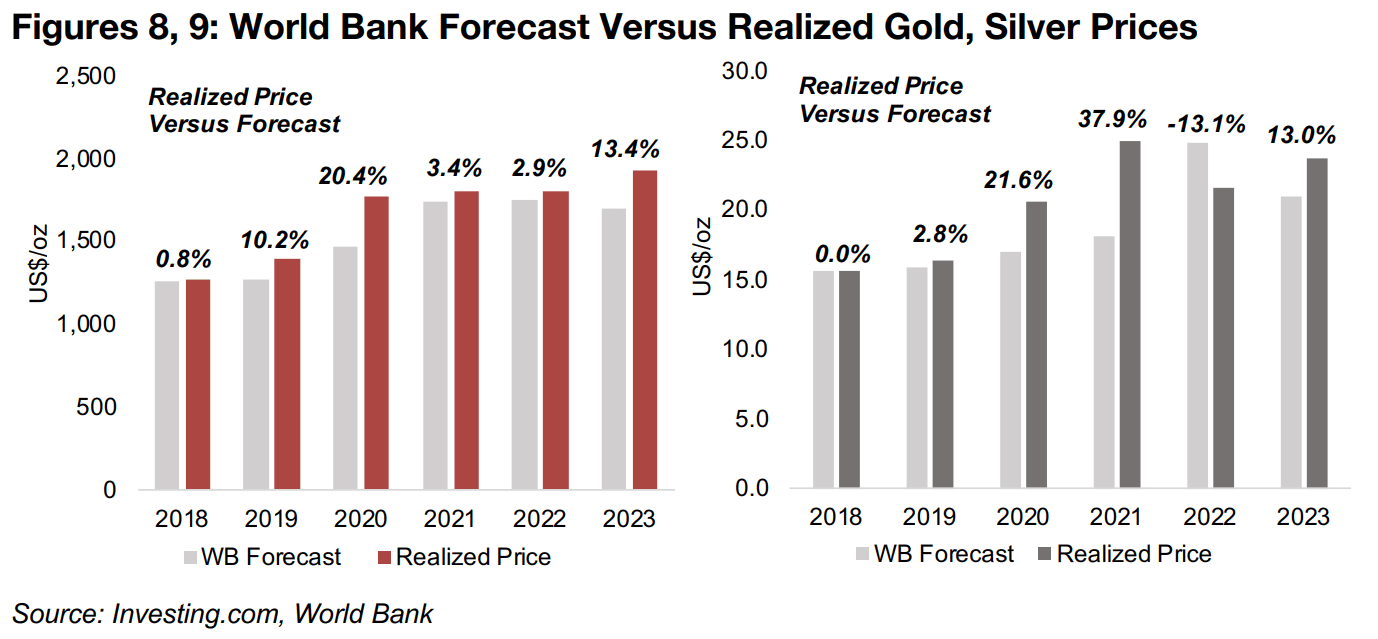
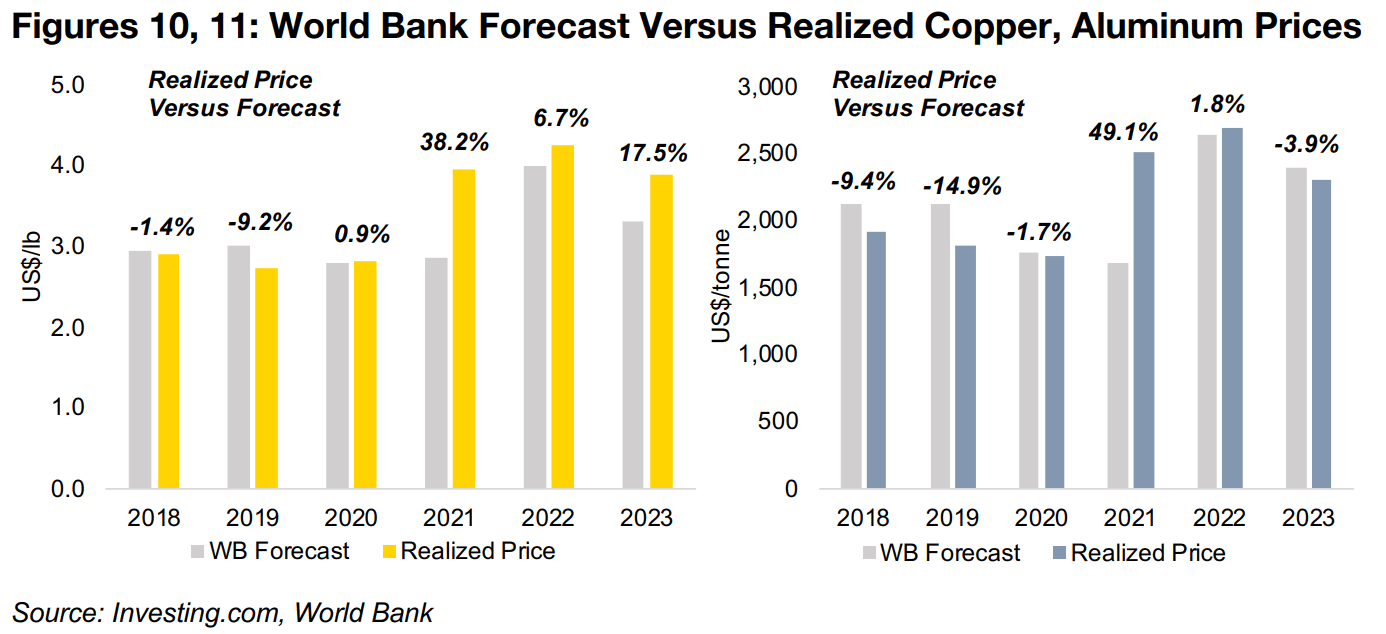
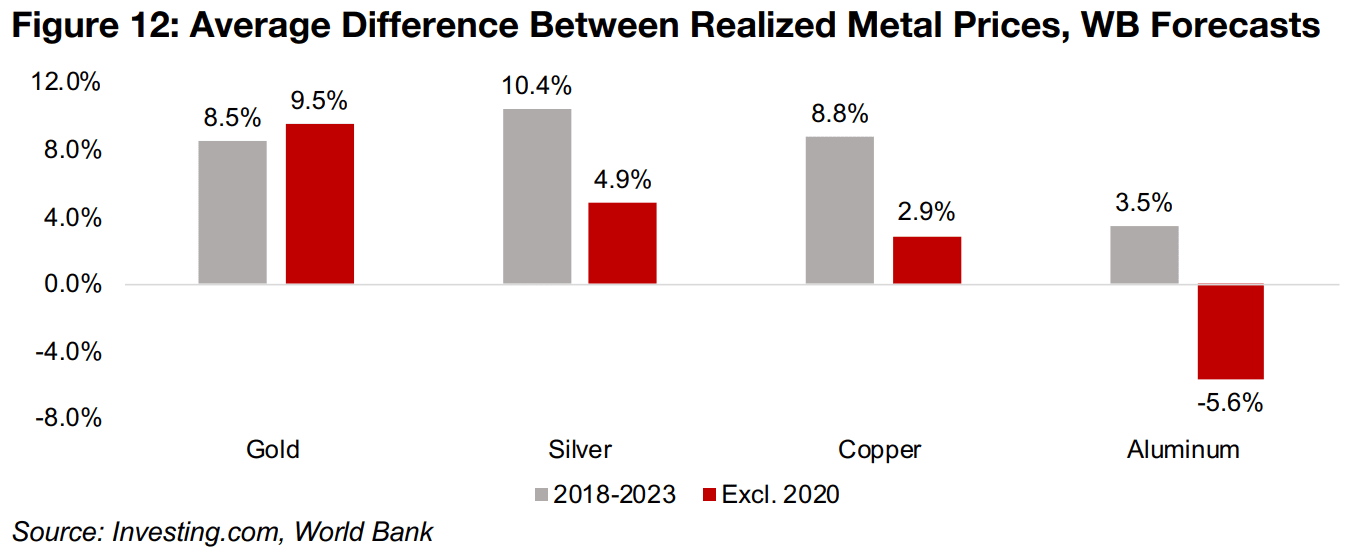
Figure 12 shows the average percent of under or overestimation by the WB versus
the realized metal prices from 2018 to 2023. One issue with these averages is that
they can be considered overstated because of high figures in 2021. Estimates made
in 2020 for 2021 silver, copper and aluminum prices were extremely bearish on the
global health crisis but turned out to be heavily underestimated when 2021 became
a surprise boom recovery year. Therefore, we have also included the average under
or overestimations excluding 2021, which may better represent the WB’s track record.
Overall, gold is clearly the most underestimated, with the realized price 9.5% above
the WB estimate. Silver is less so, with the realized price 4.9% above estimates, while
the copper forecasts are quite close to realized prices, underestimated by just 2.9%,
and aluminum has actually been overestimated by 5.6%. One explanation for this
could be that a rise in gold often implies weakness in the economy, and forecasters
on average tend to make upbeat, not bearish, forecasts. While obviously not a perfect
rule, assuming this underestimation holds again next year, if the realized gold price is
10% above WB’s current 2024 US$1,900/oz estimate, it would average US$2,090/oz.
TSXV and TSX mining market caps slide, but equity capital raised still robust
The recent struggles of the mining sector shown in the indices above are reflected in
recent TSXV and TSX data, with sector market caps declining. However, given the
risk off sentiment of the past two years, and surging interest rates, investment in the
sector has actually remained reasonably robust, as shown by equity capital raised for
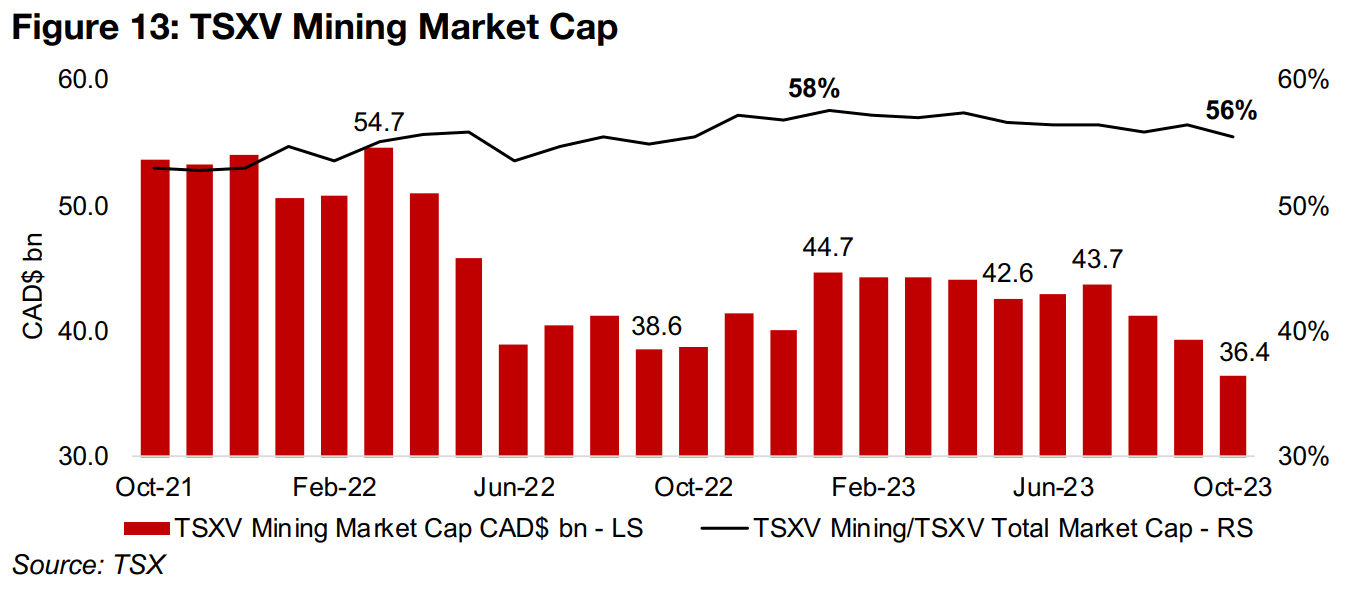
the sector on both indices in recent months. Starting with the TSXV, the mining sector
market cap has declined from CAD$43.7bn in July 2023 to just CAD$36.4bn (Figure
13). However, there has also been a similar level of decline in the TSXV overall, with
the TSXV Mining/TSXV Total Market Cap ratio remaining relatively steady around the
56%-57% level.
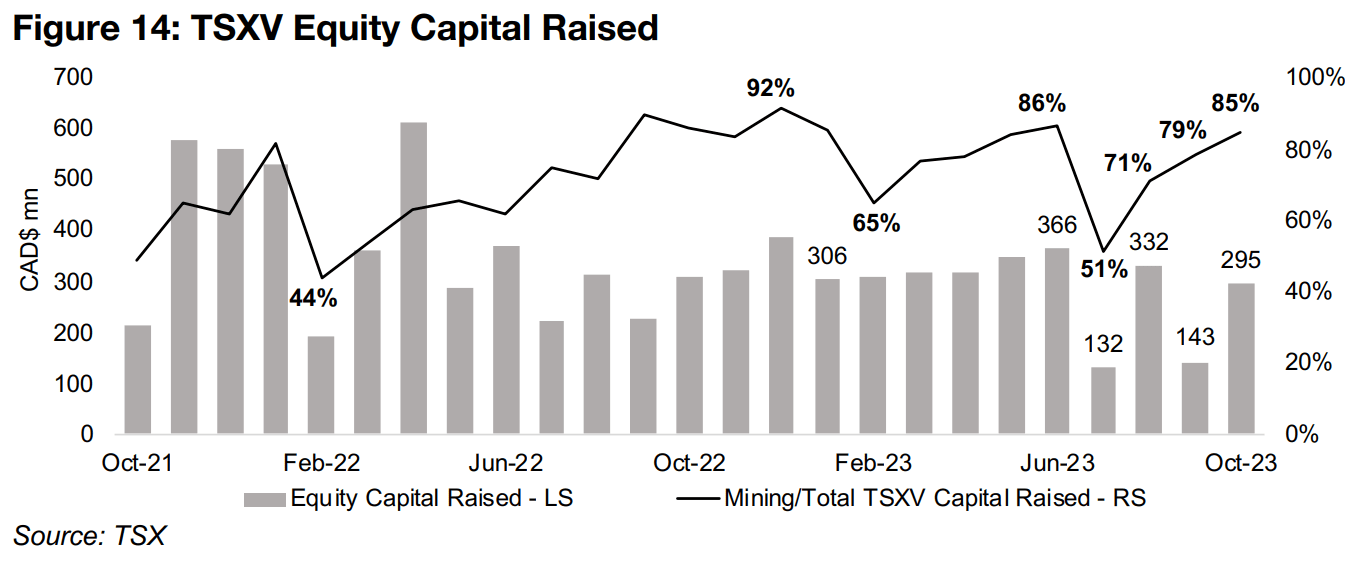
In terms of equity capital raised, the TSXV has been by far the dominant sector in the
market in recent months, jumping from a recent low of 51% in July 2023 to 85% in
October 2023 (Figure 14). The weakness in the equity capital raised in July 2023 and
September 2023 is somewhat concerning, being the lowest in the past two years, at
just CAD$132mn and CAD$143mn, respectively. However, this has been offset by
some strong figures in August 2023 and October 2023, at CAD$332mn and
CAD$295mn, respectively, and the monthly average for 2023 still looks set to come
in only marginally below 2022.
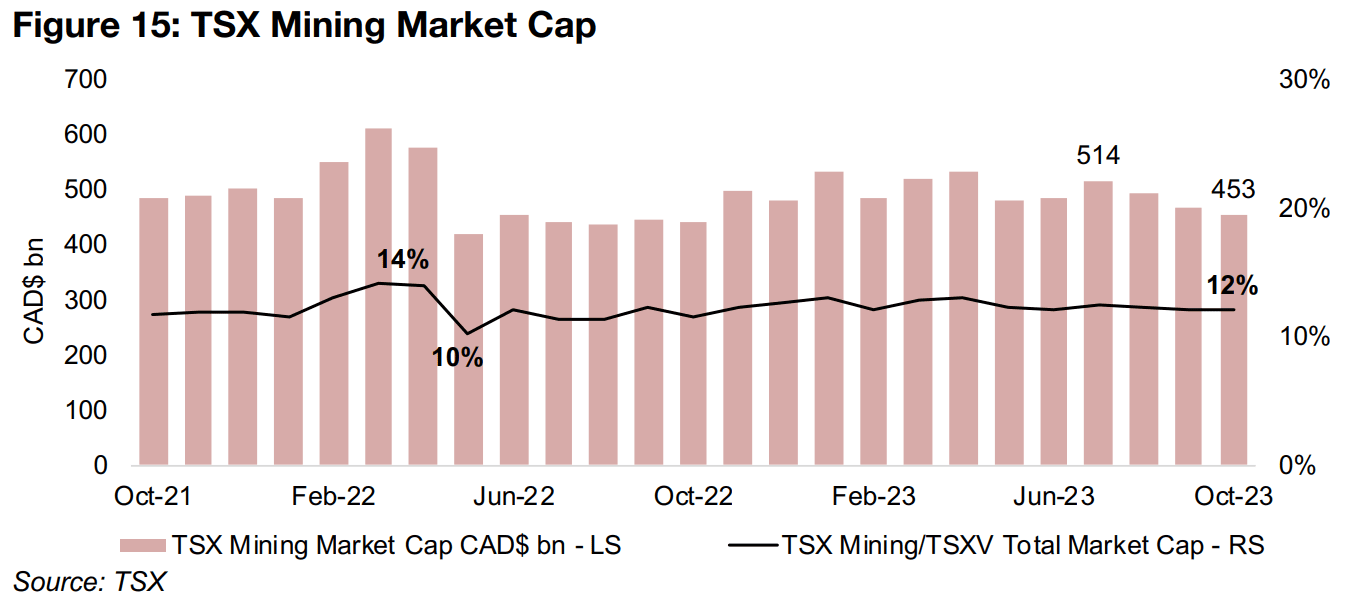
The mining sector market cap of the TSX has also declined, from CAD$514mn in July
2023 to CAD$453mn in October 2023, and is at a far lower percentage of the total
market, at around 12%, than mining is for the TSXV (Figure 15). Mining equity capital
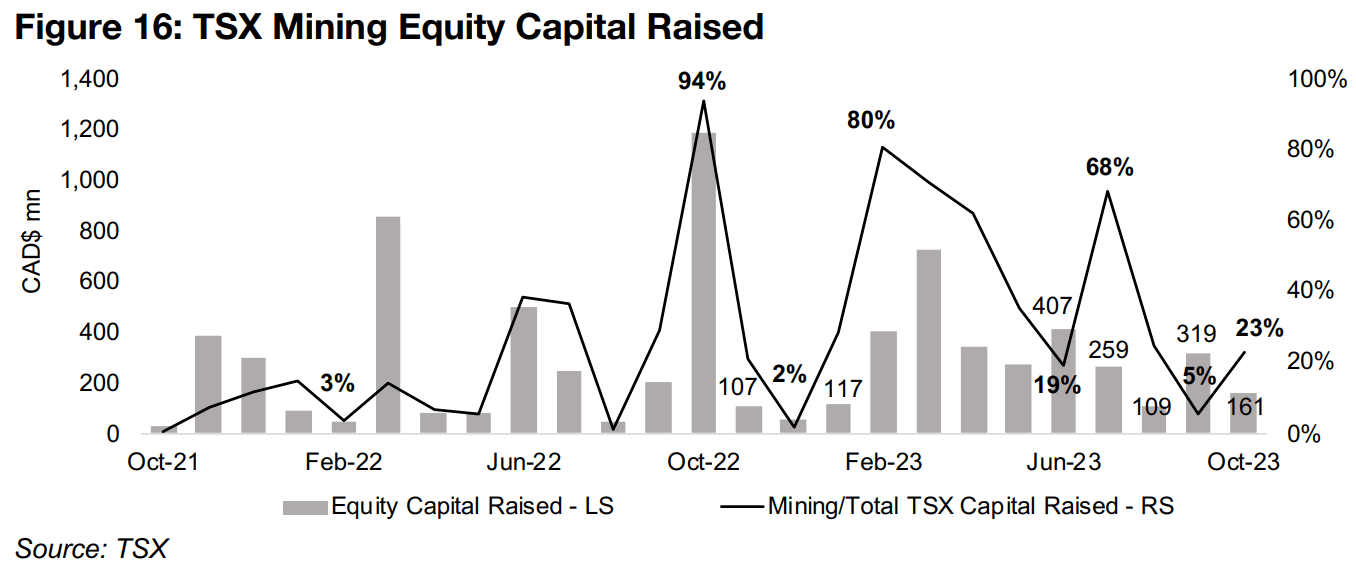
raised for the TSX tends to be far more volatile than for the TSXV, with the much
larger index having the potential for much larger deals. This can send investment
soaring in certain months to levels far above anything reached on the TSXV.
An example is October 2022, when the mining equity capital raised went over
CAD$1.0bn, and accounted for 94% of TSX total equity capital raised (Figure 16).
However, mining equity capital raised on the TSX can also plummet to lows of around
CAD$100mn, putting it well below the typical month for the TSXV over the past two
years at around CAD$300mn. Adding up the past four months of mining equity capital
raised, the TSXV had CAD$901mn and the TSX CAD$847mn, nearly equal even
through the latter is a far larger market, which shows just how critical the TSXV is to
Canadian mining investment.
Gold producers and most larger TSXV gold gain on gold’s jump
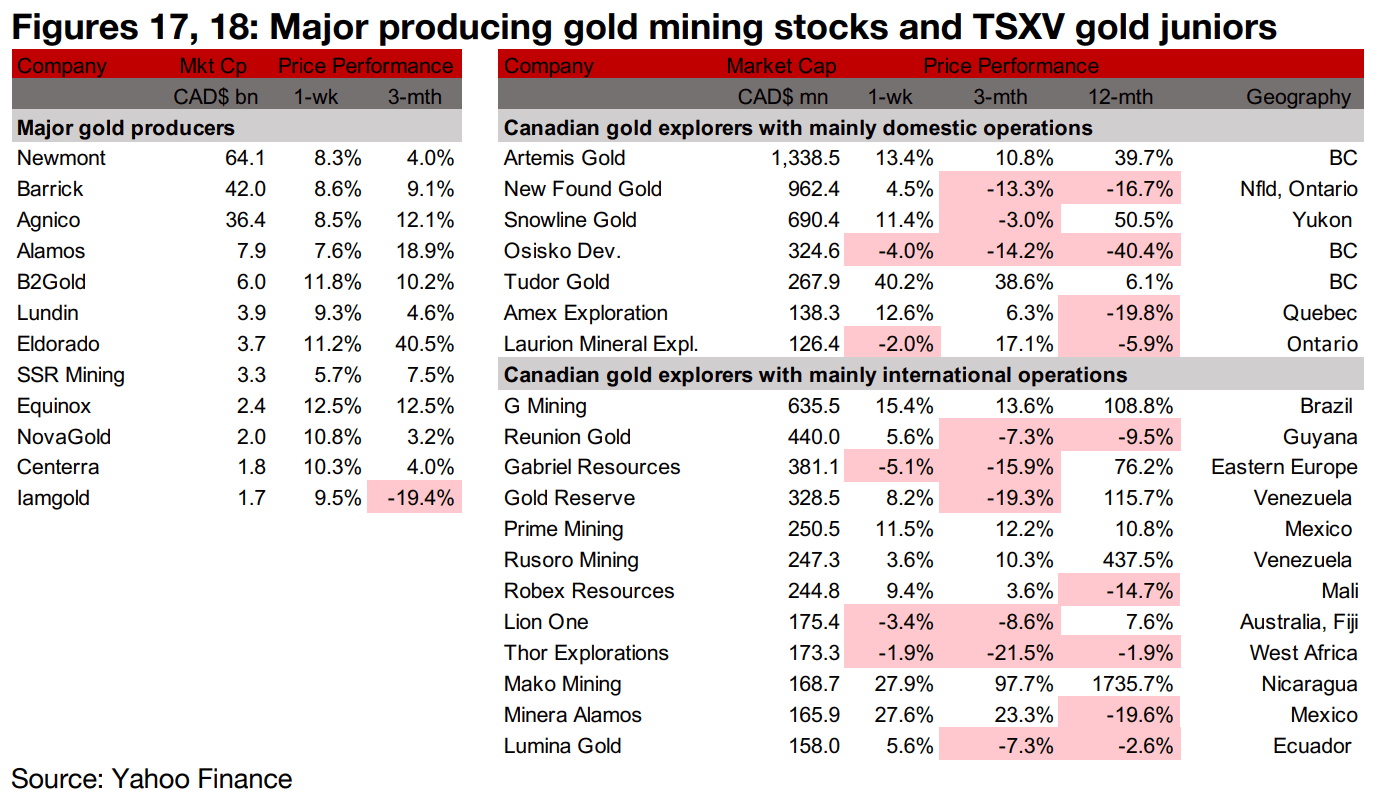
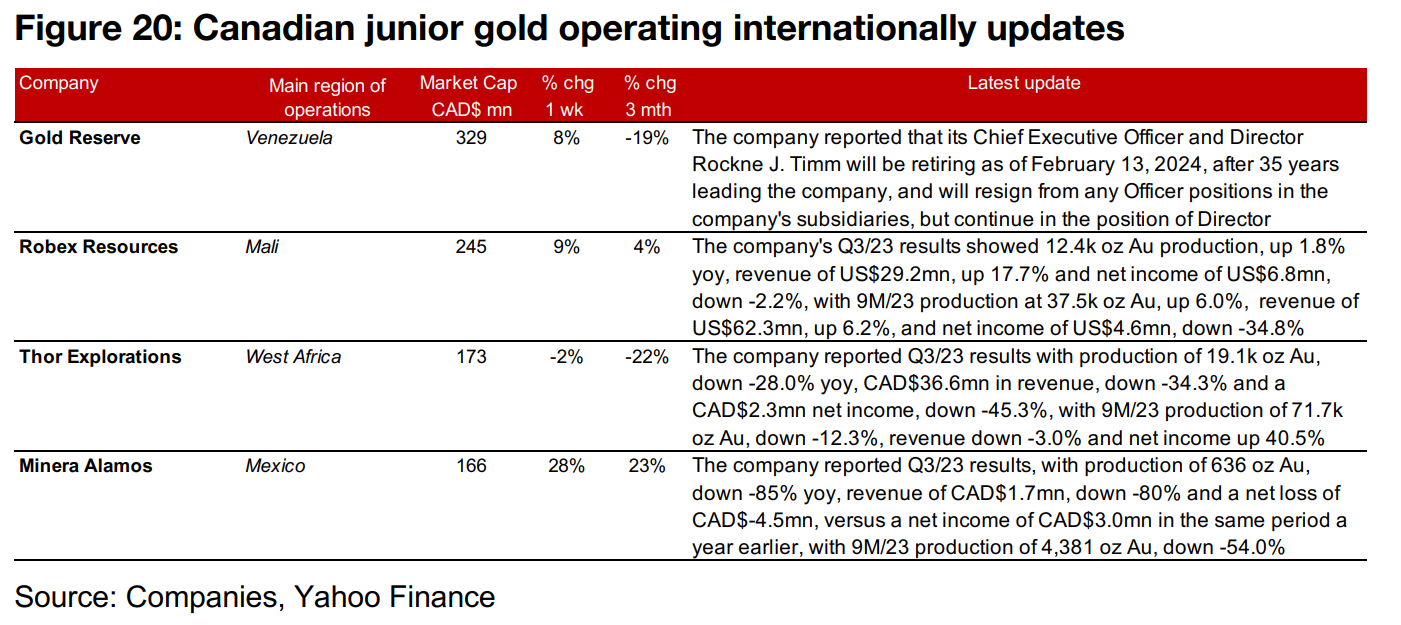
The major gold producers all increased by 5.0% or more and most of larger TSXV larger cap were up, with a handful rising by around 30%-40%, on the jump in gold (Figures 17, 18). For the TSXV gold companies operating domestically, New Found Gold reported drill results from the K2 Zone of Queensway and Tudor Gold announced a twice-upsized CAD$7.0mn private placement (Figure 19). For the TSXV gold companies operating internationally, Gold Reserve announced that its CEO of thirty-five years would retire, and Robex Resources, Thor Explorations and Minera Alamos announced Q3/23 results (Figure 20).

Disclaimer: This report is for informational use only and should not be used an alternative to the financial and legal advice of a qualified professional in business planning and investment. We do not represent that forecasts in this report will lead to a specific outcome or result, and are not liable in the event of any business action taken in whole or in part as a result of the contents of this report.


