
September 10, 2021
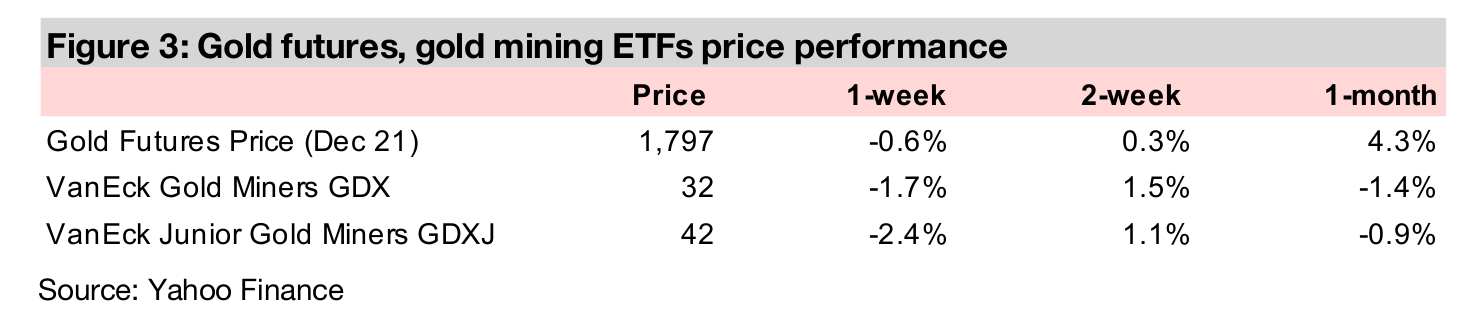
The gold price dipped -0.6% this week to US$1,797/oz, and has remained range bound about US$10 above or below the US$1,800/oz level for the past month, which is also the average since the start of 2021, as the market awaits clear direction.
This week we take a look at signals from the major metals' ratios in the context of both their long-term averages, and short-term levels since 2020, including gold/silver, gold/copper, silver/copper, gold/platinum and platinum/palladium.
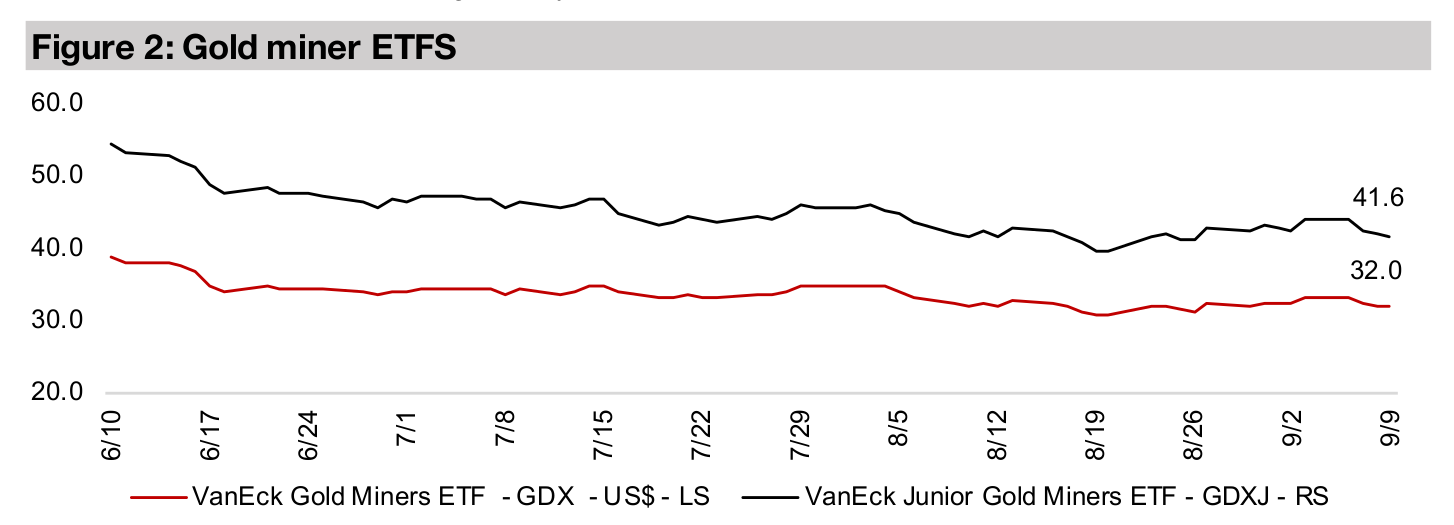
The producers and juniors dipped, with the GDX down -1.7%, GDXJ down -2.4% and Canadian juniors mixed. In Focus this week is Osisko Development, with its flagship Cariboo Gold in B.C. and two other projects at the development stage.


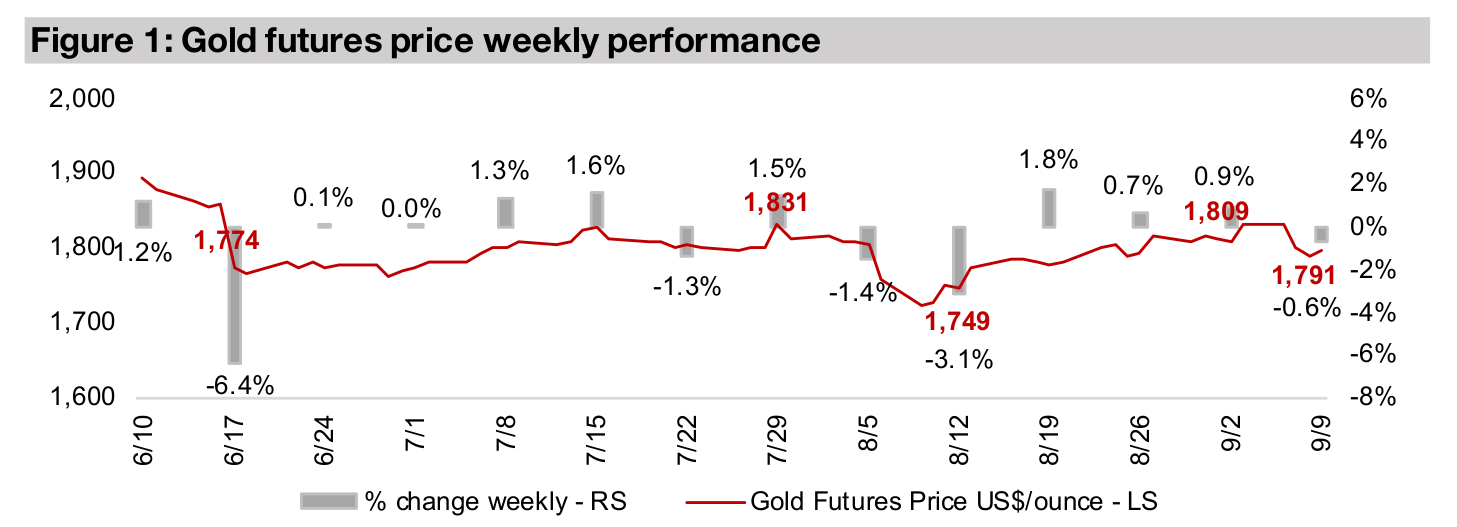
Gold declined -0.6% this week to US$1,797/oz, and remained range bound within
US$10 below or above an average of around US$1,800/oz, which is also the average
since the beginning of 2021. The US jobs report over the past week sent mixed
signals, with a big miss of expectations for new job additions looking somewhat
deflationary, but a rise in wages that could be considered inflationary. Overall, there
was a muted effect on gold from this, the only major recent economic release from
the US, as the market continues to look for clear signs of inflation either rising or
abating, and the jobs reports was unclear on this issue. Inflation remains in focus as
it is a key determinant in the Fed's decision of whether to maintain or pullback its
monetary stimulus, and to what degree, which is likely to be a major catalyst for gold.
With gold remaining range bound, this week we take a look at some key metals' ratios,
comparing gold, silver, copper, platinum and palladium, to try to get some idea of
where price direction could be headed based on both long-term historical averages
and more recent averages since 2020. The first ratio is gold to silver, which has seen
quite a volatile year, spiking as high as 125.9x in mid-2020, and then sliding as low
as 63.3x, during the Wallstreetbets-driven 'silver spike' in February 2020, and having
picked up most recently to just below the average since 2020 of 81.8x (Figure 4).
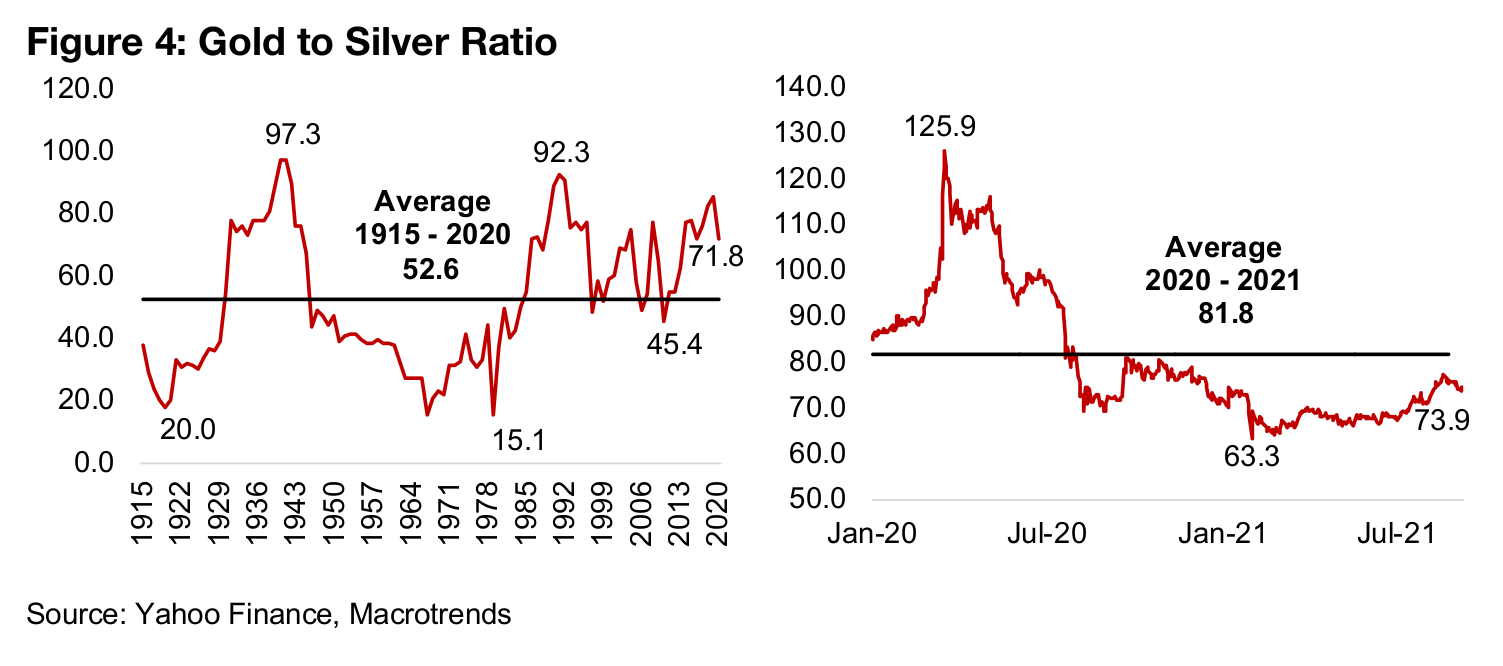
However, this average since 2020 still looks quite high in contrast to the average of just 52.6x from 1915-2020. Many analysts suggest indicates that even with silver's big relatively pick up to gold since H2/20, that it is still fundamentally undervalued versus gold, and that there is still room for a significant pick up in silver, and a therefore more of a drop in gold to silver ratio long-term. As we don't expect to see a major decline in gold, given the ongoing very loose monetary policy global and rising inflation, we also expect that a decline in this ratio would be more likely to come from a major rise in the silver price, as opposed to a decline from gold.
The gold to silver ratio demonstrates the relative value of two precious metals which
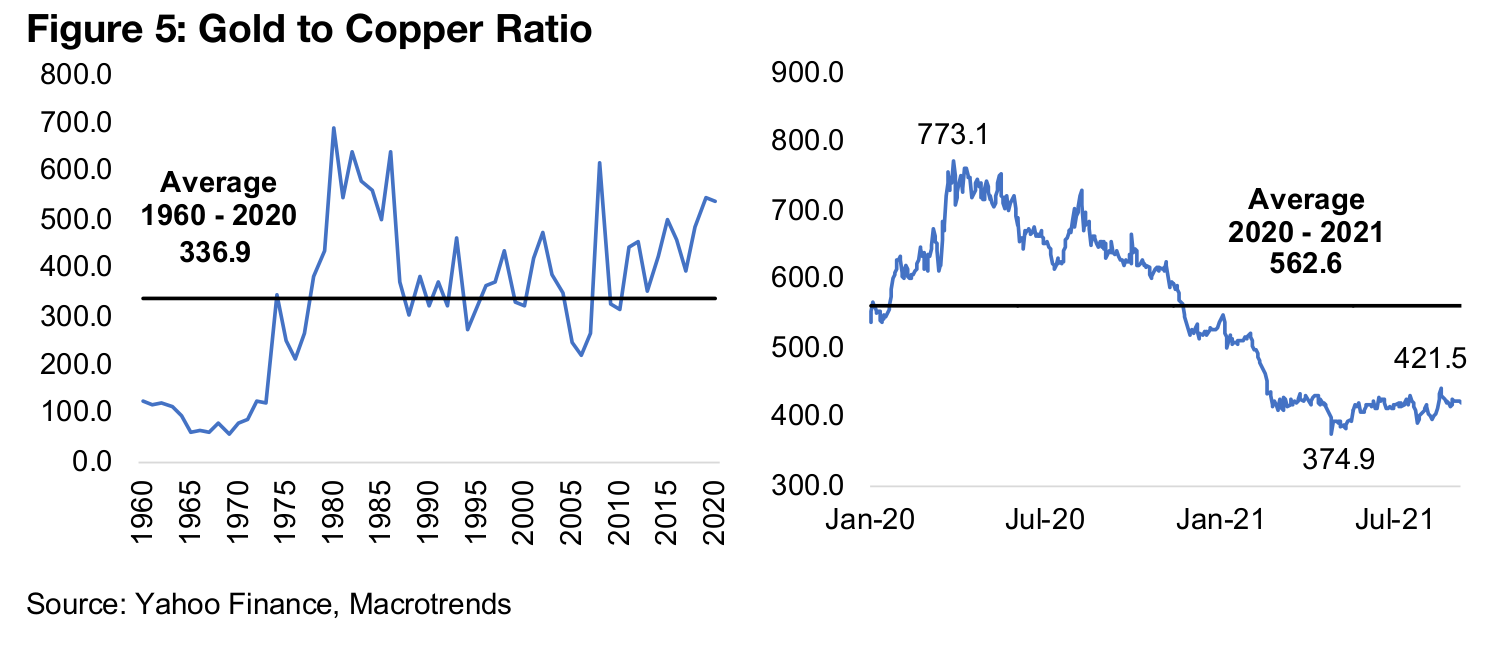
are both mainly driven by monetary factors. The gold to copper ratio shows a very
different type of relationship, with copper viewed as a leading proxy for the broader
economy given its wide industrial use, and is not considered a main monetary metal.
We would therefore expect to see the gold to copper ratio rise in times of economic
distress, with a combination of money printing and a flight to safety driving gold up,
and slowing global economic demand leading to a lower price for copper. We can
see this in the low ratio during the strong US economy of the 1960s and then the
increase as the economy weakened from the mid-1970s to the early 1980s (Figure 5).
The ratio then falls towards its long-term average through the reasonably strong
expansion of the mid-1980s through to 2008, when it jumps on the financial crisis.
Interestingly, even during the expansion of around 2013 to 2020, the gold to copper
ratio was generally trending up. The global health crisis in 2020 saw the ratio shoot
up to 773.1x, its highest level since 1960, as gold held steady on a flight to safety and
the copper price declined significantly.
However, the abrupt recovery, coupled with supply chain disruptions, lead to an
equally strong reversal in the ratio, and it now is at 421.5x, still above the long-term
average, suggesting that all else equal, the economy is still in an expansionary phase.
Of course, all else is NOT equal, given the unprecedented, massive monetary
expansion of the past year, so it is difficult to say where this ratio would be now
without this monetary stimulus.
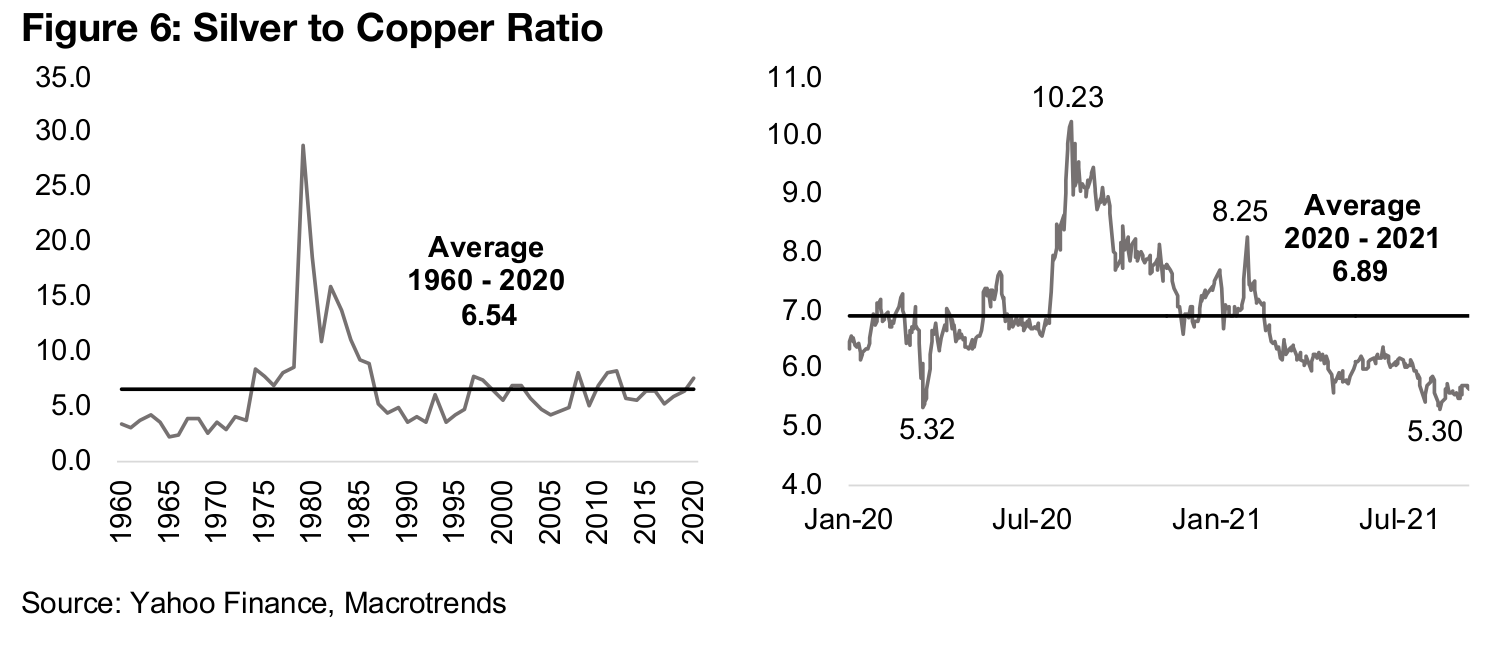
In contrast to the wide variations in the gold/silver ratio, the silver to copper ratio
historically holds within a tighter range. This is possibly because in addition to silver's
role as a monetary metal, like copper, it is also partly driven by the cycle of industrial
demand factors. To that end silver could be viewed as a hybrid of gold and copper
in terms of the key factors influencing it. Apart from a surge in the late 1970s-early
1980s driven by monetary factors, the silver to copper ratio remained reasonably
steady around the long-term average of 6.54x from the 1980s to 2020 (Figure 6).
However, it shot up in mid-2020, mainly because the market was probably viewing
silver as very undervalued versus gold, and then again in the silver spike of January
2021, before starting to decline as the global economic recovery started to drive a
pickup in the demand for copper. The silver/copper ratio has now declined to 5.30x,
considerably below the 6.54x long-term average, which again may be suggesting a
pickup in the silver price, similar to what we are seeing indicated by the gold to silver
ratio in comparison with long-term averages.
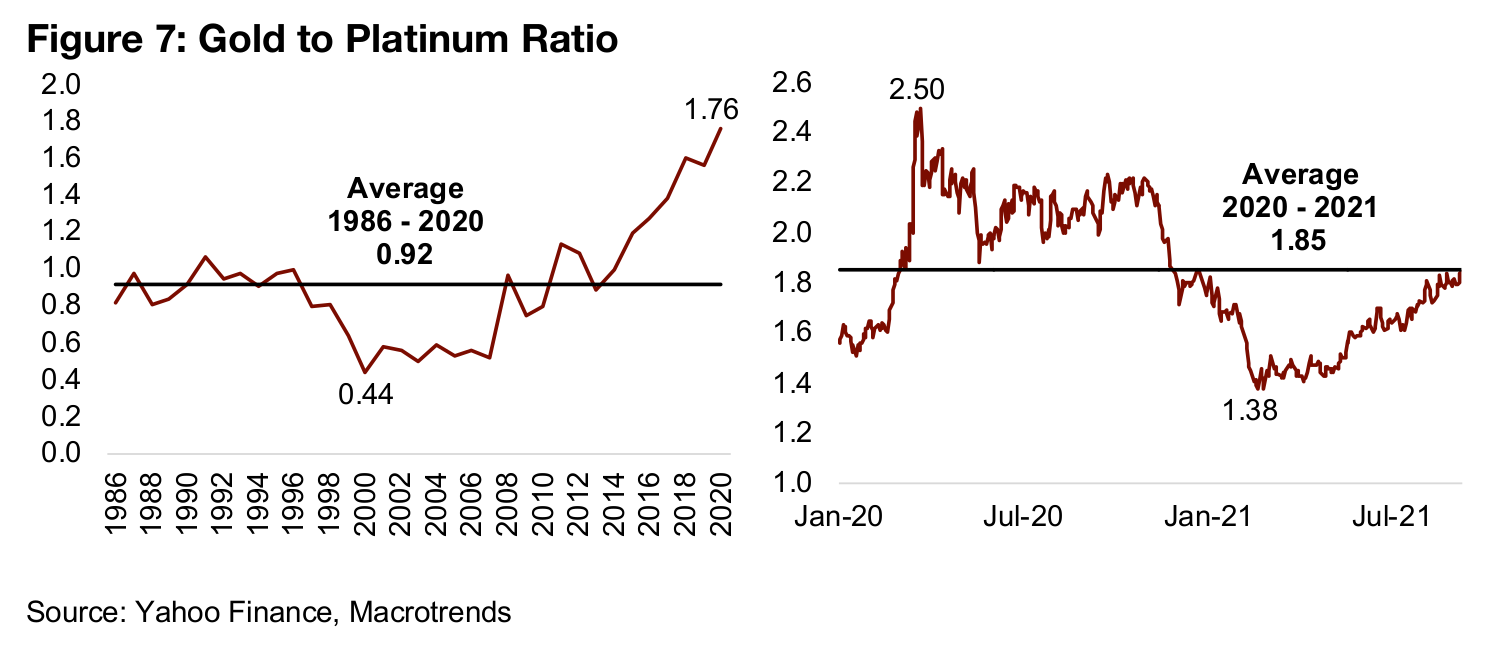
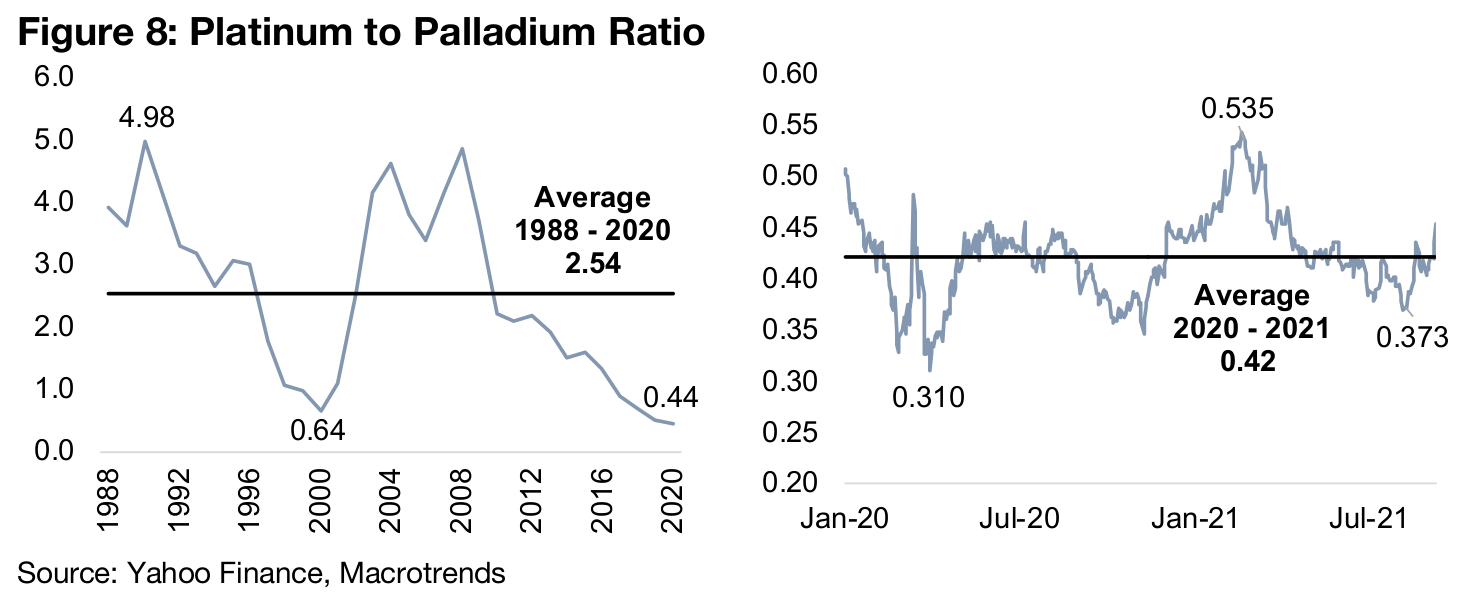
The gold to platinum ratio started a strong break out from a long-term average since 1986 of 0.92x around the mid-2010s, rising to 1.76x as of 2020 (Figure 7). However, after peaking at 2.50x on gold's mid-2020 spike, it declined as gold slid and the platinum price rose on industrial demand. The platinum/palladium ratio has swung considerably around the average from 1988-2020 of 2.54x, and over the past decade palladium has outpaced the rise in platinum (Figure 8). This is partly because while there is demand for both metals in vehicle autocatalytic convertors, platinum is used for diesel and palladium for gas vehicles. The shift away from diesel and towards 'green' vehicles has driven up the relative demand for palladium. Since 2020 platinum/palladium has remained relatively close to the average 0.42x, with a dip below it in early 2020 and a spike above it in early 2021.
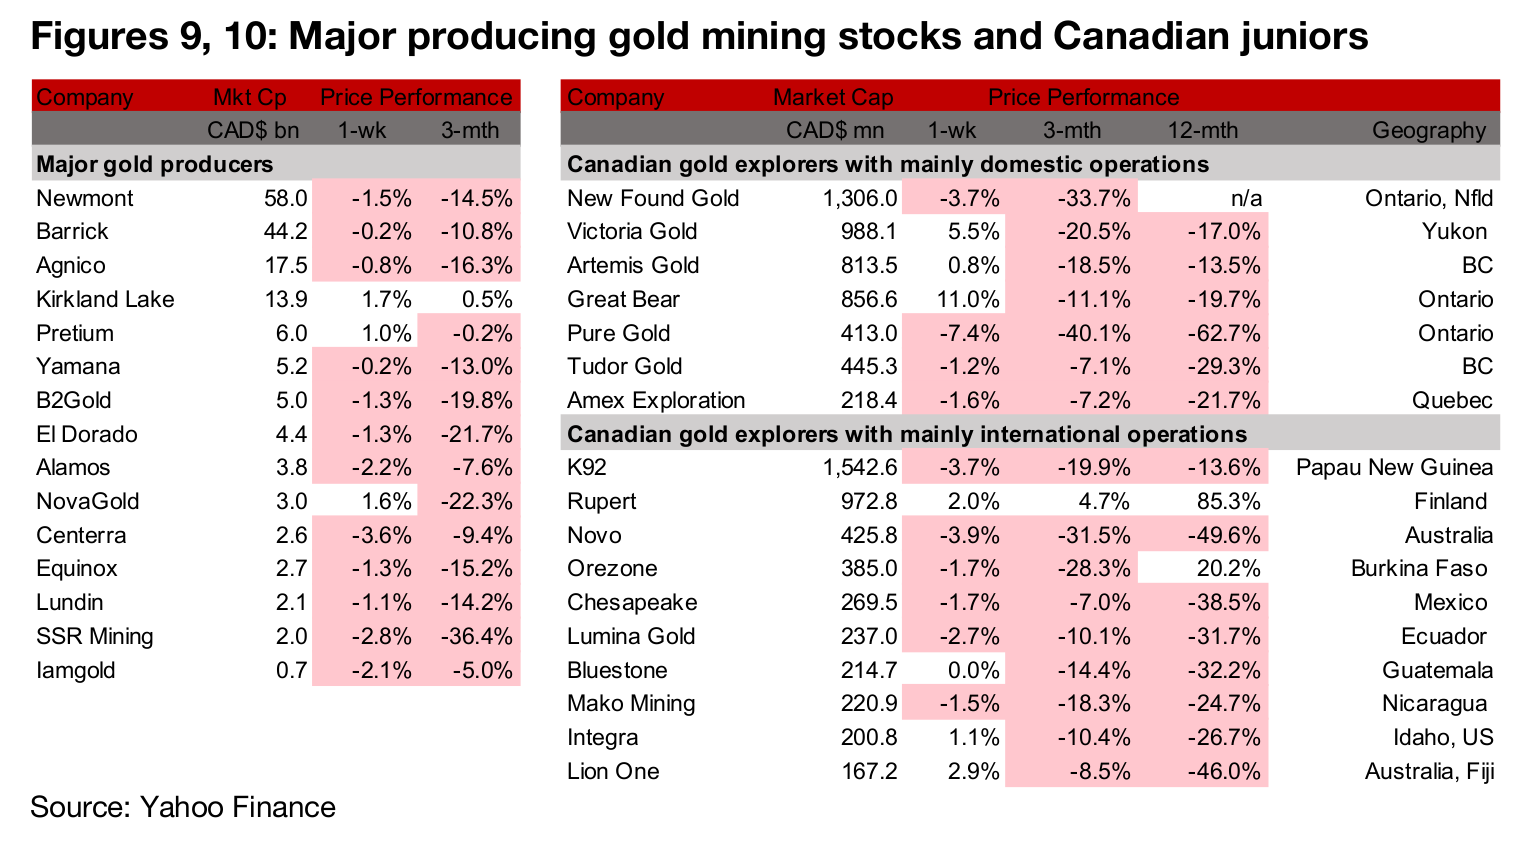
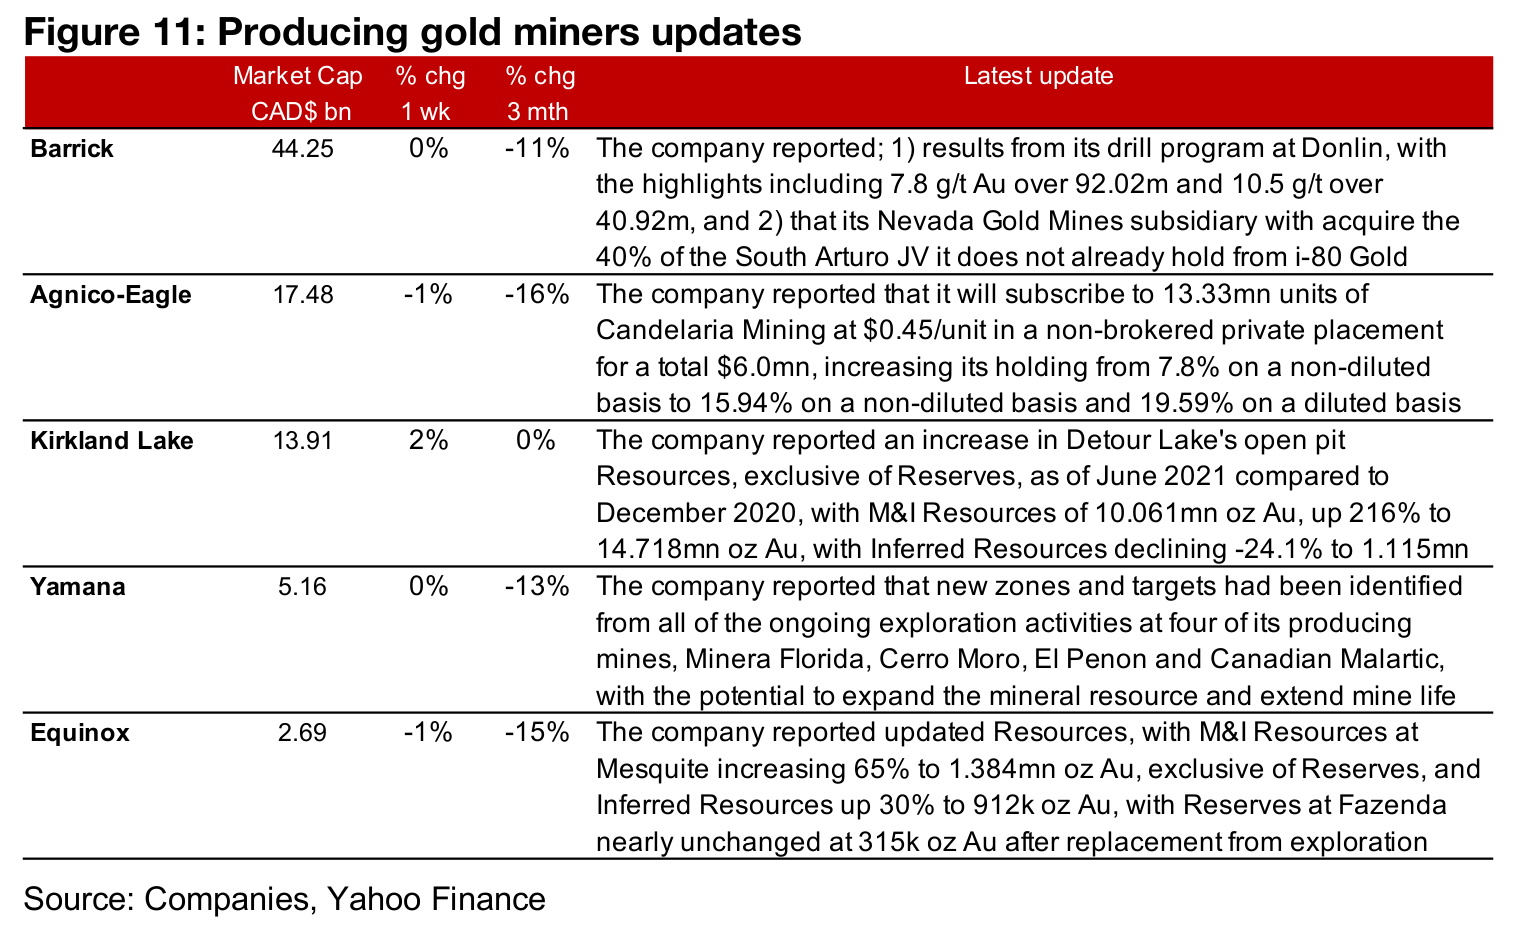
The producing gold miners mainly declined on the dip in gold (Figure 9). Barrick reported results from its drill program at the Donlin mine, and its subsidiary Nevada Gold Mines acquired the remaining 40% it did not yet already own of the South Arturo JV from i-80. Agnico-Eagle reported that it would subscribe to $6.0mn of a private placement by Candelaria, increasing its stake to 19.59% on a diluted basis, and Kirkland reported an increase in M&I Reserves at Detour Lake to 14.718mn oz Au, up 216% from December 2020. Yamana reported that new zones and targets had been identified from all of the ongoing exploration activities at four of its mines, and Equinox reported that M&I Resources had increased 65% to 1.384 mn oz Au, exclusive of Reserves, and Inferred Resources rose 30% to 912k oz Au, and Inferred Resources remained nearly unchanged (Figure 11).
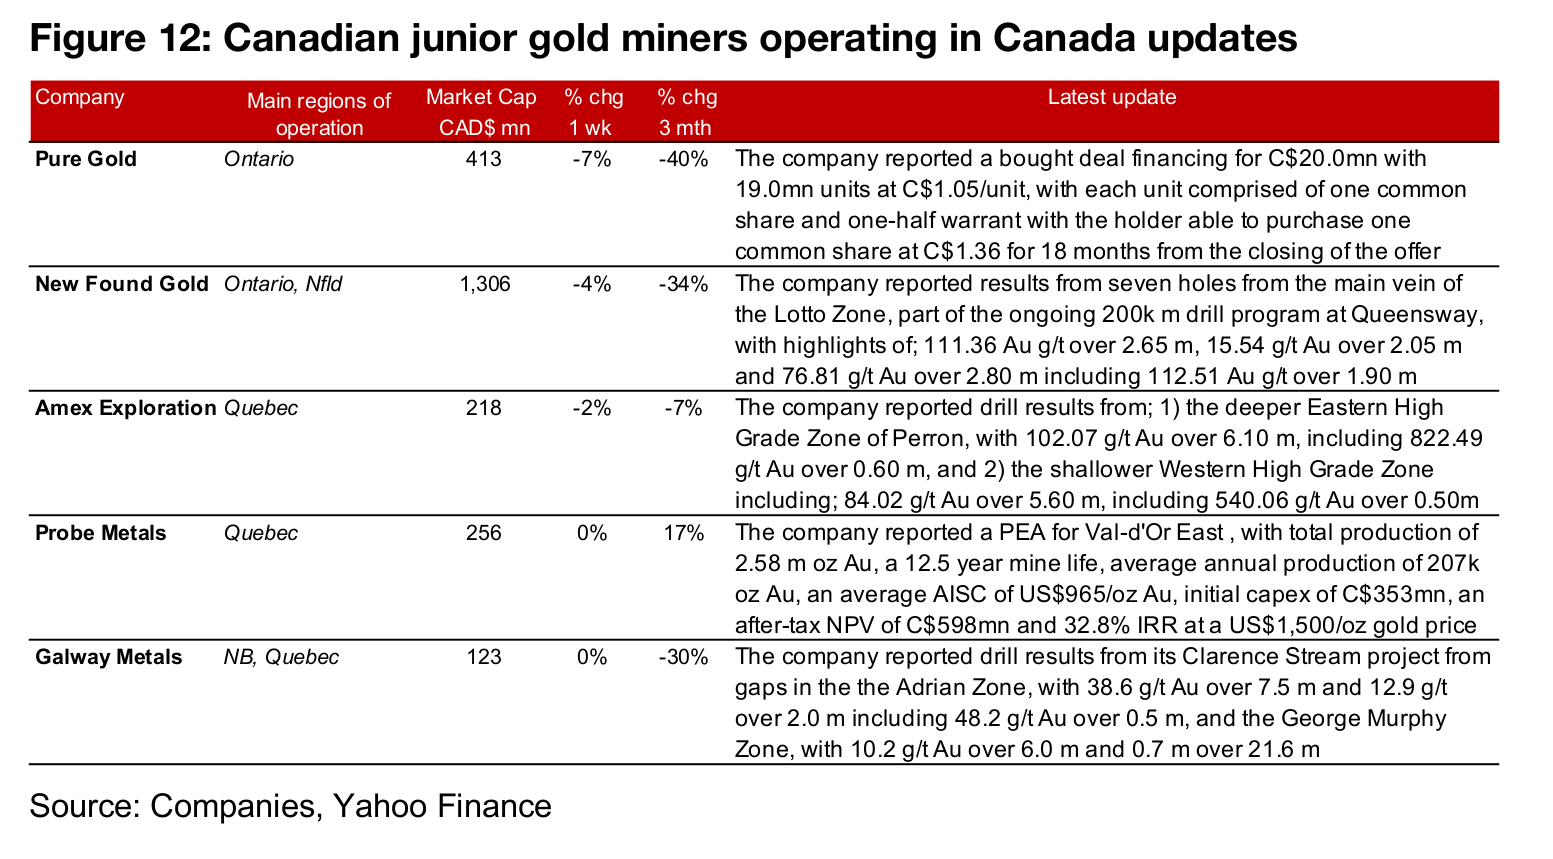
The Canadian juniors were mixed as gold declined (Figure 10). For the Canadian
juniors operating mainly domestically, Pure Gold announced a bought deal financing
for C$20mn, New Found Gold reported drill results from the Lotto Zone of Queensway
and Amex Exploration drill results from the deeper Eastern High Grade zone and
shallower Western High Grade Zone of Perron. Probe Metals reported a PEA for Val
d'Or East, and Galway Metals reported drill results from its Clarence Stream project
(Figure 12).
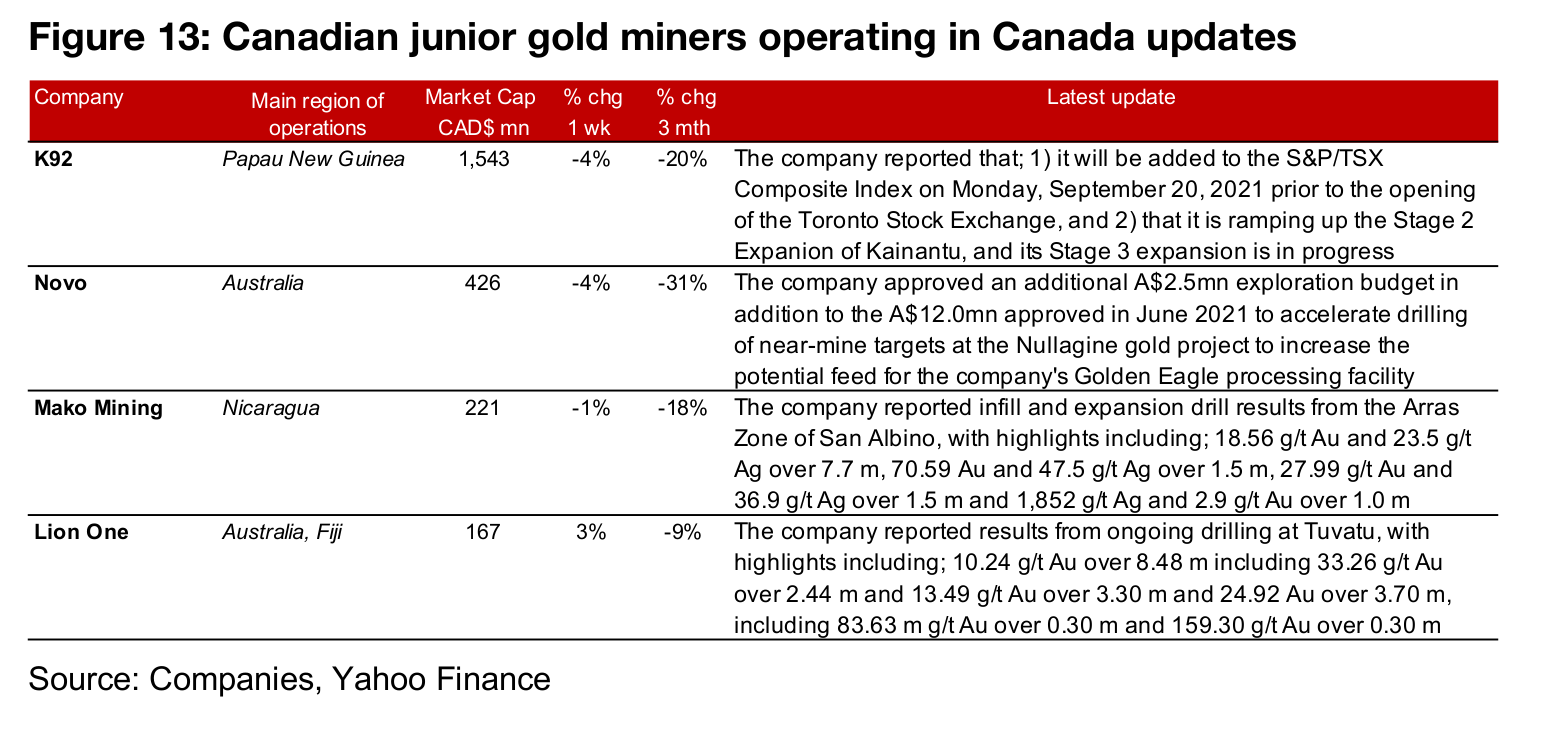
For the Canadian juniors operating mainly internationally, K92 reported that it will be
added to the S&P/TSX Composite Index on Monday, September 20, 2021, and Novo
approved an additional A$2.5mn exploration budget in addition to the A$12.0mn
approved in June 2021. Mako Mining reported infill and expansion drill results from
Arras Zone of San Albino, and Lion One reported drill results from Tuvatu (Figure 13).
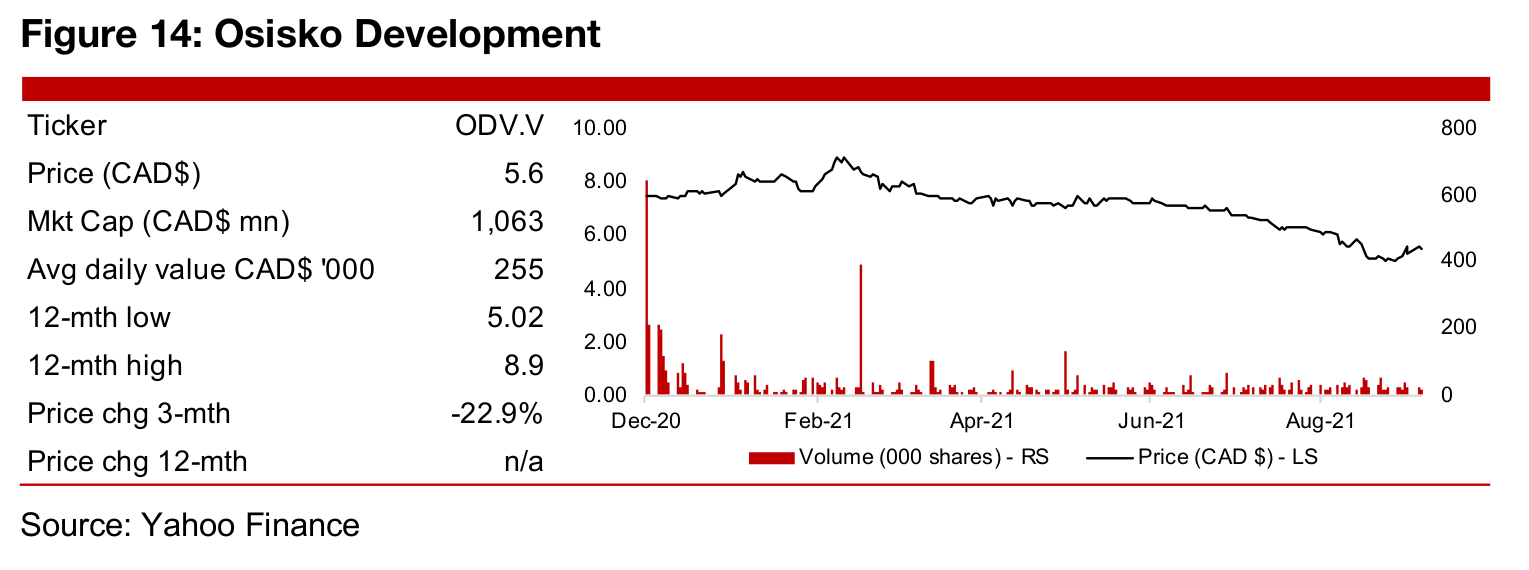
Osisko Development operates five projects, with three at the development stage. It has two gold projects in B.C., 1) Bonanza Ledge II, part of the Cariboo Gold project, which saw first gold poured in Q2/21, 2) San Antonio in Mexico, a brownfield site where the company targets potential production over the next 12-18 months, and 3) Cariboo, with a PEA released in August 2019, with the company expecting a Feasibility Study to be completed by H1/22 and permitting in 2022, with production by 2023 of 200k oz/year. The company also holds two early-stage exploration projects in James Bay, Quebec and Guerrero, Mexico. The company was just recently formed, listing in December 2020, from a spin-out of properties from Osisko Royalties.
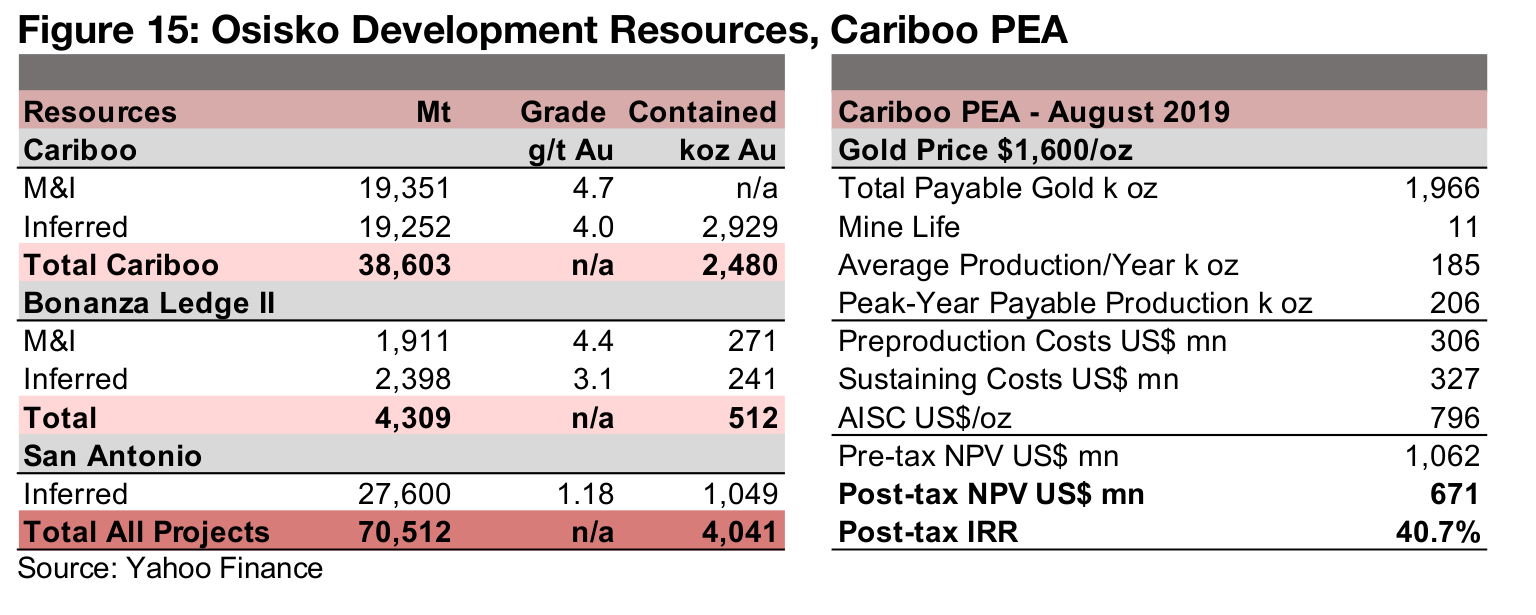
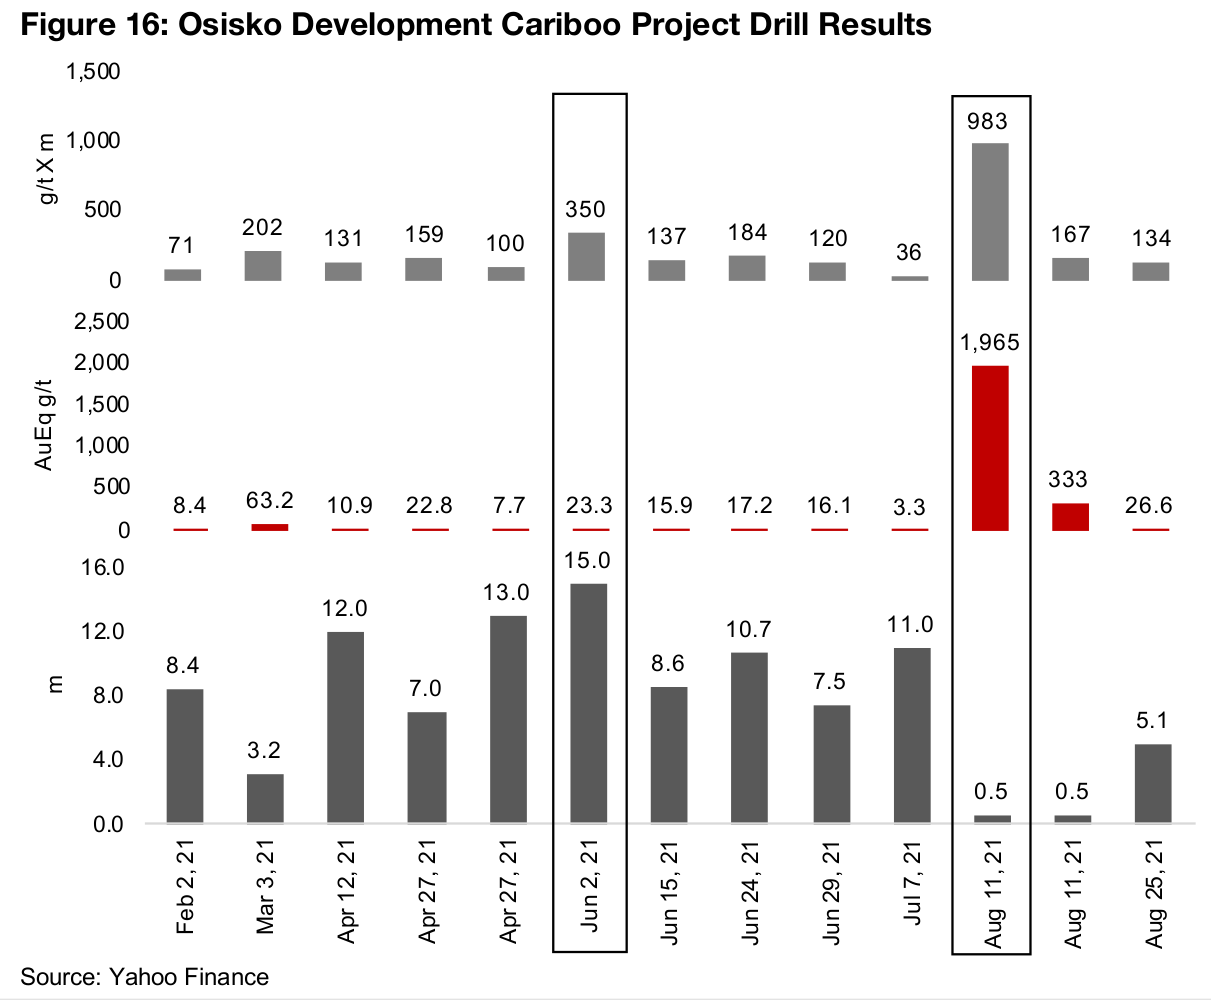
Cariboo is the company's largest project, with 2,480k oz Au in M&I and Inferred Resources, with an additional 512k oz Au for Bonanza Ledge II and 1,049k in Inferred Resources for San Antonio (Figure 15). The August 2019 PEA for Cariboo outlines 1,966k oz Au total payable gold, a mine life of 11 years, average annual production of 185k oz Au, preproduction and sustaining costs of US$306mn and US$327mn, an AISC of US$796/oz, a post-tax NPV of US$671mn and post-tax IRR of 40.7%. Cariboo has been the focus of exploration in 2021, with highlights of drill results including; 23.3 g/t Au over 15.0 m, and 1,965 g/t Au over 0.5 m (Figure 16)
The company is well funded, with four rounds of financing since its listing, with private placements of $85.0mn and $40.3mn both closed in December 2021, $68.6mn in January 2021, and $33.6mn in February 2021. The management team comprises executives from Osisko and other firms, with most having decades of experience in the gold mining industry. The company's shares are down -22.9% over the past three months, and have generally trended down since a peak in February 2021, mainly because of the broader stagnation in the gold price this year.
Disclaimer: This report is for informational use only and should not be used an alternative to the financial and legal advice of a qualified professional in business planning and investment. We do not represent that forecasts in this report will lead to a specific outcome or result, and are not liable in the event of any business action taken in whole or in part as a result of the contents of this report.
Author
Ben McGregor authors the Weekly Roundup at CanadianMiningReport.com, providing sharp analysis of the metals and mining sector. With a talent for spotting trends, Ben distills complex market shifts into clear, engaging insights on TSXV junior miners. His weekly updates cover gold, copper, uranium, and more, blending data-driven perspectives with a knack for identifying opportunities. A vital resource for investors, Ben’s work navigates the dynamic junior mining landscape with precision.