April 09, 2021
How correlated really are gold and bond yields?
Author - Ben McGregor
Gold starts to move above recent range
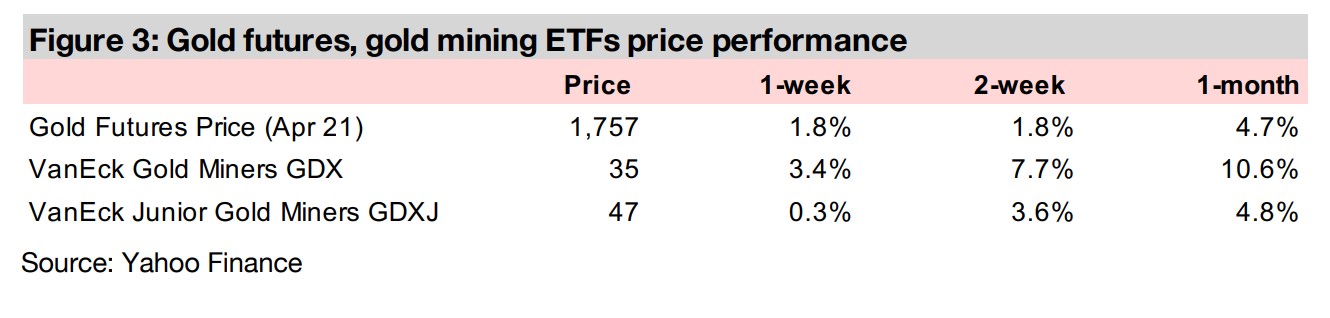
Gold rose 1.8% this week to US$1,757/oz, its highest weekly gain since around December 2021, and is starting to move ahead of its average of US$1,725/oz over the past several weeks, driven partly by some easing of bond yields.
No particular long-term consistency between gold and yields
However, while it does appear that movement in bond yields have recently been affecting gold, this week we look at the long-term history of gold versus the US bond yields and find that actually there is no consistent long-term correlation between them.
The top drilling results over the past year
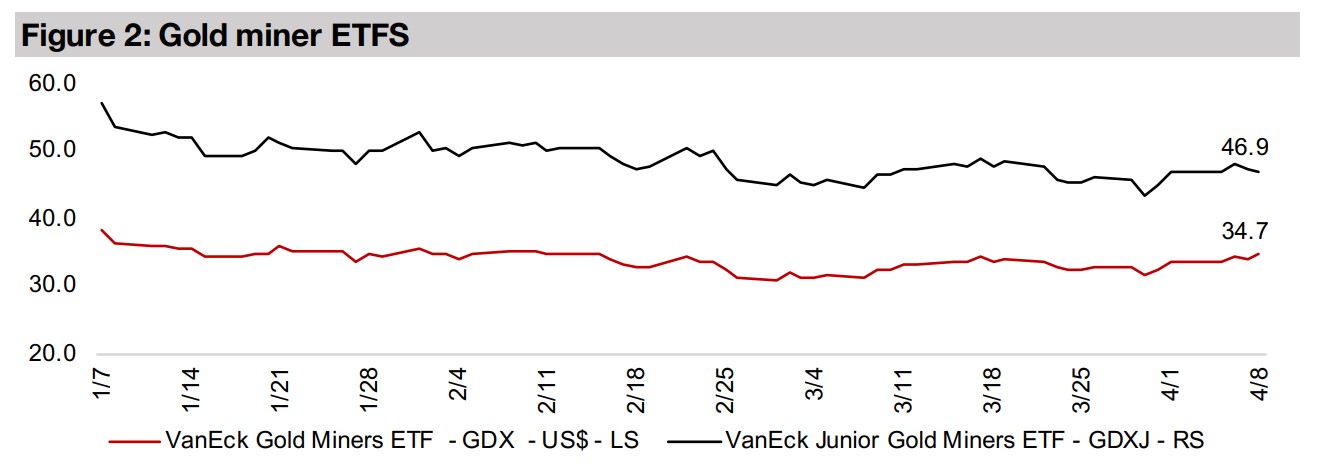
The gold producers rebounded this week, the juniors edged up, and the Canadian juniors mainly picked up. This week we look at the best gold drilling results of the larger Canadian gold juniors since 2021 on a g/t times width in metres basis.


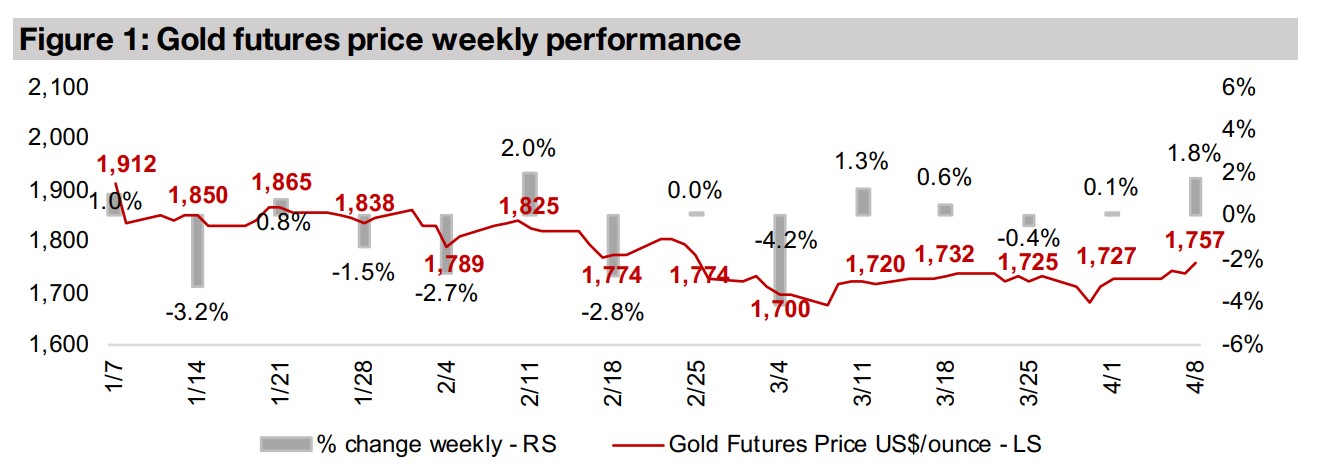
Gold moving above range of the past few weeks
The gold price rose 1.8% to US$1,757/oz, which saw it moving above a range that had held for the past several weeks, with an average of US$1,725/oz. While this may be attributed to the market viewing a fall in bond yields as a driver of gold, we note that gold had also been picking up last week, although bond yields were heading up. We have addressed in many of our previous weekly reports the issue of whether these rising bond yields should really be a major driver for gold. If the rise in yields is in fact driven by rising inflation expectations, as has been purported, then surely a case can be made than an inflation hedge like gold should be purchased, not sold off. Nonetheless, the market is acting as if a rise in yields should drive a sell-off in gold, and a decline should drive up the gold price. This week, we investigate the long-term relationship between gold and bonds yields, and actually we find that there is no real consistent correlation over time. Sometimes gold and bonds yields move up or down together, sometimes they move inversely and sometimes they appear to have no particular relationship at all.
Gold and bond yields over the past five decades
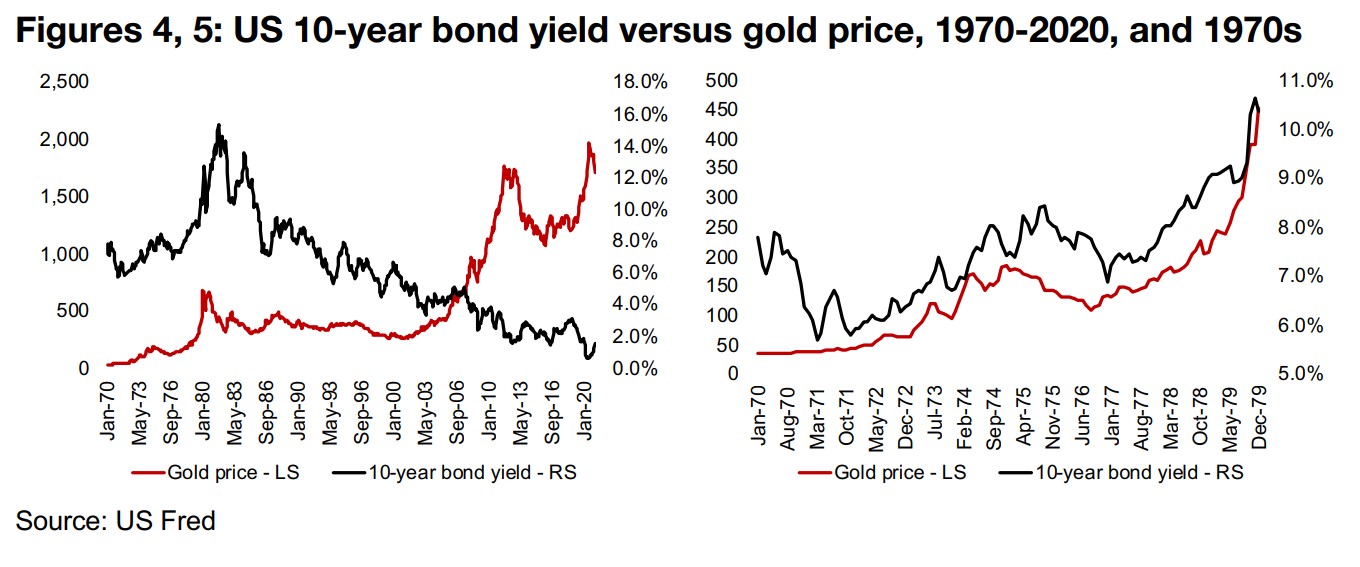
Figure 4 shows the long-term picture, from the 1970s, where the US went off the gold standard, and therefore the gold price began to move regularly, where previously it had been fixed over most of the 1900s, and moved only as policy makers very rarely changed the value. Since the 1970s, the long-term trend has been rising bond yields and gold through the 1970s, and then a decline in bond yields for the next forty years, while gold stayed quite flat until the mid-2000s, spiked in the early 2010s, collapsed to a bottom from roughly 2012 to 2018, and then spiked again. As Figure 5 does not really show the interaction between bond yields and gold over shorter periods, in the next several charts, we look at the relationship between the two by decade. Overall we see very different relationships between bond yields and gold between these decades, and even within the decades, there are significant changes in the relationship between the two.
Gold bond yields quite correlated in upward move in the 1970s
In the 1970s, gold and bond yields were clearly not moving in opposite directions, as is currently suggested by the market's recent price action, but rather they were strongly correlated (Figure 5). Gold and bond yields were rising and falling generally together, especially with the inflation spike from 1977 to 1979, which lead to both a surge in yields and gold. If inflation expectations are what is proposed to be driving yields, the 1970s chart supports the idea that gold could actually move up in the case of rising yields, not fall, especially if the yield rise is inflation-based, as in the 1970s.
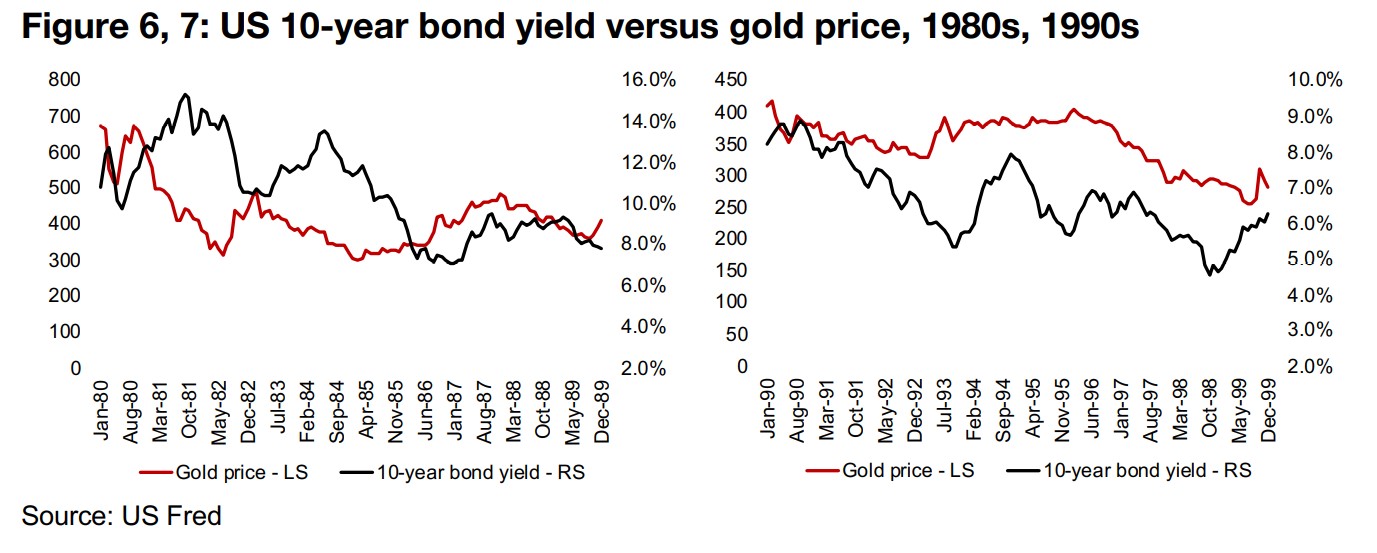
Gold and bond yields sees many 'modes' in 1980s and 1990s
In the 1980s, there are periods where bond and gold yields appear to be inversely correlated, with bond yield rises driving down gold in 1980 and 1981, falling yields driving up gold in 1982 and then rising yields again leading to declines in gold from 1983 to 1986 (Figure 6). However, from 1987, gold and bond yields again start to move in tandem. However, from the 1970s and 1980s, there does appear to be some kind of general relationship between the two, as they tend to either move together, or inversely. However, this does not give us much of a useful tool for prediction, as it would not be clear in advance which of these two 'modes' the relationship would be in at any time. In the 1990s, another, different trend emerges, with big swings in bond yields having very little effect on gold, which trades in a quite tight range. Then at the end of the 1990s, bond yields and gold again trend down together (Figure 7).
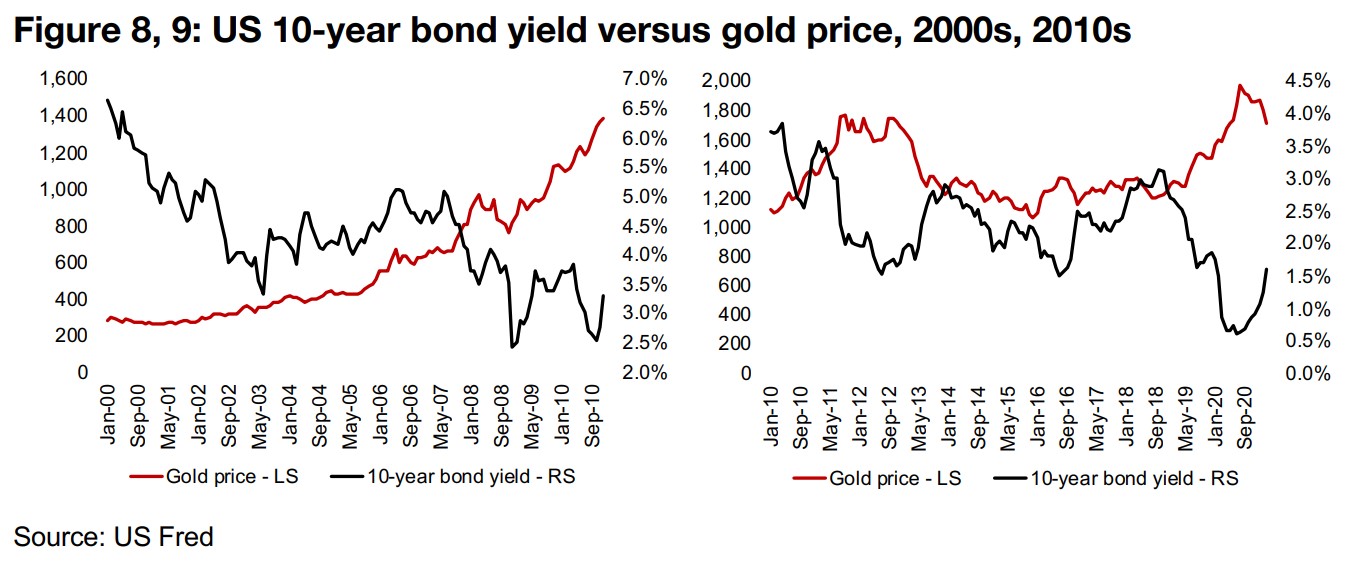
The 2000s start and end with market crash driving yields and gold
Through the 2000s, there was a general decline in bond yields overall, with a rapid fall in the recession from 2000 to 2003, a rise between 2004 and 2008, and then a drop into the financial crisis (Figure 8). Gold did not seem to really be driven by these shorter-term bond yield moves, and spent the decade in an almost uninterrupted rise, as the economy, and eventually interest rates, heading into 2007-2008 began to pick up, and as there was major inflation, but this was all concentrated in the housing market, which eventually precipitated the 2008 market crash.
The 2010s a reaction to 2008-2009 crash, then a late decade boom
This brings us to the most recent decade, with bond yields falling through 2010 to 2011 and gold rising, in the wake of the financial crisis (Figure 9). As measures by the authorities to correct the crisis began to kick in, yields rose from 2012 to 2013, and gold declined. Bond yields then declined in 2014-2016 and picked up from 2017 to 2019, but gold remained basically flat over this entire period, not appearing to be driven by gold. From 2019 to 2020, there was a clear inverse relationship, with bonds declining and gold soaring, and then in recent months, yields picking up and gold declining.
Gold and bond yield movements are really not very correlated
So that is a lot of trends and sub-trends between US bond yields and gold, and the final conclusion is - there is no consistent relationship between the two. Sometimes gold seems to track yields, and in other periods yields seem to follow gold, at other times they move inversely to each other, and in other periods, one data series is flat while the other sees substantial movements. Now, even though this is the case, we still expect that in the short-term, the market could well continue to trade as if this relationship holds, as it has for the past several months, and a further rise in yields could keep pressuring gold. However, long-term, rising yields, especially if they are based on rising inflation expectations, or actual inflation coming through, could well drive gold up, not down, as we have seen in several historical periods. In short, we suggest that over the medium to long-term, that investors don't really have much to fear from bond yield movements particularly in relation to any gold holdings.
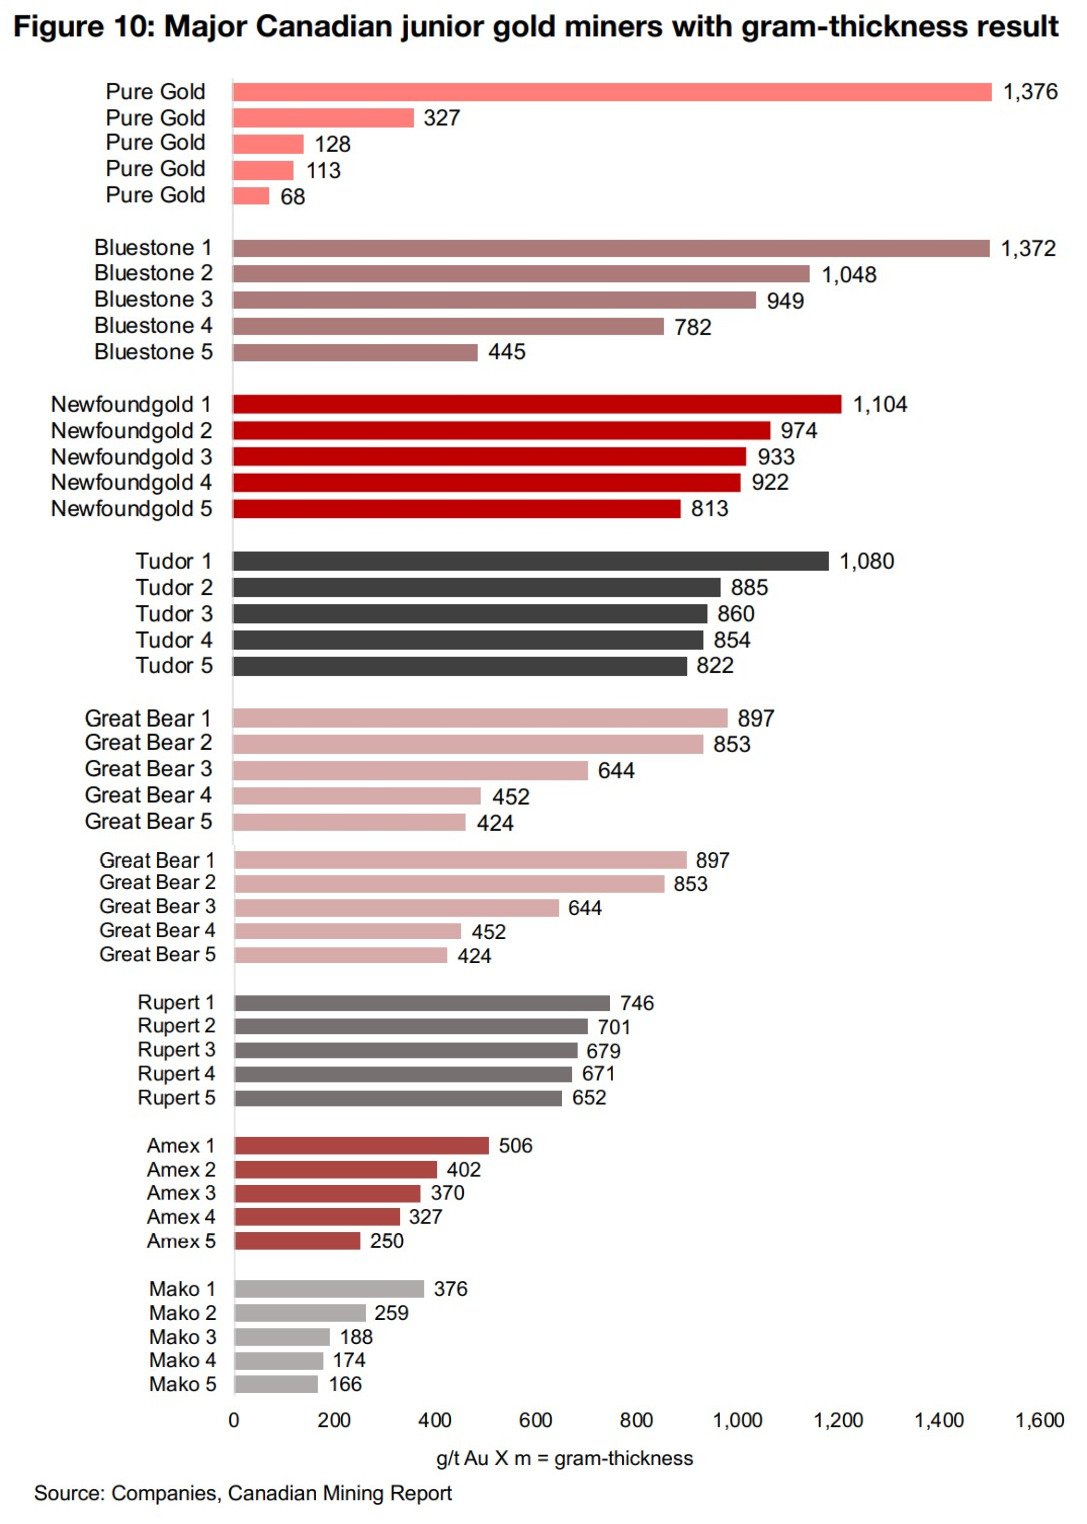
The best g/t times metres width results over the past year
Last we took a look at the major Canadian gold juniors that have been in active
exploration campaigns over 2021, and showed the best single drilling results so far
this year. This week we look at the exploration results since the start of the year, using
a measure of g/t Au times the meter width of the sample, for a 'grams-thickness'
measure. While this does make all the gold samples comparable, it does obviously
hide the balance between the grade and size, and a very high grade over a very small
distance can have the same reading as a very low grade over a very substantial
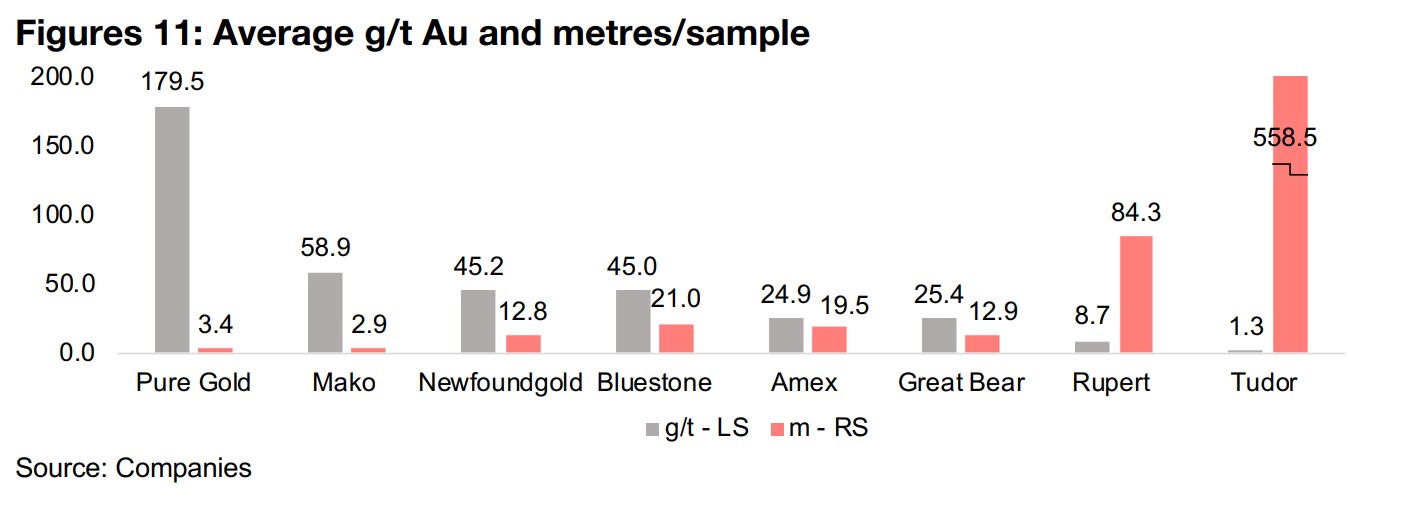
distance. The best single result is from Pure Gold (Figure 10), although beyond the
top result, the other top five are not outstanding, with this single result boosting the
average grade to the highest of the group (Figure 11). However, other lower results
are not such a major issue for the company, as it has already reached early production
at its Pure Gold Mine in Red Lake, Ontario.
Bluestone Resources, operating Cerro Blanco in Guatemala had the second
strongest single result a series of other strong results, with a combination of
reasonably high average grades and widths. Newfoundgold, operating the
Queensway project in Newfoundland also had a set of very strong results, with an
average grade similar to Bluestone, but with higher widths. Results from Tudor,
operating Treaty Creek in the Golden Triangle of British Columbia were also strong,
but the average grade was the lowest of the group, but with by far the highest average
sample width. Great Bear Resources, operating the Dixie Project, also in Red Lake,
Ontario, saw reasonably strong results, with reasonably strong grades and moderate
widths. Rupert Resources, operating Pahtavaara in Finland, is showing average
grades but over high widths, Amex, operating Perron in Quebec, moderate grades
and widths, and Mako, operating San Albino in Nicaragua, with the lowest results of
the group, with high grades, but low average widths.
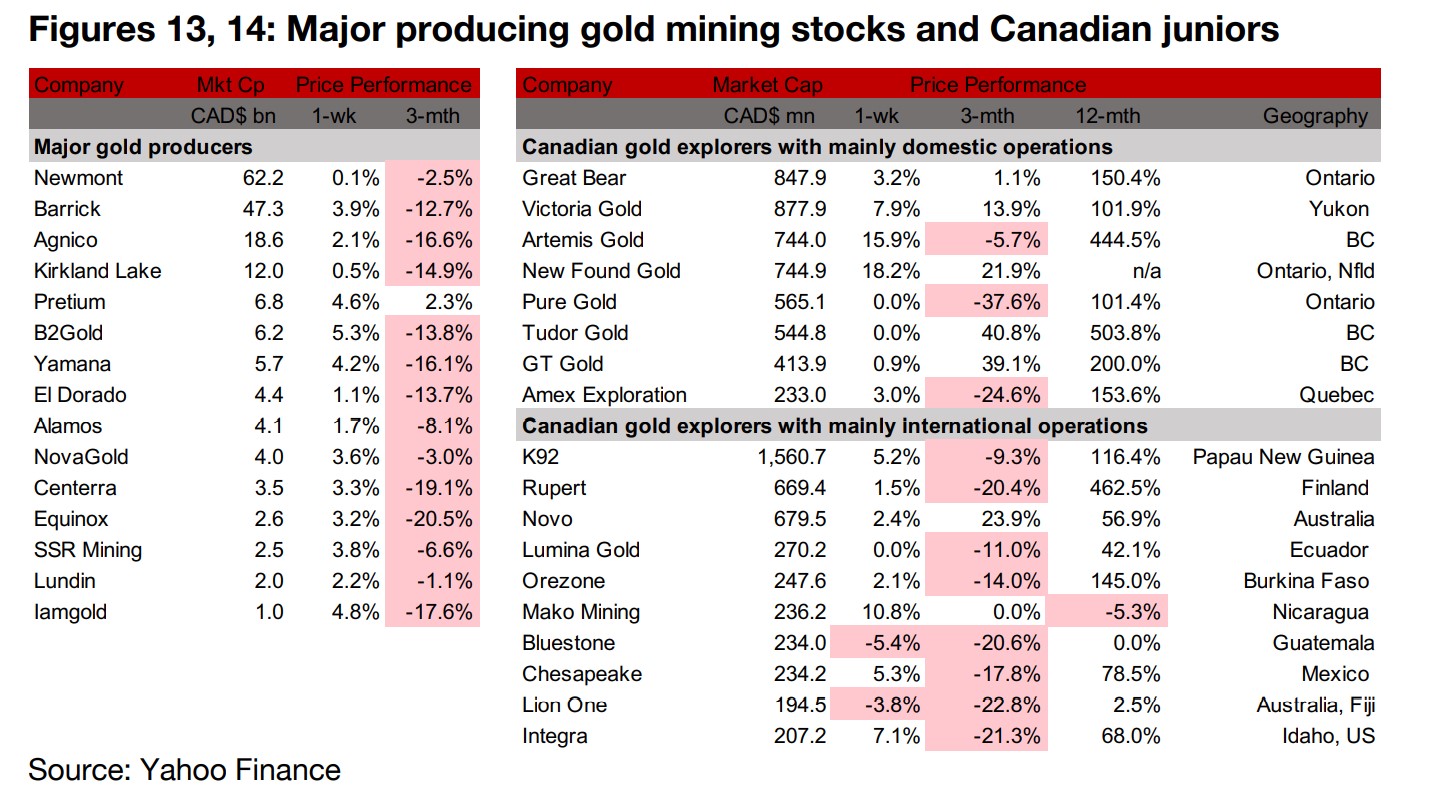
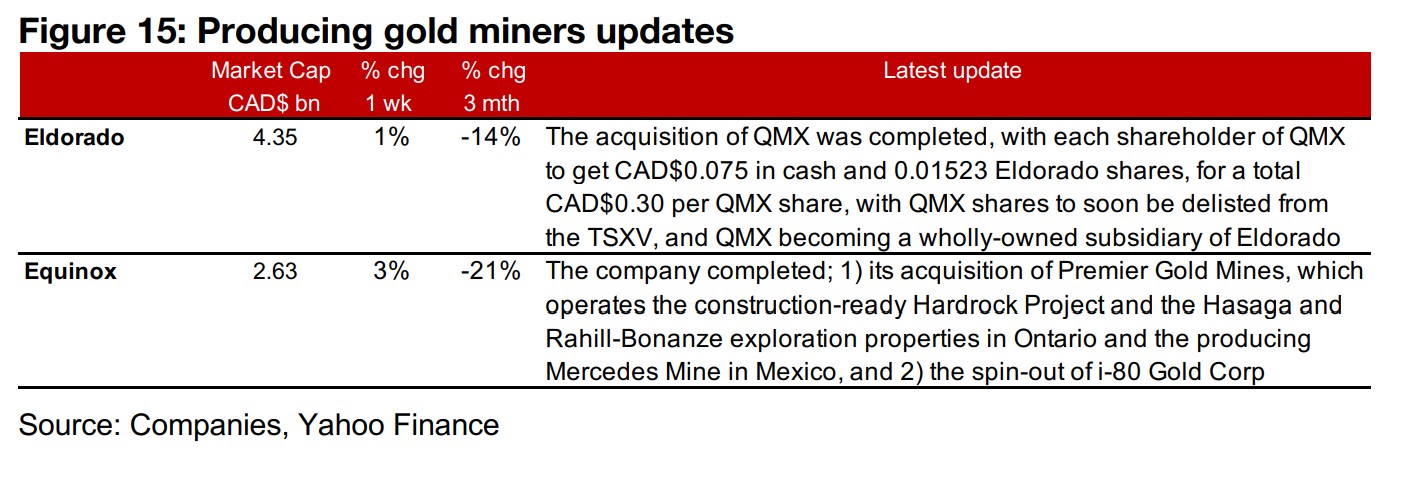
Producing miners all up on gold rebound
All of the large gold producers were up this week on the biggest bounce in the gold price in a few months (Figure 13). Eldorado announced that it completed the acquisition of QMX, and Equinox also completed an acquisition, of Premier Gold Mines, including a spin-out of i-80 Gold Corp (Figure 15).
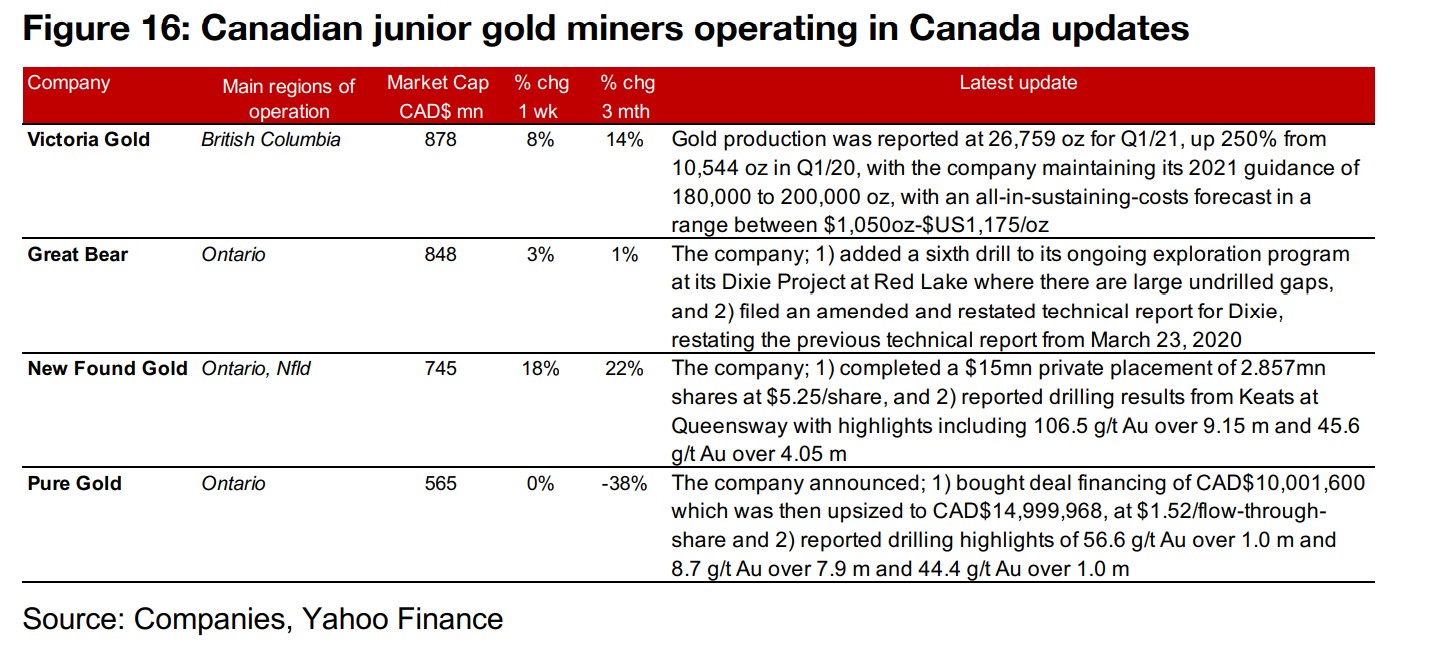
Canadian juniors mainly rise with gold boost
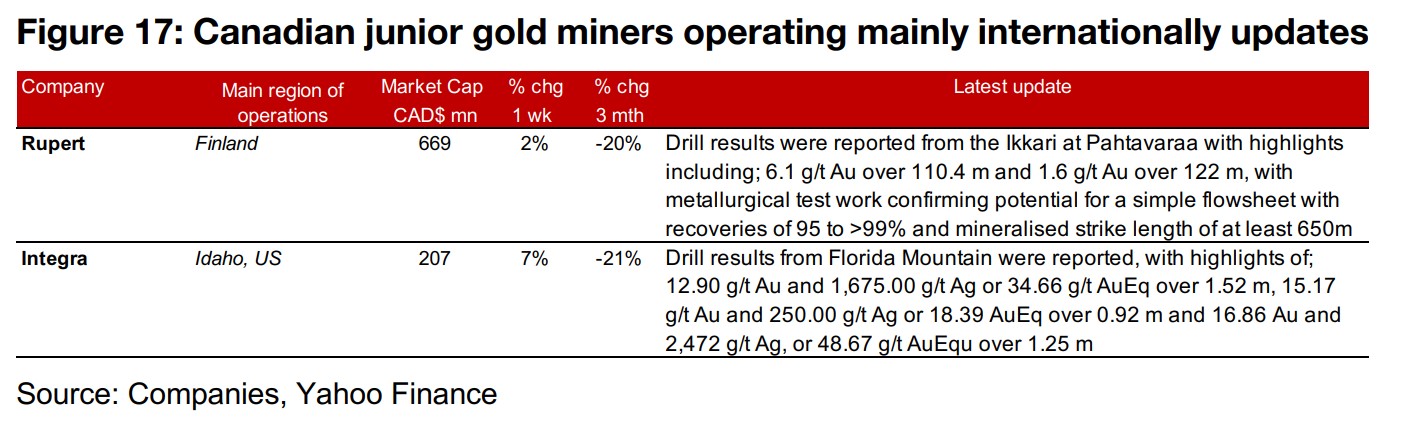
The Canadian juniors were mainly up on the gain in the gold price (Figure 14). Victoria Gold reported Q1/21 gold production and production guidance for the year, Great Bear added a sixth drill to its ongoing exploration to Dixie, and filed an amended and restated technical report for Dixie. Newfoundgold completed a $CAD15mn private placement and reported drilling results from the Keats zone, and Pure Gold announced a bought deal financing upsized to CAD$15mn from CAD$10mn and reported drilling results from its main project (Figure 16). Rupert and Integra reported drilling results from Pahtavaara and Florida Mountain (Figure 17).
Disclaimer: This report is for informational use only and should not be used an alternative to the financial and legal advice of a qualified professional in business planning and investment. We do not represent that forecasts in this report will lead to a specific outcome or result, and are not liable in the event of any business action taken in whole or in part as a result of the contents of this report.