
April 01, 2024
In light of gold’s continued big move, this week we look at a range of key relative value metrics for the metal including its ratios with silver, copper, the money supply, oil and the commodities index, which overall do not indicate excessive valuation.
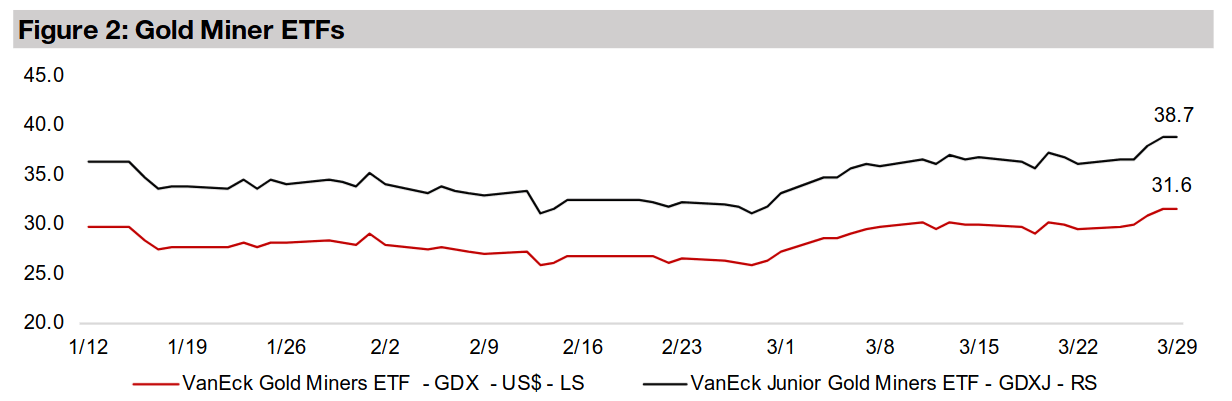
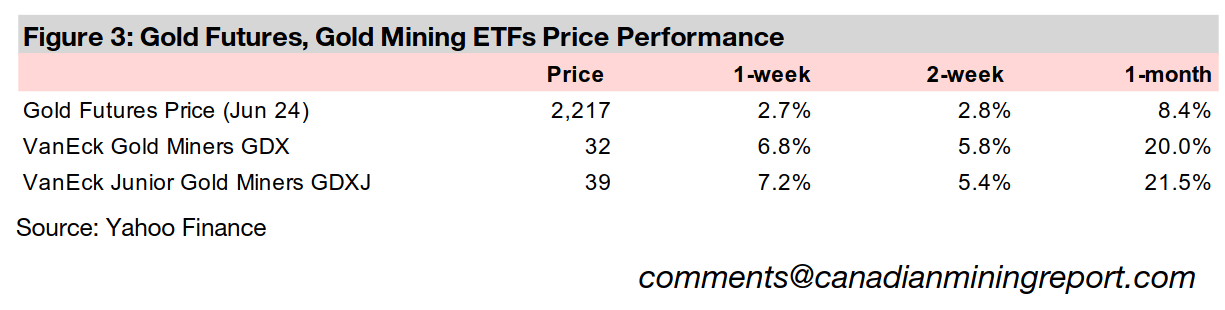
While gold stocks had lagged the gains in the gold price since late 2023, the rise in the metal is finally starting to be priced in, with the GDX and GDXJ up 6.8% and 7.2% this week, respectively, and rising 20.0% and 21.5% in March 2024.


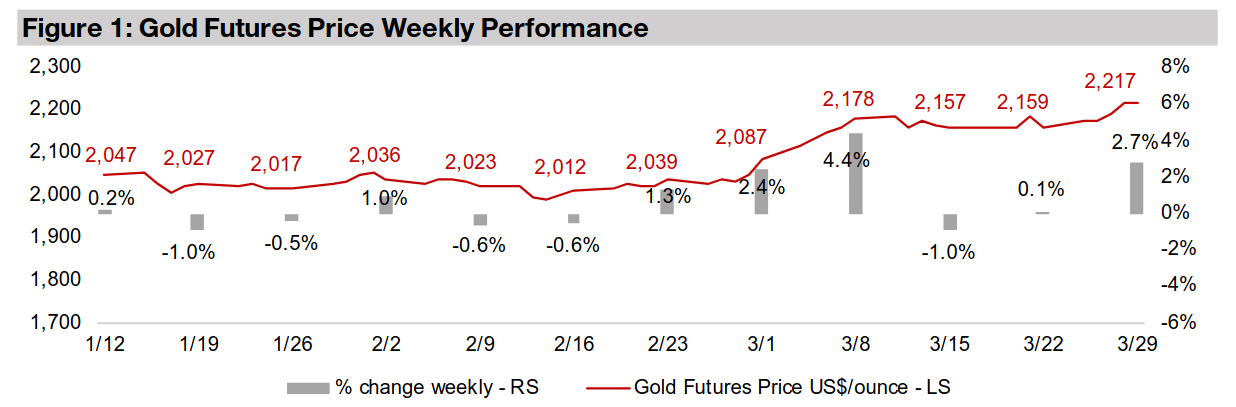
Gold rose 2.7% this week to US$2,217/oz, continuing up to new all times highs, as
the market has started to finally aggressively price in a global rate cutting cycle by
the largest developed economies which is widely expected to start by the middle of
this year. There was an early sign last week this may have already started, with the
Swiss National Bank unexpectedly cutting rates, the first major global central bank to
do so this cycle. While there are some emerging economies, including Argentina,
Turkey and Nigeria, still hiking rates, they are all fighting extreme price rises verging
on hyperinflation and their currencies have collapsed as a counterbalance.
The main economic release this week was the US personal consumption expenditure
(PCE) price index on Friday, which came inline with market expectations, but did not
yet affect markets which were already closed for the shortened holiday week. As the
PCE price index is a key inflation gauge watched by the US Fed, a hot reading could
have increased concerns rate cuts would be delayed. Currently a US cut is largely
expected by June 2024 with a 62.1% probability and the European Central Bank is
also anticipated to reduce rates the same month.
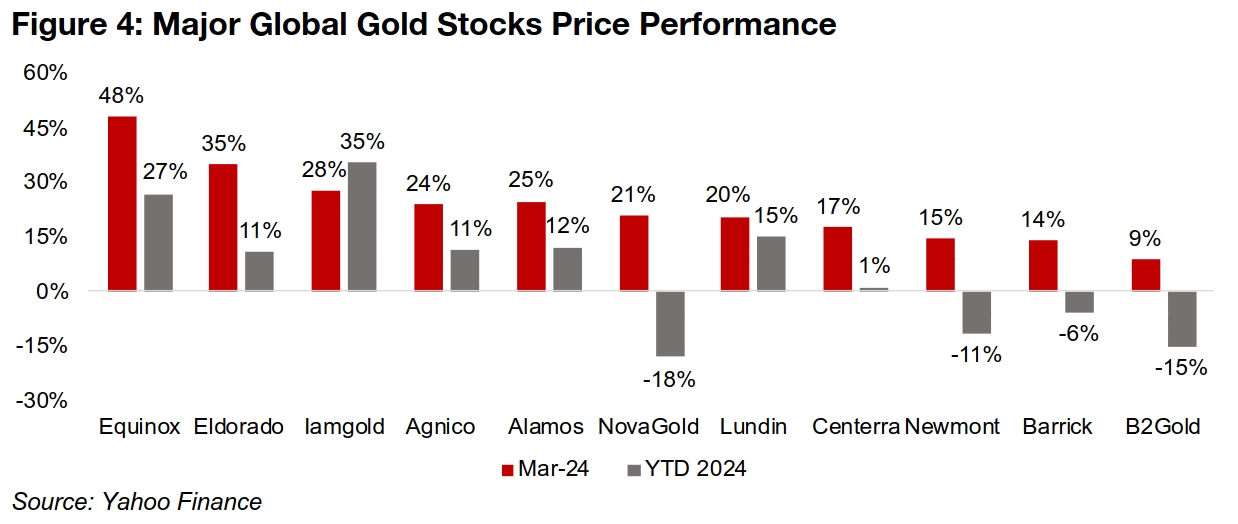
While we have highlighted so far this year how gold stocks had been lagging the rise in the gold price, they have finally started to gap up over the past month. The GDX ETF of gold producers rose 6.8% and the GDXJ ETF of gold juniors 7.2% over just the past week, increasing the gains for March 2024 to 20.0% and 21.5% respectively. This has been propelled by some extreme gains for many major gold producers, with Equinox Gold up nearly 50% in just a month, Eldorado Gold gaining 35% and Iamgold rising 28% (Figure 4). Agnico Eagle, Alamos Gold, Novagold and Lundin Gold have all increased over 20%, relative ‘laggards’ Centerra and industry giants Newmont and Barrick are up well into double digits, with B2Gold seeing the only single digit gain.
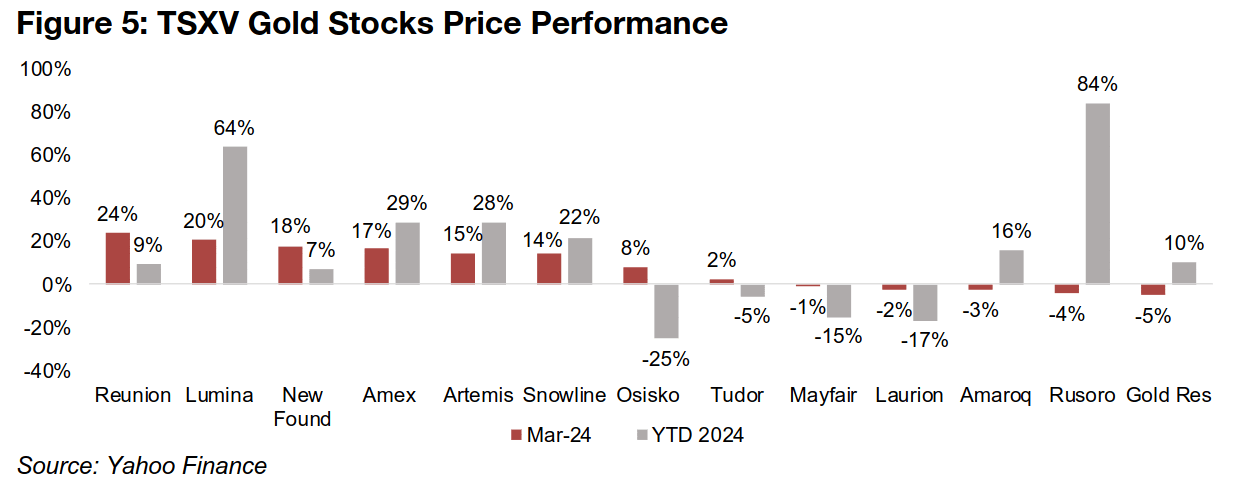
While the larger cap TSXV gold stocks have not seen such uniform or strong gains as the large producers, many of the group are still up substantially. Reunion Gold, Lumina Gold, New Found Gold, Amex Exploration, Artemis Gold and Snowline Gold all are up by double digits in March 2024, and Osisko Development by mid-single digits (Figure 5). The rest of the group have made low-single digit losses, showing that investors have been more discerning in the small cap versus large gold spaces.
As the recent rapid jump in gold raises the question of how much further the move can go, and how fast, this week we look at several measures of the metal versus other assets to gauge how expensive the price has become in relative terms. These include the gold to silver and copper ratios and gold versus the global money supply, oil, and CRB commodity index. Overall these ratios do not indicate gold is at excessive levels, and range from moderately above, to near inline with, recent averages.
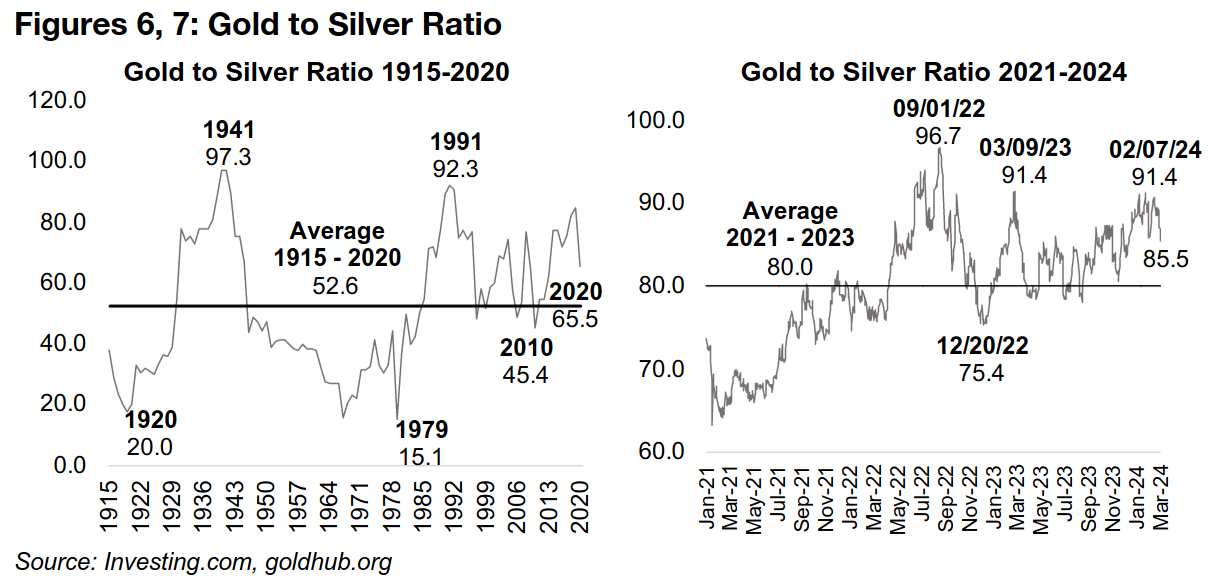
While silver is the certainly closest comparable asset to gold as both are heavily
influenced by monetary factors, silver has a much higher proportion of its demand
from industrial uses than gold, driving considerable swings in the ratio between them.
At 85.5x, the ratio has pulled back from early-February 2024 highs of 91.4x towards
the average since 2021 of 80.0x (Figure 7). This has come as gains in silver, up 7.9%
in March 2024, have outpaced the 7.2% rise in gold. The ratio indicates that gold is
not substantially overpriced versus silver based on recent trading, and far below
peaks around 97.0x which tend to indicate excessive relative gold prices (Figure 6).
However, the long-term average of the ratio from 1915 to 2020 is much lower at 65.0x,
although this includes huge swings caused by the extreme historical events of the
1920s, 1940s and 1970s. Even including just the much less volatile period since 1990,
the average is only slightly higher, at 69.0x. This suggests that somewhere around
the 70.0x level is likely a good proxy for a ‘balanced’ gold versus silver price, and
silver could therefore be considered undervalued long-term with the ratio near 85.0x.
Given our expectations for continued strength in gold, we expect any further decline
in the ratio short-term would likely come from a rise in the silver price.
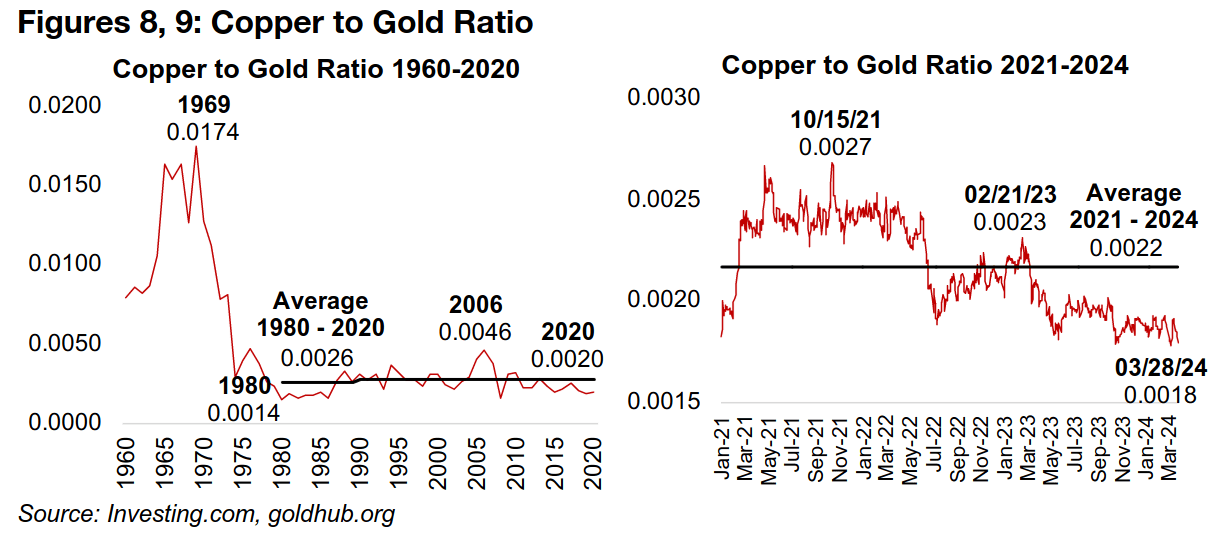
Compared to the gold to silver ratio, the copper to gold ratio is a purer comparison
of the market’s industrial versus monetary outlook, with the former mainly consumed
in production and the latter held as a store of value. The ratio has dropped to 0.0018,
below the average since 2021 of 0.0022, and down from a peak of 0.0027 in October
2021, suggesting a moderate overvaluation of gold short-term (Figure 9). Excluding
the extremely high values of the 1960s and 1970s, and taking the average from 1980,
the ratio has averaged 0.0026, also indicating that gold maybe somewhat overvalued
versus copper (Figure 8).
This partly could be justified by rising recession fears that have weighed on copper
from the demand side. However, there have been recent concerns also from the
supply side, with slowing output from China, which could offset this, and have driven
a recent surge in the copper price. As with silver, if the copper to gold ratio is to revert
back up towards its short or long-term averages, we expect this this is more likely to
come from a gain in copper than a slide in gold.
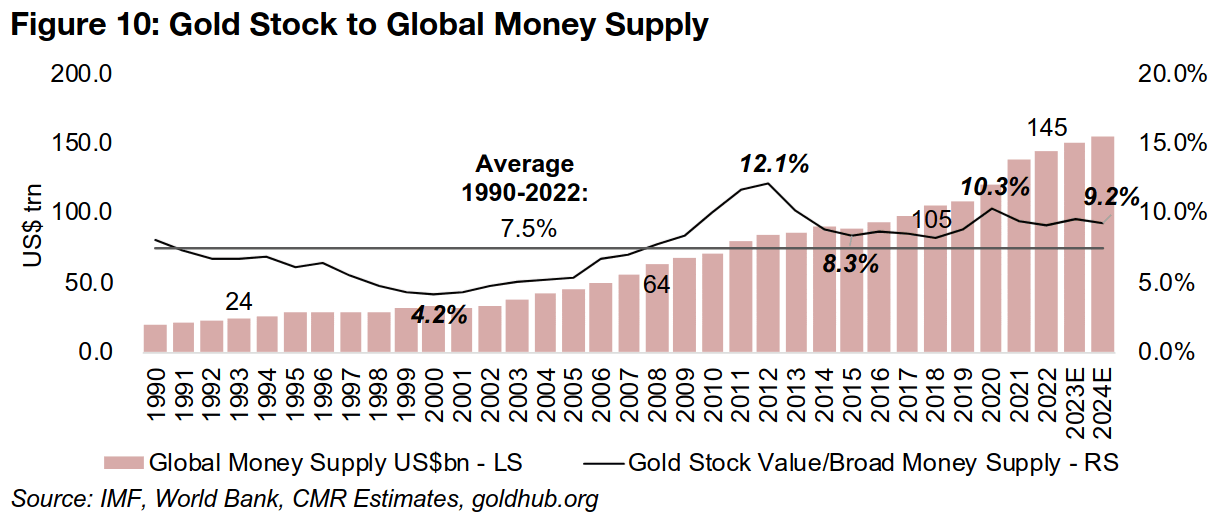
Another key comparable for gold is fiat currency, which can be measured as a ratio
of the value of the above ground stock of gold versus the global money supply. The
pace of growth in the global money supply has accelerated over the past twenty years,
especially driven by the global financial crisis in 2008-2009 and the global health crisis
of 2020-2021. It took fifteen years from 1993 to 2008 for the global money supply to
add US$40trn, only ten years to add another US$40trn through to 2018, and then just
four years to gain an additional US$40trn to reach US$145trn by 2021 (Figure 10).
Overall the value of the gold stock has kept pace with these moves in the global
money supply over the long-term, with the ratio averaging 7.5% from 1990-2021 and
ranging from 4.2% in 2000 up to a high of 12.1% in 2012. The range has been much
tighter over the past ten years, however, between 8.3% to just 10.3%, and we
forecast it at 9.2% for 2024. While this is slightly above the average since 1990, it is
far from bubble territory, which was reached in 1980, when the ratio hit 30.2x. It was
still at 18.7x in 1983 and only reached the range shown in Figure 10 in the mid-1980s.
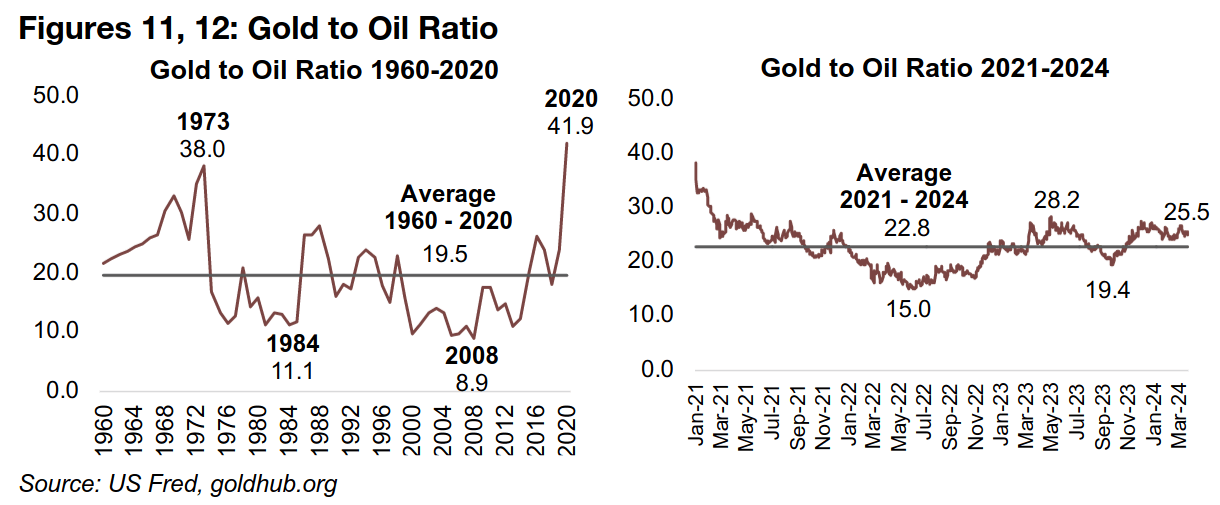
Another asset often compared to gold is oil, which while not having the three-
thousand-year history of the metal, has still been a key global commodity for about
two hundred years. Using the price of one ounce of gold divided by the brent crude
price for one barrel of oil, the ratio is currently 25.5x, moderately above the average
since 2021 of 22.8x (Figure 12). The long-term ratio is only slightly lower, at 19.5x
from 1960-2020, suggesting that the current ratio is reasonably balanced (Figure 11).
The surge to 41.9x in 2020 was driven by a plunge in the oil price to US$22.7/barrel
in March 2020 on the global health crisis, a twenty-year low from which it rapidly
recovered (Figure 13). Short-term there is potential for the ratio to rise further if global
economic growth slows, further reducing a demand for oil already hit by the growth
in electric vehicles. However, longer-term the oil price could surprise to the upside,
as investment in the sector has declined, which will eventually cut supply. Also,
passenger vehicles are only a quarter of oil consumption, so the shift to EVs still
leaves 75% of oil demand unaffected, and this will continue to grow long-term.
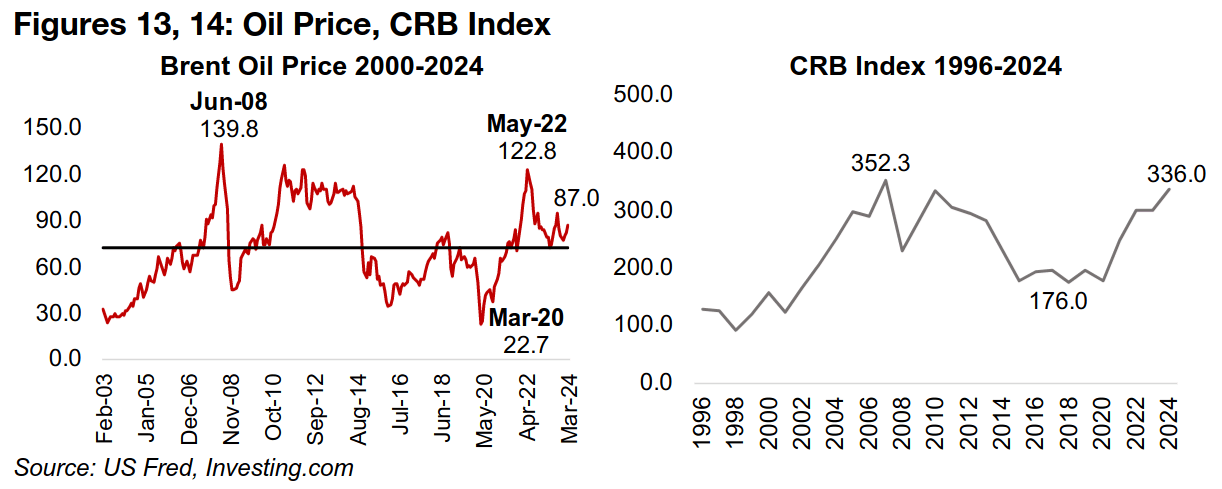
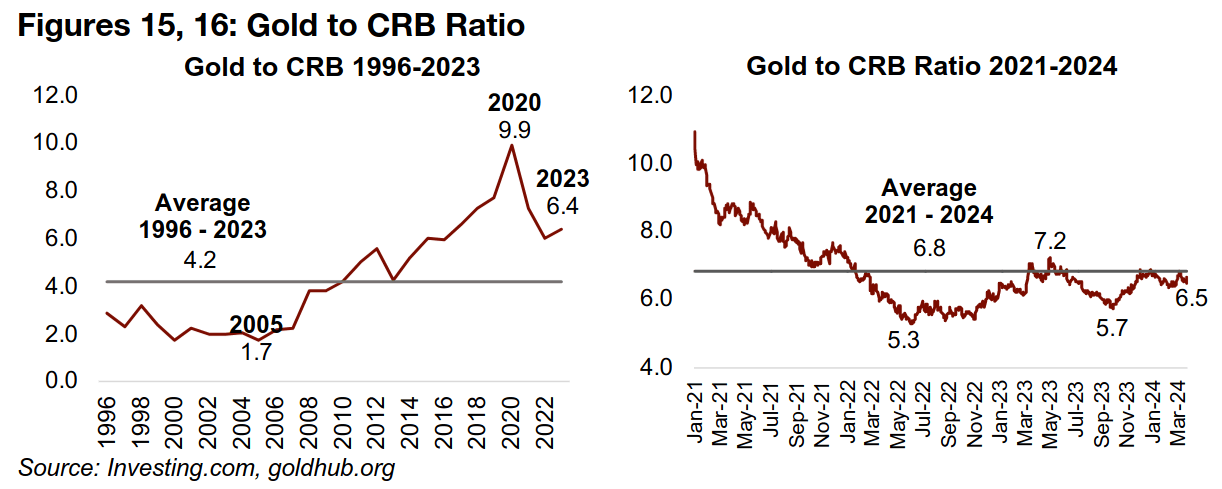
In addition to the commodity oil, gold can also be compared to the broader CRB index, which includes nineteen major commodities (Figure 14). The ratio of gold to the CRB Index is at 6.5x, and it has converged towards the average since 2021 of 6.8x (Figure 16). Longer-term the ratio has averaged just 4.2x since 1996, ranging from just 1.7x in 2005 to a peak of 9.9x in 2020, suggesting potential for the broader commodities complex to gain versus gold (Figure 15). However, this might not necessarily imply a drop in gold as much as a rebound in other commodities.
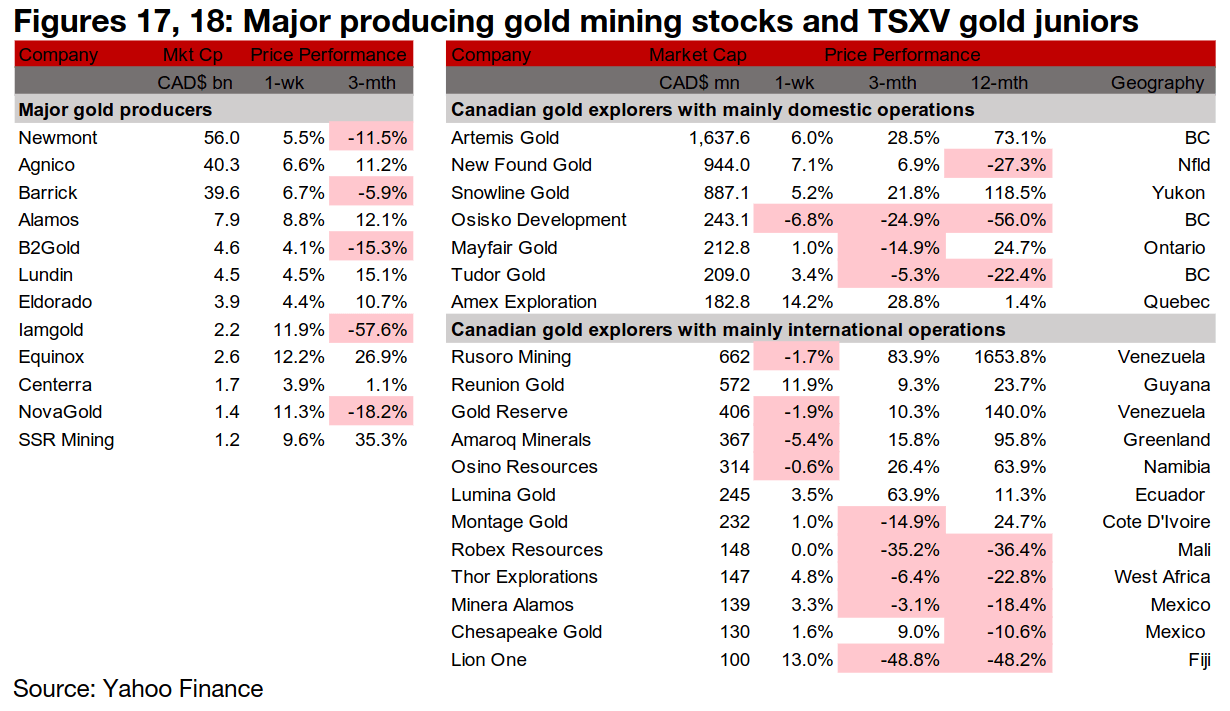
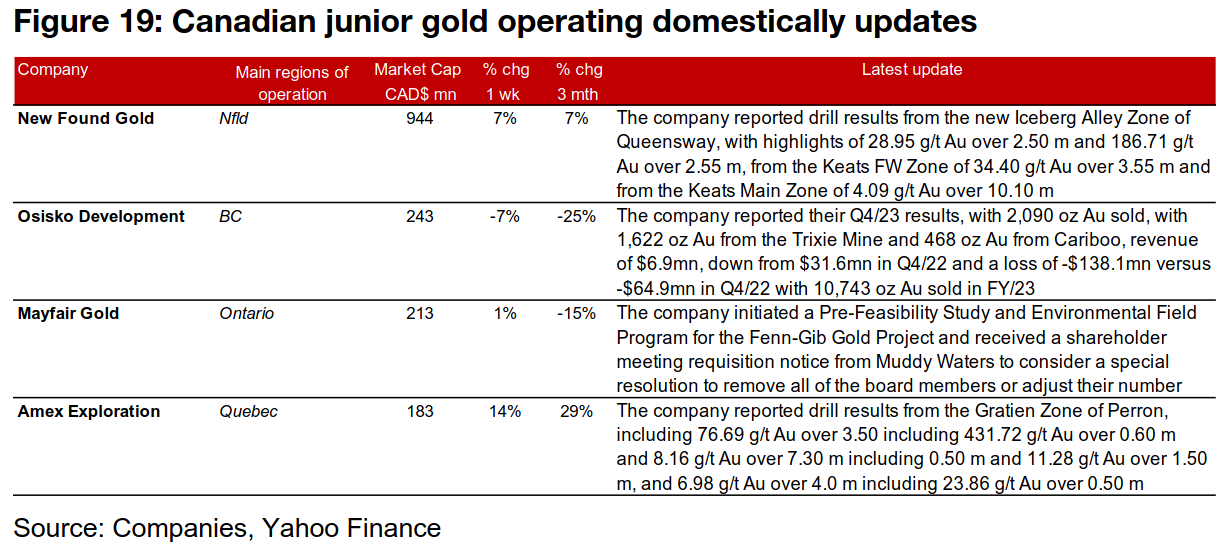
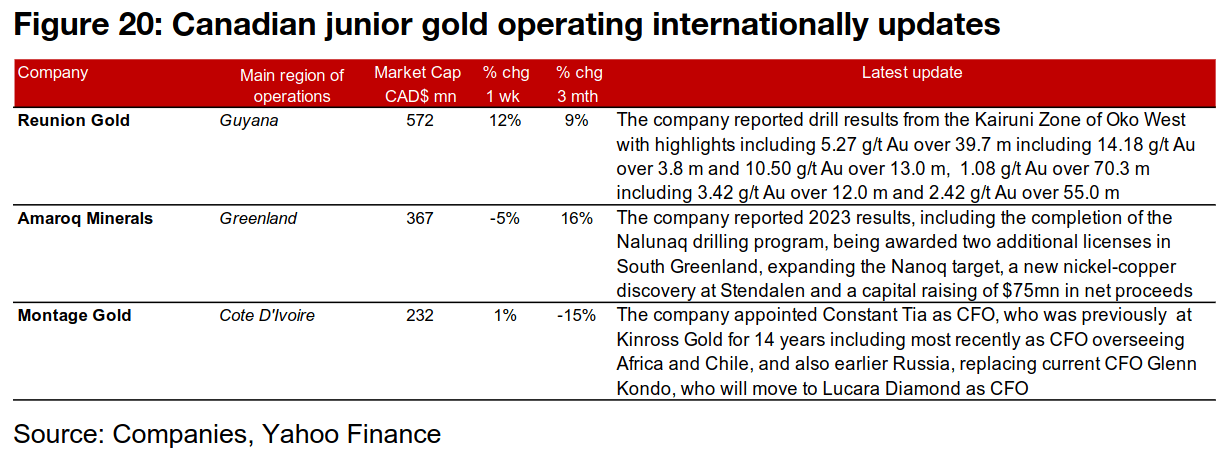
The large producers all rose substantially and most large TSXV gold stocks gained (Figures 17, 18). For the TSXV gold companies operating domestically and New Found Gold reported drill results from the Iceberg Alley and three Keats Zones of Queensway, Osisko Development reported Q3/24 results. Mayfair Gold initiated a PFS and EFP for Fenn-Gib and received a shareholder meeting request from Muddy Waters and Amex Exploration released drill results from the Gratien Zone of Perron (Figure 19). For the TSXV gold companies operating internationally, Reunion Gold reported drill results from the Kairuni Zone of Oko West, Amaroq reported 2023 results and Montage Gold appointed a new CFO (Figure 20).
Disclaimer: This report is for informational use only and should not be used an alternative to the financial and legal advice of a qualified professional in business planning and investment. We do not represent that forecasts in this report will lead to a specific outcome or result, and are not liable in the event of any business action taken in whole or in part as a result of the contents of this report.
Author
Ben McGregor authors the Weekly Roundup at CanadianMiningReport.com, providing sharp analysis of the metals and mining sector. With a talent for spotting trends, Ben distills complex market shifts into clear, engaging insights on TSXV junior miners. His weekly updates cover gold, copper, uranium, and more, blending data-driven perspectives with a knack for identifying opportunities. A vital resource for investors, Ben’s work navigates the dynamic junior mining landscape with precision.