
July 31, 2020
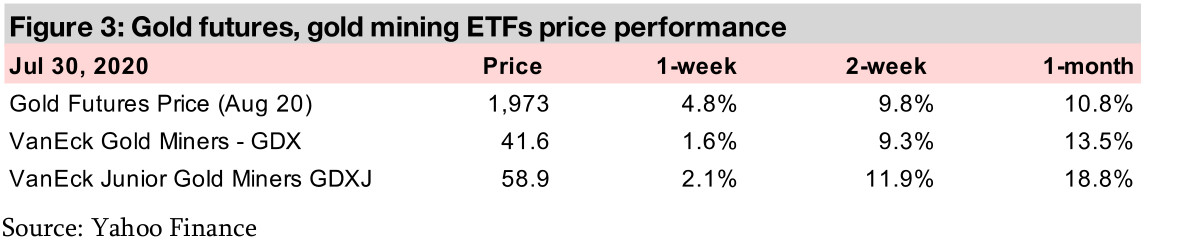
The gold futures surged to historical highs this week, peaking at US$1,995/oz intraday on Monday, before a pullback to end the week up 4.8% at US$1,973/oz, substantially above all-time intraday highs set in 2011 at US$1,921/oz.
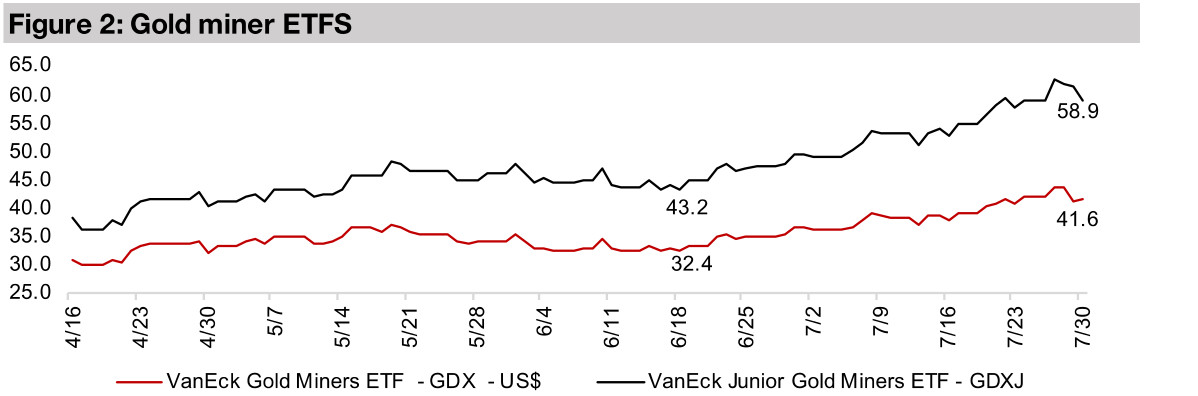
The GDX was up just 1.6% even as gold jumped, as investors could be anticipating a pull-back in gold after a two-week surge. The Q2/20 results season has started, with many companies seeing health crisis related declines yoy and qoq, as expected.
While global gold juniors rose this week, Canadian juniors remained mixed, as investors may be scrutinizing companies more closely after an extended run. Orezone, operating in Burkina Faso, with a mine near production, is In Focus this week.


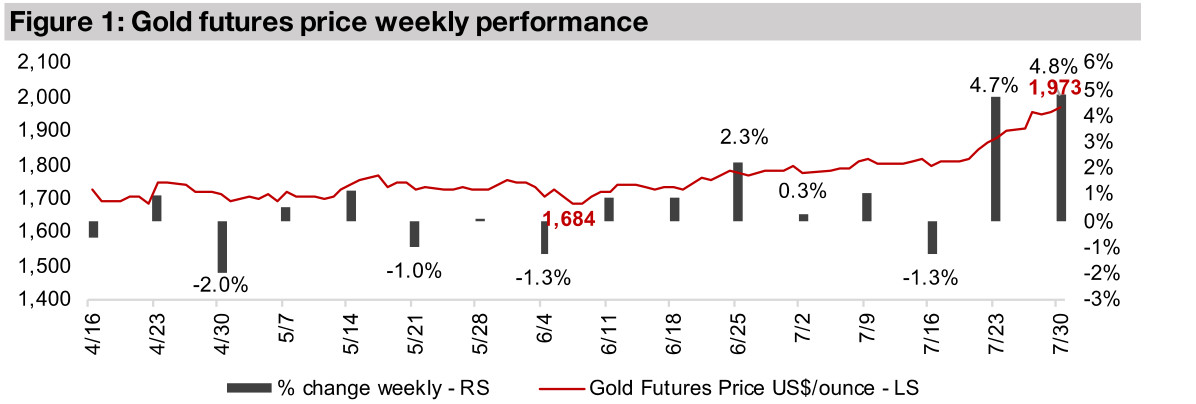
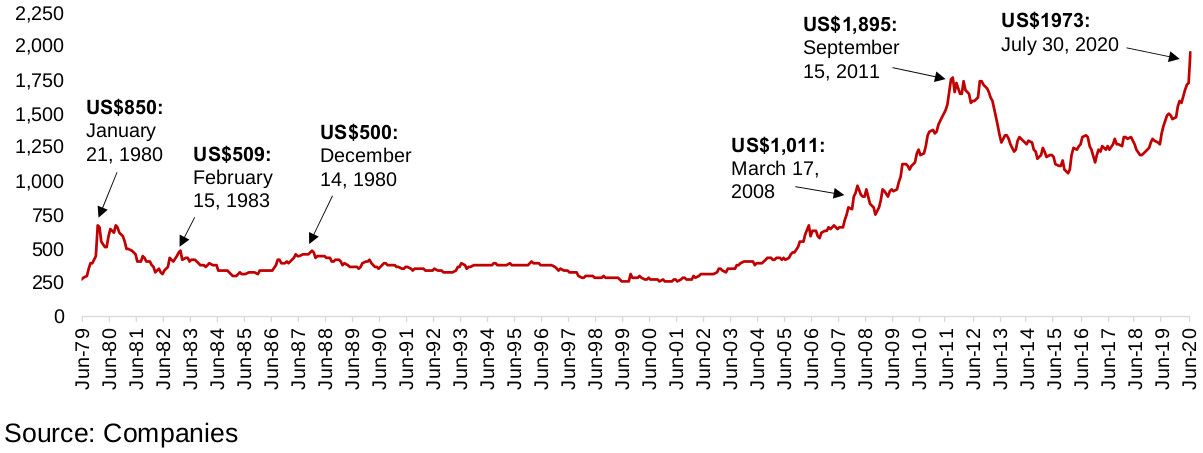
The gold futures price surged this week by 4.8% to US$1,973/oz, after reaching an intraday high of US$1,995/oz on Monday. Gold burst through its previous intraday all-time highs of US$1,921/oz set in September 2011, and spot gold closed as high as US$1,957/oz, well above the closing spot record of US$1,895/oz set on September 15, 2011 (Figure 4). This is the first time we have seen gold really start to go parabolic since its 2005 to 2011 run, and there would have to be a radical (and very unlikely) reduction in the current severe political, economic and health risks all in tandem to reverse this general uptrend through the rest of 2020, in our view. However, as can be seen Figure 4, even during parabolic moves in the past, there have been many short-term retracements in the gold price, and we would not be surprised if gold sees some resistance at the US$2,000/oz level, although we note that just two weeks ago, we were suggesting that US$1,900/oz might see some resistance, and gold proceeded to soundly trounce that level.
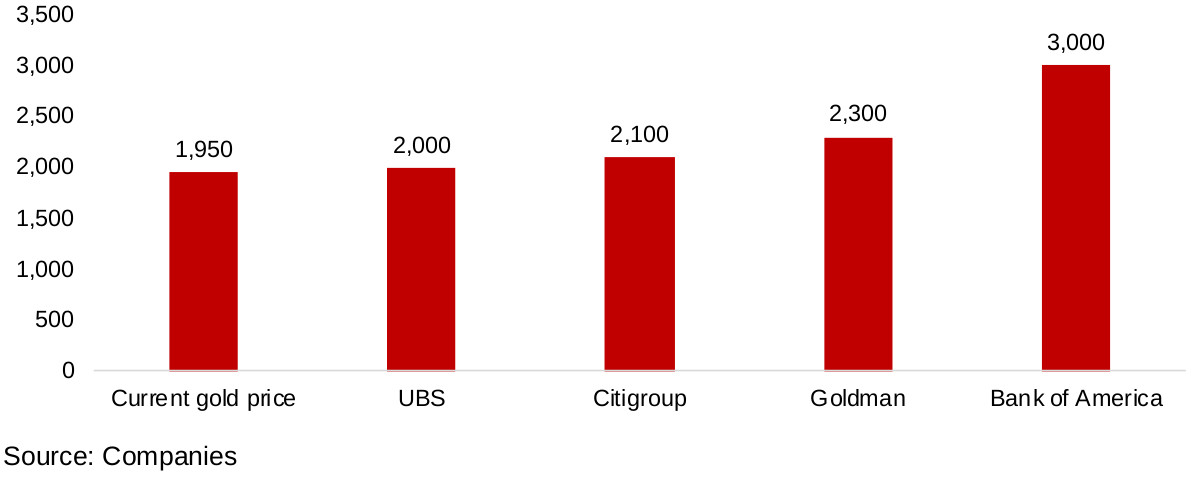
Analysts from major investment banks are now targeting a gold price over the next twelve months at a minimum of US$2,000/oz, ranging up to US$3,000/oz for the most aggressive target (Figure 5). Meanwhile, outside of the investment banks, some particularly pro-gold analysts are looking for US$5,000/oz-US$6,000/oz, and up to US$10,000/oz at the outside, but over a longer-term horizon of a few years. As we have often noted in previous reports, at anywhere above US$1,700/oz, most major producing mines in Canada are making decent margins. At US$2,000/oz margins are so wide that producing miners will have substantial surplus cash flow, providing the financial flexibility and reduced risk that allows for increased investment in the projects of junior miners. At the same time, at these elevated gold price levels, other providers of capital to the industry will also be encouraged to increase investment. We do not see the general upward trend for gold reversing in 2020, and a sustained US$2,000/oz would be more enough than to drive a boom in the junior gold mining industry. The Canadian junior miners are especially well positioned to attract capital, being located in a major hub for global mining finance, and we are already seeing evidence of a boom, with a major increase in private placements over the past four months, and also upsizing of some placements.
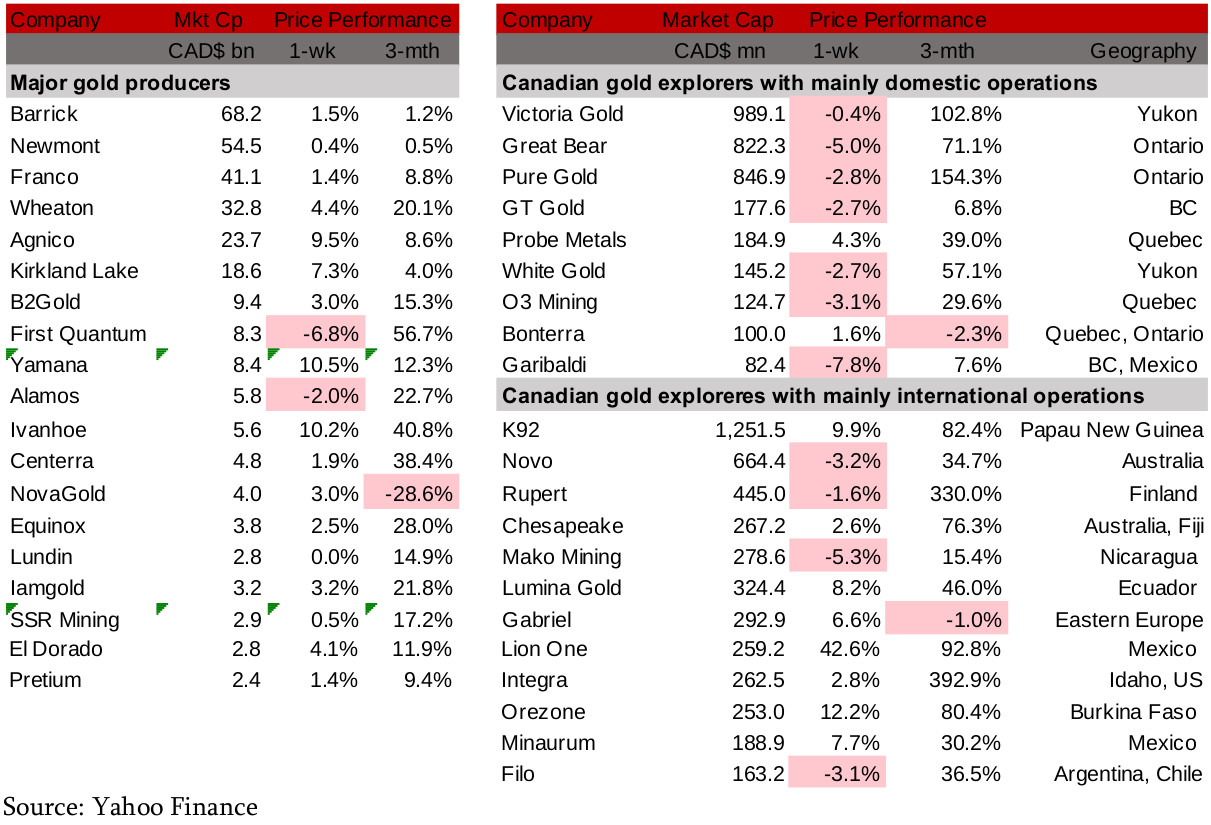
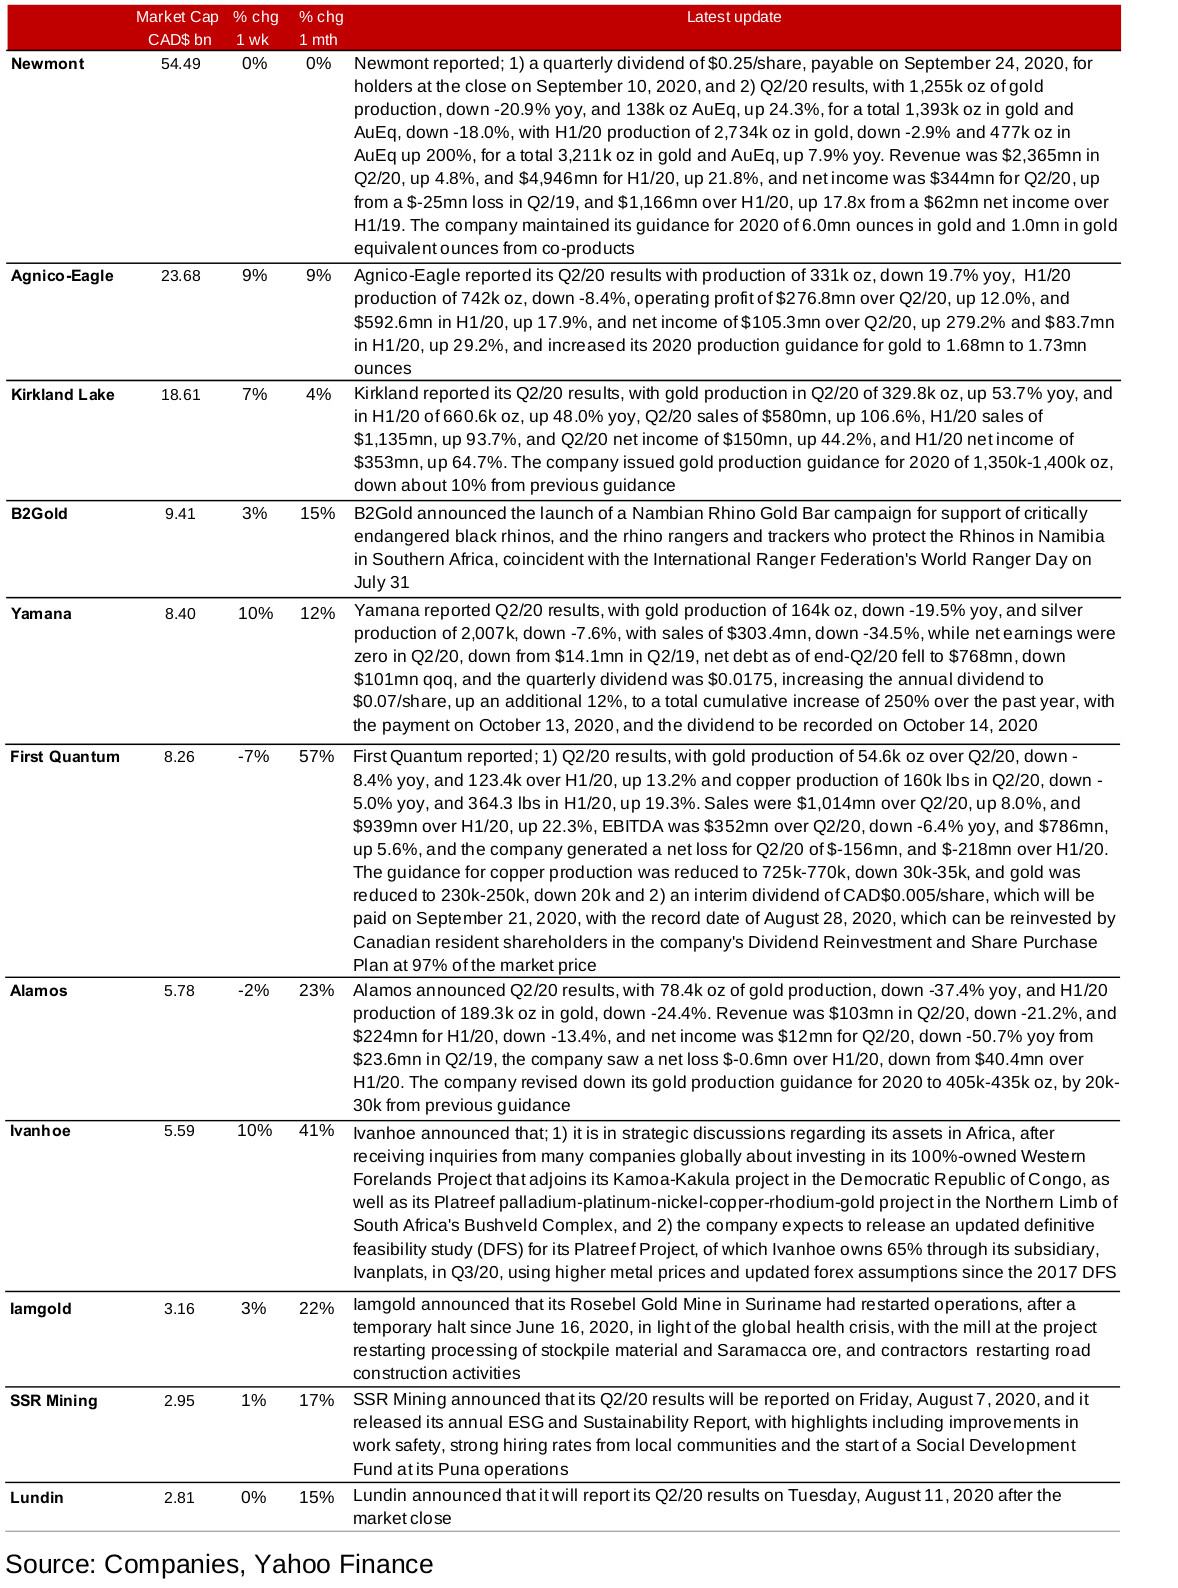
The producing miners ticked up, but not as much as gold, as investors seemed to be expecting a pullback after the recent surge (Figure 6). Several firms announced this Q2/20 results, as the reporting season begins, including Newmont, Agnico-Eagle, Kirkland, Yamana, First Quantum and Alamos, with many seeing a relatively weak quarter, as expected, because of the global health crisis (Figure 8). Other news included B2Gold's support of Black Rhinos, Ivanhoe considering the sale of core assets, Iamgold restarting operations at Rosebel, SSR releasing its Q2/20 results date and its sustainability report, and Lundin reporting its Q2/20 results date.
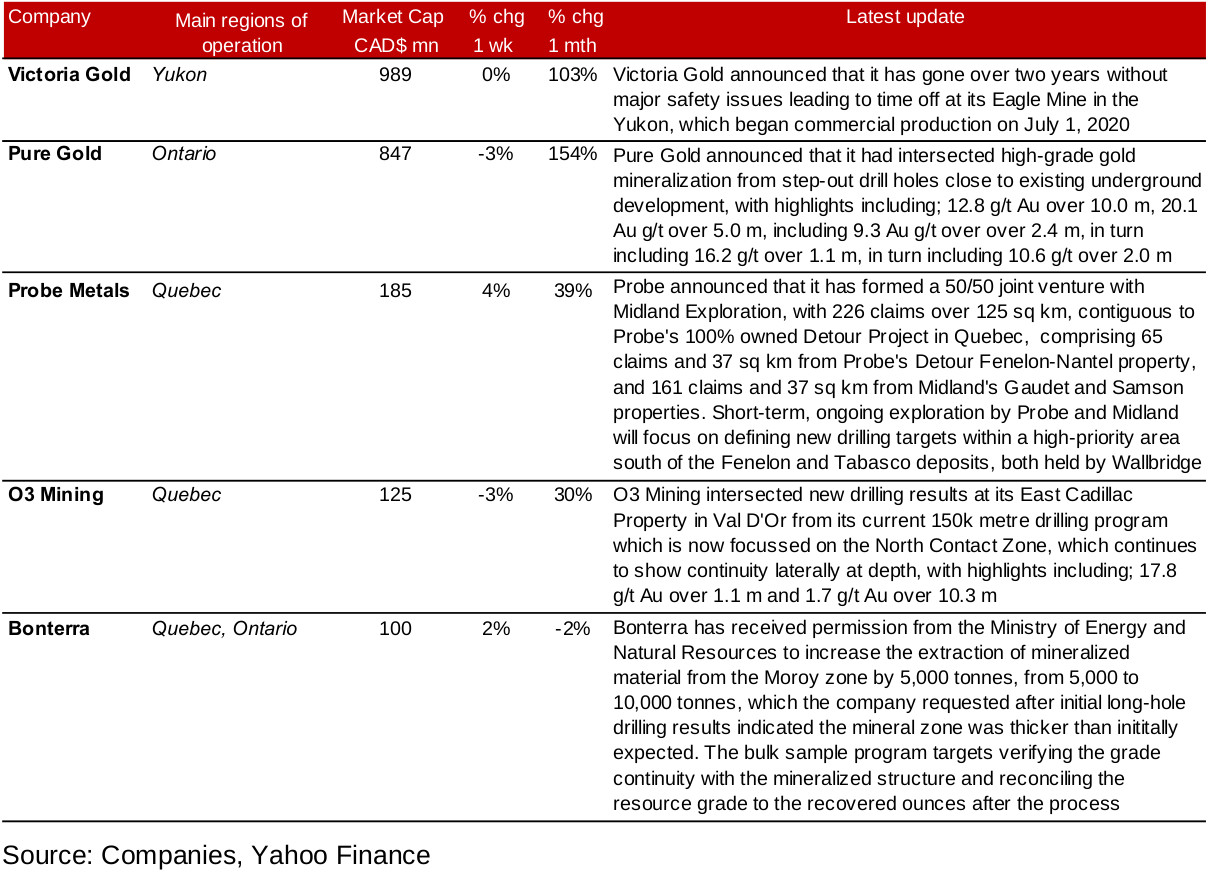
Most of the Canadian operating juniors were down, as investors may be anticipating a short-term pullback in gold, and taking some profit after a strong over three-month run for most of this group (Figure 7). News flow for the week was upbeat overall, including an update on a strong safety track record from Victoria, drilling results from Pure Gold and O3 Mining, Probe announcing a JV with Midland, and Bonterra being allowed by the government to double the size of the bulk
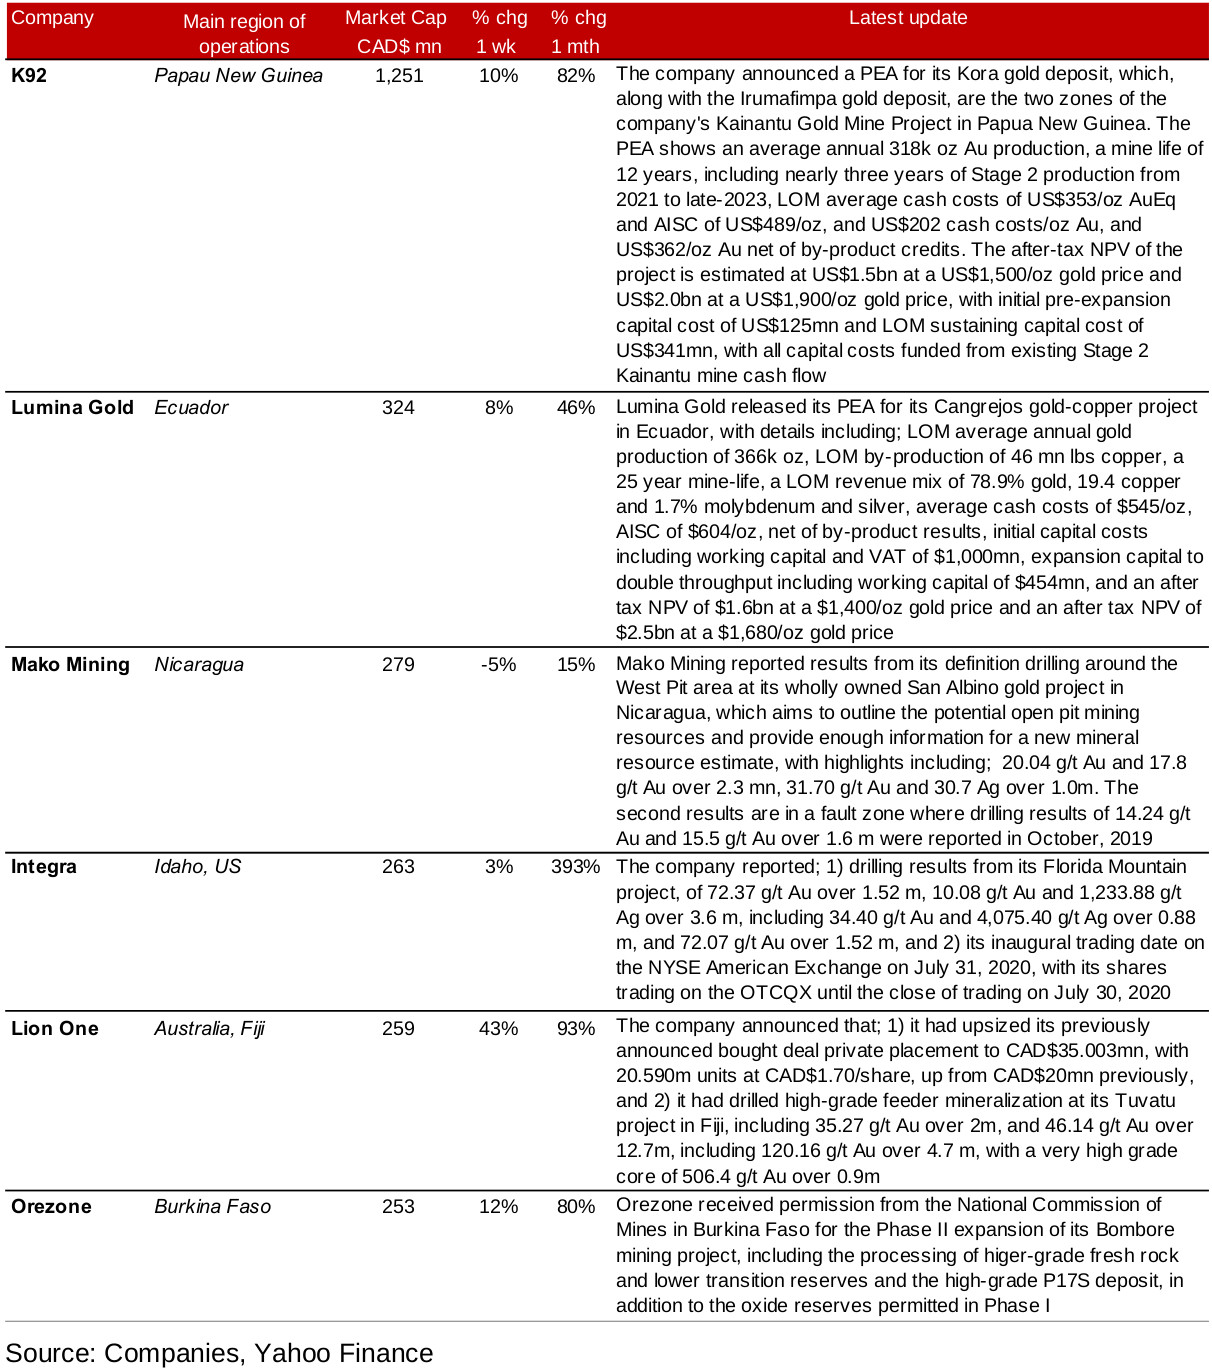
Most of the internationally operating Canadian junior mining stocks rose this week, with most outpacing the 2.1% gain in the GDXJ, the global proxy for global junior gold mining stocks (Figure 7). There were several companies seeing major news flow this week, with K92 and Lumina Gold both reporting PEA's for their Kora and Cangrejos gold projects, respectively (Figure 10). Mako Mining and Integra both reported drilling results, from their San Albino and Florida Mountain projects, Lion One announced drilling results and an upsizing of a previously announced private placement, and Orezone received permission to expand its Bombore project from the authorities in Burkina Faso.
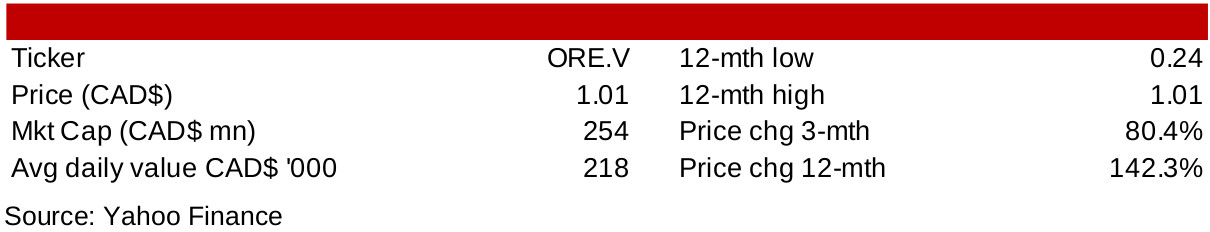
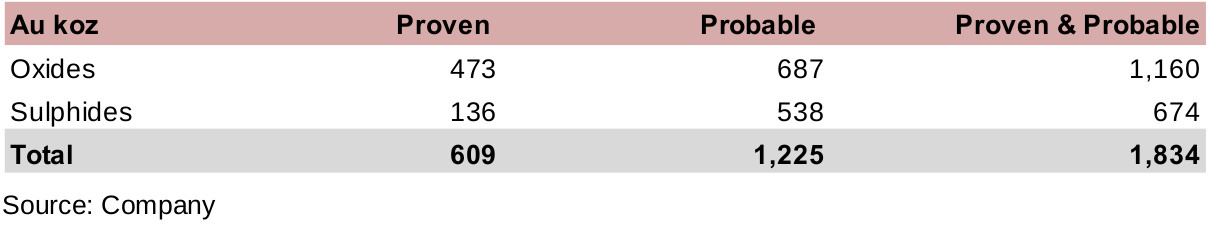
Orezone Gold is a single asset producer, operating the Bombore Project in Burkina Faso in West Africa. While Burkina Faso's ranking of 51 out of 76 districts in the Fraser Institute is low in a global context, within the context of the reasonably high risk ten African districts in the survey, it has the fourth highest ranking. The Bombore project is in an area of Burkina Faso that has seen strong recent gold mining success, with fourteen mines reaching production, and around 10 mn oz gold resources estimated within 15 km of Bombore. Bombore has 609k oz in proven and 1,225k oz in probable reserves for a total 1,834k P&P reserves (Figure 12). The project also benefits from infrastructure access, with two paved roads, a power line, fresh water supply within the project mine equipment supply and construction companies near the property.
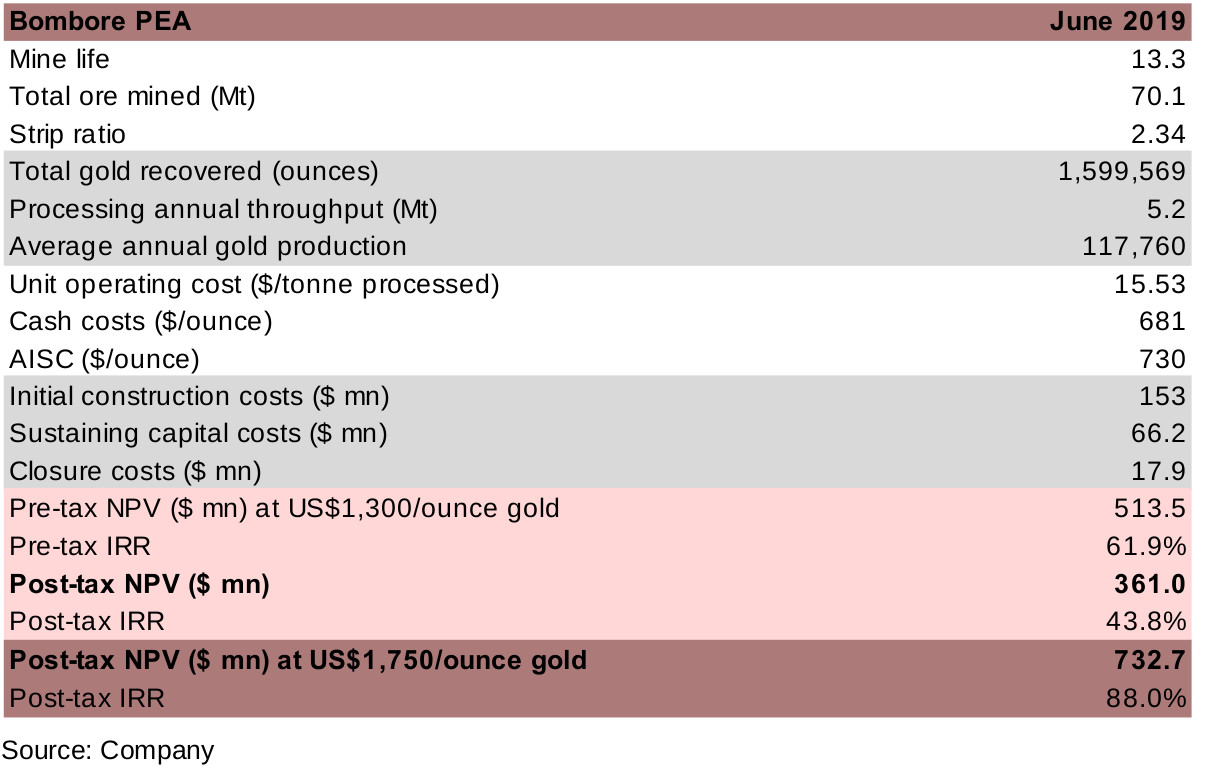
The company has completed feasibility studies, raised CAD$20mn in equity financing, and is now seeking to arrange a debt package and begin construction. While the June 2019 PEA estimated a post-tax NPV of $361.0mn, this was based on only a US$1,300/ounce gold price, and a PEA based on US$1,750/ounce indicates a doubling in the project value to a post-tax NPV of $732.7mn (Figure 13). Especially given the recent spike in the gold price, this latter estimate is looking increasingly achievable, and given Orezone's current market cap of just US$254mn, significant upside is possible for the stock if Bombore is able to reach the production stage. The gold bull market should also help the company in raising their debt package. The share price has reflected the company's continued progress, up 80.4% over the past three months, and up 142.3% over the past twelve months.
Disclaimer: This report is for informational use only and should not be used an alternative to the financial and legal advice of a qualified professional in business planning and investment. We do not represent that forecasts in this report will lead to a specific outcome or result, and are not liable in the event of any business action taken in whole or in part as a result of the contents of this report.
Author
Ben McGregor authors the Weekly Roundup at CanadianMiningReport.com, providing sharp analysis of the metals and mining sector. With a talent for spotting trends, Ben distills complex market shifts into clear, engaging insights on TSXV junior miners. His weekly updates cover gold, copper, uranium, and more, blending data-driven perspectives with a knack for identifying opportunities. A vital resource for investors, Ben’s work navigates the dynamic junior mining landscape with precision.