
April 20, 2026
Gold rose 2.5% to US$4,880/oz, on a slide in the US$ and yields, which tend to move inversely to gold, and a brief decline in geopolitical risk as the Straits of Hormuz were declared open, although conflict seems to have erupted again almost immediately.
The war in the Middle East, which accounts for a large proportion of global aluminum production and exports, continued to deplete LME inventories of the metal, but the exchange has seen a major rebuild of stocks for copper.
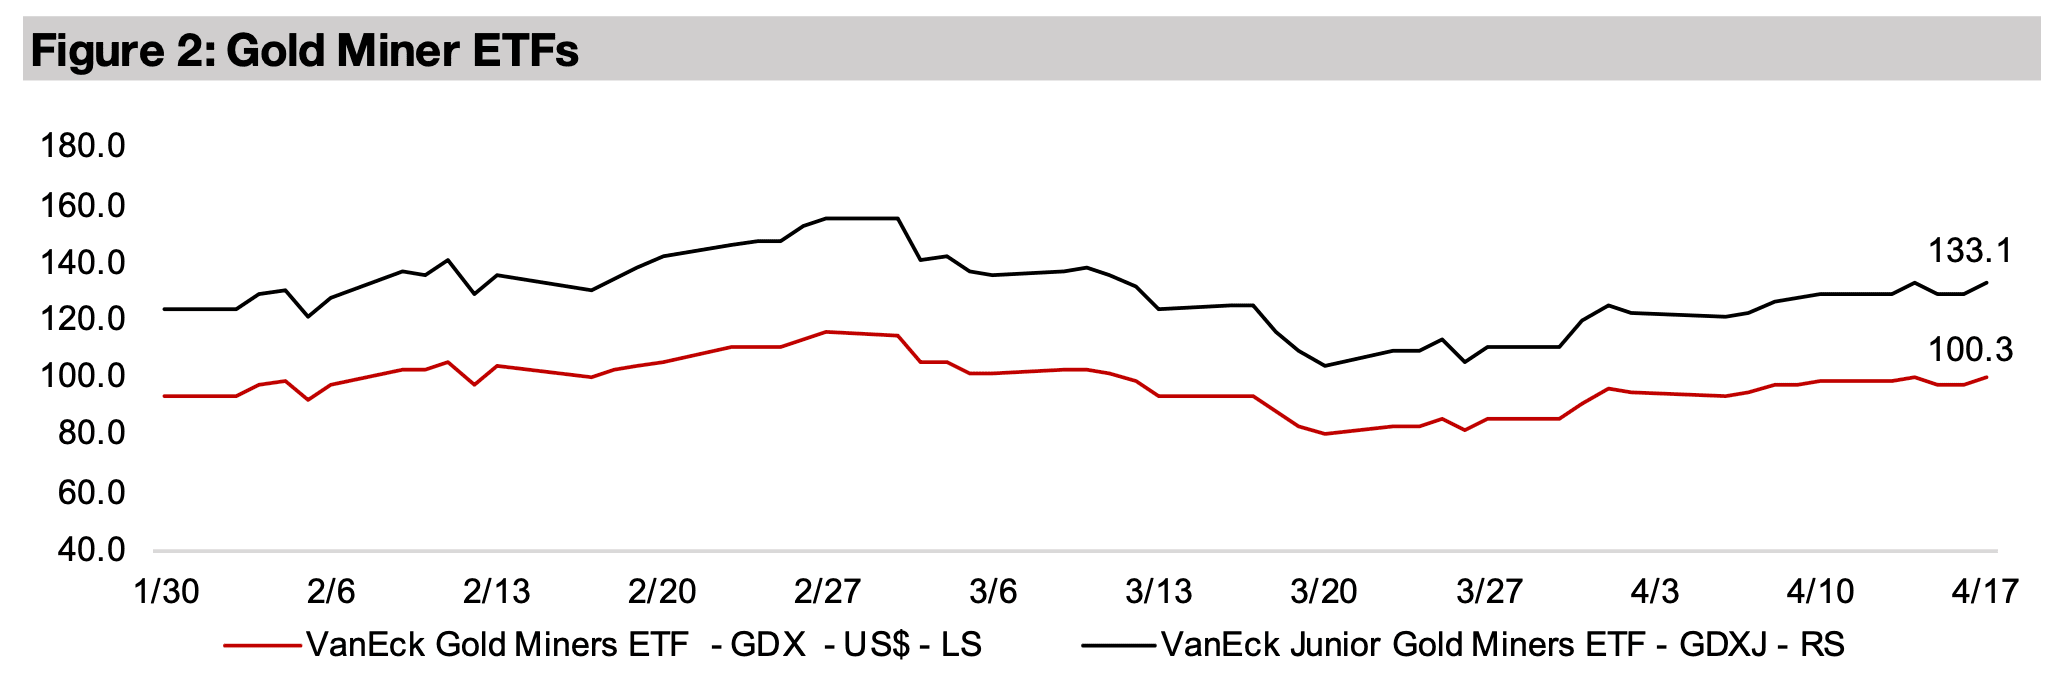
The gold stocks rose with the GDX up 1.0% and GDXJ gaining 3.3%, but underperformed the rebound in equities, with the S&P 500 jumping 4.7%, the Nasdaq surging 7.1% and Russell 2000 index of small caps rising 4.1%.


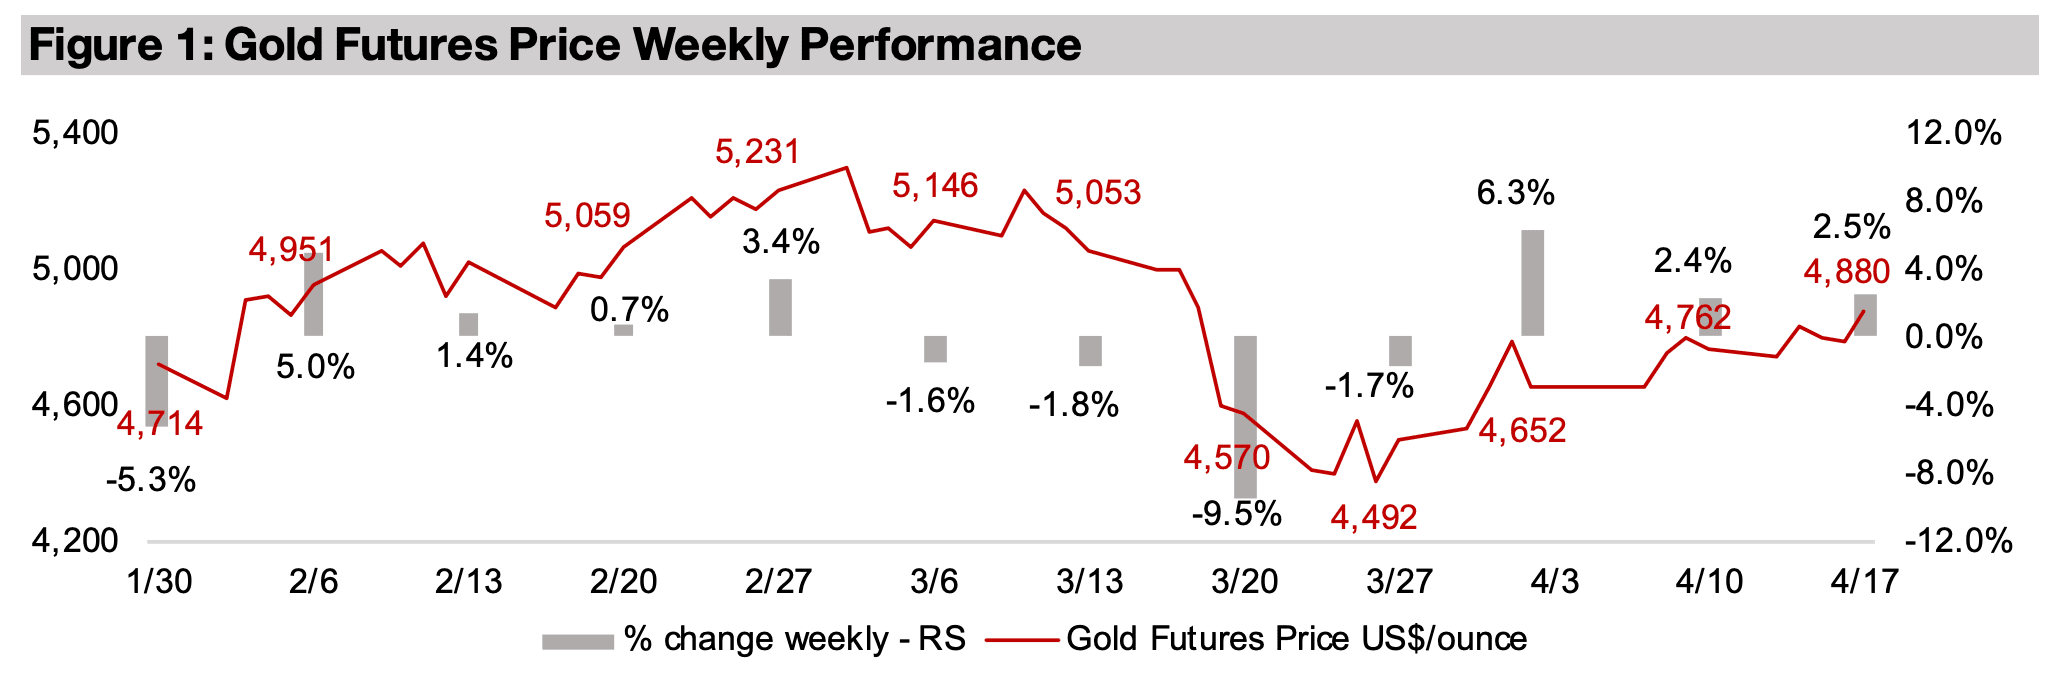
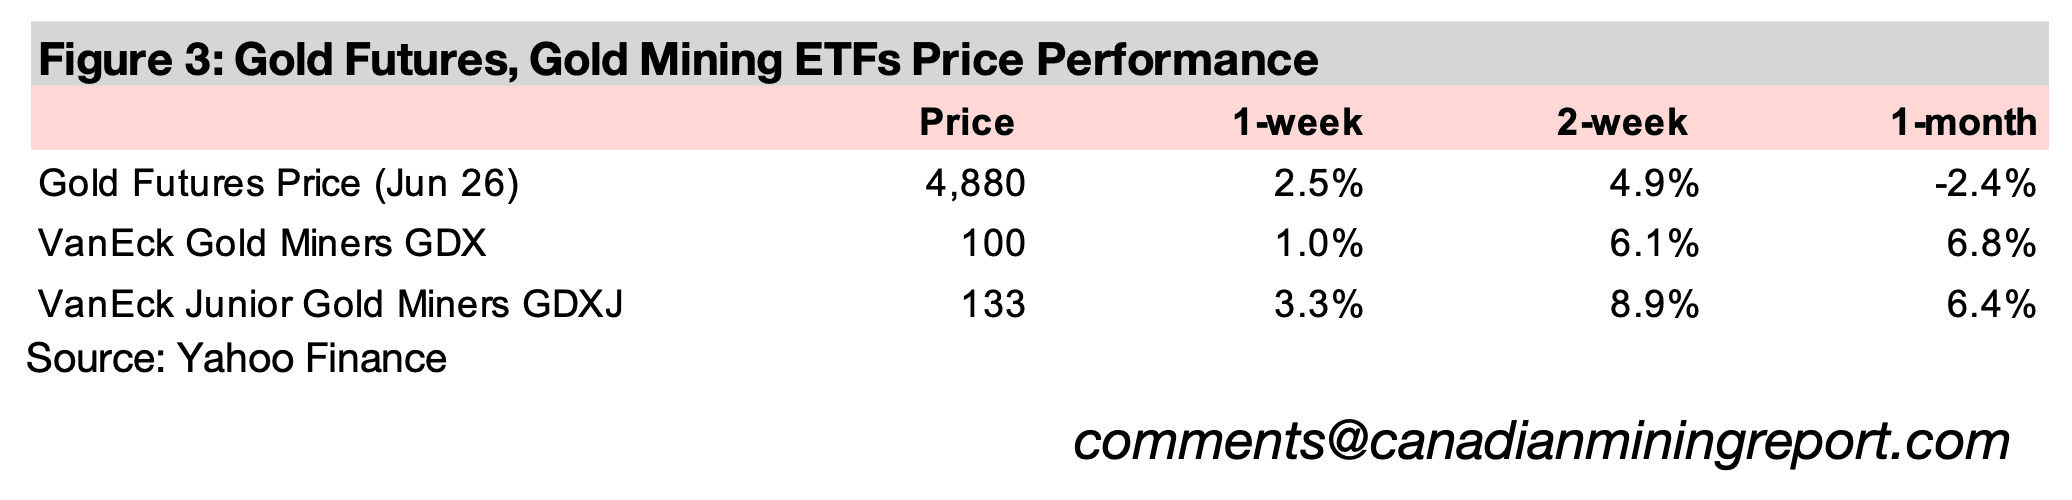
The gold price rose 2.5% to US$4,880/oz, up for the third consecutive week as it
continues to recover from its worst drop in years a month ago after the Fed indicated
that it may take more hawkish stance on monetary policy. The gain was mostly on
the last day of the week after an announcement that the Straits of Hormuz was
reopened. This led to a further decline in the US$ and yields, which both tend to move
inversely to gold, and had been in downtrends over the past two weeks as it seemed
there was continued progress in cooling the conflict in the Middle East. However,
only a day after the announced opening of the Straits, there were already reports of
attacks and that they once again may be closed.
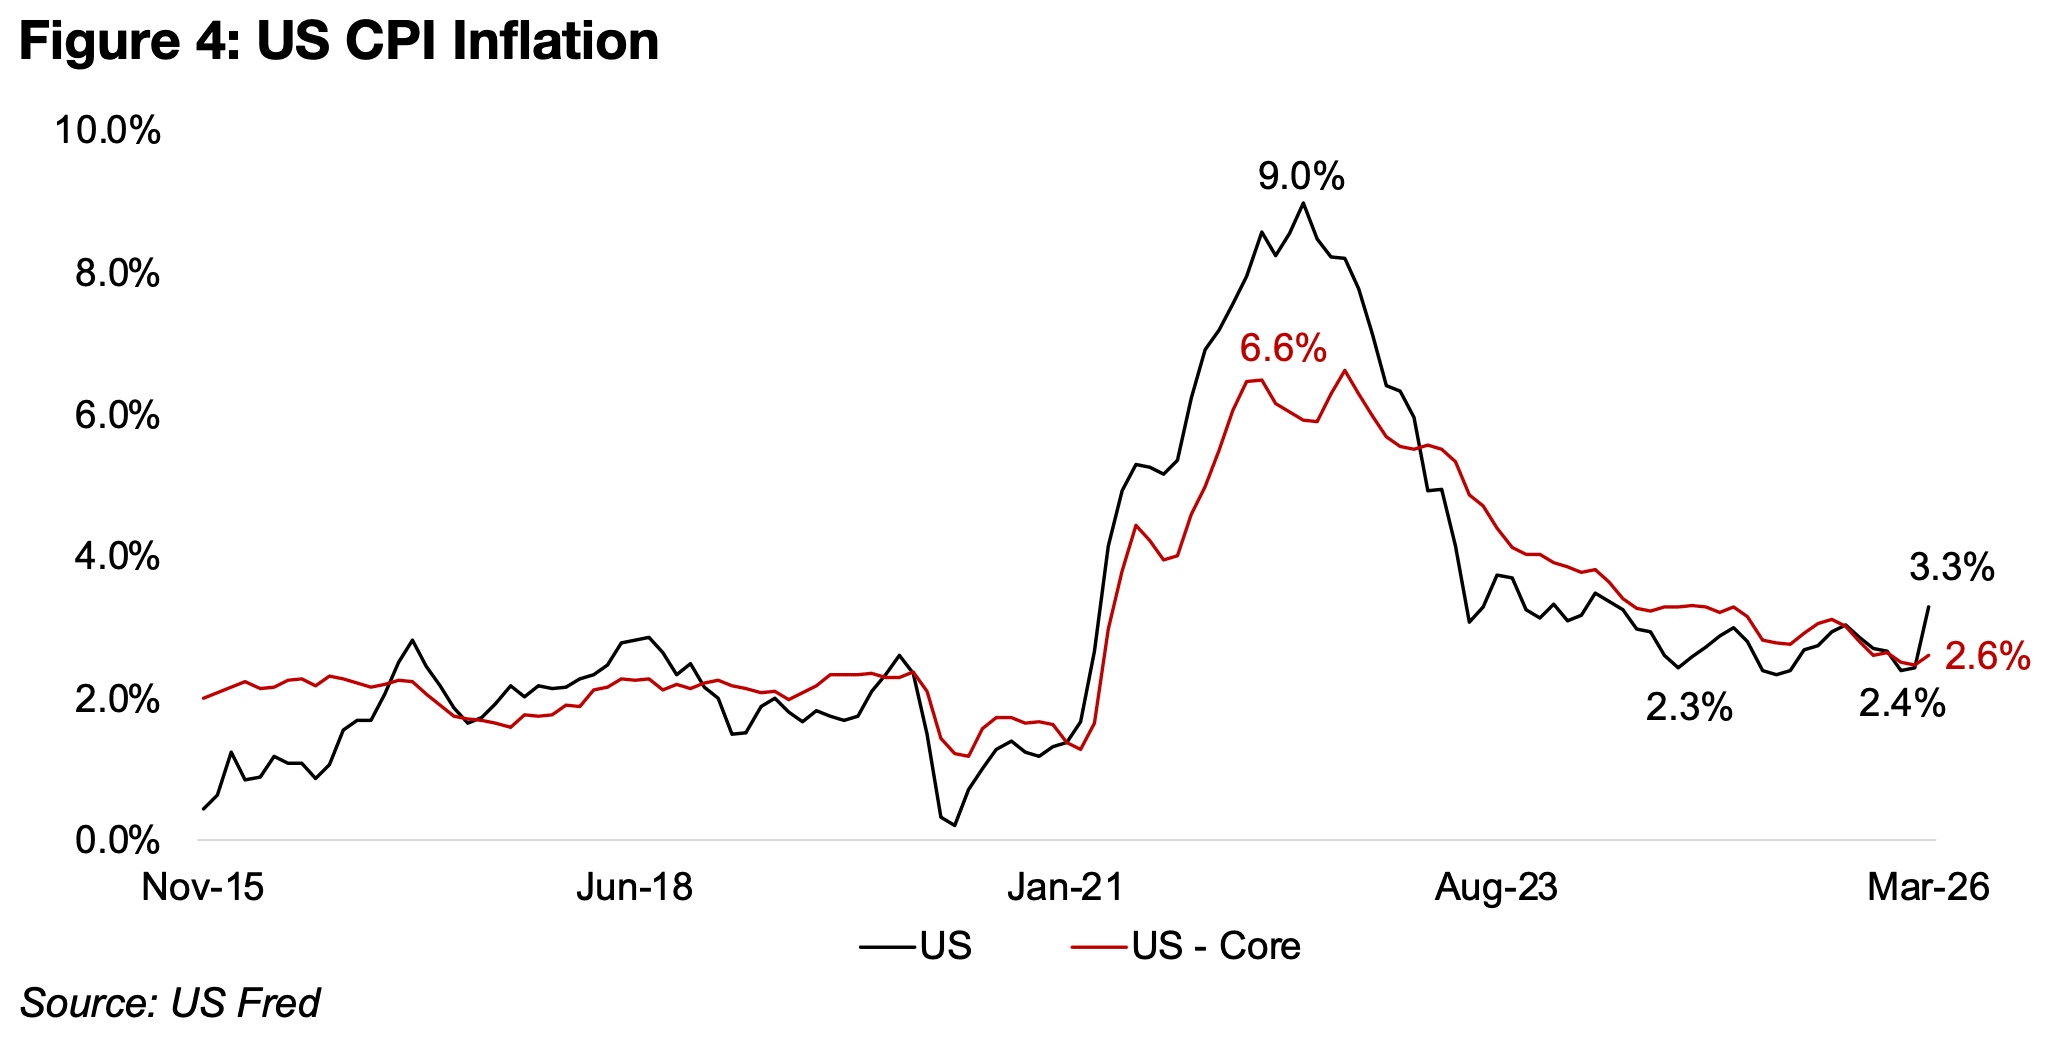
The Middle East conflict has driven up US CPI inflation substantially, with the March
2026 headline figure jumping to 3.3%, up from recent lows of 2.4% in January 2026
(Figure 4). However, this was not a major shock to the markets and inline with
estimates, being driven by an expected rise in energy costs given the jump in the oil
price. There was only a slight rise in core inflation, which excludes volatile energy and
food costs, to 2.6% from its recent lows of 2.5% in February 2025 and there was
limited market movement on the news. While US CPI inflation is far down from the
peak of 9.0% in June 2022, it remains above the average 1.9% from 2016 to 2019.
The equity markets saw a substantial lift from the news of the opening of the Straits, with the S&P up 4.7%, the Nasdaq jumping 7.1% and the Russell 2000 index up 4.1%. While the gold stocks rose on the metal price gain, they underperformed the major risk on move in markets, with the GDX up just 1.1% and the GDXJ rising 3.3%. However, the restarting of the conflict over the weekend has seen the futures for these US indices decline, implying that equities could start this week down.
The shock plunge in gold last month, the crash in silver through February 2026, and weakness in base metals through March 2026 all seemed to indicate a considerable dampening of sentiment for the mining sector. However, over the past two weeks, the GDX ETF of gold producers and PICK Metals and Mining ETF, driven especially by companies with high exposures to iron ore and copper, have rebounded substantially. They are still leading the major markets and sectors by far since September 2025, with gains of 56.4% and 54.8%, and even the surging energy sector is still only up 25.4%, less than half the level of the mining stocks (Figure 5).
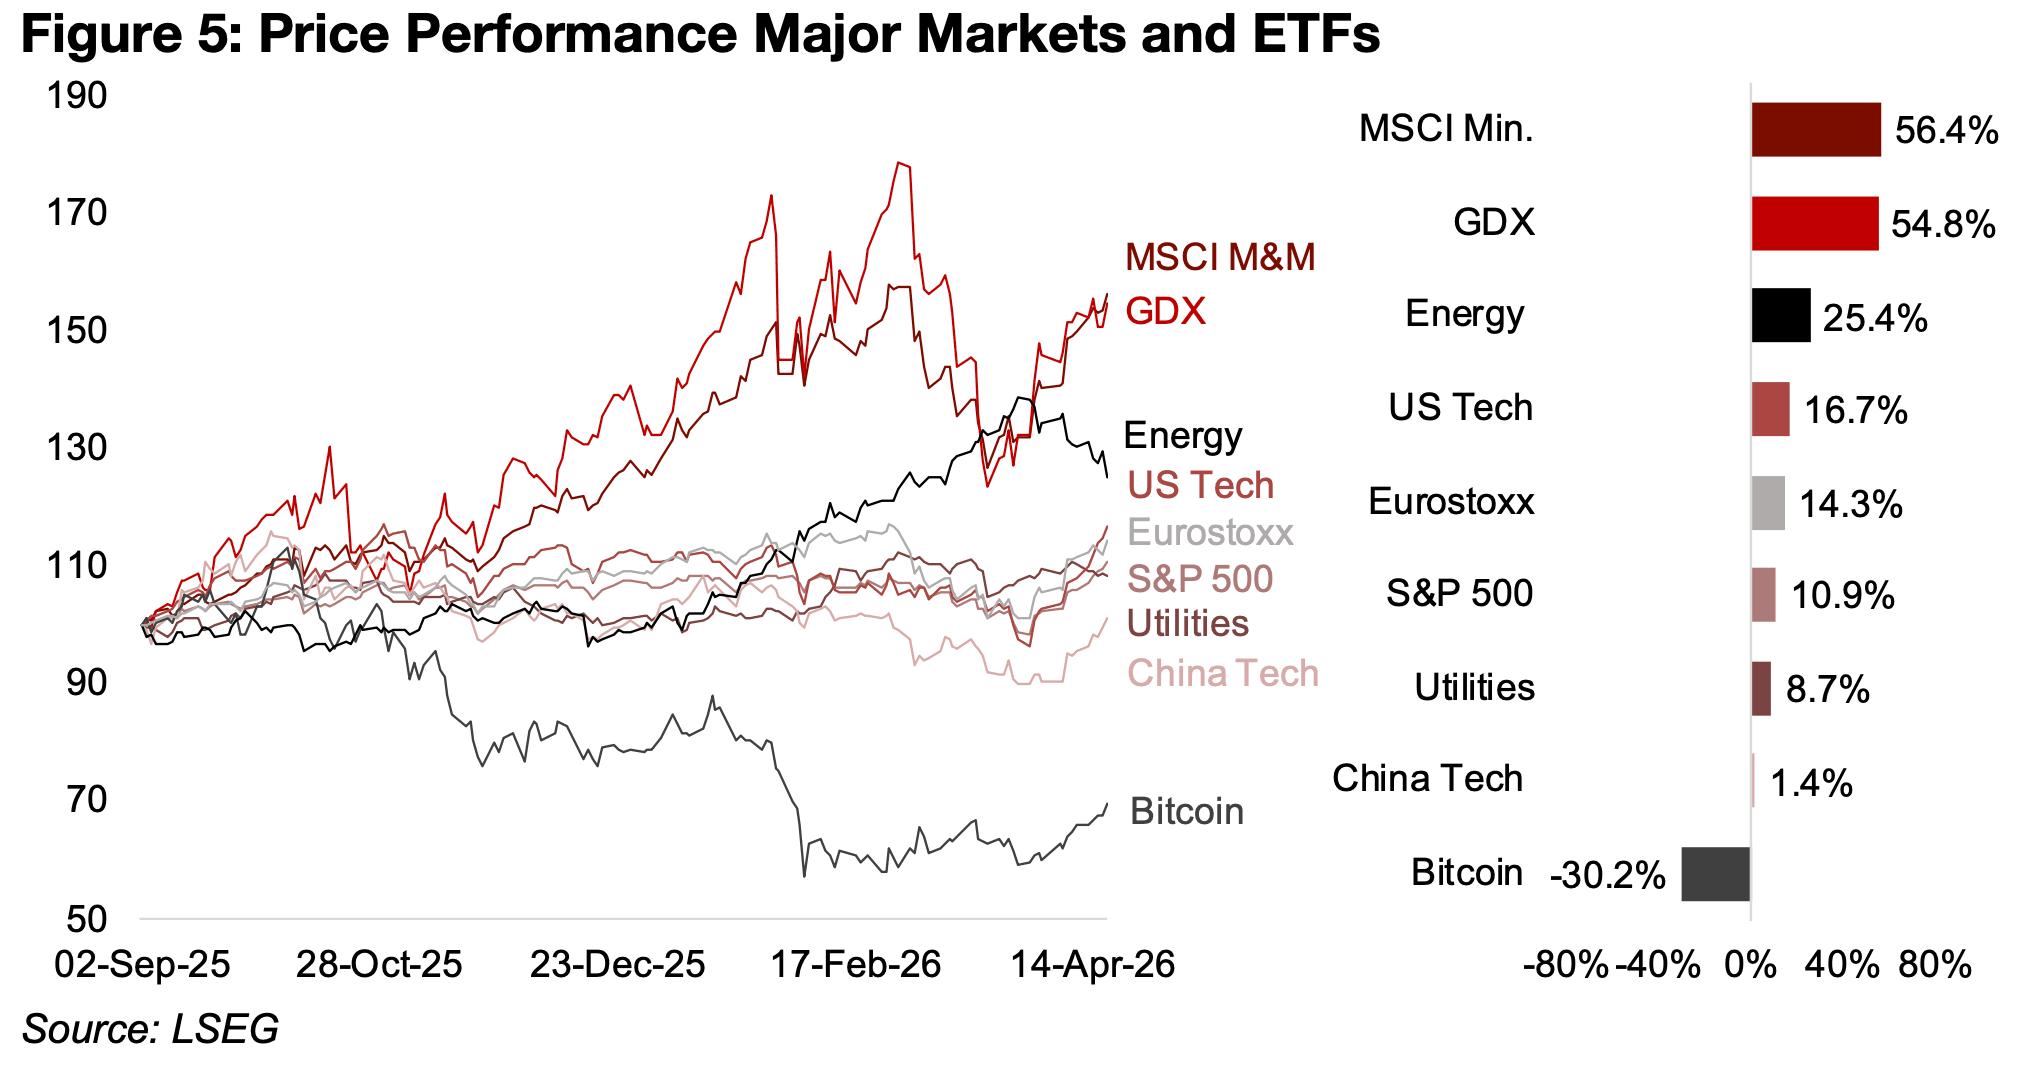
Over the last two years we repeatedly expected an end to the US tech boom,
especially given very high valuations versus other sectors. However, after periods of
underperformance versus mining, especially gold, it often recovered and went on to
an outperformance, especially through 2024 and into H1/25. Since September 2025,
mining seems to have finally pulled decisively ahead of US tech, which is up just
16.7%, after extended major weakness especially in the software segment. Still, there
has once again been a considerable rebound in US tech over the past two weeks,
with strength especially in semiconductors, but also artificial intelligence. The China
tech boom of 2025 has cooled significantly, with the sector up just 1.4%.
Another shift has been Europe’s outperformance of the US, with it up 14.3% versus
the 10.9% gain in the S&P 500, after being a laggard for most of 2025. The utilities
sector has risen 8.7%, although recently it has become less clear whether the sector
should be considered defensive, as it has been historically, or a growth sector driven
by tech demand for water and electricity. The only major asset seeing a decline over
the past six months has been Bitcoin, down -30.2%.
While iron ore and copper are the major drivers of the PICK ETF, it also has significant
exposure to the aluminum, by far the strongest performer of the major metals since
the war began, gaining 14.9% versus nearly flat copper, up just 0.5%, and a -7%
decline for gold. With the Middle East accounting for 9% of global production and
over 15% of exports for aluminum, the closing of the Straits drove up the price on
concerns of supply limitations. While this alone could have been solved by a
reopening, the issue was exacerbated by smelting capacity in the region being
directly hit by attacks, which is expected to reduce supply substantially for a year.
Beyond the war there is also expected to be a decline in aluminum output from China,
with the country having imposed a cap which has nearly been reached. While Chinese
companies have invested in aluminum capacity in Indonesia to generate imports to
substitute for domestic supply on the cap, this is not expected to fully offset the
decline from China, given that is by far the largest global producer. These forces have
led to a significant decline in LME aluminum inventories to 391k tonnes, down over -
20% from recent highs of 509k tonnes (Figure 6).
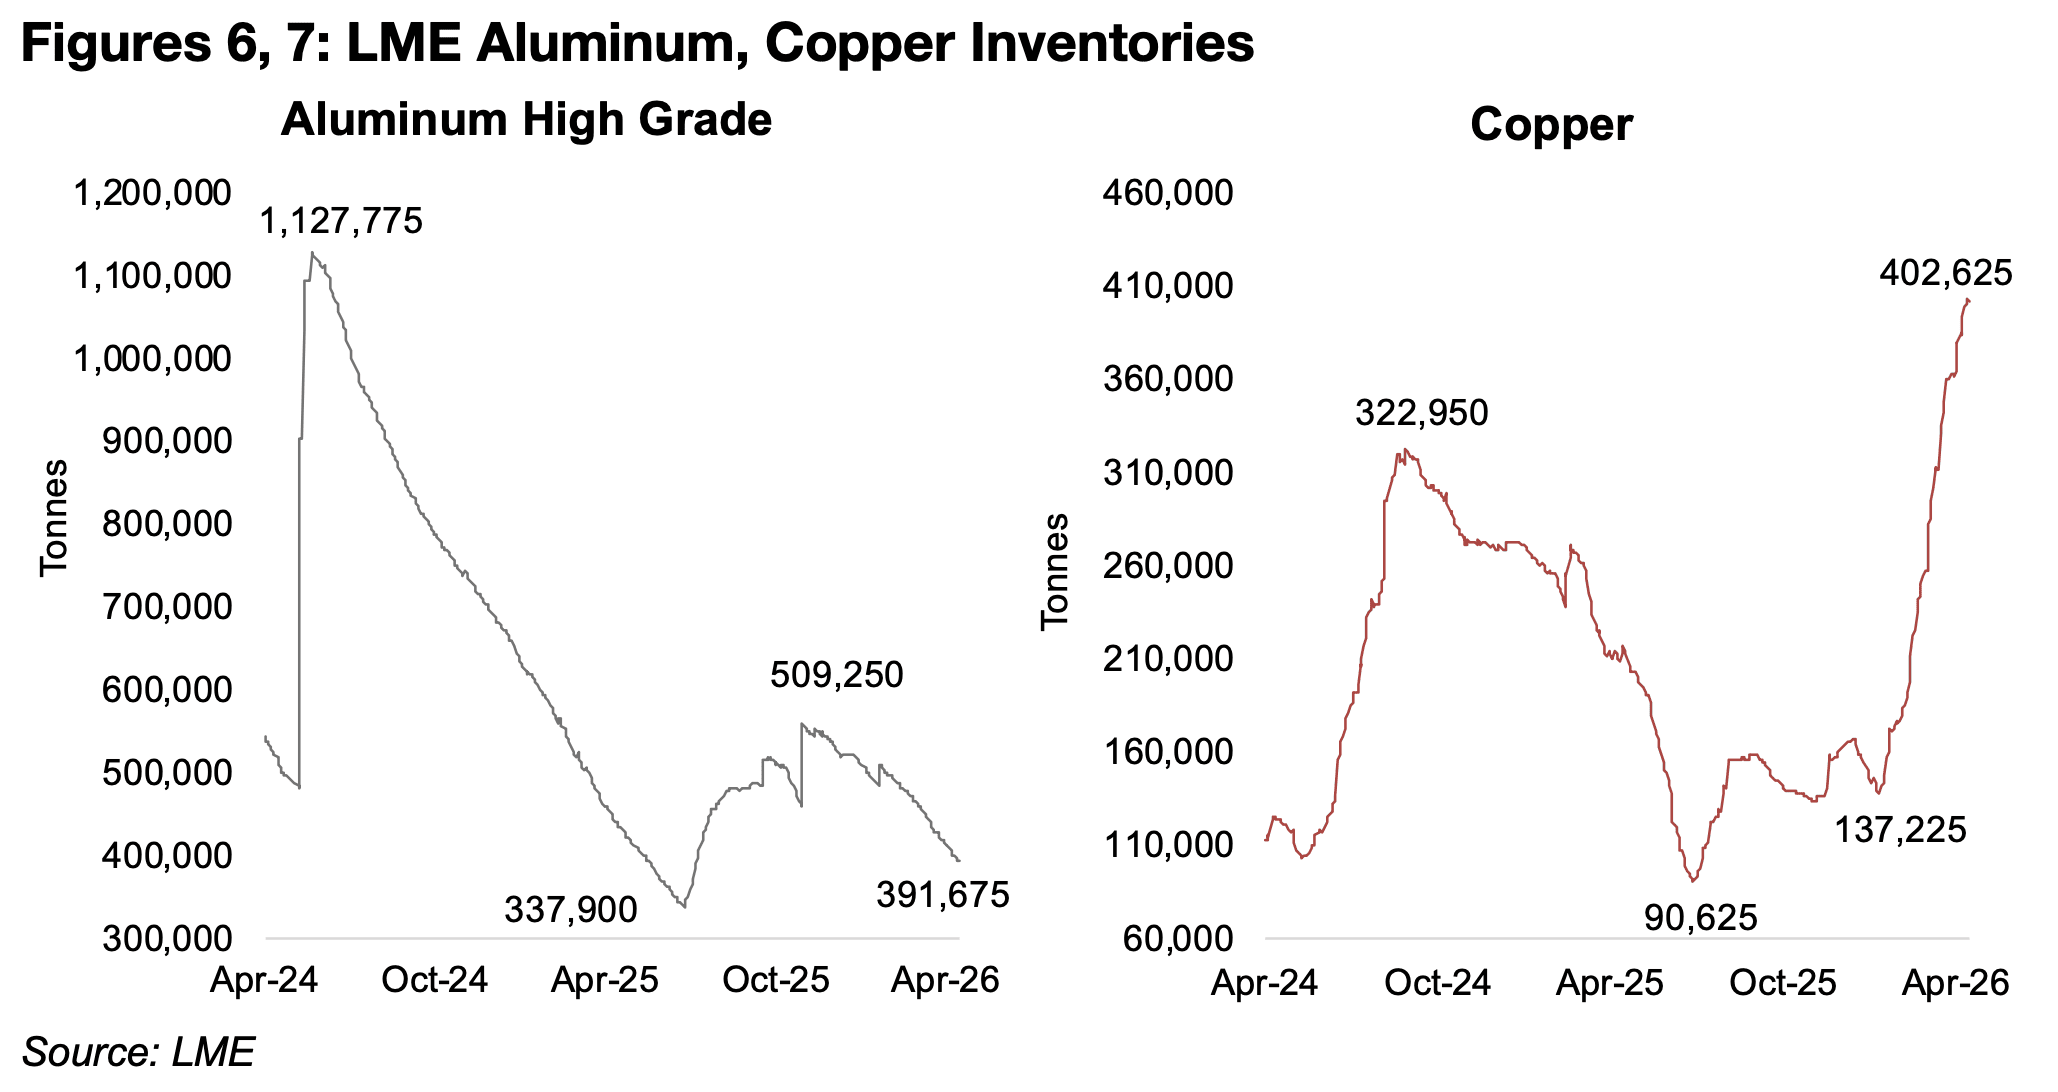
Copper inventories on the LME, in contrast, have soared in recent months, more than tripling from recent lows of 137k tonnes in January 2026 to 403k tonnes. While the copper outlook appeared bullish from late 2025 into early 2026, this was partly driven by distortions from expectations of US tariffs on the metal (Figure 7). This caused temporary scarcity as copper flowed from the LME to the US, driving inventories far above historical levels, with the LME importing heavily from China to offset this, depleting stocks there. This may have given an unsustainable lift to the price which could fade as China and LME inventories have recovered in recent weeks.
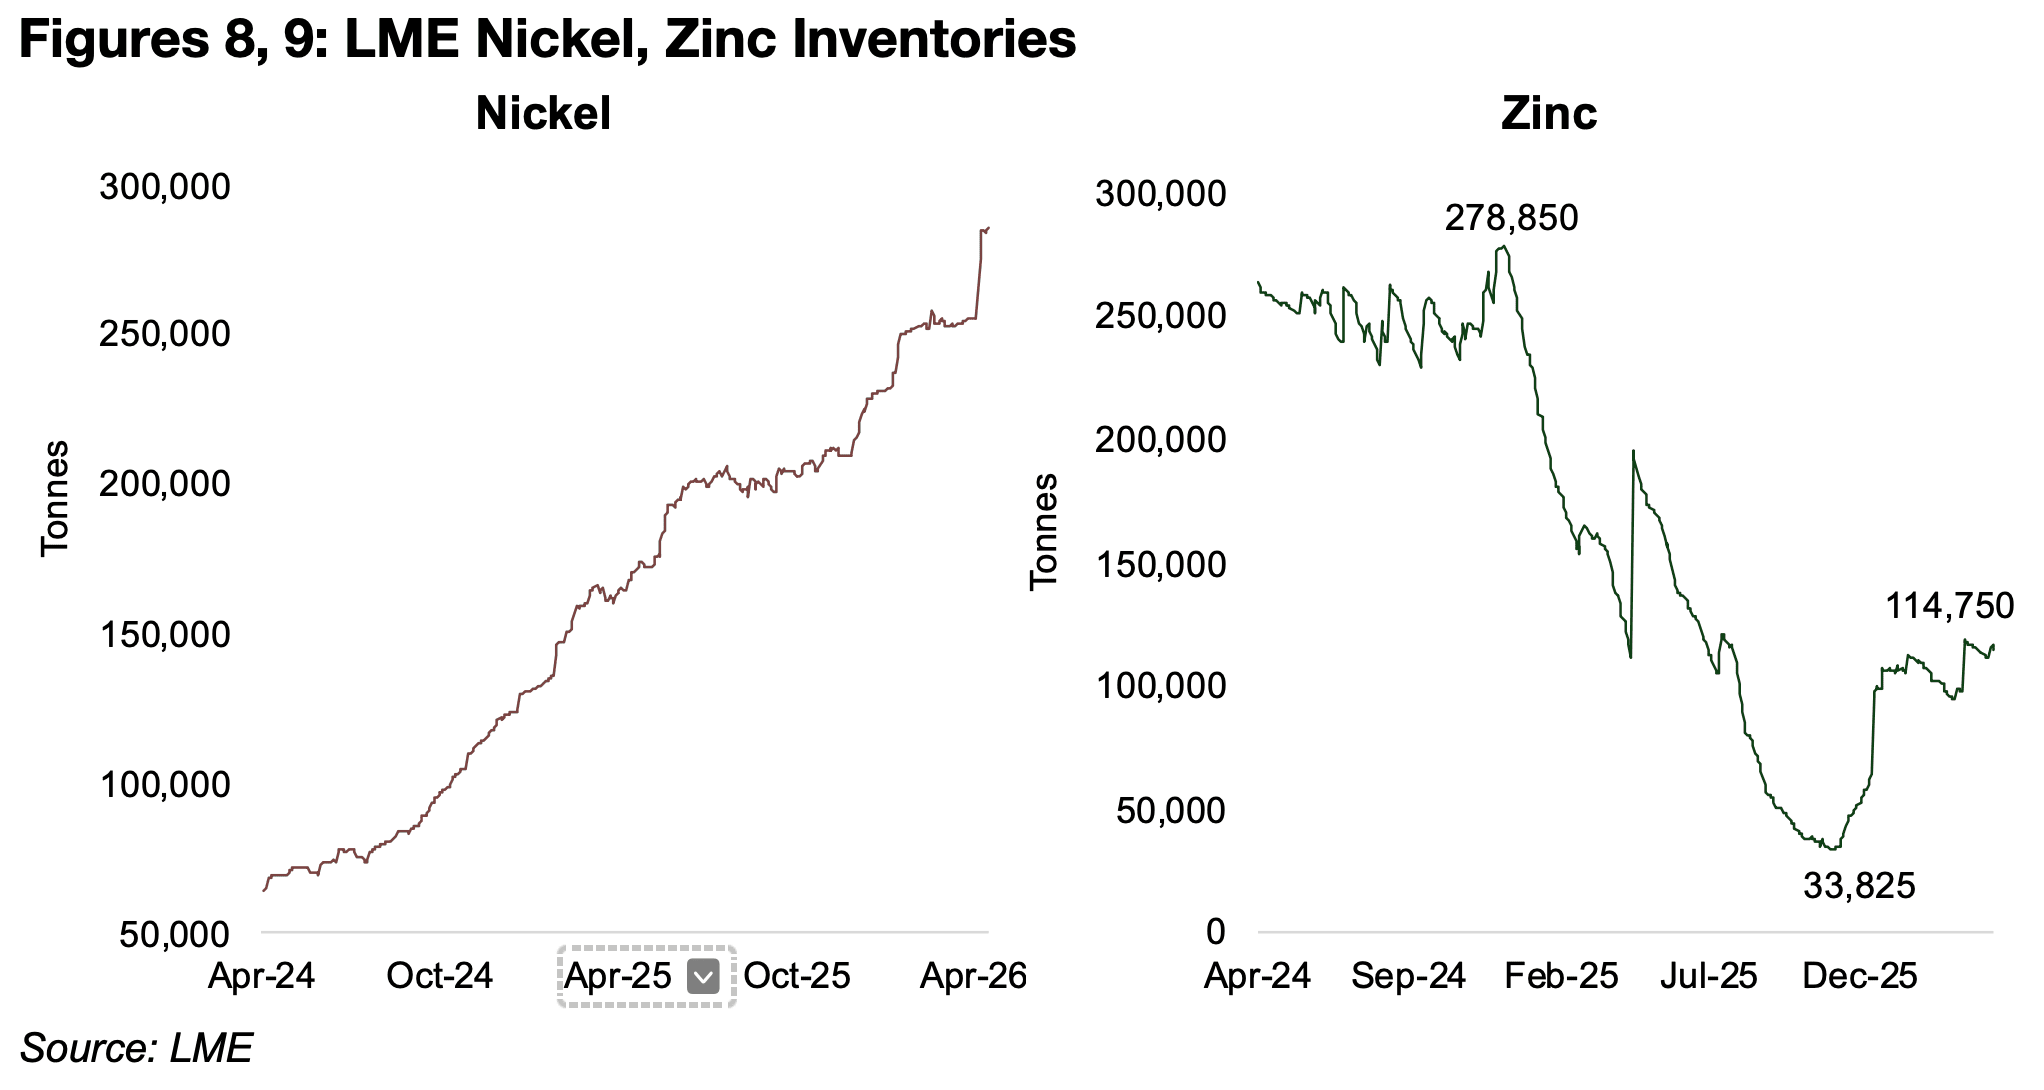
In contrast to aluminum and copper, which have seen periods of significant decline
and increase of inventories since early 2024, nickel stocks at the LME have had an
almost uninterrupted rise, increasing nearly six-fold over the just the past two years
(Figure 8). This has especially been driven by a huge buildup of capacity in Indonesia,
by far the world’s leading producer of the metal. A large proportion of this growth has
been backed by investment from Chinese companies looking to secure nickel
especially for its huge steel industry, which account for over 50% of global production,
but also for use in batteries for electric vehicles. Indonesia banned the export of raw
nickel from 2020, which encouraged the development of processing capacity in the
country. However, this led to a severe overexpansion of the industry, and the
Indonesia government has halted permits for new capacity of some forms of nickel.
On the demand side, steel production in China has been in decline for over a year,
and output from the rest of the world has also recently dropped to just below zero
after a year of expansion. Steel demand in China could remain weak, as growth for
the two main drivers of the industry, infrastructure and property development, is still
slow. While electric vehicle sales continue to rise, the rate of growth has slowed
dramatically from its peak in 2021, and there has been a shift towards lithium batteries
for the vehicles, which has also hit nickel demand.
The LME inventories of zinc have risen over three times to 115k tonnes from lows in
34k tonnes in October 2025, although the metal also has most of its demand from
the steel industry (Figure 9). The industry is expected to shift into a major surplus this
year on production increases from Brazil and only moderate demand growth, with it
affected by the same demand issues from the steel industry as nickel.
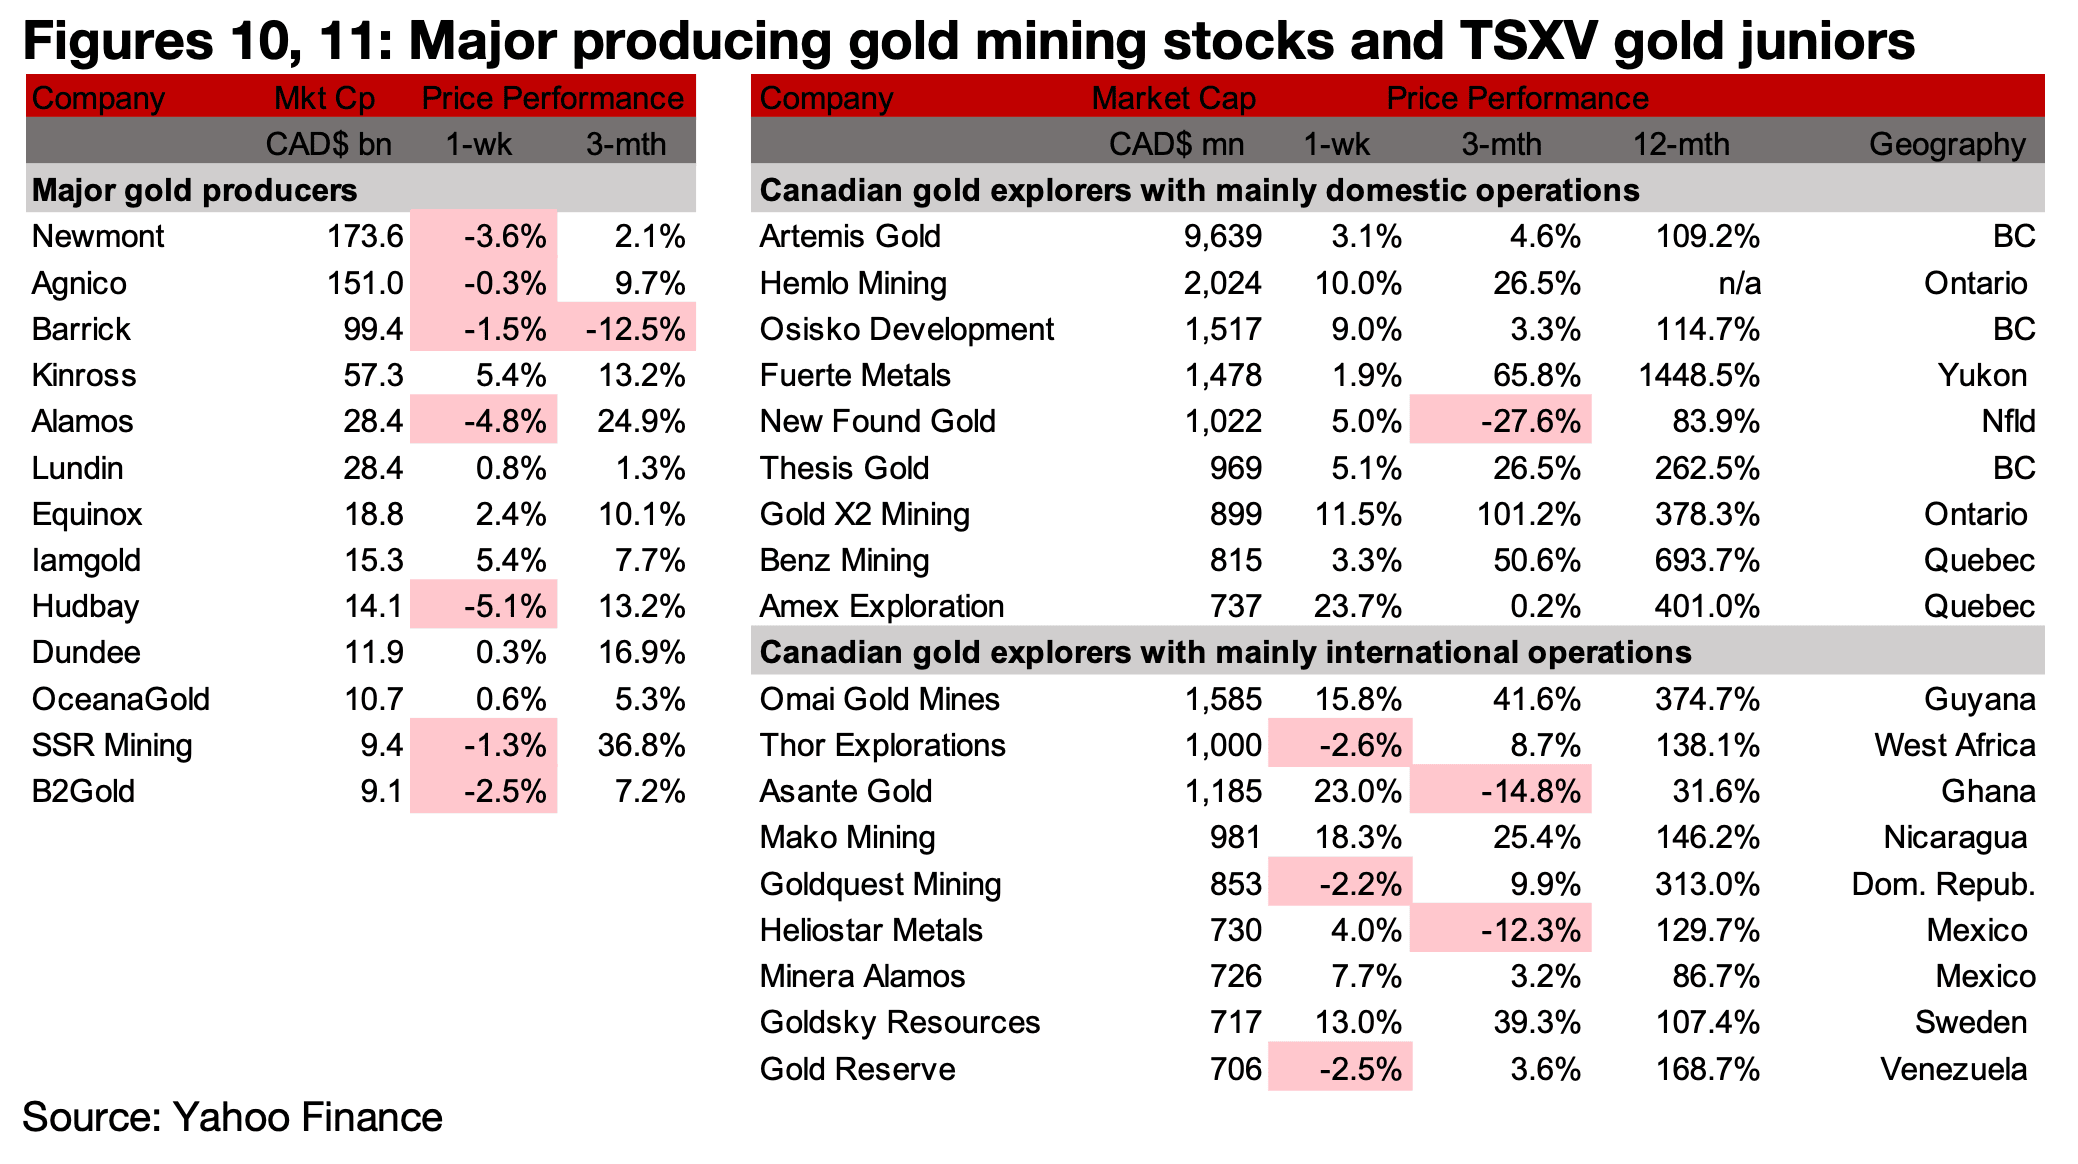
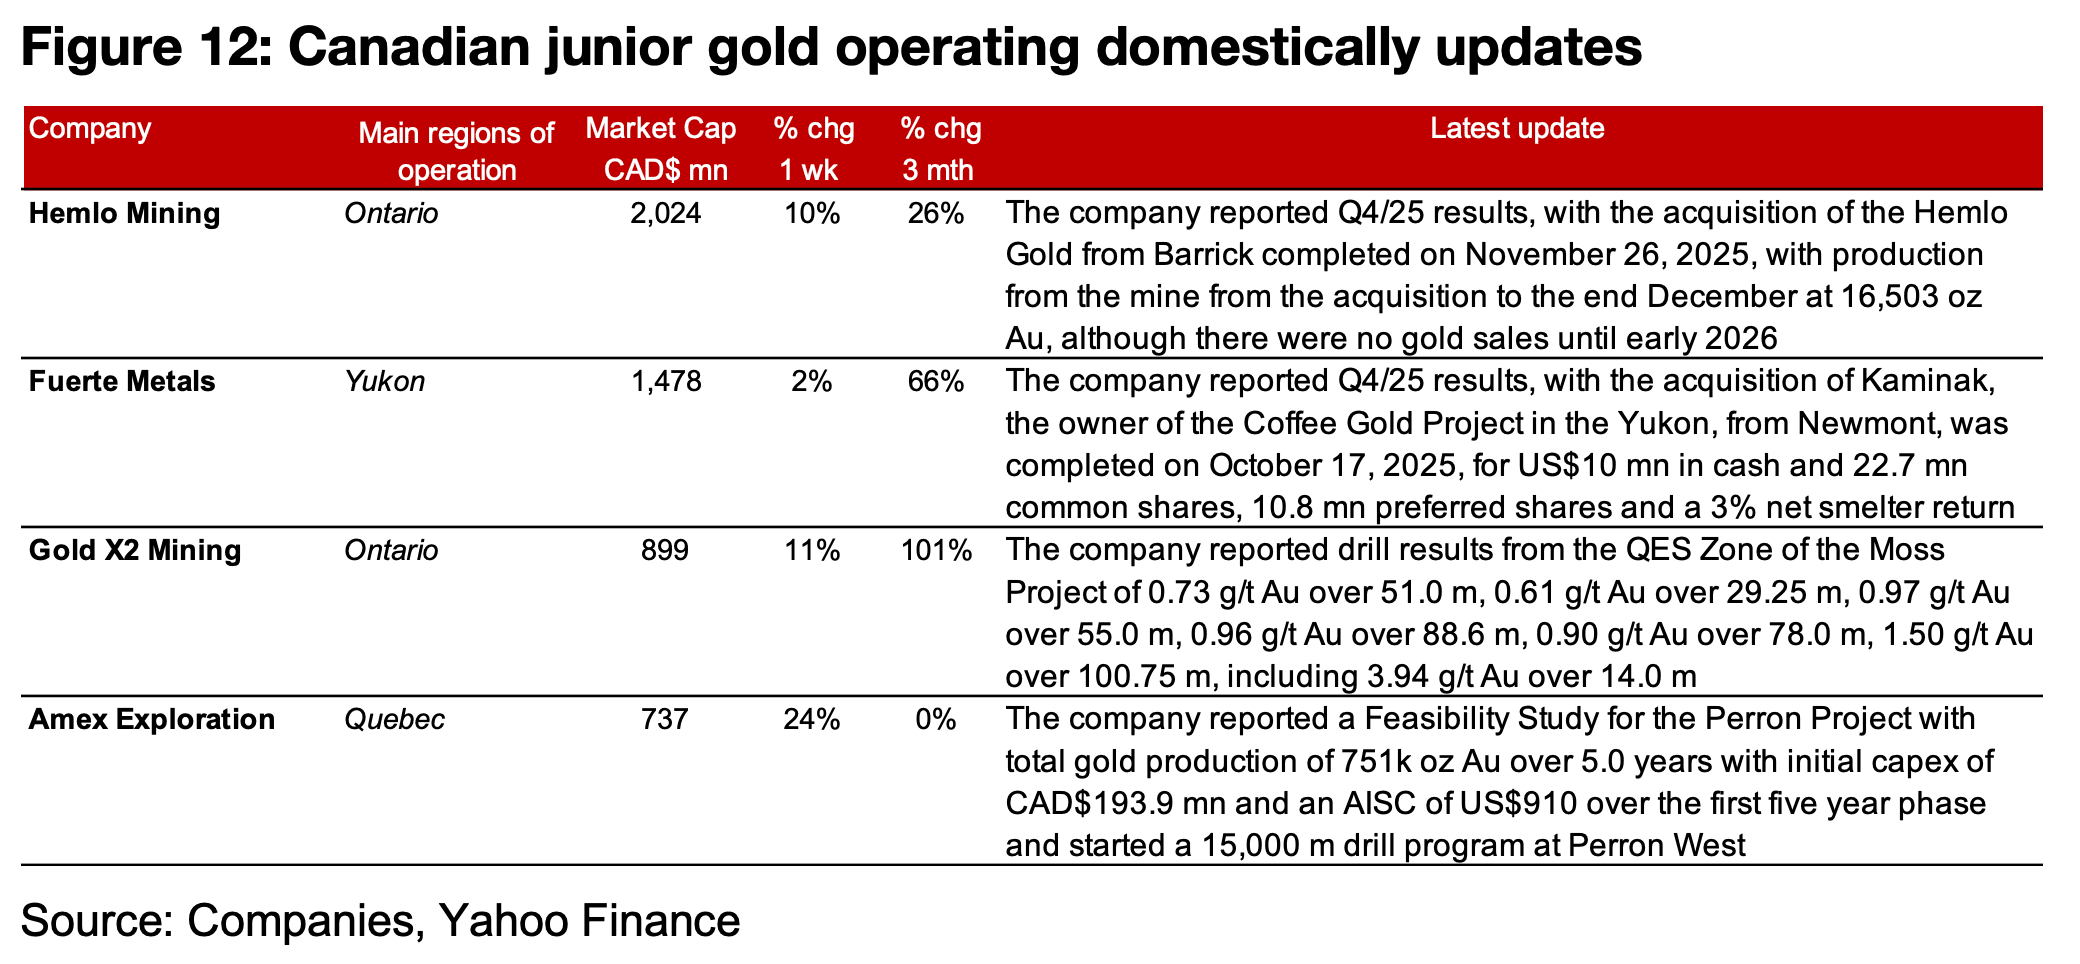
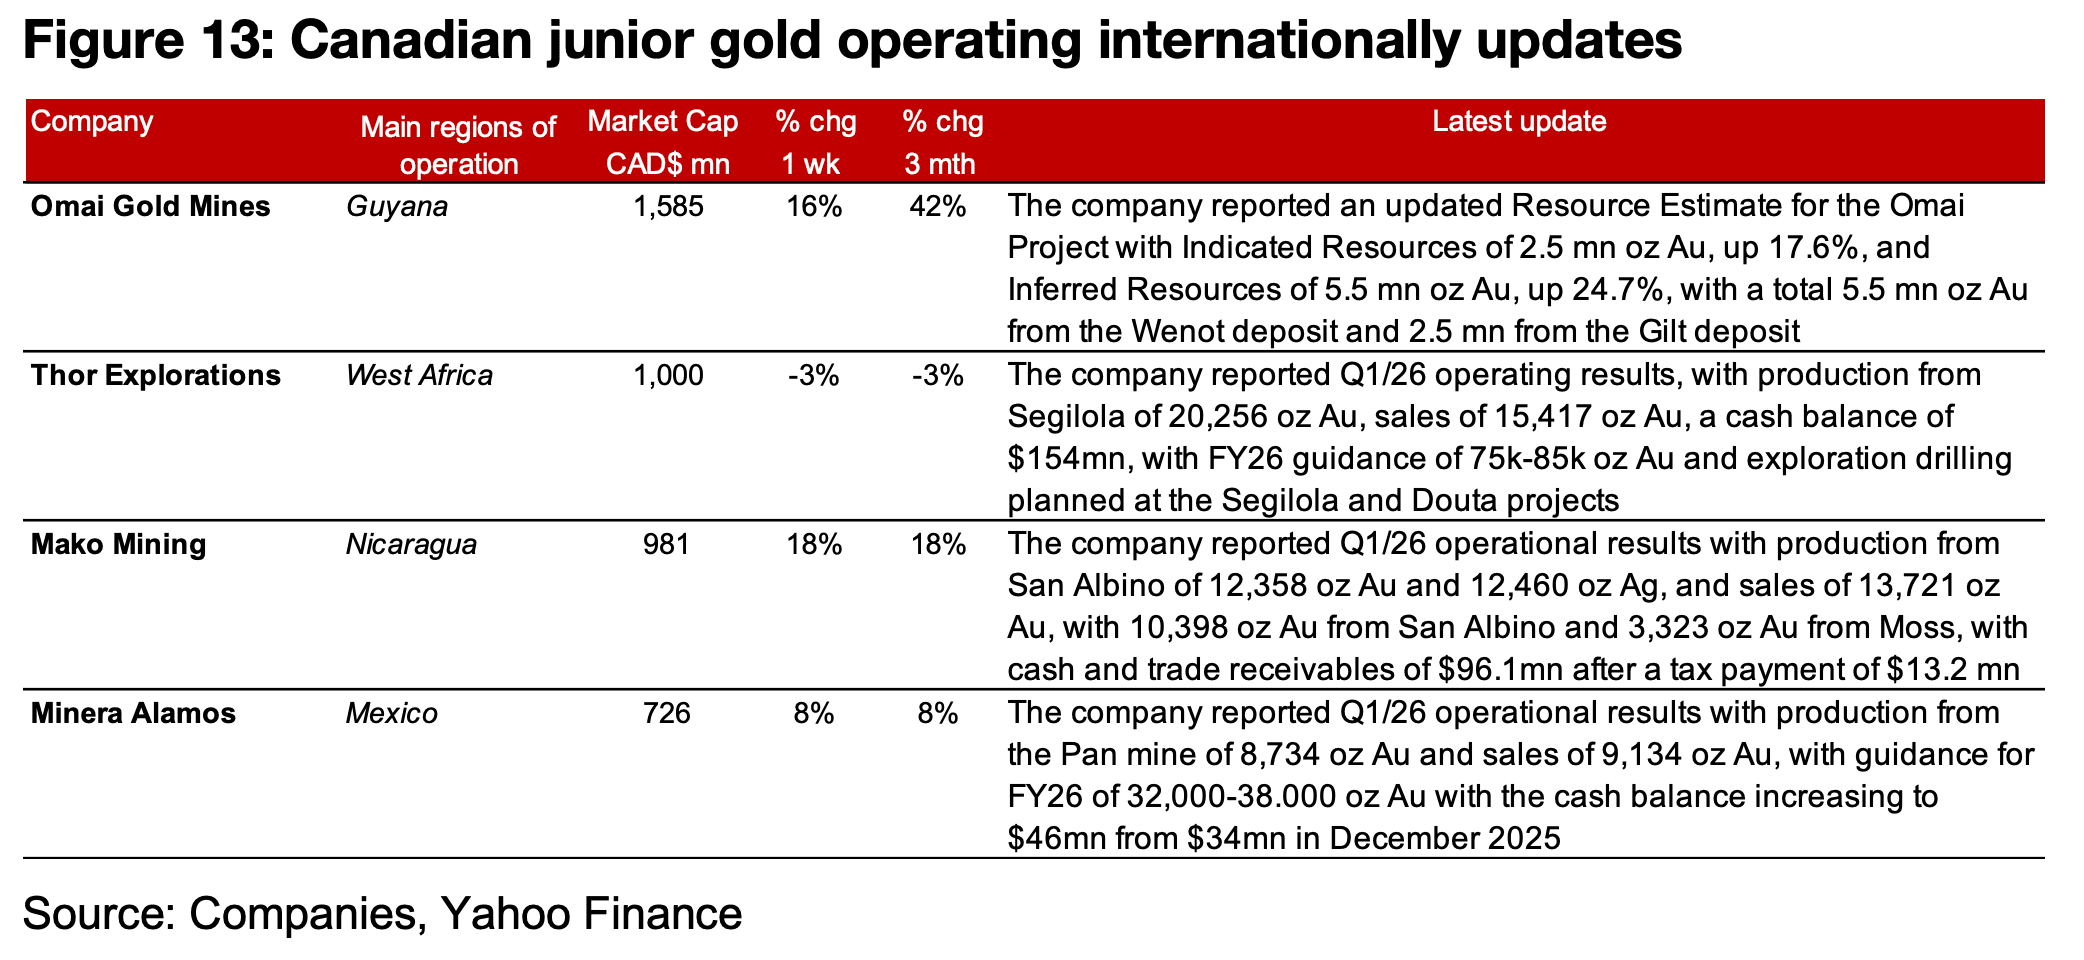
The major producers were mixed with the top three Newmont, Agnico Eagle and Barrick all declining, while TSXV gold mainly increased (Figures 10, 11). For the TSXV gold companies operating mainly domestically, Hemlo and Fuerte reported Q4/25 results, Amex announced a Feasibility Study for Perron and Gold X2 reported drill results from the QES zone of Moss (Figure 12). For the TSXV gold companies operating mainly internationally, Omai reported an updated Resource Estimate for the Omai project, Thor, Mako and Minera reported Q2/16 operational results. (Figure 13).
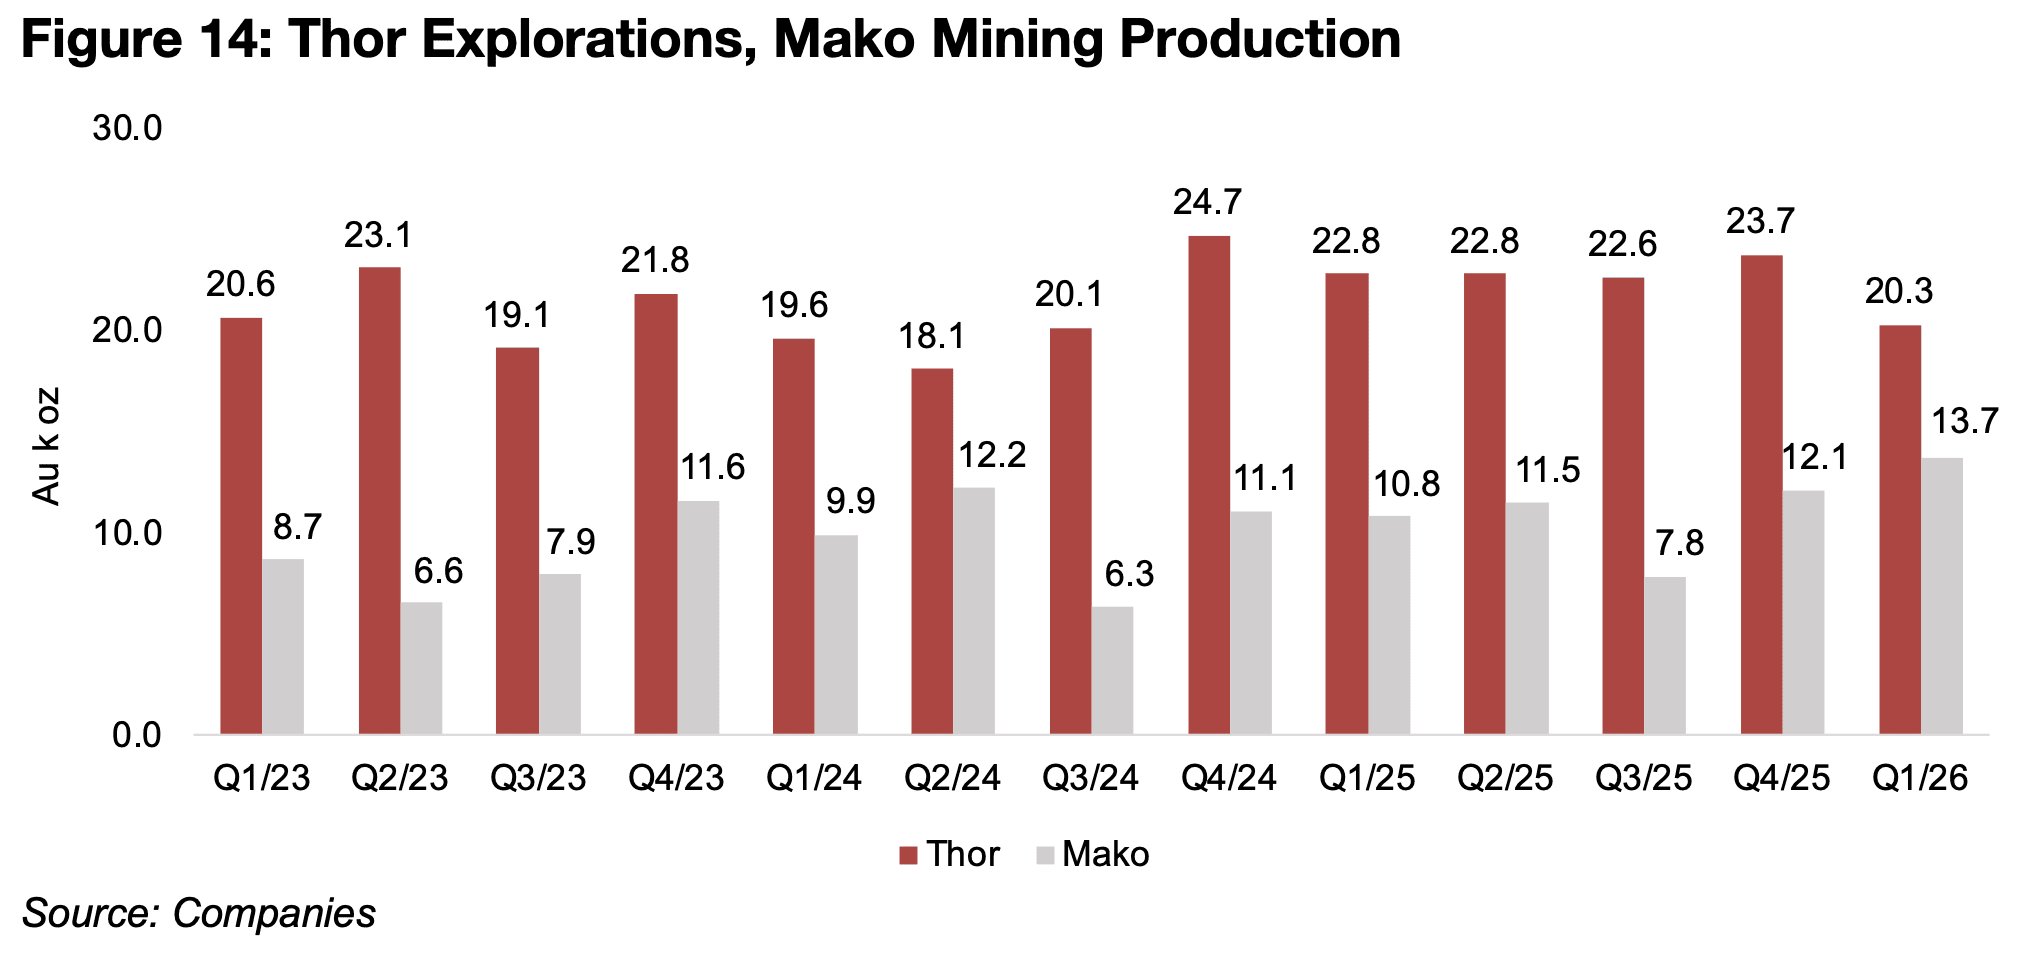
Mako’s production reached a record in Q1/26, at 13.7k oz Au, up from 12.1k oz Au in Q4/25 and 10.8k oz Au in Q1/25, with 10.4k oz Au from San Albino and 3.3k oz Au from its Moss mine in the US (Figure 14). Thor Exploration’s production declined to 20.3k oz Au from 23.7k oz Au in Q4/25 and 22.8k oz Au in Q1/25. While in previous reports we had also included the production of Robex Resources, which has output levels in a similar range these two companies, its merger with Predictive Discovery was completed this week and it now trades under the ticker of the latter and has been delisted from both the TSXV and ASX.
Amex Exploration saw a 23.7% increase in its share price this week, the highest of
the large TSXV gold stocks on the release of its Feasibility Study for the first phase
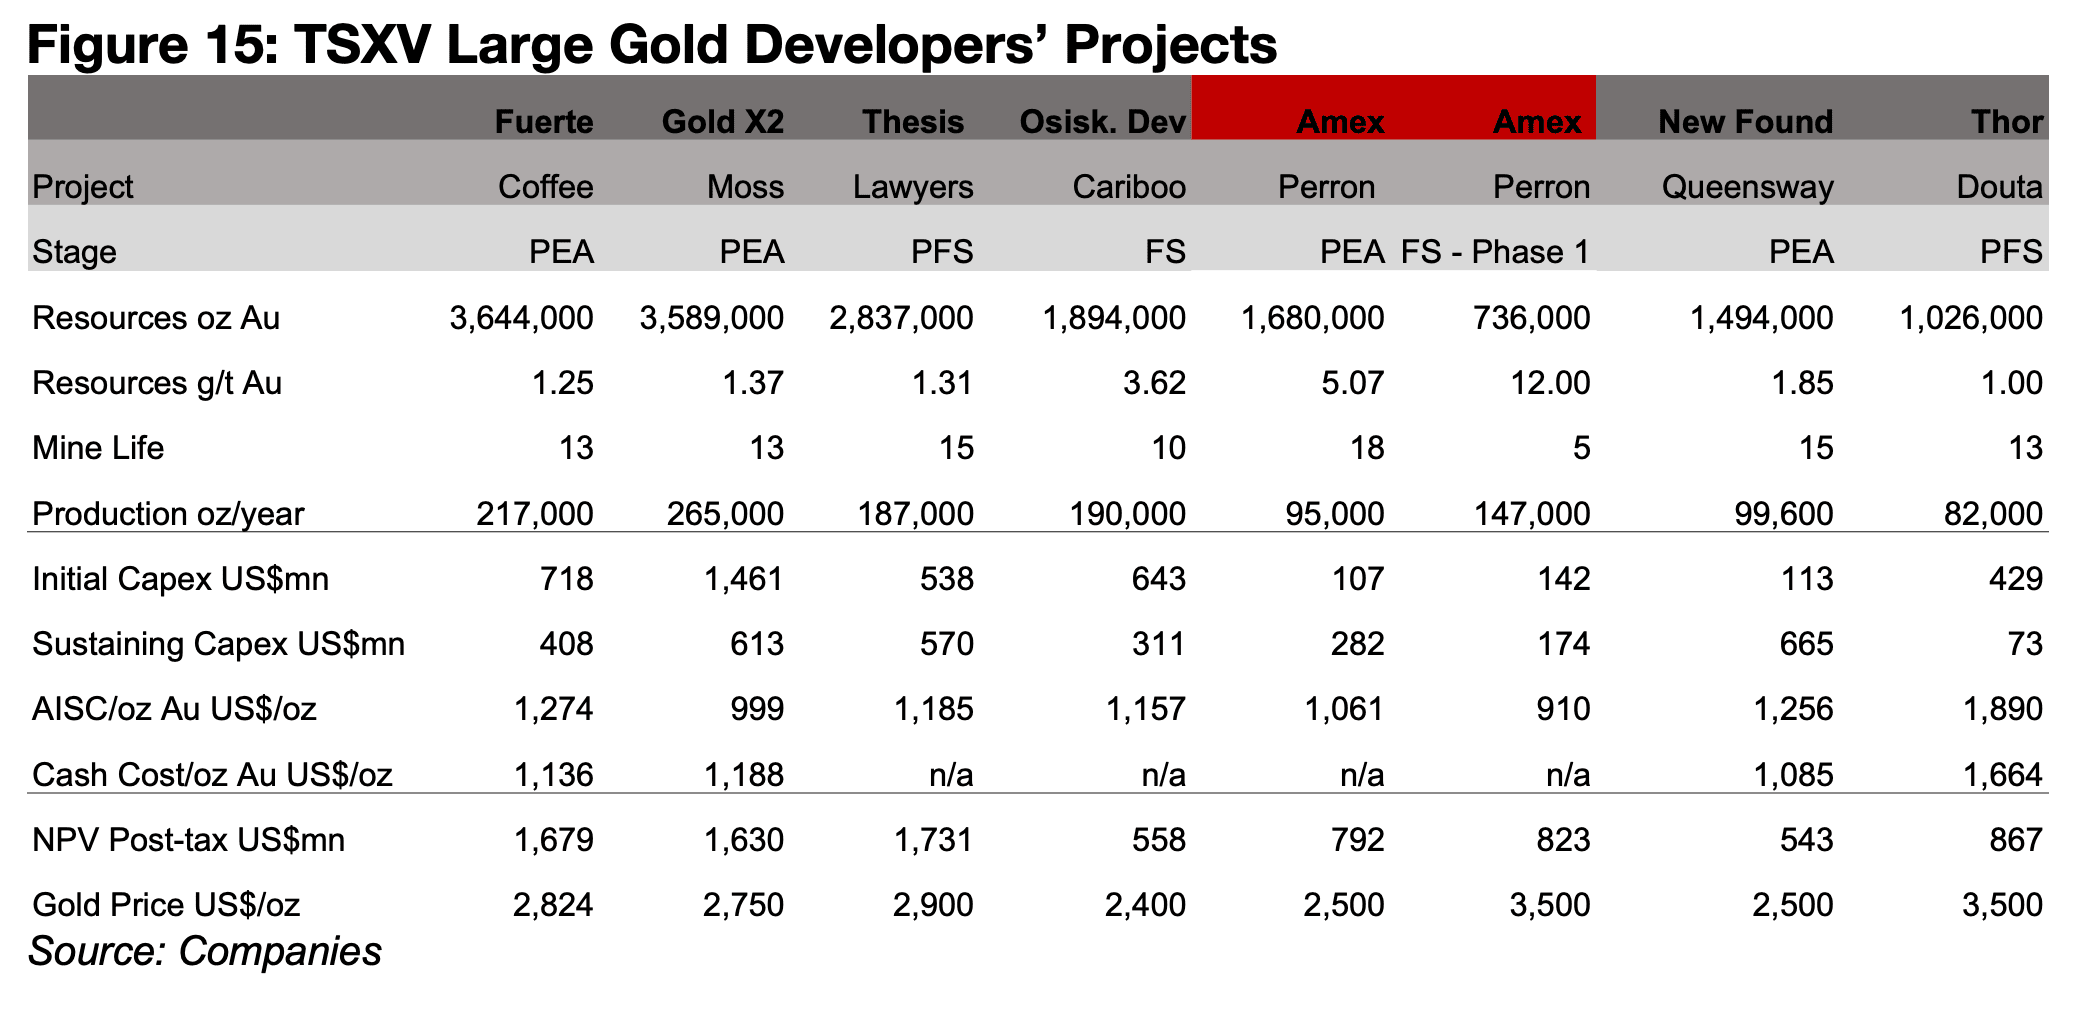
of the Perron Project. The previous PEA covered the full project, with 1.68 mn oz Au
of total production over 18.0 years, with an initial capex of US$107mn and sustaining
capex of US$282mn, an AISC of US$1,061/oz and a post-tax NPV of US$792mn at
a US$2,500/oz gold price (Figure 15).
The new Feasibility Study covers the first five years of the project, with a total output
of 736k oz Au, with a considerable jump in the grade to 12.0 g/t Au, and while this
looks very high compared to the 5.0 g/t Au for the entire project, it is actually only an
increase from the previous Phase 1 estimate in the PEA for 10.0 g/t Au. Initial capex
has increased substantially to US$142mn, but sustaining capex declined to
US$174mn as it does not cover the entire length of the project, and the AISC is down
to US$910/oz. As the company has applied a much higher gold price of US$3,500/oz,
the post-tax NPV still increases to US$823mn.
The company continues to explore a Perron West with an 15,000 m drill program
having already started with one rig, and a second is expected to start operating in
days. The company received key permits for a bulk sample of the Champagne zone
of the project and announced the final results for the grade control program for the
sample at the end of March 2026.
Disclaimer: This report is for informational use only and should not be used an alternative to the financial and legal advice of a qualified professional in business planning and investment. We do not represent that forecasts in this report will lead to a specific outcome or result, and are not liable in the event of any business action taken in whole or in part as a result of the contents of this report.
Author
Ben McGregor authors the Weekly Roundup at CanadianMiningReport.com, providing sharp analysis of the metals and mining sector. With a talent for spotting trends, Ben distills complex market shifts into clear, engaging insights on TSXV junior miners. His weekly updates cover gold, copper, uranium, and more, blending data-driven perspectives with a knack for identifying opportunities. A vital resource for investors, Ben’s work navigates the dynamic junior mining landscape with precision.