Known historically for high grade of gold
Red Lake has been one of the most prolific gold mining districts in Canada and the world, with exploration having started in the 1920s, and production, which began in the 1930s, continuing to the present day. The district is known for the high grade of its gold, its infrastructure, and strong institutional support, given the long history of mining in the area.
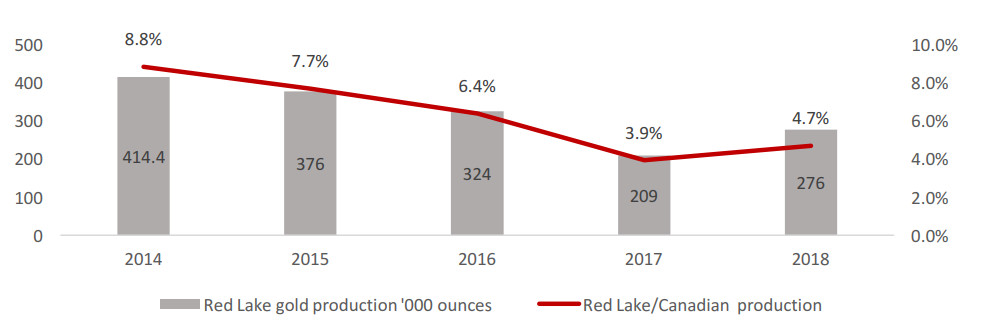
4.7% of Canadian, 0.3% of global production in 2018
The area has 2.17mn ounces proven and probable reserves and 2.73mn ounces measured and indicated (Source: Newmont Goldcorp). Red Lake accounted for 4.7% of Canadian gold production and 0.3% of global production in 2018, and had reached as much as 8.8% of Canadian production in 2014.
Output of 276k ounces over 2018
A single company, Newmont Goldcorp, is the only producing mine in Red Lake, with output of 276,000 ounces in 2018; the low 65,000 ounces of output in 9M/19 was driven by a production pause for maintenance. Newmont purchased Goldcorp, previously the only Red Lake producer, in Q2/19.


Great Bear seeing strong exploration results
However, two companies, PureGold and Great Bear Resources, have the largest potential to become Red Lake's next producing mines. Pure Gold has reached the feasibility study stage, announced proved and probable gold reserves, and expects first pour by 2020; Great Bear has not released proved and probable resources but has had a series of strong finds this year.
Known historically for high grade of gold
The rise in the gold price in the second half of 2019 has improved the potential economics of gold exploration considerably, which has encouraged many earlier stage explorers to either expand in, or enter for the first time, the Red Lake District. We offer a basic overview of several of these listed companies in this report, including PureGold, Great Bear, Rubicon, Pacton Gold, BTU Metals, GoldOn, Nexus Gold, MaxTech, Confederation Minerals, Prime Meridian, and Pistol Bay Mining.
4.7% of Canadian, 0.3% of global production in 2018
While the gold demand and supply situation does not necessarily point to another big jump in the price next year, it does look supportive of current levels, with the market looking for about US$1,475/ounce on average in 2020 (with some outlier high estimates looking for US$2,000). Nonetheless, this will place the price well above the costs for gold production, and encourage existing and new entrants in Red Lake to expand their production or exploration activities for the forseeable future.
Output of 276k ounces over 2018
A combination of 1) high grade gold, 2) supportive infrastructure, 3) relatively bullish gold price economics, 4) a currently large volume produced by a major operator, 5) impressive new gold finds by more established explorers, and 6) many new entrants now exploring the region, all point to a continued strong period for Red Lake. The main risk is a severe decline in the gold price, which seems improbable in the short to medium term.
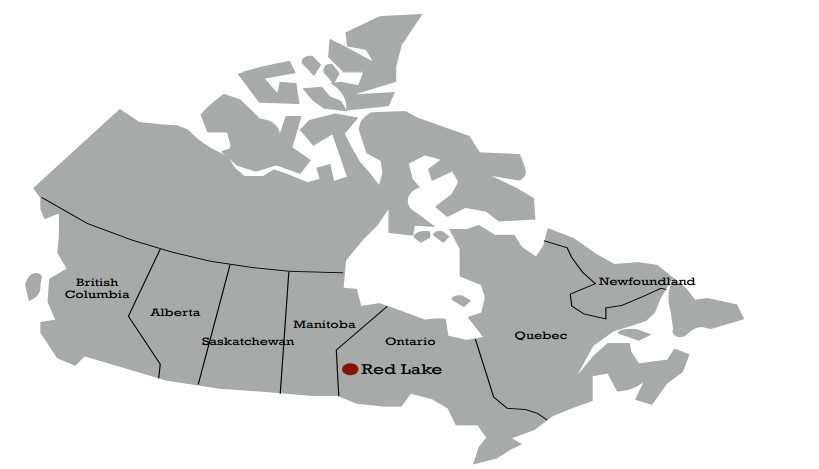
Red Lake is located in the west of the province of Ontario (Figure 1). The Red Lake District is one of Canada's most productive long-term gold mining sites, with a total production of 28mn ounces since production began in the 1930s, and production occurring relatively uninterrupted over the entire period.
Even with a relatively low output in historical terms of just 65,000 ounces in 9M/19 (largely because of maintenance) Red Lake will still be one of Canada's largest gold producers in 2019. The largest is Yamana's Malartic mine, with 499,000 ounces of output over 9M/19; the second largest, Barrick's Hemlo, produced 159,000 ounces. Eldorado's Lamaque mine, at 65,000 ounces for 9M/19, is around the same level as Red Lake. However, a return to a sustainable production level (production was 276,000 ounces in 2018) would likely see Red Lake become the clear number three gold producer in Canada next year.
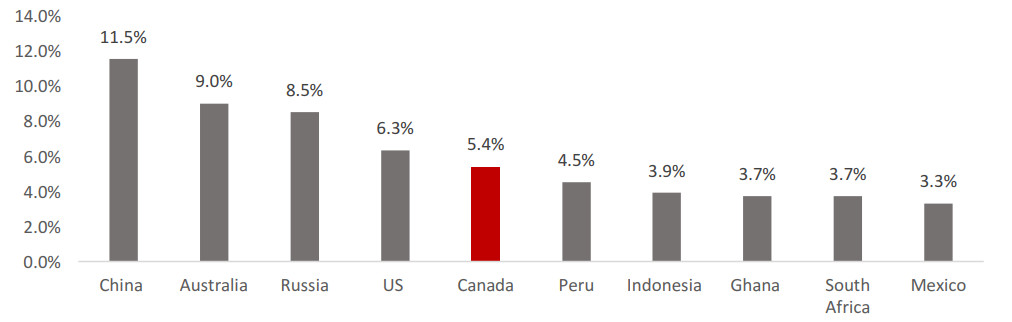
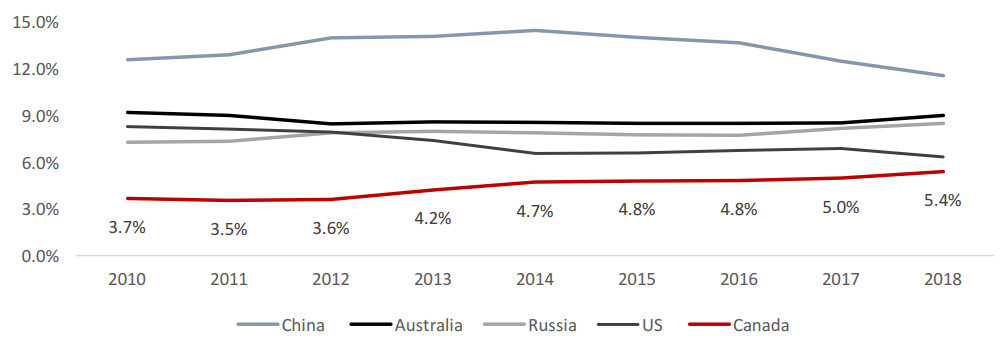
As a major contribution to Canadian gold output this also makes the Red Lake District a key contributor to gold output in a global context, given Canada's substantial contribution to global gold supply. Canada was the fifth largest supplier in the world in 2018, at 5.4%, after China, Australia, Russia and the US (Figure 2). Canada's contribution to gold supply has also been rising considerably over the past decade, from 3.7% in 2010 to above 5.0% by 2017 (Figure 3).
In recent years, Red Lake has been a major source of gold production in Canada, averaging 6.3% of the total from 2014 to 2018. Although its proportion has been declining, we could view its huge 8.8% contribution to output in 2014 as an outlier, and the 4.7% of 2018 is still sizeable, but more sustainable. Given the large contribution to global production by Canada, Red Lake's contribution to global production is also high, at 0.3% in 2018, and averaging 0.3% from 2014 to 2018.
Red Lake has historically been particularly attractive to producers and exploration firms for the quality of its gold deposits, and its strong institutional support. The local government has a very long track of record of supporting mining activities, and the process of receiving permits is well defined. There are few environmental issues, as any would have been well visible by now, given the area's multi-decade history of gold production.
Current production from Red Lake comes from a single company, the US's Newmont Goldcorp, with Newmont acquiring Goldcorp and its Red Lake mine in Q2/19. With this report focused on junior miners, we only touch on Newmont Goldcorp briefly, especially as its market capitalization dwarfs the other Red Lake companies, at US$35.0bn, and Red Lake contributes only 1.5% of its gold production.
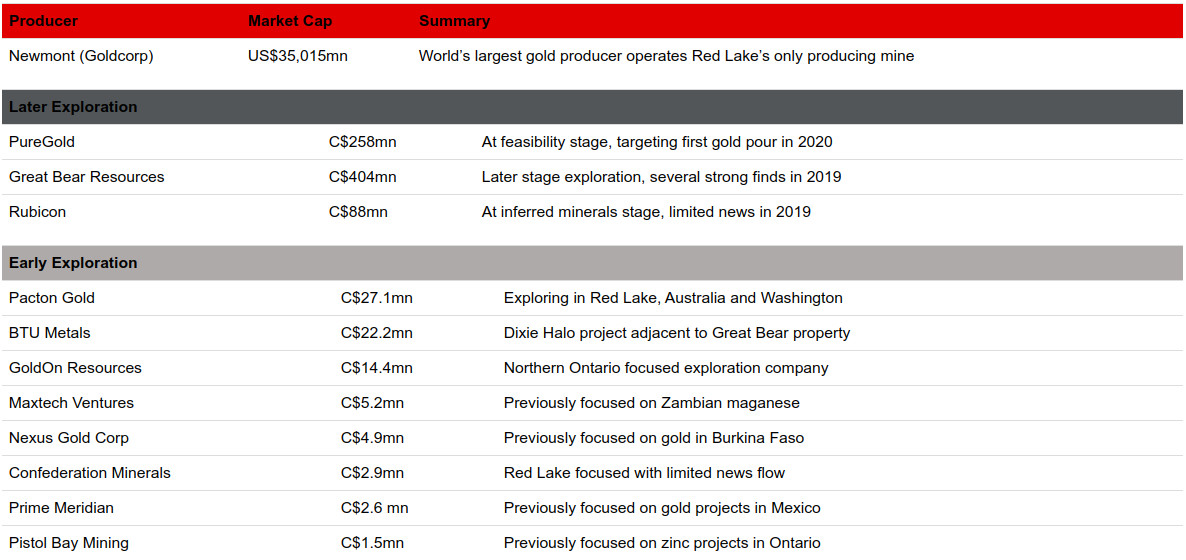
Two companies are in the later stage of exploration in Red Lake, PureGold and Great Bear, which are nearly pure plays on the district (Great Bear has some additional property close to, although not in, Red Lake), and have relatively substantial market capitalizations (PureGold C$258mn, Great Bear C$404mn). PureGold reached the feasibility study stage in early 2019 and expects to see its first gold pour by 2020. Great Bear Resources, while in an earlier stage of exploration, has seen strong drilling results over the past year, which has driven its market cap up ahead of the later stage Pure Gold. The next largest player in the area is Rubicon, although at C$88mn it has just around a third of the market cap of Pure Gold and Great Bear, as it is still at the stage of reporting only inferred mineral resources.
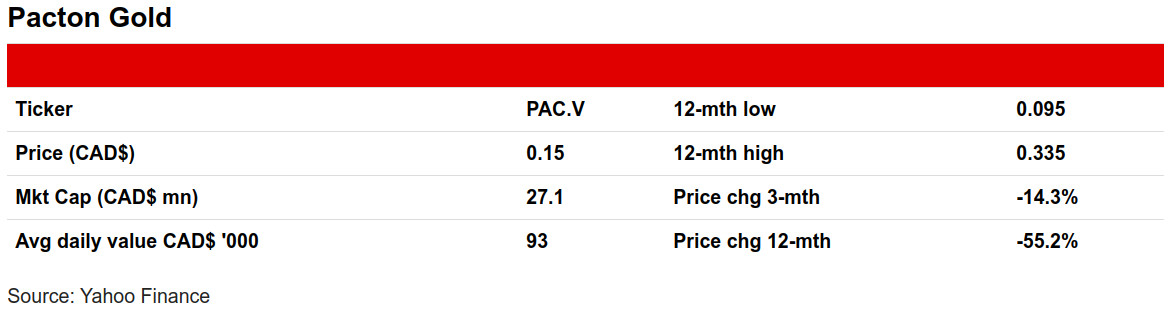
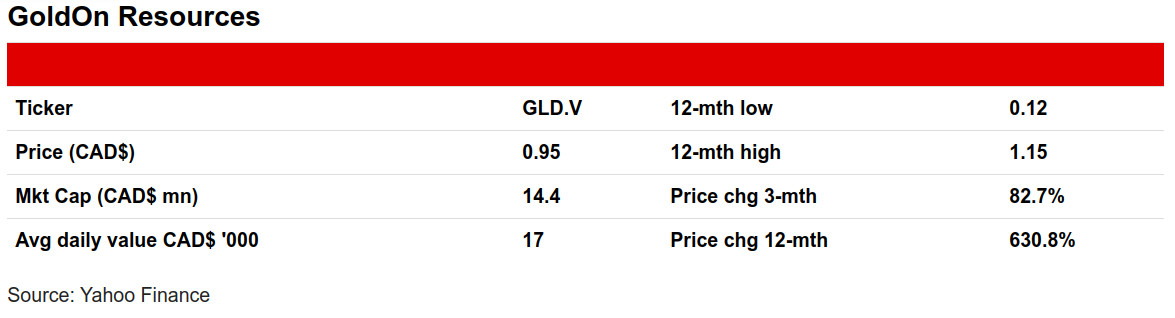
The next tier of Red Lake operators in terms of market cap are; 1) Pacton Gold, with a market cap of C$27.1mn, with operations in Western Australia and Washington State, in addition to Red Lake, 2) BTU Metals, with a market cap of C$22.2mn, which operates a project beside Great Bear's project in an area that is believed to have been relatively underexplored, and 3) GoldOn, with a market cap of C$14.4mn, which has other properties in Northern Ontario, and an option on the Red Lake West Madsen project.
The other companies at Red Lake are much smaller, and in a very early stage of exploration, with many having only acquired options to explore in Red Lake over the past year. They all have market caps around US$5mn or below; Maxtech Ventures (C$5.2mn), Nexus Gold Corp (C$4.9mn), Confederation Minerals (C$2.9mn), Prime Meridian (C$2.6mn) and Pistol Bay Mining (C$1.5mn). In the individual company section below, we go into more detail on the operations of all these companies.
The gold price has recovered substantially in 2019, starting from June 2019, to an average US$1,461/ounce over the second half of the year, after averaging just US$1,244/ounce from 2014 to mid 2019 (ranging between a high of US$1,485/ounce and low of US$1,060/ounce) (Figure 6). This increase, sustained for roughly half a year, is the major factor driving the rising interest in Red Lake from exploration firms. Should the price hold up, the payoff could be much higher from these activities.
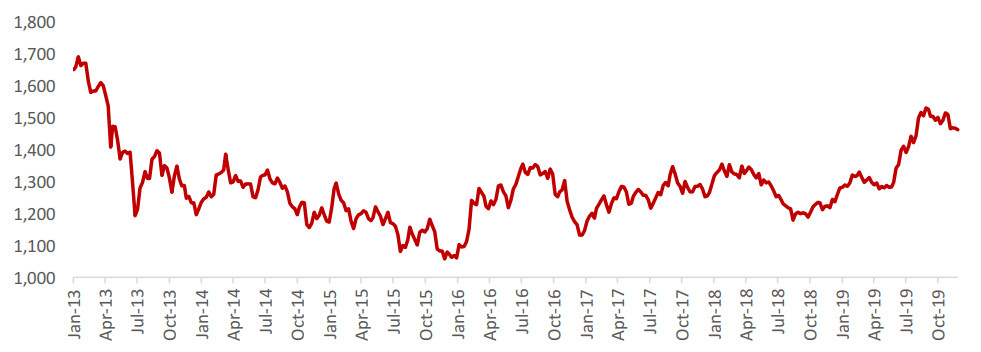
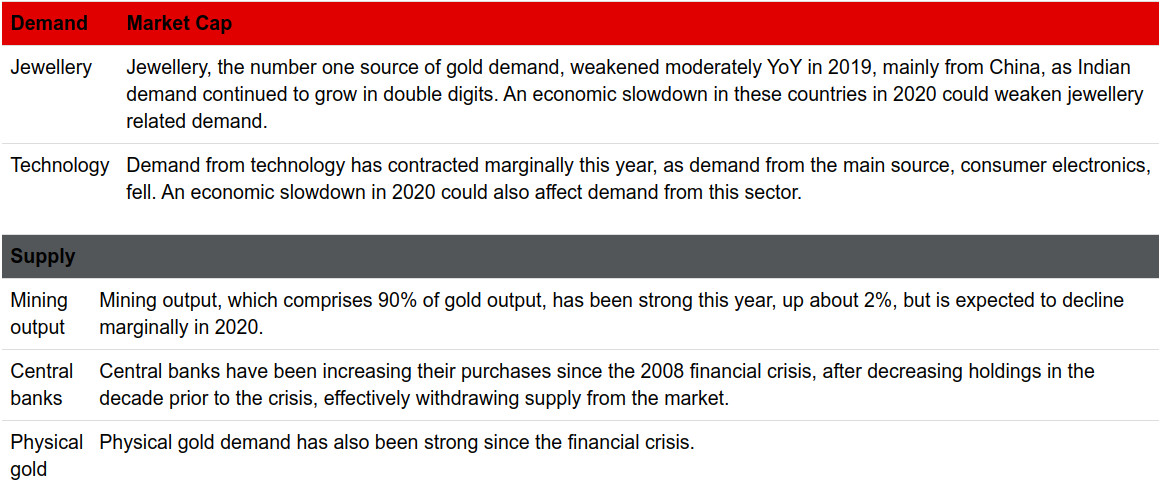
Even if we don't see a move much above an average price of US$1,500, this would still remain very attractive, given an all-in cost of operating producing mines at around US$700/ounce to US$1,300/ounce. In Figure 7 we outline the main factors determining the gold supply and demand, and conclude that generally the outlook should be supportive of prices at least around the current level, if not higher. This could support expansion by the existing players, as well as the potential for more entrants.
The demand drivers for gold appear to be supportive of a price around the current level being sustainable into 2020, in our view. The two core demand drivers are 1) jewellery, which is in turn driven by China and India, and has contracted by low single digits over H1/19, and 2) technology demand, also down moderately YoY. These two drivers could be affected if an economic slowdown occurs in 2020. On the supply side, mining output growth is up by low single digits this year, but is expected to decline in 2020. On balance, if we assume a marginal pull back in jewellery and technology demand is offset by a decline in mining output, gold prices could be maintained at current levels into 2020.
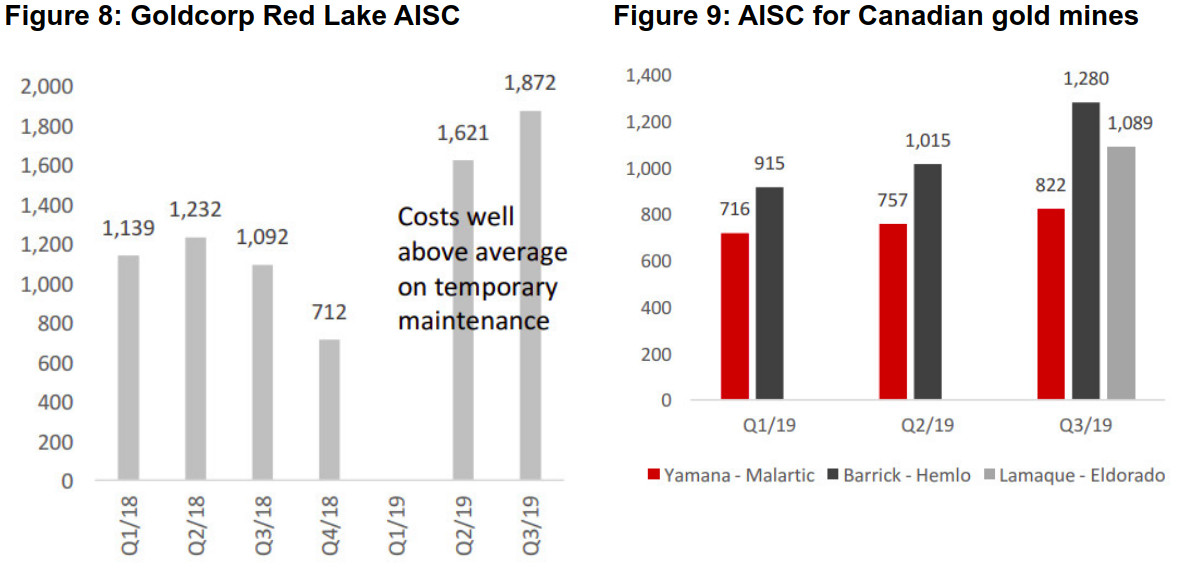
As Newmont is the only mine operating in Red Lake, it provides the only clear guidance for the production costs per ounce in the area. The all-in sustaining costs (AISC) for Newmont by quarter are shown in Figure 8, at an average US$1,044/ounce in 2018. Given Newmont's acquisition of Goldcorp over Q1/19 and into Q2/19, there is no Q1/19 information, while the Q2/19 and Q3/19 cost levels are extraordinary figures due to some temporary maintenance.
For comparison, Figure 9 shows the all-in-sustaining costs of some other major mines in Canada over 2019. Production costs range from a low US$716/ounce for Yamana's Malartic in Q1/19 to a high of US$1,280/ounce for Barrick's Hemlo mine in Q3/19. Overall the data suggests that as gold sees a sustained period over US$1,400 that the economics of production, and in turn exploration, becomes attractive, and producers can assume a reasonable margin on operations.
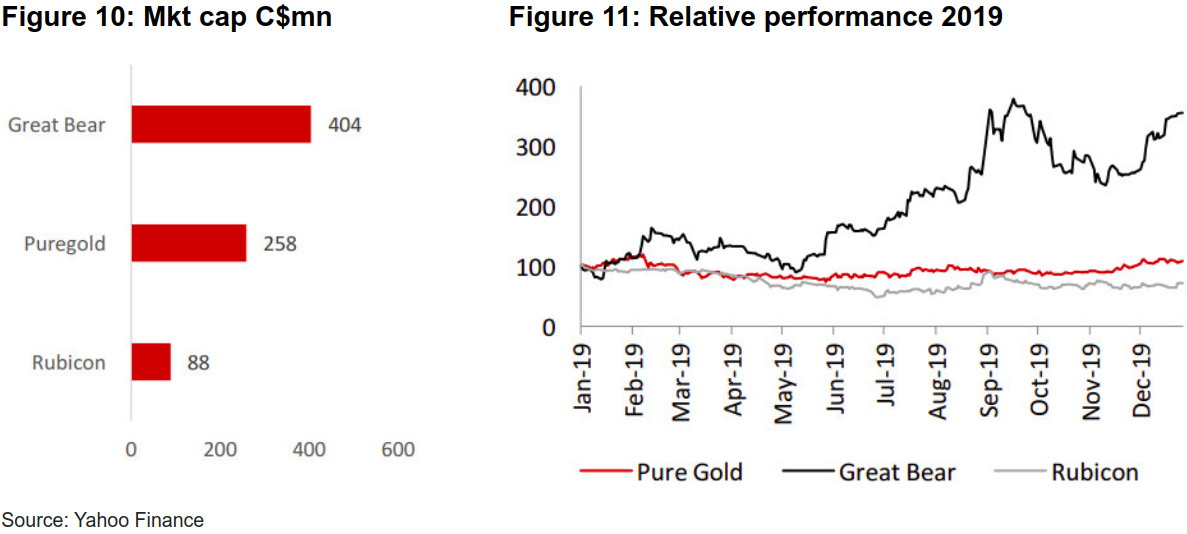
Of the three relatively larger cap junior miners in Red Lake, Great Bear (C$404mn), Puregold (C$258mn), and Rubicon (C$88mn) (Figure 10), Great Bear has been the clear outperformer, up 256% in 2019, related to substantial announcements of finds throughout the year. PureGold has had comparably moderate gains, up 9%, while Rubicon has slid by -28% on a lack of news flow (Figure 11), with the market possible still wary after a large stock collapse in 2015.
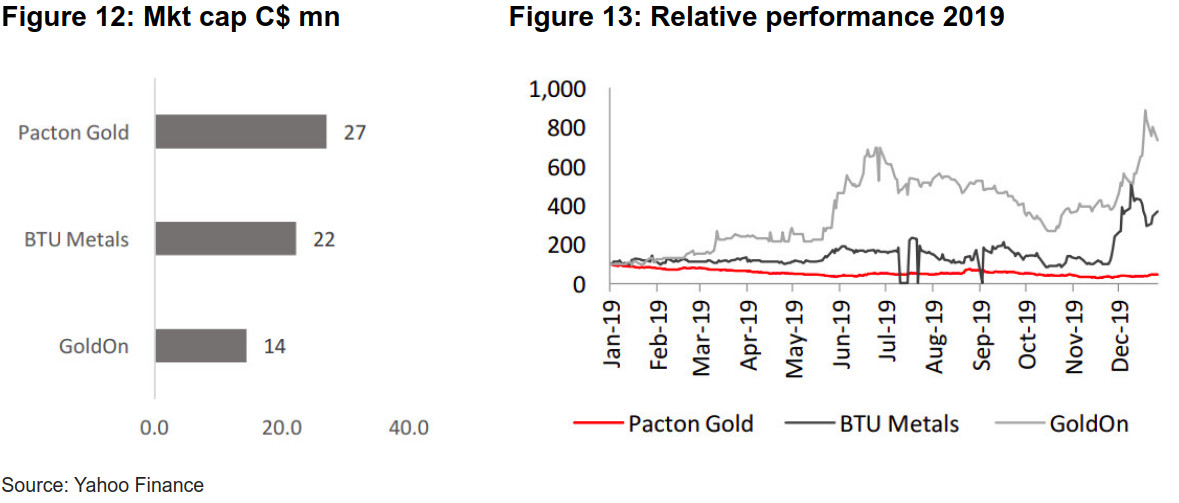
For the mid-sized junior miners at Red Lake, fortunes have been mixed. The largest of the group, Pacton Gold (C$27mm) has faced a -55% decline in 2019 as drilling results from multi-country properties and its Red Lake expansion failed to impress the market (Figure 12). In contrast, GoldOn (C$14.4mn) and BTU (C$22.2mn) soared, up 631% and 267% on strong exploration announcements, although GoldOn is well off its Red Lake-acquisition driven mid-year peak (Figure 13). BTU also weakened off mid-years high in October and November, but has recovered in December after announcing strong drilling results.
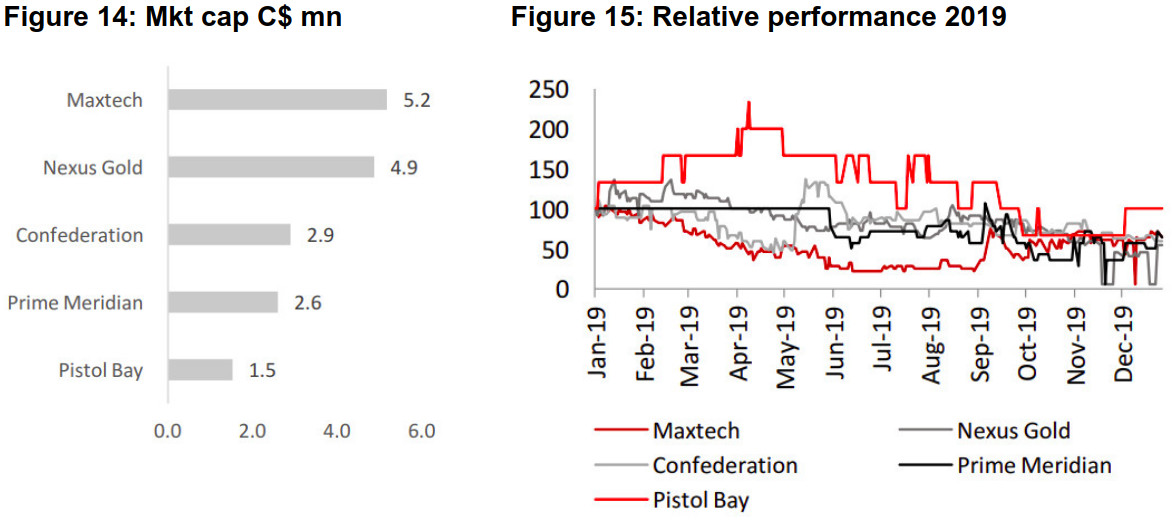
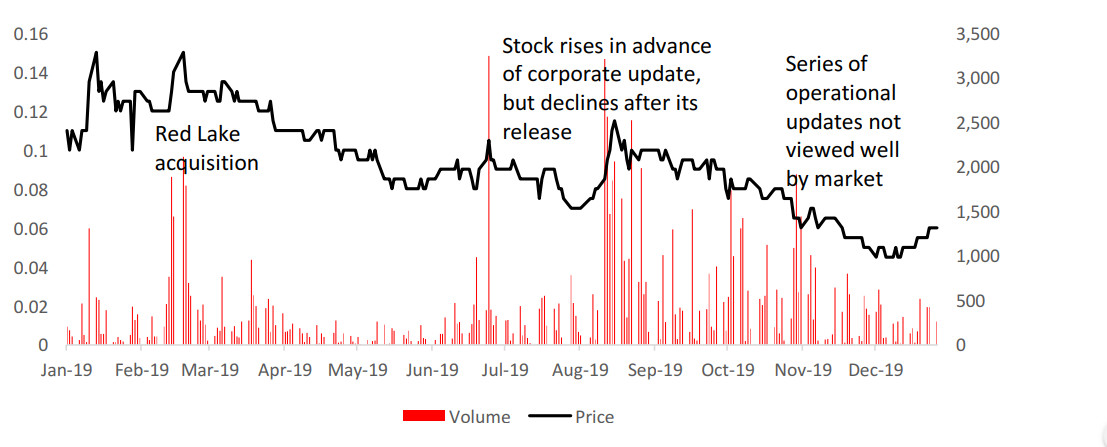
The share price outcomes for the small cap junior miners, which are necessarily built more on hope than the concrete results of the other miners in this report, have been weak this year, with most of the five down substantially since the start of 2019, with Maxtech (C$5.2mn), Nexus (C$4.9mn), Confederation Minerals (C$2.9mn), Prime Meridian (C$2.6mn), and Pistol Bay (C$1.5mn) (Figure 14) down -36%, -46%, -41%, -36%, and 0%, respectively in 2019 (Figure 15).
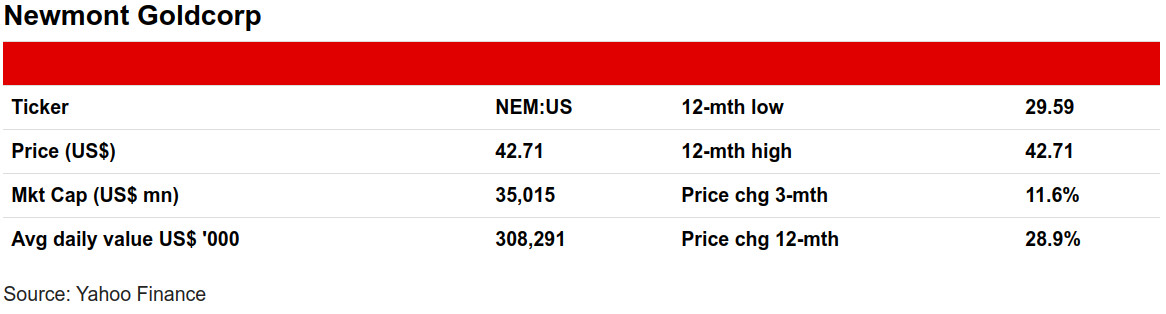
The only mine currently producing gold in Red Lake is owned by S&P-listed Newmont Goldcorp, the world's largest gold producer. The company was formed when larger global miner Newmont acquired Canada's Goldcorp, with the deal closing in April 2019. The deal demonstrates the possible future for any of the Red Lake junior miners that we outline in this report that make a substantial gold discovery; an eventual buyout by a larger firm with sufficient capital to fully exploit any major finds. The presence of such a major player puts most of the juniors in Red Lake in a somewhat improved position in terms of access to potential deals which such a behemoth operating in the area.
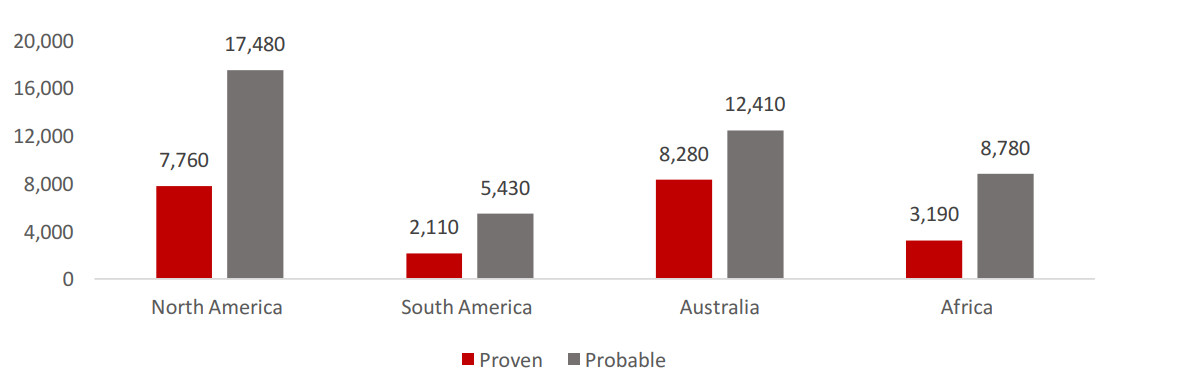
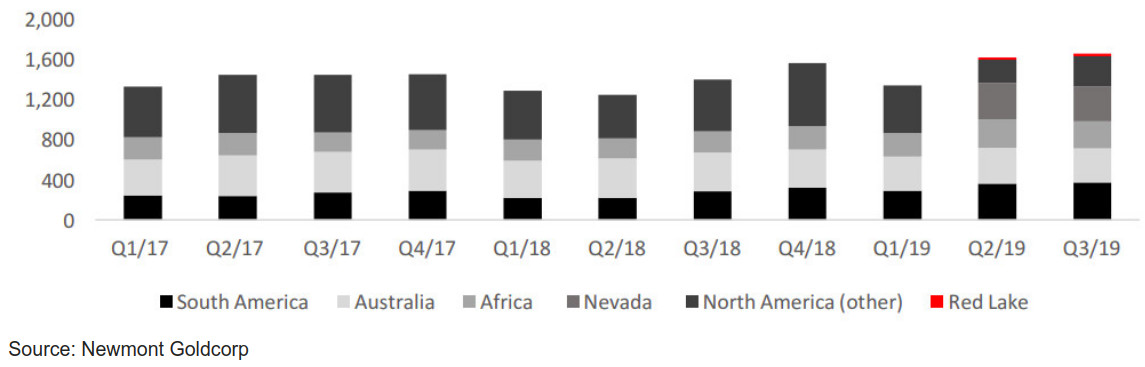
In contrast to the rest of the stocks in this report, most of which are heavily Red Lake focussed, Newmont is widely diversified with multiple projects across three continents (Figure 16). Red Lake is only a small contributor to Newmont Goldcorp's output, accounting for 1.5% of the company's production in Q3/19 (Figure 17).
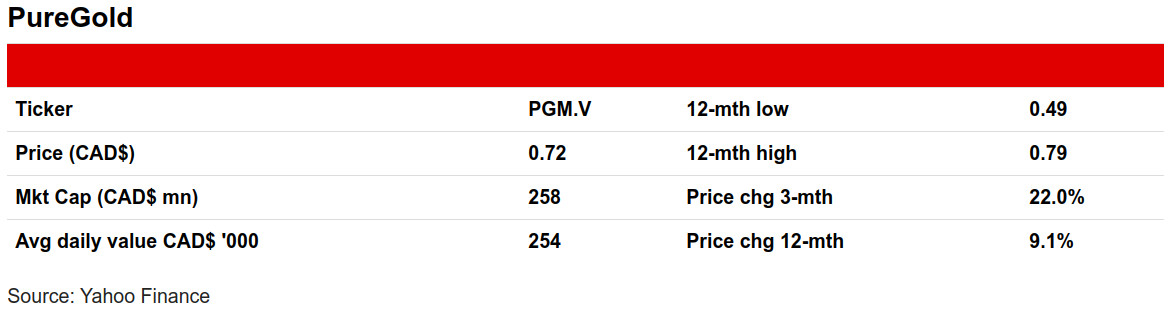
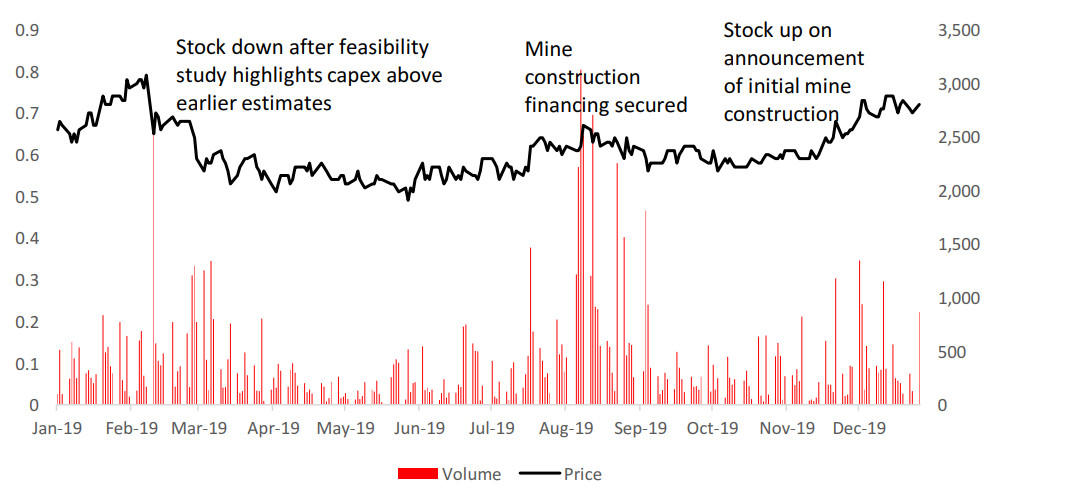
Of the Red Lake junior miners, Pure Gold is the closest to production, and targets pouring first gold by 2020. The stock weakened in the first half of 2019 after a feasibility study reported capex of C$95mn for the project, nearly double earlier expectations. However, the combination of a rising gold price and securing financing for mine construction drove the stock to a high in August 2019, which drove some profit taking. The stock has rebounded after the company announced it was progressing with initial mine construction in its Q3/19 results.
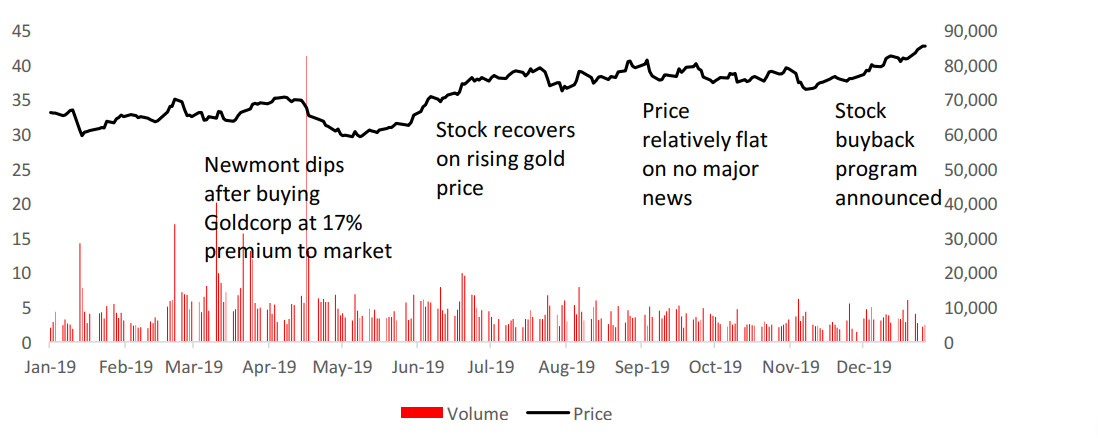
Source: Yahoo Finance
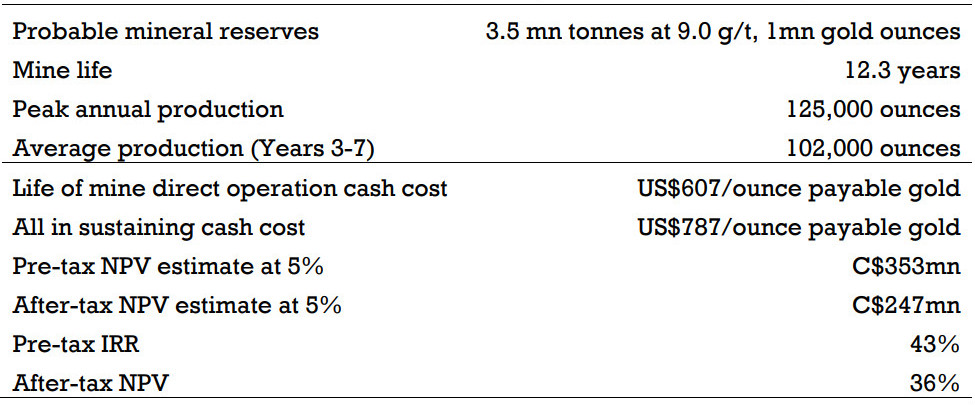
PureGold's Madsen project has reported successful drilling results throughout 2019 at a series of holes, helping back up the details of the feasibility study released in February 2019 (Figure 20). The study suggests probable mineral reserves for the project of 3.5 tonnes at 9.0 g/t, for 1mn gold ounces, with a mine life of 12.3 years, peak annual production of 125,000 ounces, and an average production of 102,000 ounces per year through years 3-7 of the project.
Using an estimate of US$1,275 per troy ounce, and an all in sustaining cash cost of US$787/ounce, the feasibility study estimates an after tax NPV for the project of C$247mn. With the share price averaging about C$0.63 from August 2019 to December 2019, for a market cap averaging about C$225mn, it suggests that the market had been valuing the company below the NPV of the feasibility study. However, the recent run up in share price to the current market cap of C$258mn suggests that the market is currently ready to pay a premium of about 4.5% to the implied value in the feasibility study.
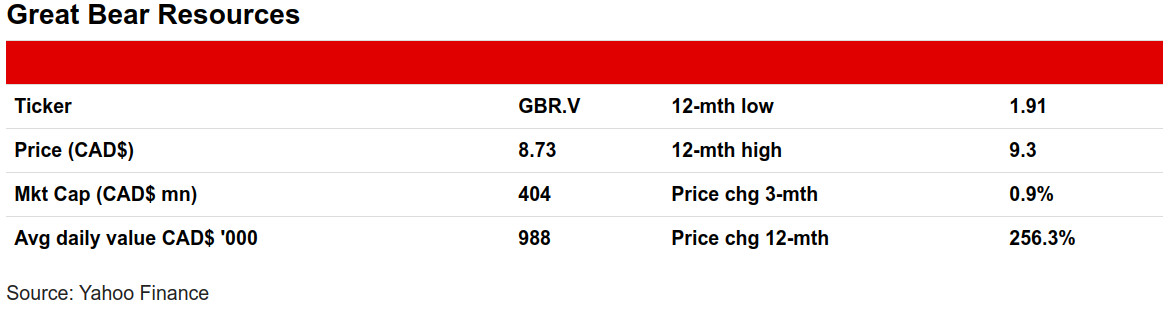
Great Bear Resources has seen a 256.3% increase in its stock price in 2019, as increasingly strong drilling results continue to be reported (Figure 21). While the company is not at as advanced a stage as PureGold, with no proven or probable estimates yet released, exploration results have been encouraging to the market. The company has reported five major finds in 2019 along its 20 km project, the Hinge Zone, Bear-Rimini, Yuma, Auro, and Yauro (in additional to an initial strong results from Dixie Limb in 2018) that have led to increases in the share price.
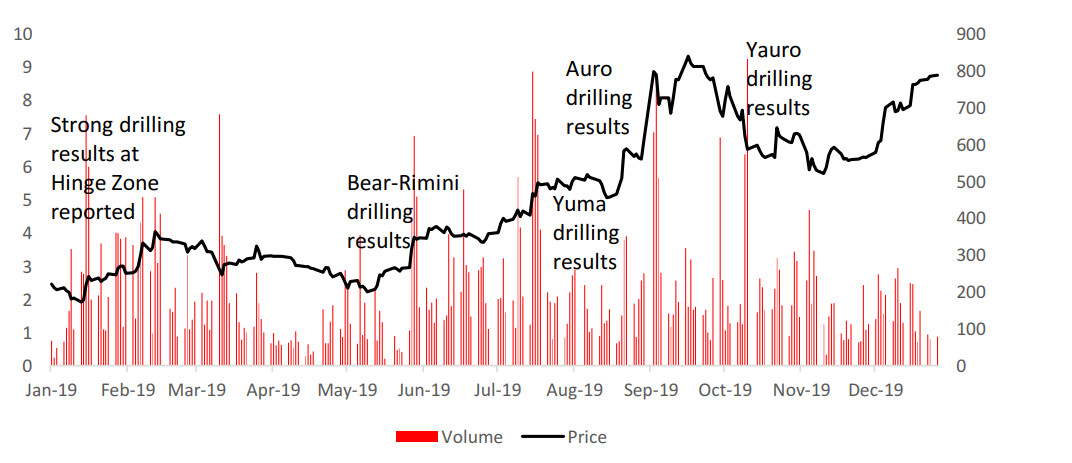
Great Bear's five major finds this year alone would have been a strong share price driver, even if considered as isolated areas on the overall property. However, even more encouragingly, the company has also announced that they are seeing increasing evidence of continuity along the area. This suggests an increasing probability that the strong gold results could be more consistent throughout the whole project. Great Bear management indicates that they were not necessarily expecting to find this degree of continuity. Further evidence of this could indicate a much larger gold deposit in the area than originally expected.
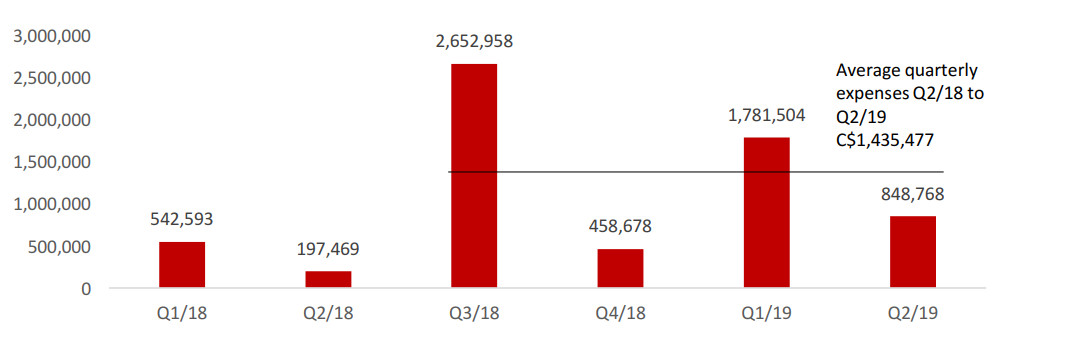
After this series of strong announcements in 2019, it will be key for Great Bear to continue its exploration program to maintain its share price. The company is currently well funded through 2020. Costs have averaged about C$1.44mn dollars per quarter over the four quarters to Q2/19 since the exploration began (Figure 22). With cash of C$9.6mn currently, even if the company's exploration program had expenses of US$1.6mn per quarter on average, it could continue operating until Q4/20.
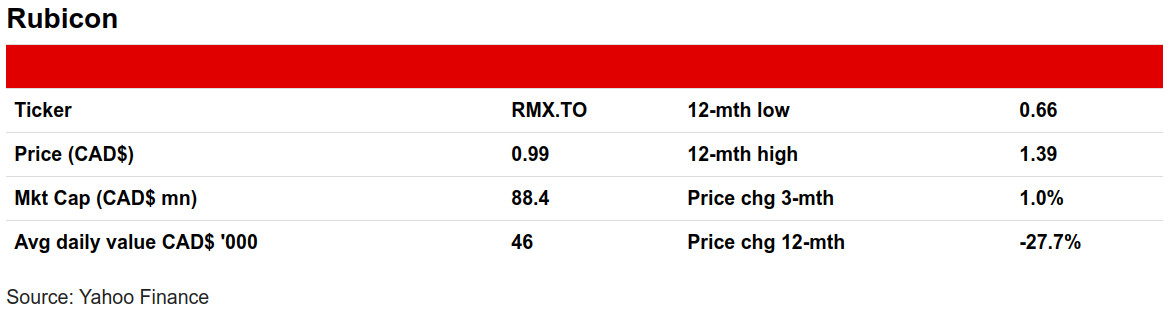
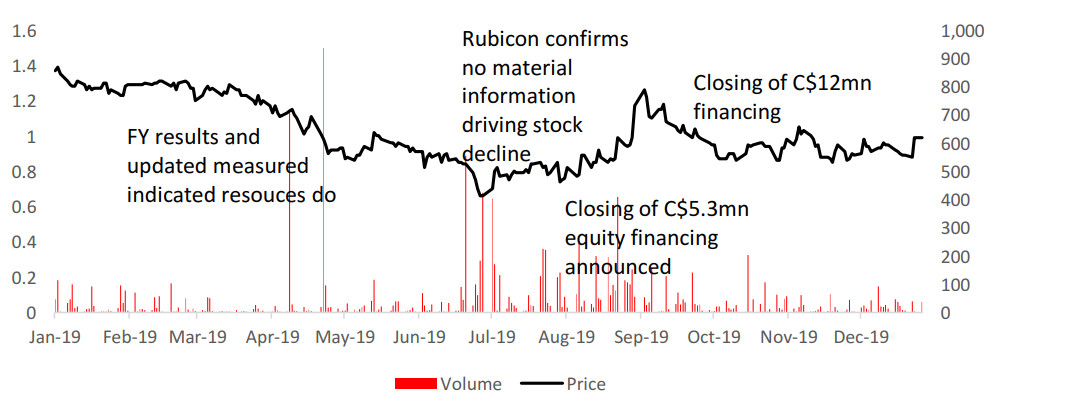
At a market cap of C$88mn, Rubicon is less than a third the size of PureGold or Great Bear. The company's Phoenix Gold project at Red Lake is only at a stage where they can report highly speculative inferred mineral resources (of 2,570,000 tonnes at 6.53 g/t for 540,000 ounces). The stock is down -28% for the year (Figure 23), and still likely faces some market wariness following a massive 2015 collapse from around C$200/share to C$2/share by early 2016. Rubicon had moved directly to production at its Phoenix project in 2015, skipping crucial feasibility study stages, but in the end had to stop production when the find proved more complex to develop than was originally expected.
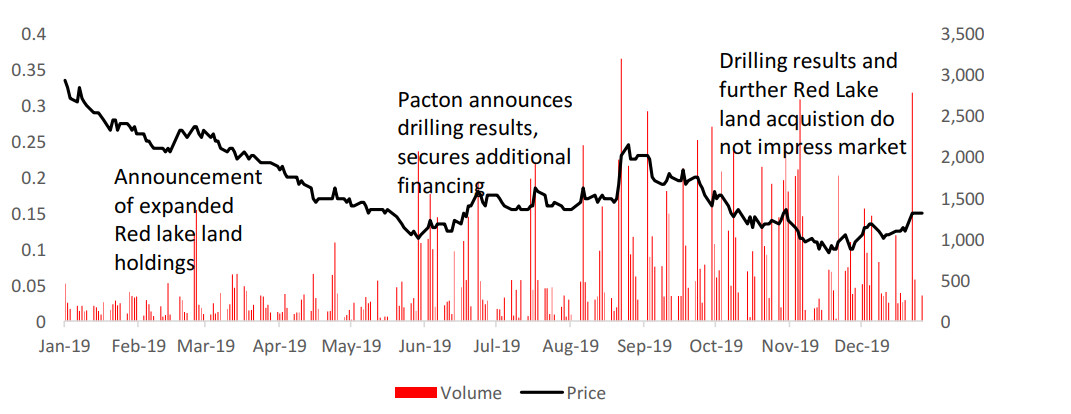
In contrast to PureGold, Great Bear, and Rubicon, Pacton is not a Red Lake pure play, and also has exploration ongoing in Pilbara in Western Australia, as well as Washington state in the US. The stock has been weak this year, down -55%, with the share price falling throughout the first half of the year, even as the company expanded its Red Lake holdings (Figure 24). After a mid-year boost from announcements of decent drilling results at Red Lake and securing additional financing, the stock declined off late August highs as announcements of further drilling results and Red Lake land acquisition failed to impress the market.
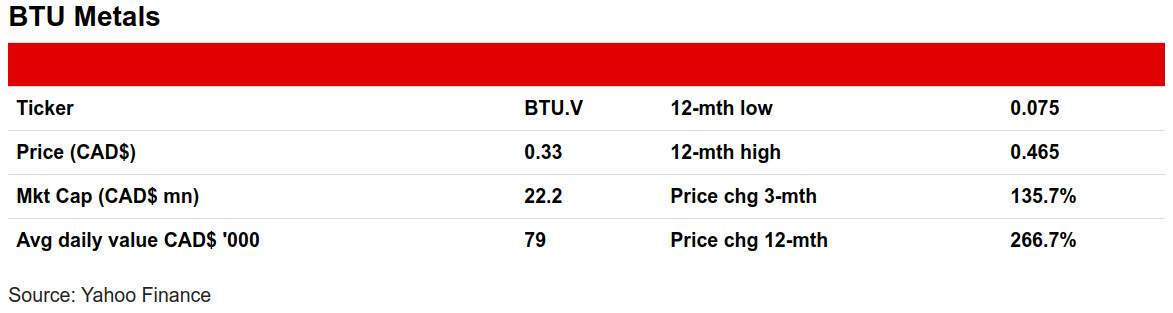
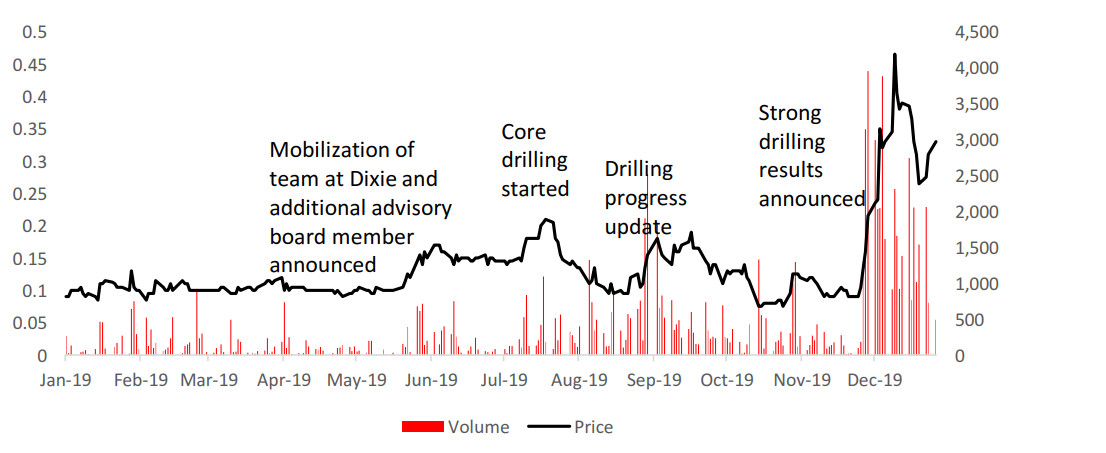
BTU Metals operates the Dixie Halo project which is beside Great Bear Resources' Dixie project. BTU Metal's project is relatively unexplored, with fewer than two dozen historic holes, compared to Great Bear's Dixie project, which had hundreds of holes drilled before its acquisition by Great Bear. However, the geophysics are similar to the Great Bear Resources project, which has seen increasingly impressive exploration results this year. Nonetheless, the stock languished through most of 2019, flat from January to late November. Strong drilling results have emerged in recent weeks, however, leading to a tripling of the price (Figure 25).
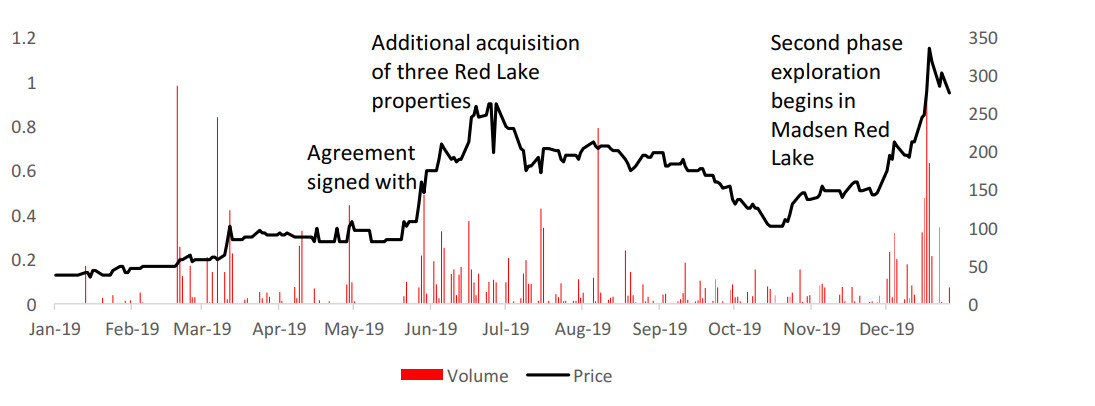
GoldOn is a Northern Ontario focused discovery stage gold exploration firm, with its core project the 100%-owned Slate Falls project, for which results are pending. In Red Lake, the company has; 1) the option for 100% of Great Bear's West Madsen property, with similar geology to recent Red Lake drilling success stories, and for which Phase II exploration is proceeding, and 2) an option to acquire a 100% interest in a Bruce Lake property. While the agreement with Great Bear and the acquisition of three additional Red Lake properties boosted the stock in the first half of 2019, it declined in H2/19, but recovered from late October when the Madsen second phase was announced (Figure 26).
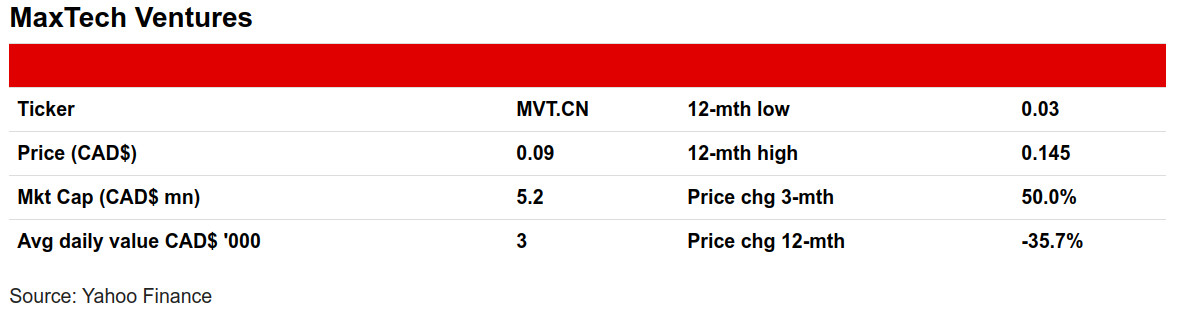
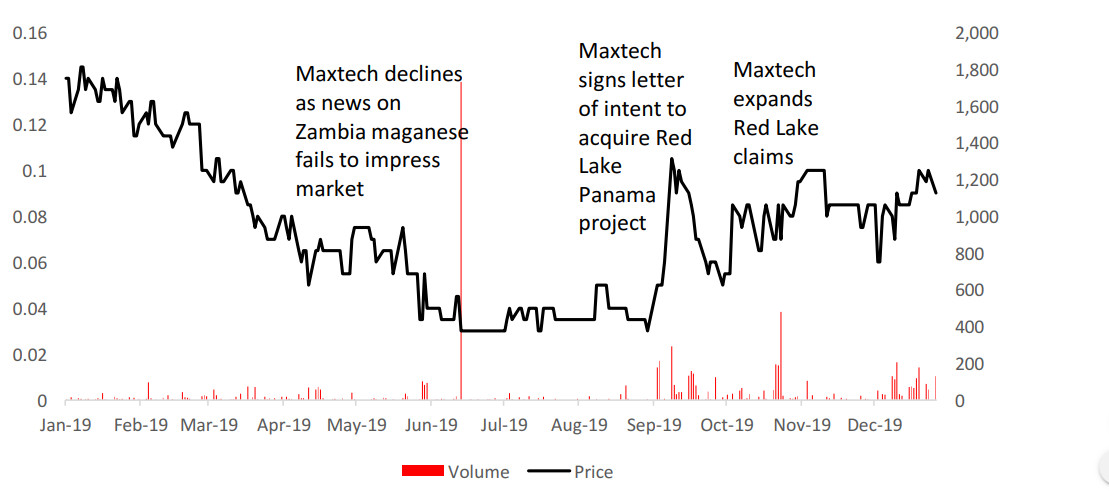
MaxTech is a diversified junior explorer which until recently focused on vanadium exploration in Brazil and on manganese exploration in Zambia. Its presence in Red Lake is relatively recent, with the company having signed a letter of intent to acquire the Red Lake Panama project in September 2019. The Panama property is on trend with the Great Bear Red lake property, about 50 km away. MaxTech executed on the agreement to acquire the Red Lake property in October 2019, expanded its claim in Red Lake in November, and has begun early exploration.
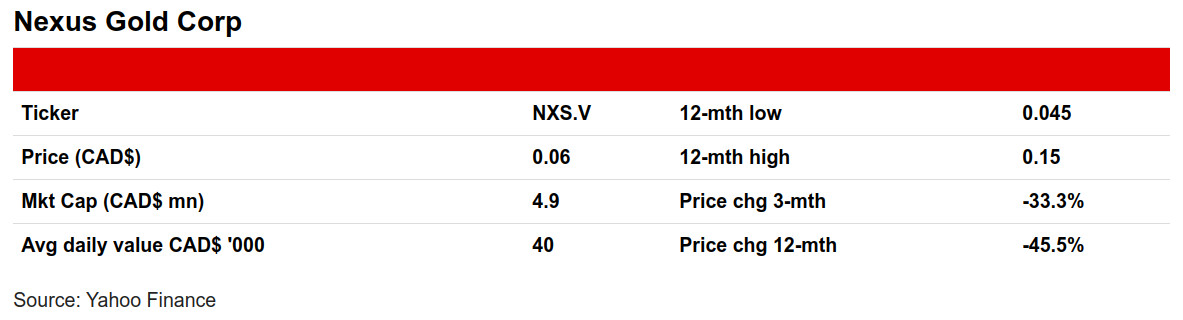
Nexus Gold is another exploration firm with projects beyond Red Lake. The company's main operations until late 2018 consisted of four projects in Burkina Faso, West Africa. In late 2018, the company announced the acquisition of a project in British Columbia, and then in late January 2019 it announced that it would acquire the McKenzie Gold project in Red Lake. While the Red Lake acquisition gave some support to the stock in early 2019, barring a rise before a September 2019 corporate update which seems to not have impressed the market, the stock has declined substantially this year, down -45% (Figure 28).
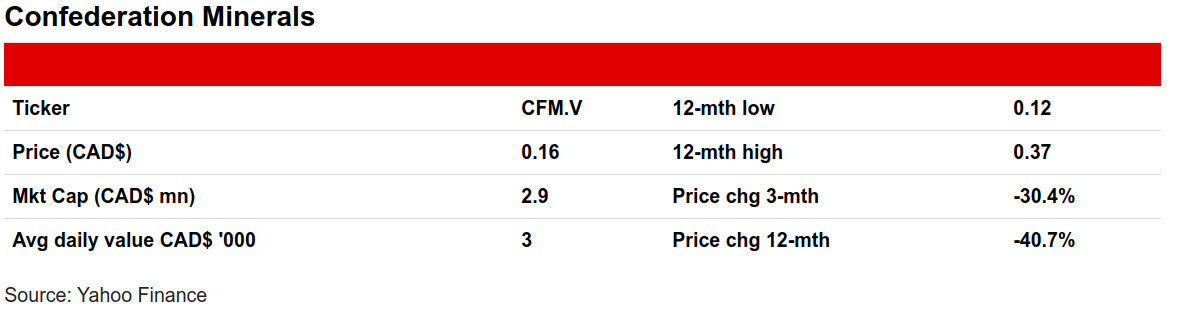
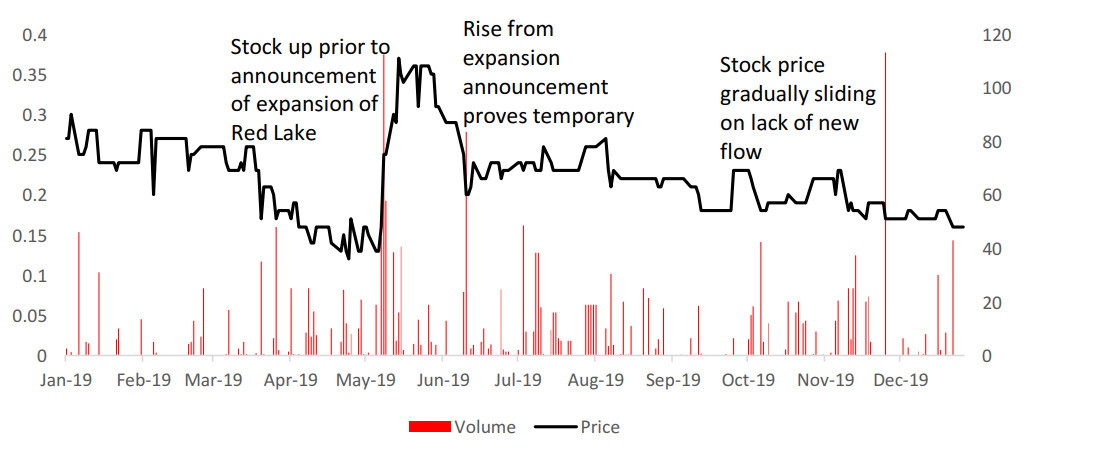
Confederation Minerals is a smaller exploration company focused only on Red Lake via its core Newman Todd project. There is limited news flow on this operator, with the most significant release as far back as May 2019, when it announced that it would expand its Red Lake operations to include two more properties in the area. The stock price rose significantly in advance of this announcement, and then sold off shortly after (Figure 29). Since then, the price has gradually declined with no news updates on the company's website, and the price is now down -41% since the beginning of 2019.
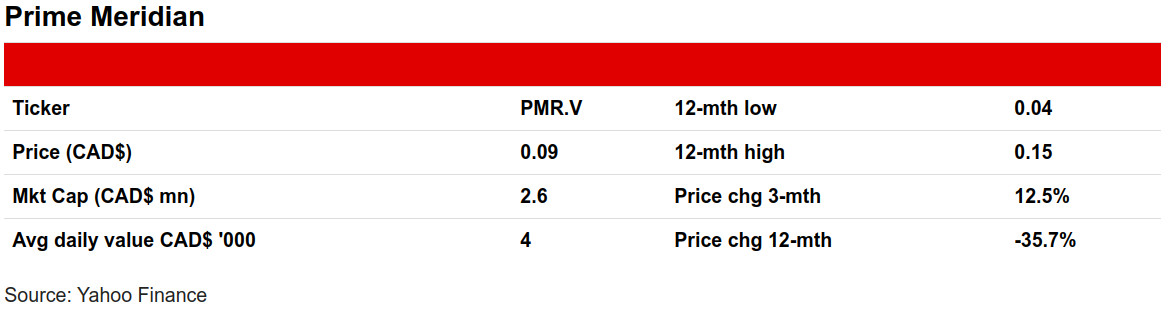
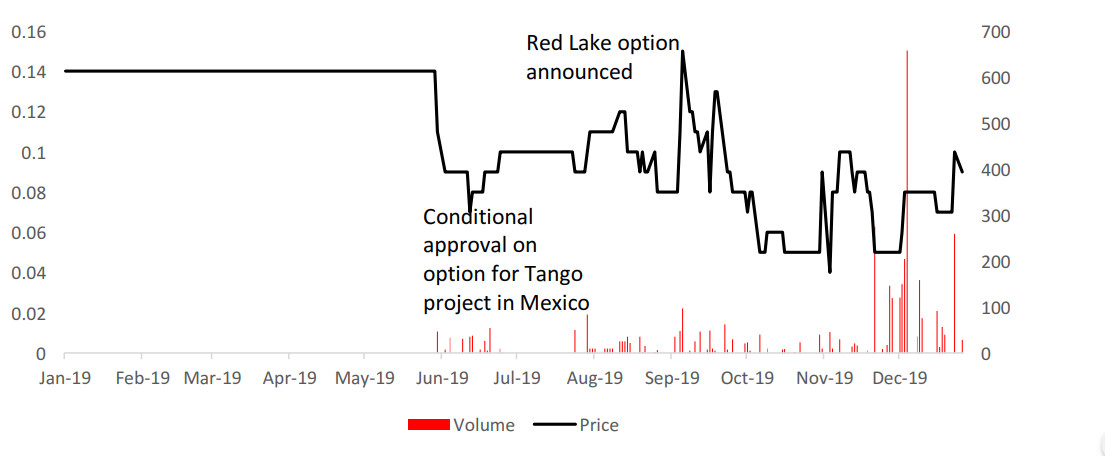
Prime Meridian is a gold focused explorer whose core operation has been the Tango gold exploration project in Mexico, with the company receiving conditional approval for an option on the project in June 2019. The stock was further boosted by the announcement of options on two Red Lake projects in September. However, the boost from the announcements on the two projects proved temporary; the stock has subsequently declined, and is down -36% since the start of the year (Figure 30).
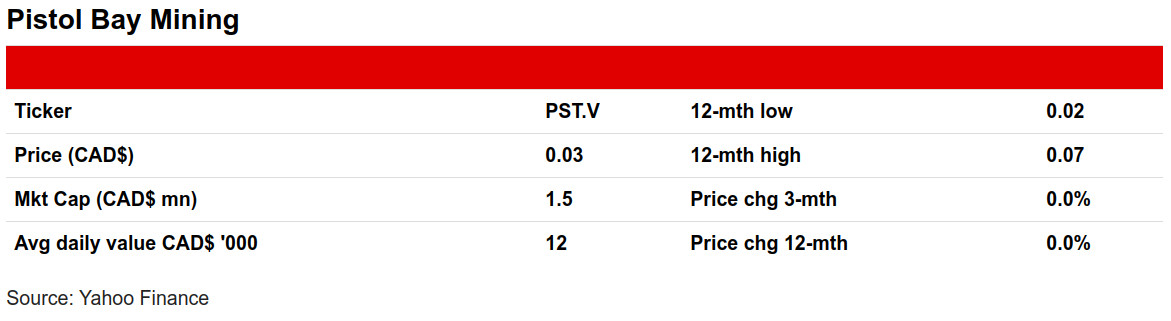
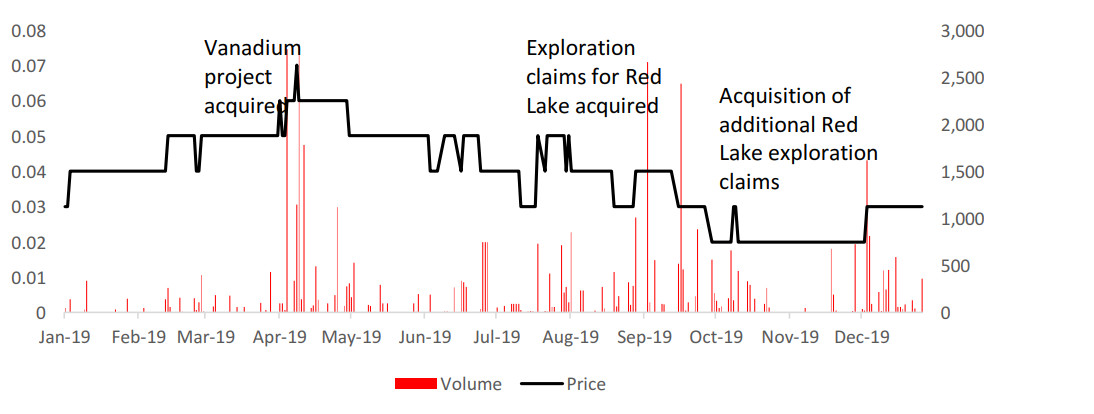
Pistol Bay is another new entrant to Red Lake, and having acquired gold exploration claims at the end of July 2019, it then optioned out some of its claims, and acquired additional claims in September 2019. The company's core operations focus on zinc at Confederation Lake in Northern Ontario, as well as a vanadium project in Nevada. The share price rose in April 2019 after the acquisition of a vanadium project and in July 2019 after the acquisition of exploration claims for Red Lake. However, the further announcement of additional Red Lake claims in September failed to propel the price, which is flat for 2019 (Figure 31).
PureGold and Great Bear Resources will remain the key junior Red Lake mining stocks to watch 2020, with both making significant progress in 2019 towards eventual production. While Newmont Goldcorp will continue to be an important source of information at Red Lake (and potentially an eventual acquirer of some of these junior miners), with only a small contribution to output from Red Lake, it is not a direct stock play on the district.
For the junior miners in earlier stages of exploration, BTU and GoldOn have had very strong years, both from spikes at the end of year on strong exploration results. The stock prices of the other juniors in this report have been weak this year, in part because many are new entrants to Red Lake this year, and announcements of plans in the district have been offset by a lack of any tangible results.
We expect that the gold price will at least be maintained at current levels in 2019, with the potential for a marginal weakening of demand offset by a decline in supply. Gold prices at or above current levels will continue to make the economics of exploration attractive, and should drive continued investment in Red Lake especially from the explorers in a more advanced stage, as well as likely allowing the earlier stage explorers potentially improved access to capital to continue operations.
Disclaimer: This report is for informational use only and should not be used an alternative to the financial and legal advice of a qualified professional in business planning and investment. We do not represent that forecasts in this report will lead to a specific outcome or result, and are not liable in the event of any business action taken in whole or in part as a result of the contents of this report.
Author
Ben McGregor authors the Weekly Roundup at CanadianMiningReport.com, providing sharp analysis of the metals and mining sector. With a talent for spotting trends, Ben distills complex market shifts into clear, engaging insights on TSXV junior miners. His weekly updates cover gold, copper, uranium, and more, blending data-driven perspectives with a knack for identifying opportunities. A vital resource for investors, Ben’s work navigates the dynamic junior mining landscape with precision.