
December 12, 2022
Gold was near flat, up just 0.1% to US$1,798/oz, and stocks pulled back from their bullish two-month run, as the market awaits the upcoming US inflation CPI release which will be key in determining the direction of gold and the markets.
This week we look at what the US yield curve's inversion since mid-2022 could indicate for the economy, while Rupert Resources is In Focus, having recently released the PEA for its Rupert Lapland project in Finland and moving to a TSX listing.
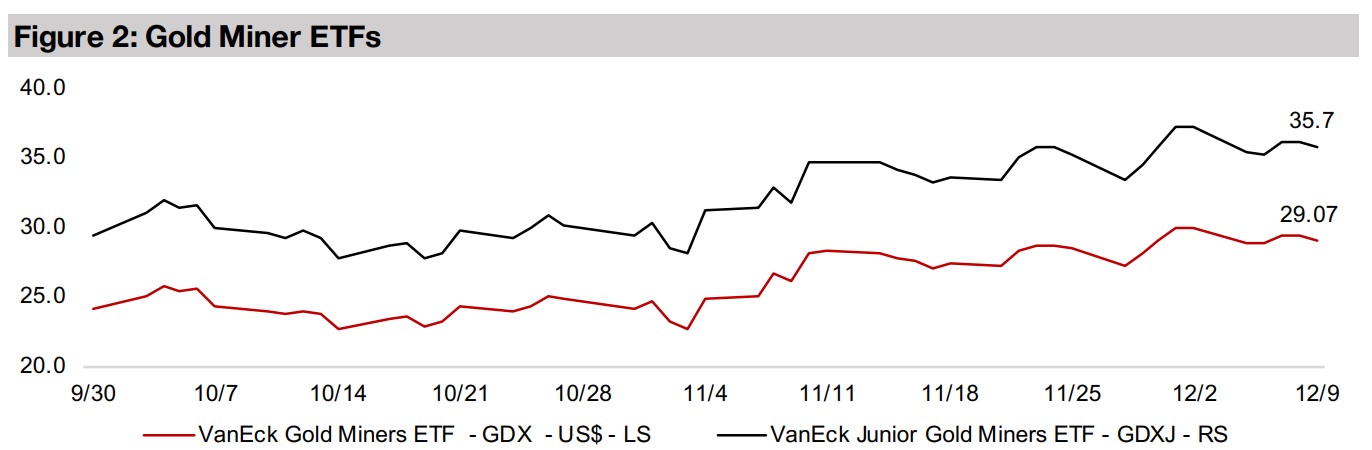
The producing and junior gold miners declined with the GDX down -2.8% and GDXJ losing -4.1% but larger cap TSXV gold stocks were mixed with gold nearly flat but equity markets down as the potential for a still hawkish Fed was reconsidered.


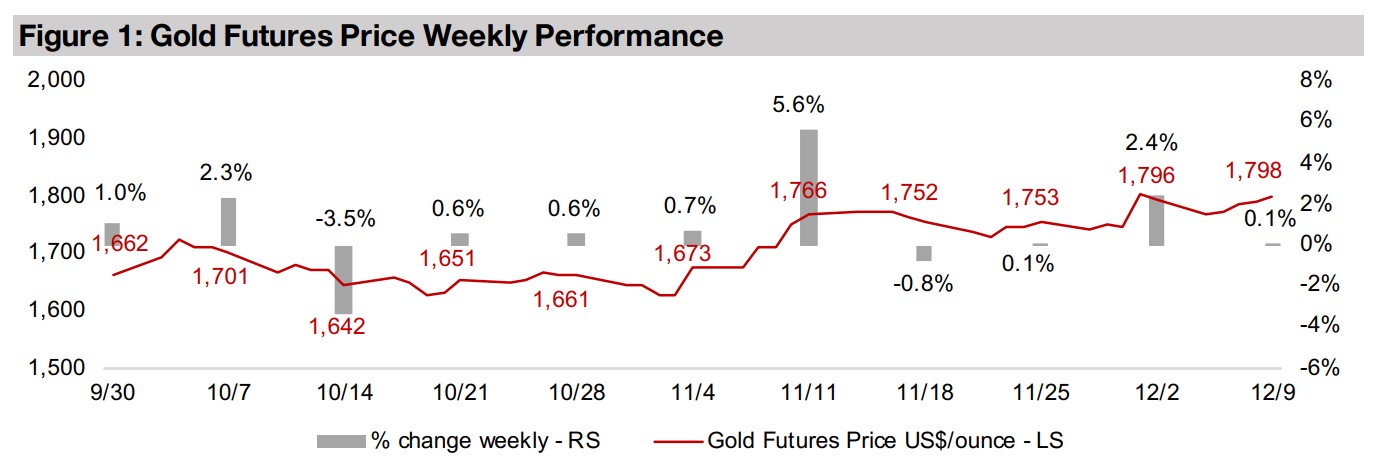

Gold was near flat this week, up 0.1% to US$1,798/oz, although the equity markets declined after nearly a two-month upward run, as the markets continued to digest new economic data with a lack of clarity still on just how hawkish the Fed will continue to be. The market seems to believe that there is a combination of enough overall risk in the economy and enough inflation to support the gold price at its average around the US$1,800/oz that has held now for over two years. While we had been concerned about a slide well below the US$1,700/oz level in recent weeks, this once again proved to be much too bearish for the market to handle, especially with rising geopolitical tensions and the rising probability of an upcoming US recession in 2023, for which a key indicator is the inversion of the US yield curve since mid-2022.
The yield curve has historically been viewed as a quite accurate indicator in anticipating recessions. It is created simply by lining up the US bonds yields at any one time in order of maturity. In Figures 4-6 we show a basic version of a US yield curve comprising the US government 2-year bond yield, 10-year bond yield and 30- year bond yield, in January of each year from 1997 to 2022, and also include December 2022 to show the current yield curve. The first thing that stands out is that other than the four years highlighted in boxes, the yield curve is most regularly upward sloping, meaning that the 10-year yield is higher than the 2-year yield, and the 30- year yield is higher than the 10-year yield.
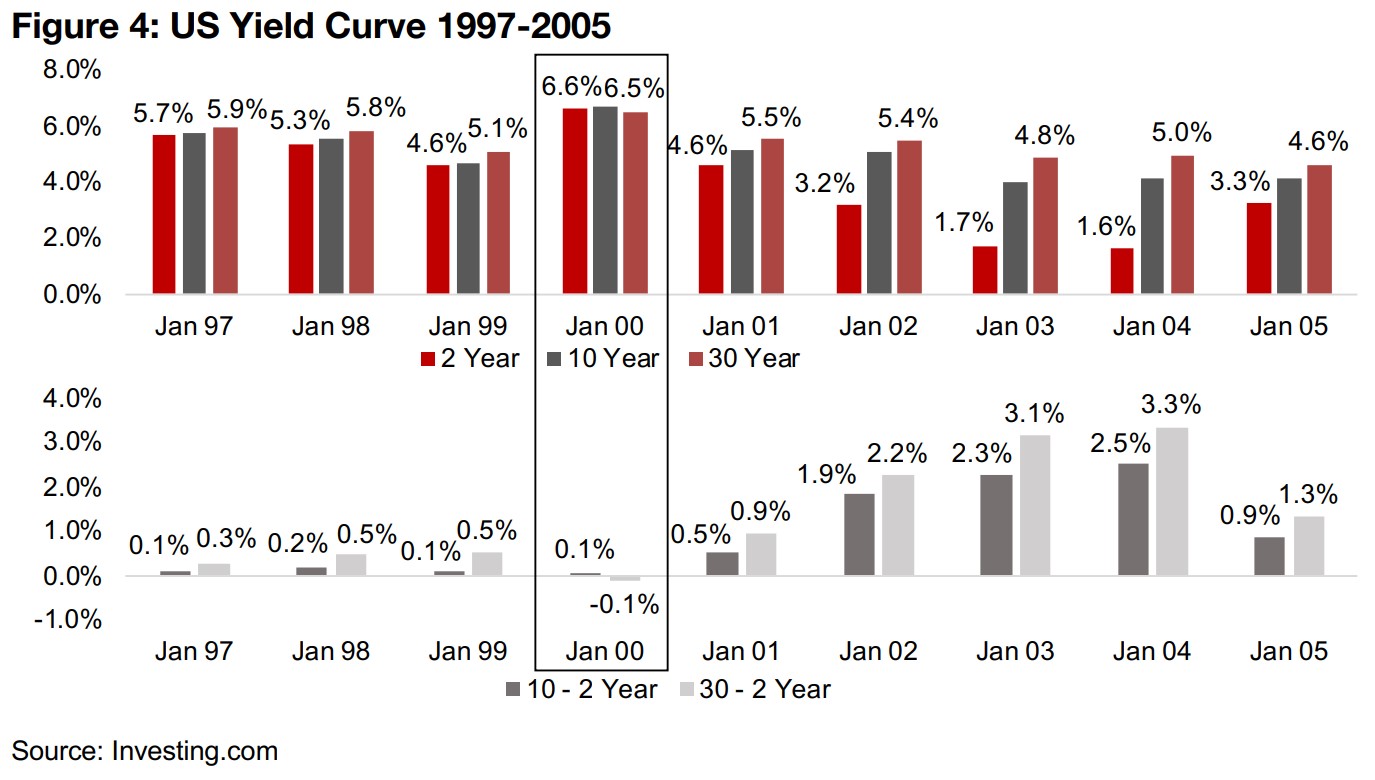
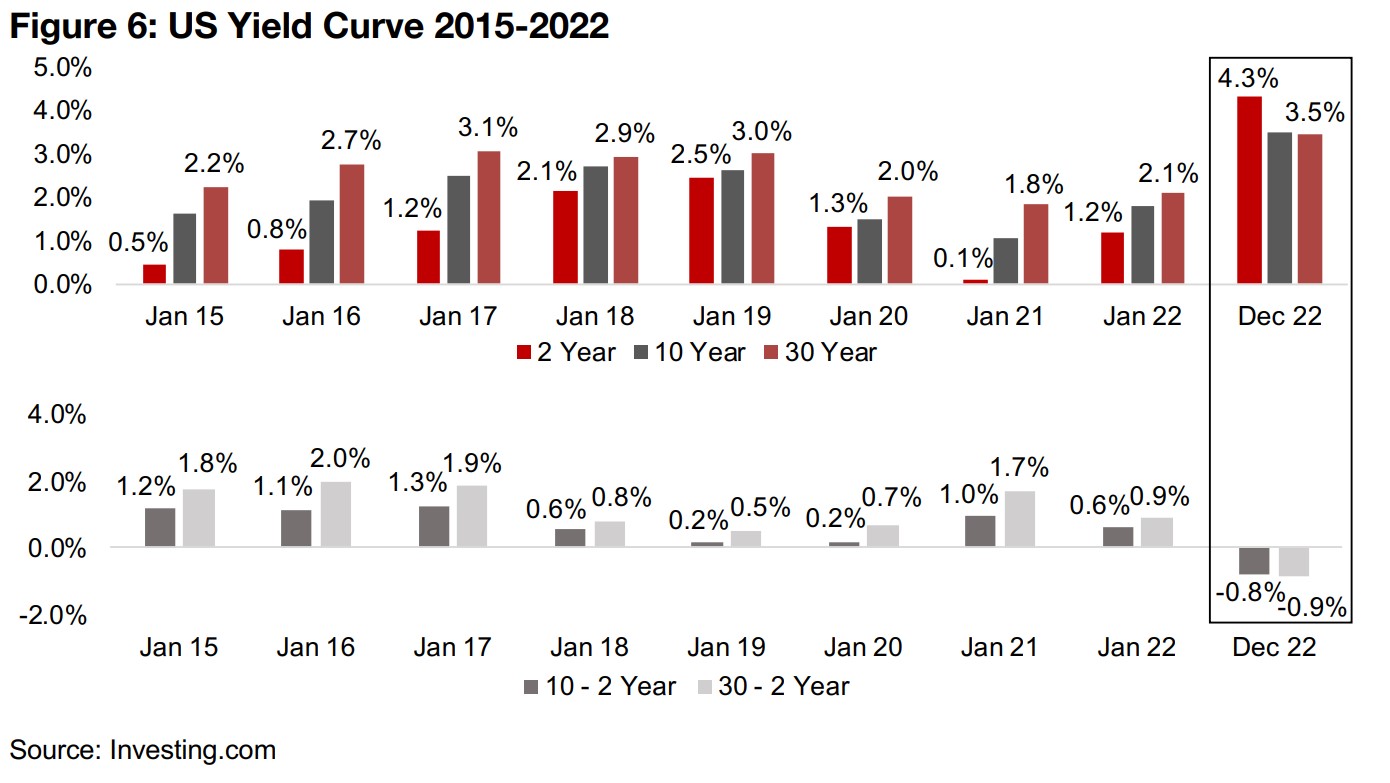
While there is abundant economic research on the different reasons why the yield curve is shaped like this, the general intuition is that investors require a higher yield for longer-maturity bonds to compensate for increased risk. The risk that economic events diverge considerably from what bond holders expect over just 2-years is relatively low compared to 10-years, during which a lot can change to affect bond prices. Over 30-years the risk becomes even higher, and investors expect to be compensated for this with higher yields.
However, in relatively rare cases, the yield curve inverts, which means that yields for
lower maturity bonds are actually higher than higher maturity bonds. To understand
this we need to consider that bond yields and prices move in the opposite direction,
so as bond prices fall, their yields rise, and vice versa. So if we see the yields of a
given bond maturity decline, then demand for bonds of that maturity has increased.
Normally, the demand between the 2-year, 10-year and 30-year bonds, will be
balanced so that their yields are higher the longer the maturity and greater the risk.
However, with an inverted yield curve, demand for longer maturity bonds, for example,
rises so strongly, that their yields actually drop below short-term yields. What this
suggests is that the market has become extremely concerned with near-term
economic problems and wants to lock in long-term yields. Investors have become
less concerned with getting compensated for risk over the long-term, as would be
the case most of the time, and just want safety given rising expectations for more
severe near-term economic problems. While not a perfect indicator, the inverted yield
curve is generally considered quite reliable, and in all cases but one since the 1950s,
a recession has followed an inverted yield curve, with a lag of few quarters.
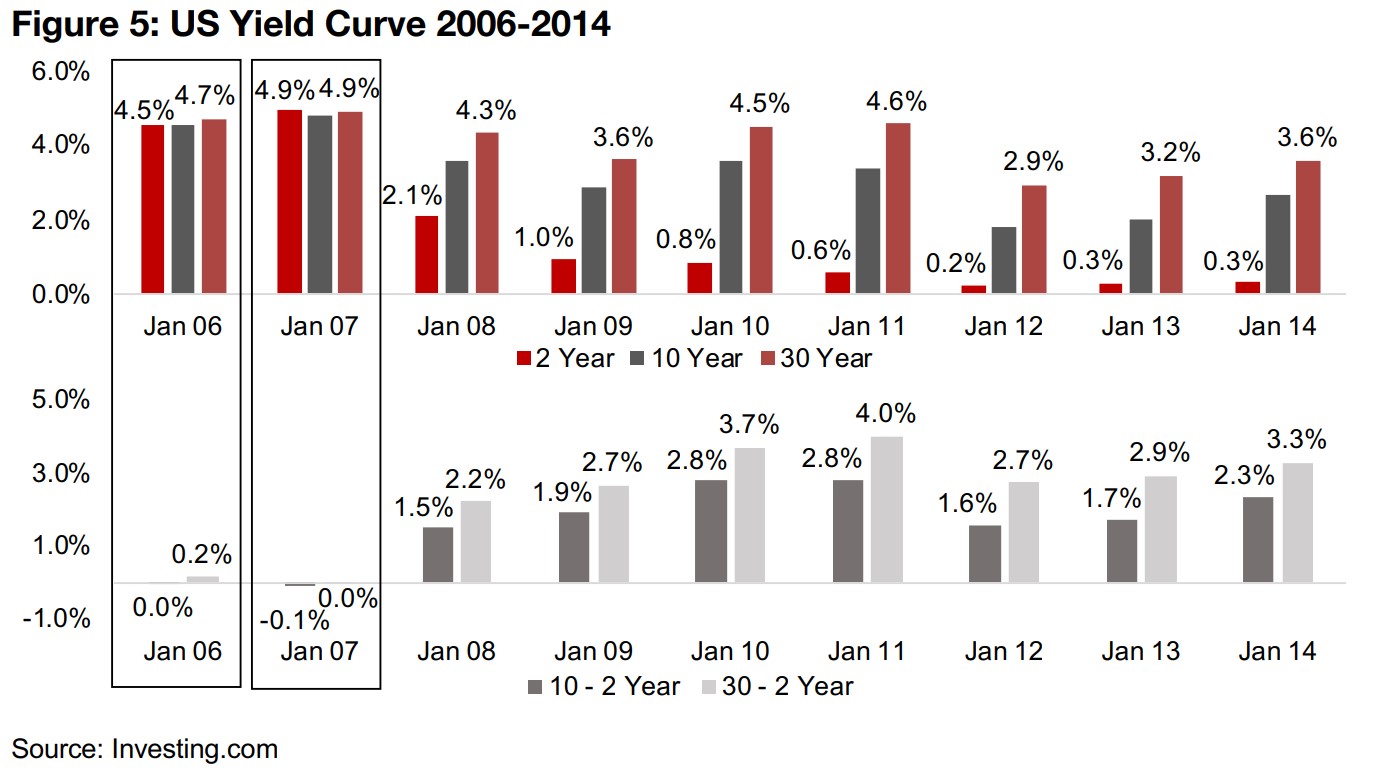
In the more recent history we show in the charts above, we can see that the yield
curve was upward sloping in the dot.com boom of 1997-1999, but by January 2000
it had inverted, and the market peaked in March 2000, and the dot.com bust and a
recession followed. In the lead up to the global financial crisis in 2008, we see the 10-
year minus 2-year flatten by 2006 and turn negative by 2007, with the 30-year versus
2-year flattening that same year.
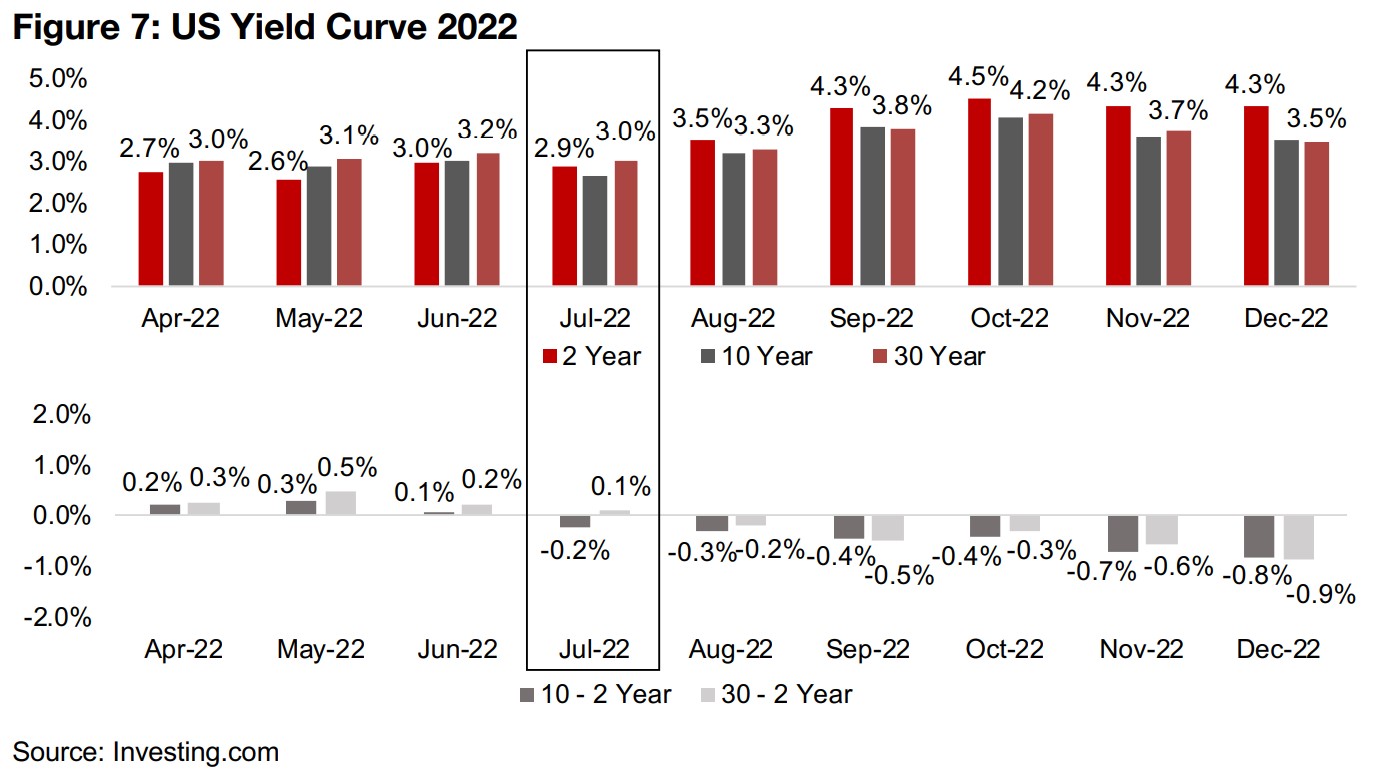
This historical trend becomes concerning for 2023 when we see that the yield curve is inverted as of December 2022, and has been for a while, with the 10-year minus 2- year yield turning negative since July 2022, and the 30-year minus 2-year yield turning negative since August 2022, for about half a year already of a negative yield curve (Figure 7). This suggests that there is a high probability that a recession could develop in the US by next year.
The development of a recession in our view might be less of a problem for the gold price itself next year than gold stocks, especially the junior miners. Gold continues to hold up, and a recession could mean both rising overall risks that investors are looking to hedge against by shifting towards a safe haven like gold, and expectations for an eventual loosening monetary policy in response to the recession, which could support gold. Adding to this are rising geopolitical risks and a decline in market interest in alternatives like crypto, which had probably been stealing some of gold's fire from 2019-2020, but has been exposed by the recent crash as being far from a risk hedge like gold, but rather very a clearly a risk asset.
For gold stocks, however, the boost from a potentially higher gold price could be offset by a recession which could put further pressure on already declining equity market multiples. While the producing gold stocks could see revenue boosted by a rising gold price, this could be offset if inflation and rates remain high, increasing the cost of production and making it more expensive to raise capital. This is even more of an issue for the junior gold mining stocks, most of which do not generate cash flow and must rely on an increasingly risk averse market to raise capital from to fund their exploration. Overall, we would have to see quite a strong rise in gold to offset the combined effects of rising costs of production and risks of capital raising and declining equity markets in the first half of 2023, before gold stocks are likely to be driven up strongly. However, we do not entirely discount the possibility that gold really does go for a risk/safe-haven driven run next year by enough to propel gold stocks.
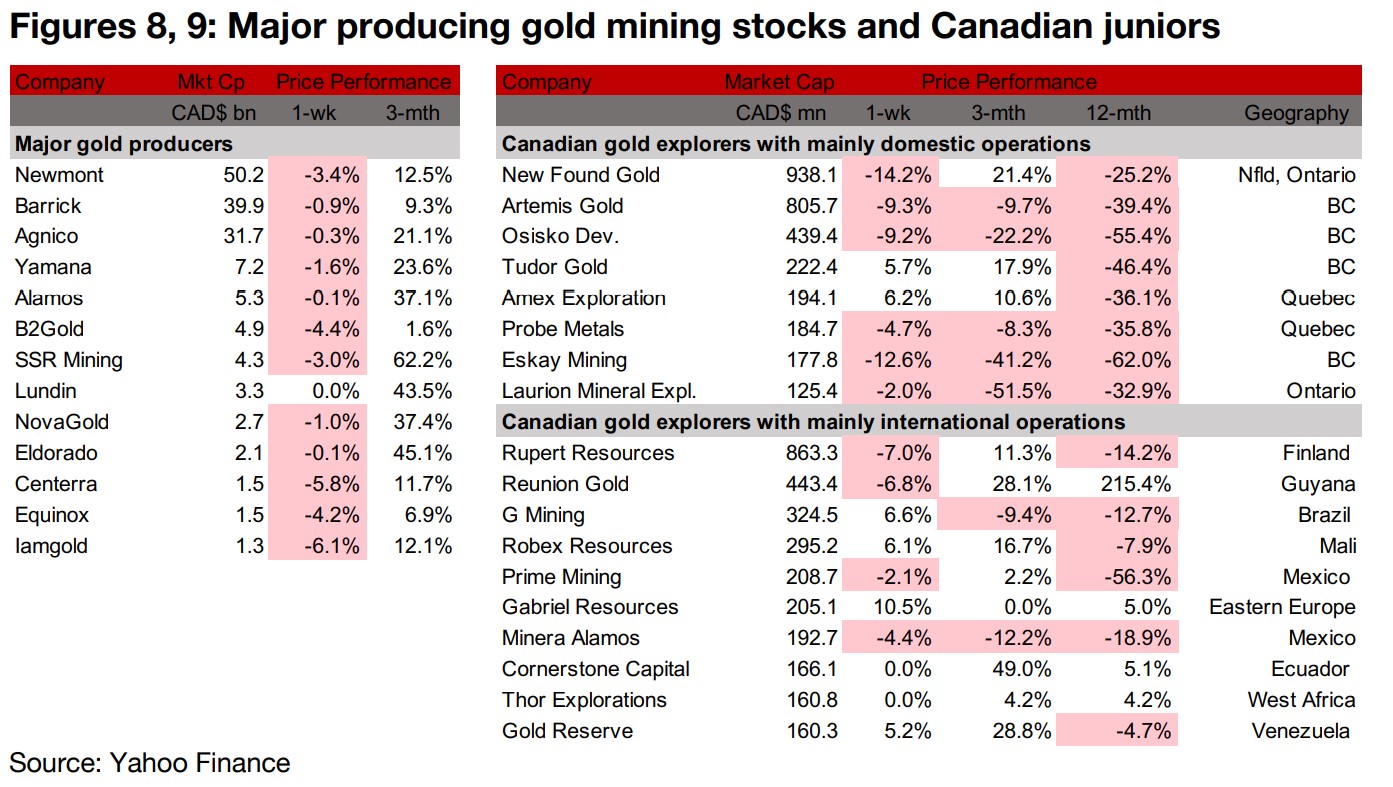
The producing gold miners were nearly all down but the TSXV junior gold miners were
mixed as gold was flat and the equity markets declined for the week (Figures 8, 9).
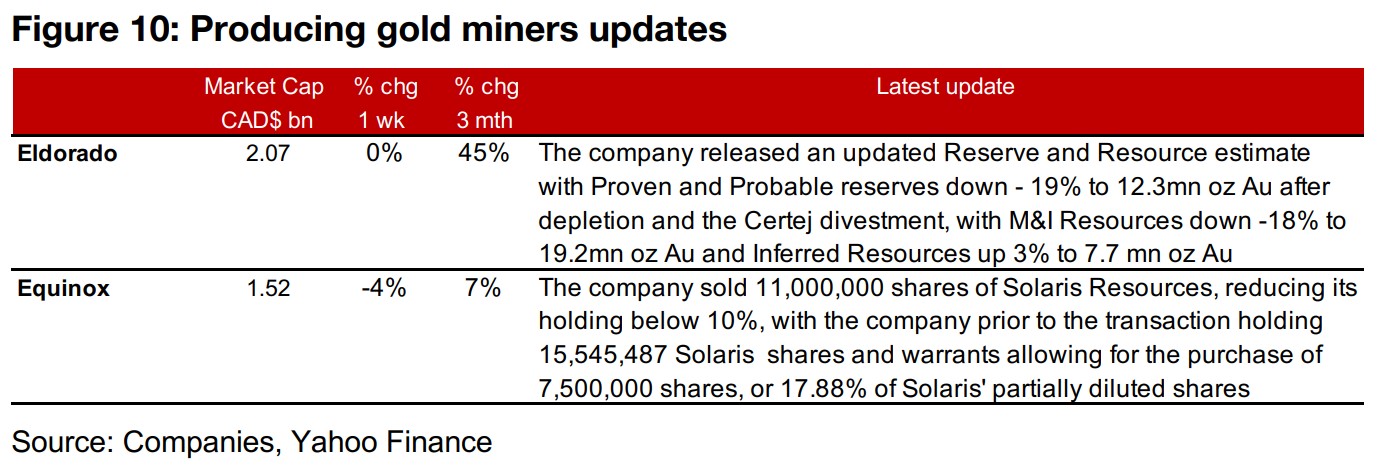
For the producing miners, Eldorado released an updated Reserve and Resource
Estimate with P&P reserves down -19%, M&I Resources down -18% and Inferred
Resources up 3%, and Equinox sold off some its holding of Solaris Resources,
reducing its stake from 17.88% to below 10% (Figure 10).
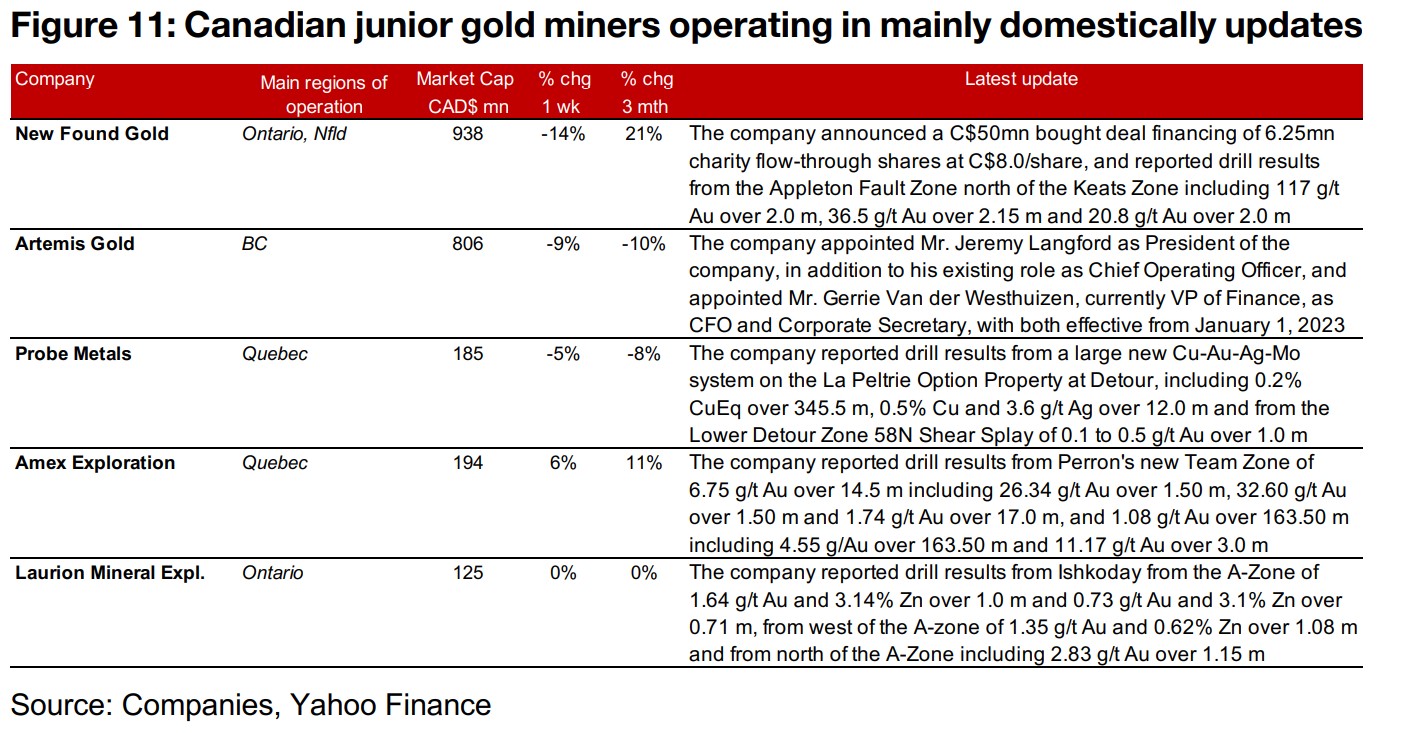
For the Canadian juniors operating mainly domestically, New Found Gold reported a
C$50mn bought deal financing of charity flow-through shares and Artemis Gold
appointed a new President and CFO from its current management. Drill results were
reported by Probe, with a large new Cu-Au-Ag-Mo system on the La Peltrie Option
Property at Detour, by Amex, from Perron's new Team Zone and from Laurion at
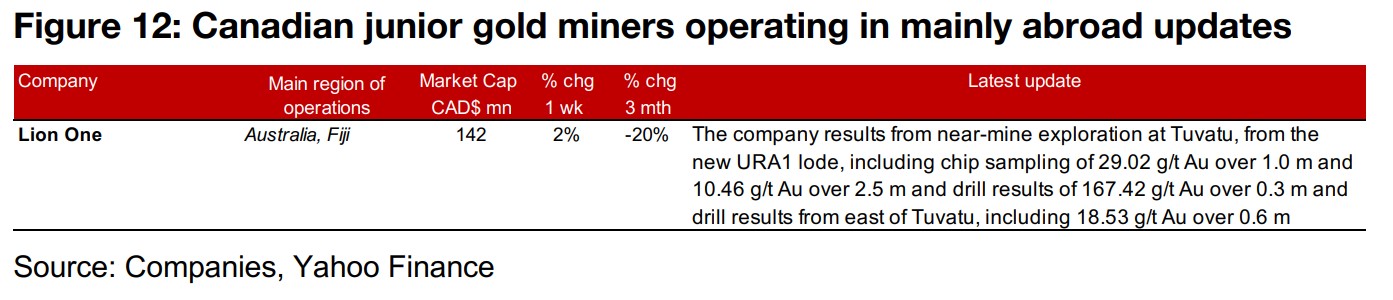
Ishkoday around the A-Zone (Figure 11). For the Canadian juniors operating mainly
internationally, Rupert reported that it would move to a listing on the TSX and Lion
One reported chip sampling and drilling results from the new URA1 lode and drill
results from east of Tuvatu (Figure 12).
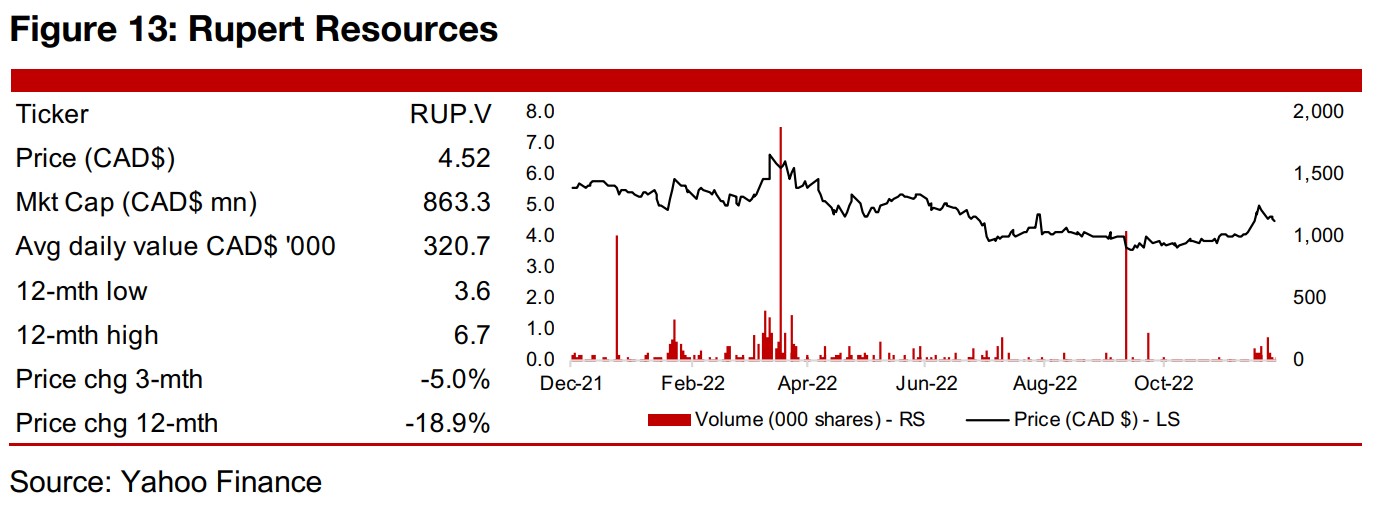
Rupert Resources had two major news releases over the past two weeks. The first was the release of its Preliminary Economic Assessment for its Rupert Lapland Project on November 28, 2022, which was long awaited following its initial mineral resource estimate in September 2021, with only a limited number of drill results being released since. The company also announced that it would move from its current listing on the TSXV to a listing on the TSX as of December 12, 2022, having been one of the largest capitalization gold stocks on the TSXV for the past two years.
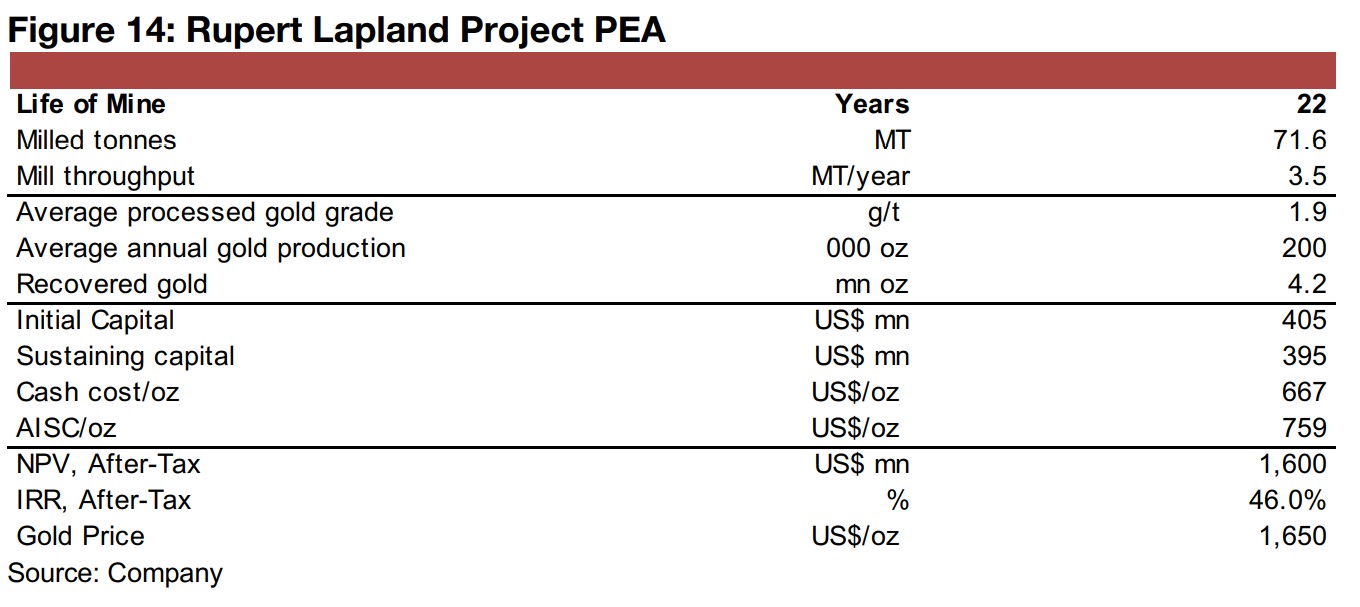
The Rupert Lapland Project is planned have two main phases, with the Ikkari deposit comprising the bulk of production, with a 22-year mine life, first an open pit mine from years 1 to 11, and an underground mine from years 10 to 23 (Figure 14). There is also a smaller contribution of concentrate expected from the Pahtavaaara deposit from years 12 to 25, although Ikkari will comprise about 95% of production through years 12 to 19.
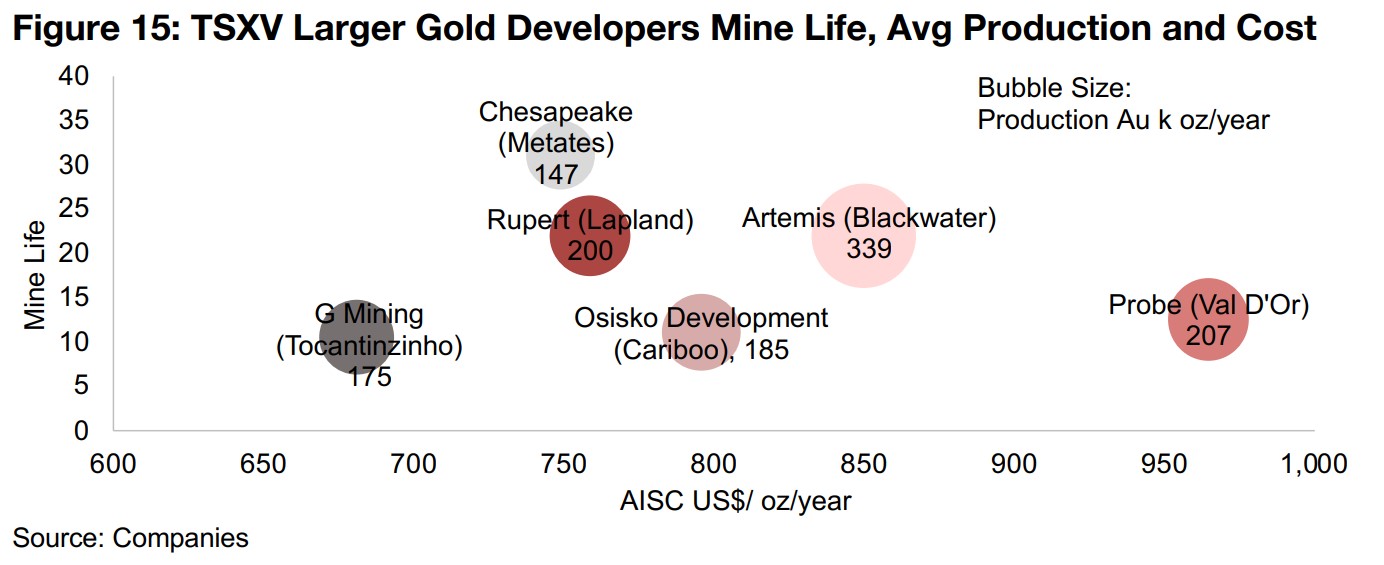
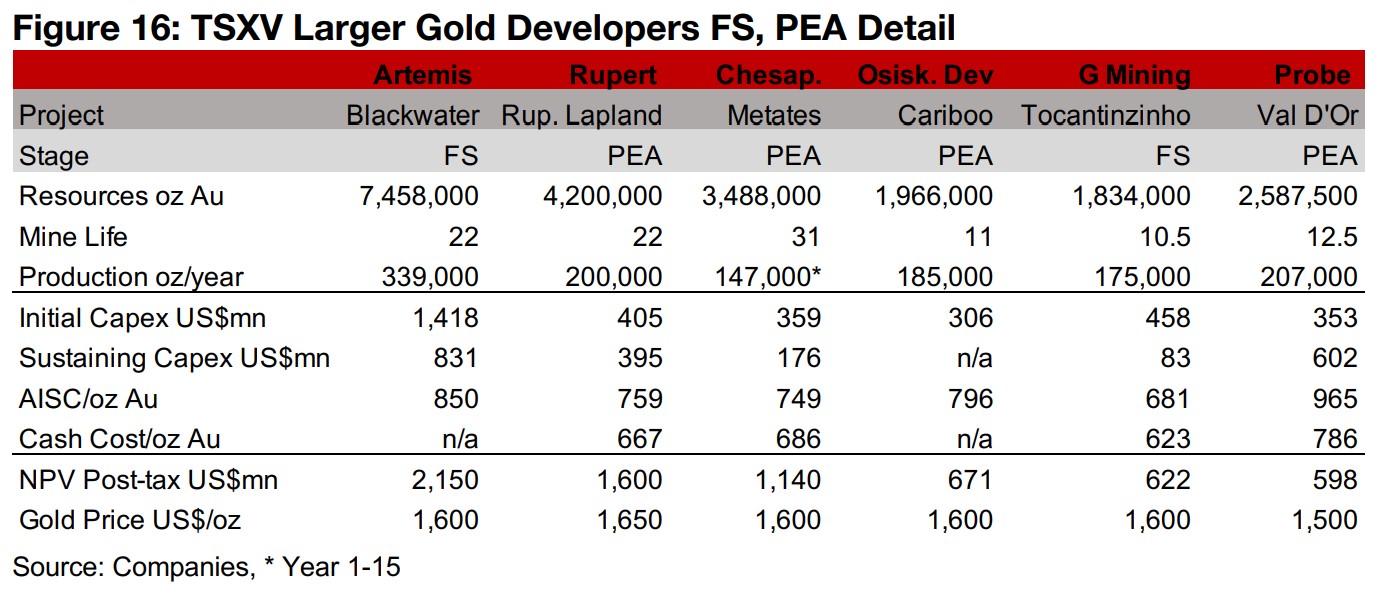
The project is large in the context of the projects of the other major TSXV gold developers, with the 22-year mine life the same as Artemis’ Blackwater, although Blackwater has a larger production per year of 339k oz Au versus 200k for Rupert Lapland (Figure 15). The project also has moderate costs versus this group, with an AISC of US$759/oz Au, below Blackwater, Probe’s Val D’Or East and Osisko Development’s Cariboo projects. It also has an initial capex of US$405mn and sustaining capex of US$395mn, only about a third the level of Blackwater, with an initial capex of US$1,418mn and sustaining capex of $831mn (Figure 16). The Rupert Lapland after-tax project NPV is US$1,600mn at a US$1,650/oz gold price, compared to US$2,150bn for Blackwater at US$1,600/oz gold, with the market caps of both companies well below their projects’ expected value. The NPV’s for the projects of the rest of group are considerably lower, with all of them estimated using a US$1,600/oz gold except for Probe’s Val D’Or, using US$1,500/oz.
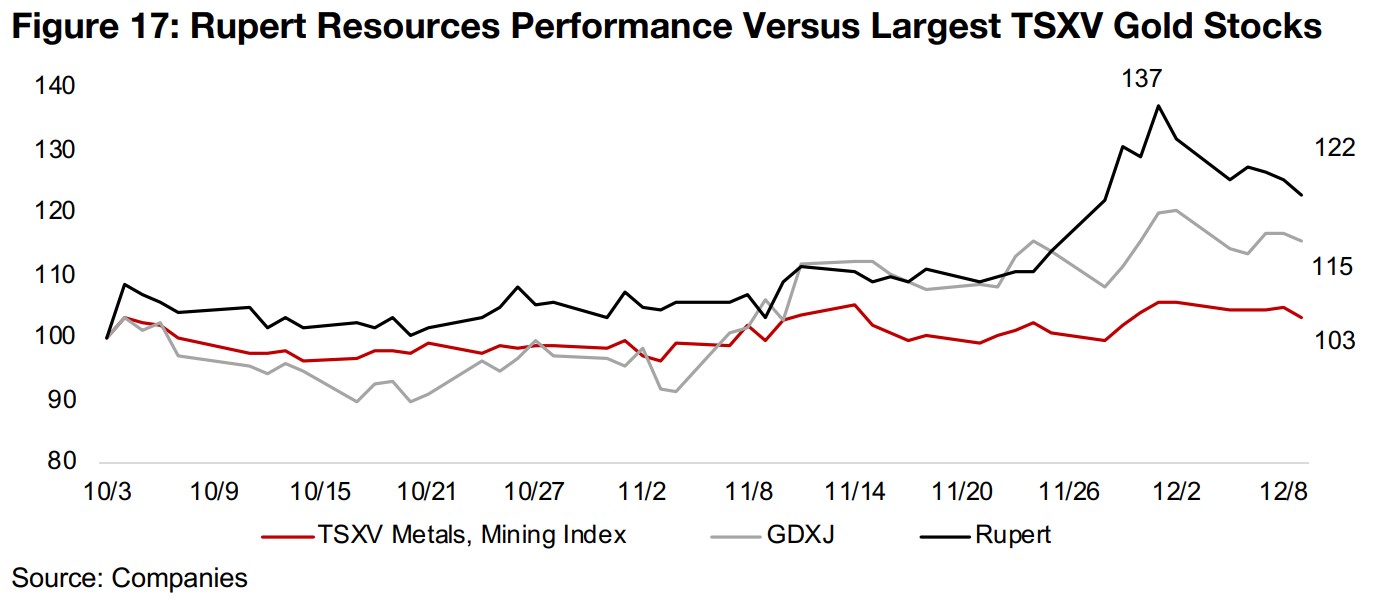
While the stock is down -5.0% over the past three months and -18.9% over the past twelve months, this is actually a relatively strong performance given the major declines in the equity markets, with many of the largest cap TSXV gold stocks down over -30% over the past year. The reaction to the release of the PEA seems to have taken favorably by the market after the relatively sparse news flow since the announcement of the initial mineral resource estimate in September 2021. While the benchmark TSXV Metals and Mining Index and GDXJ ETF of junior gold miners have gained in the recent equity rally, up 15% and 3%, respectively, since the start of October 2022, these have both been outpaced by Rupert. While Rupert was up 37% at its peak since October 2022 following what appears to be market exuberance over the release of the PEA, even after this cooled and the market digested the project details, it is still up 22% (Figure 17).
Disclaimer: This report is for informational use only and should not be used an alternative to the financial and legal advice of a qualified professional in business planning and investment. We do not represent that forecasts in this report will lead to a specific outcome or result, and are not liable in the event of any business action taken in whole or in part as a result of the contents of this report.
Author
Ben McGregor authors the Weekly Roundup at CanadianMiningReport.com, providing sharp analysis of the metals and mining sector. With a talent for spotting trends, Ben distills complex market shifts into clear, engaging insights on TSXV junior miners. His weekly updates cover gold, copper, uranium, and more, blending data-driven perspectives with a knack for identifying opportunities. A vital resource for investors, Ben’s work navigates the dynamic junior mining landscape with precision.