
April 27, 2026
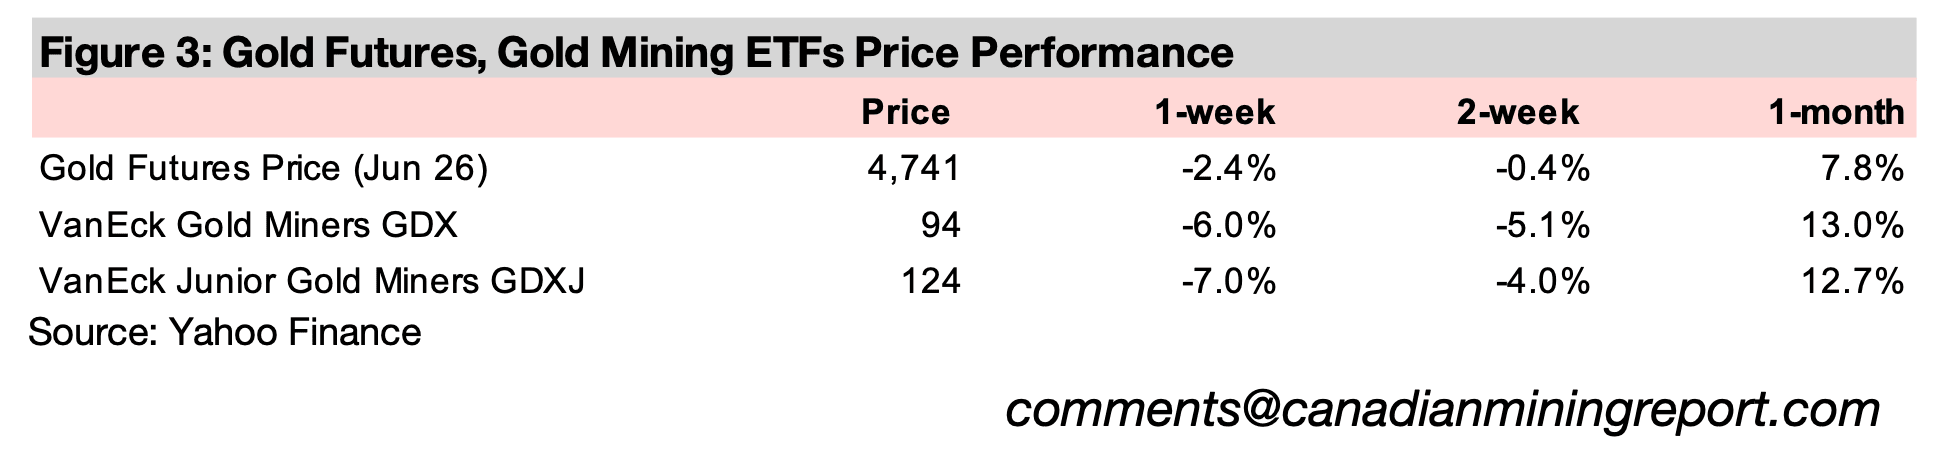
Gold dropped -2.4% to US$4,741/oz, pulling back from a four-week gain, partly on a rise in the US$ and bond yields, which tend to move inversely to the metal, on safehaven demand, as geopolitical risk remained elevated on the Middle East conflict.
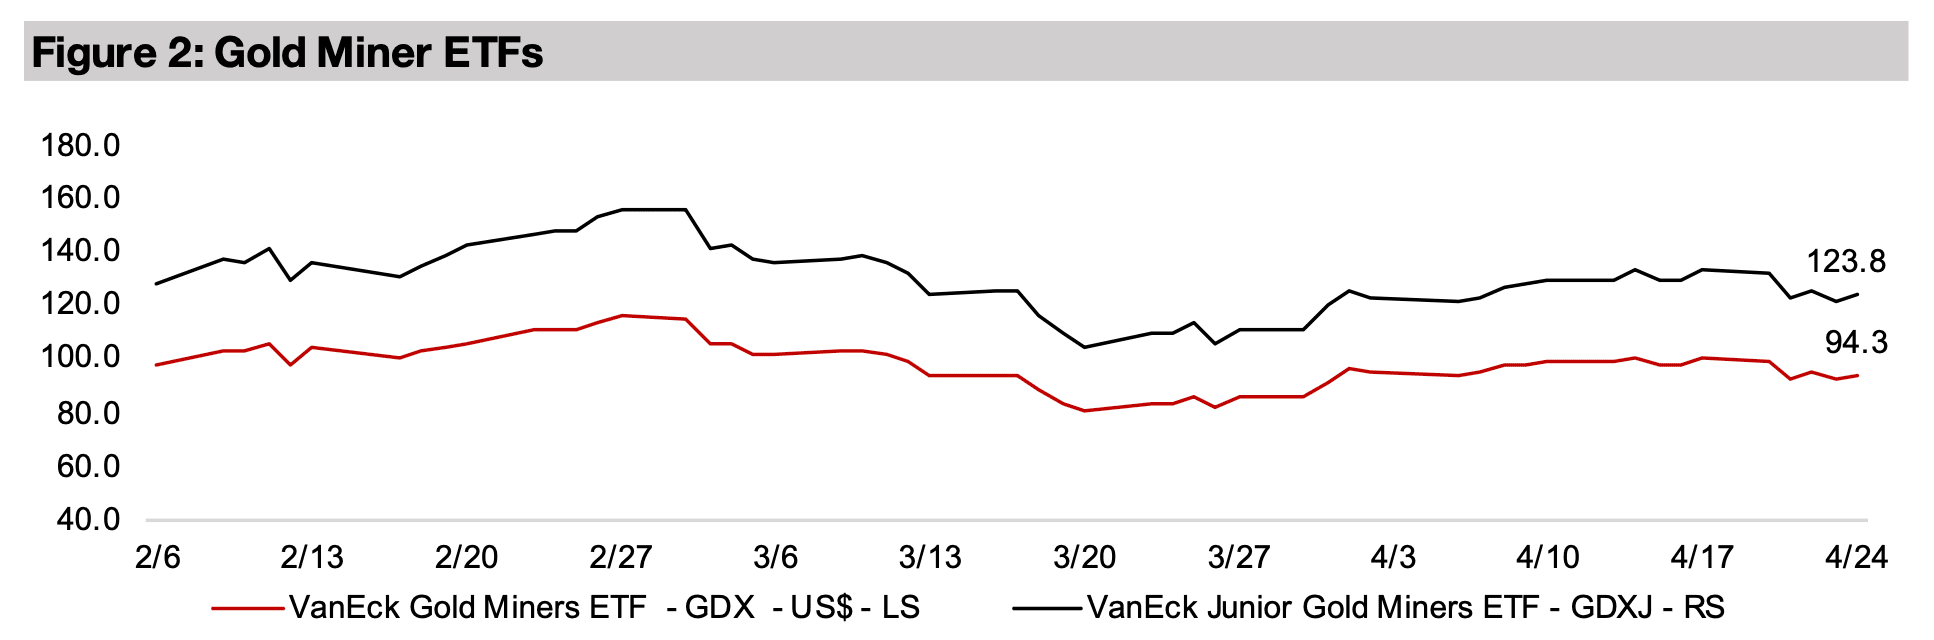
The gold stocks dropped, with the GDX down -6.0% and GDXJ declining -7.0%, mainly on the fall in the metal, outperformed by the broader equities markets with the S&P up 0.7%, the Nasdaq rising 1.7% and the Russell 2000 index increasing 0.6%.


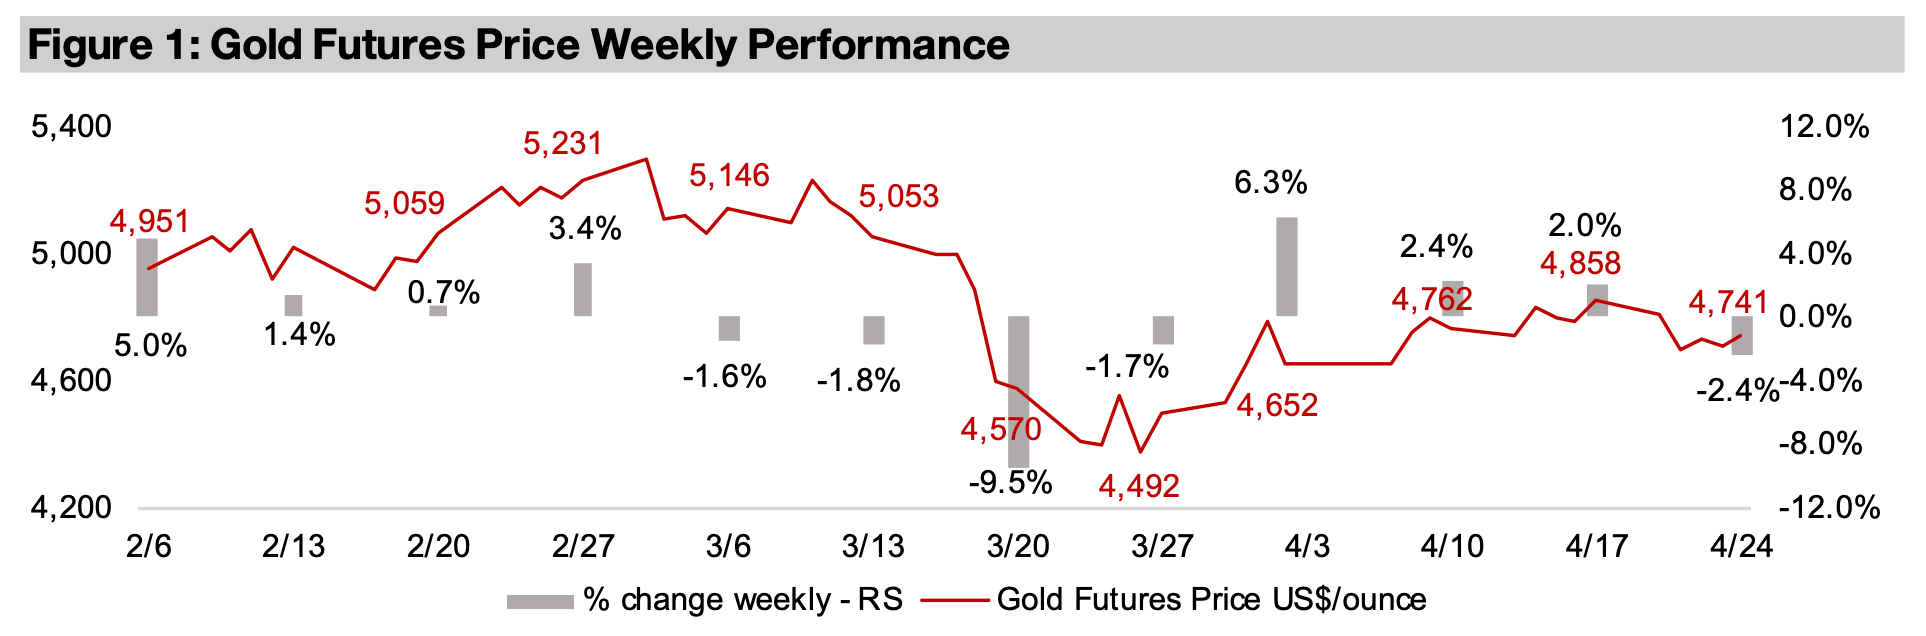
The gold price declined -2.4% to US$4,741/oz, down for the first week after a monthlong recovery, driven by a moderate rise in the US$ and bond yields, which tend to
move inversely to the metal, on safe-haven demand, as high geopolitical risk
continued. The equity markets rose even with these downward pressures, with the
S&P up 0.7%, the Nasdaq gaining 1.7% and the Russell 2000 index increasing 0.6%.
The drop in the metal price hit the gold stocks, with the GDX down -6.0% and the
GDXJ losing -7.0%, also after four straight weeks of gains.
For the resources sector the main story remained oil volatility on the Middle East
conflict, with the price returning near 2026 highs this week and up 61.6% year to date
(Figure 4). Even aluminum, the strongest performing metal this year, is up just under
a third of this level, at 19.4%, with it continuing to gain over the past week. This has
been driven by the nearly 10% of aluminum production capacity in the Middle East,
much of which has seen significant damage from the war, in addition to constraints
on metals shipments out of the region from the blockades of the Straits of Hormuz.
Gold has risen 9.1% year to date, after a jump in January 2026, a relatively flat
February, a plunge in mid-March and then the recovery over the past month. Overall
the heavily bullish sentiment and increasingly speculative-looking move of late 2025
and early 2026 has given way to more moderate price action likely more rooted in
fundamentals. The direction for gold will hinge largely on whether inflation from
surging oil prices becomes high enough to prompt global central banks to shift from
cutting to hiking rates. Stagflation could also result, with low growth but high inflation,
which could leave them stuck, unable move rates significantly in either direction.
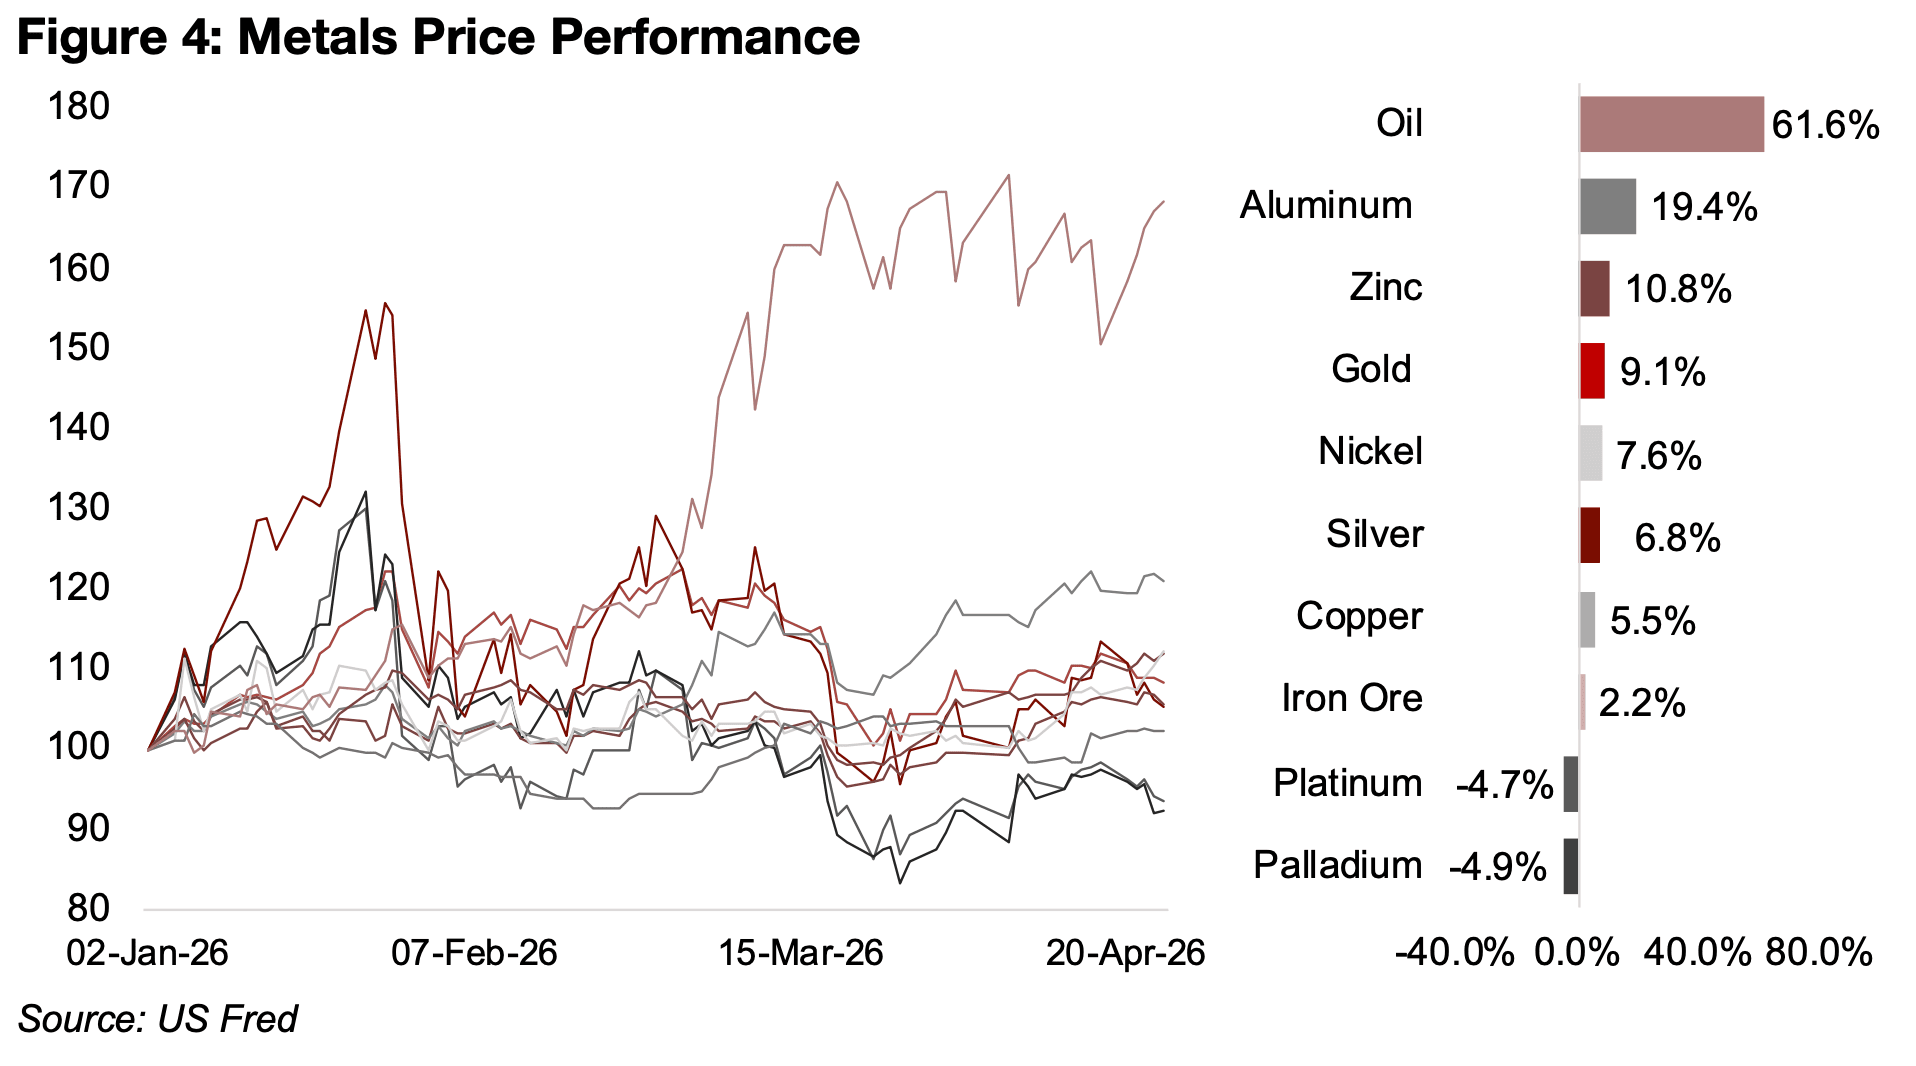
The gold price has been just behind zinc, up 10.8%, and ahead of nickel, rising 7.6%,
which are both driven by the steel industry. While global steel demand is still sluggish,
especially on weak property and infrastructure sectors in China, there are signs these
may be reaching a bottom. The iron price, up 2.2% this year, is also largely driven by
steel demand in China, and also has supply side issues from the start of production
at Simandou, a major new mine in Guinea.
Silver has gained 6.8% YTD, after by far the highest gains of the major metals in the
bubble, followed by the largest slump, and similar to gold, while its outlook is more
subdued, the price has gradually risen over the past month. The copper price has
also been muted, up 5.5% this year after also having strong gains in 2025, partly on
concerns over reduced global economic growth from much higher oil prices. The
market is also starting to question whether strong growth for two specific drivers of
the metal’s price, AI and the energy transition, can continue. Platinum and palladium
have had the weakest performance so far this year of the major metals, down -4.7%
and -4.9%, continuing to pullback from major booms in late 2025 and into early 2026,
similar to silver, although their peaks were not as high.
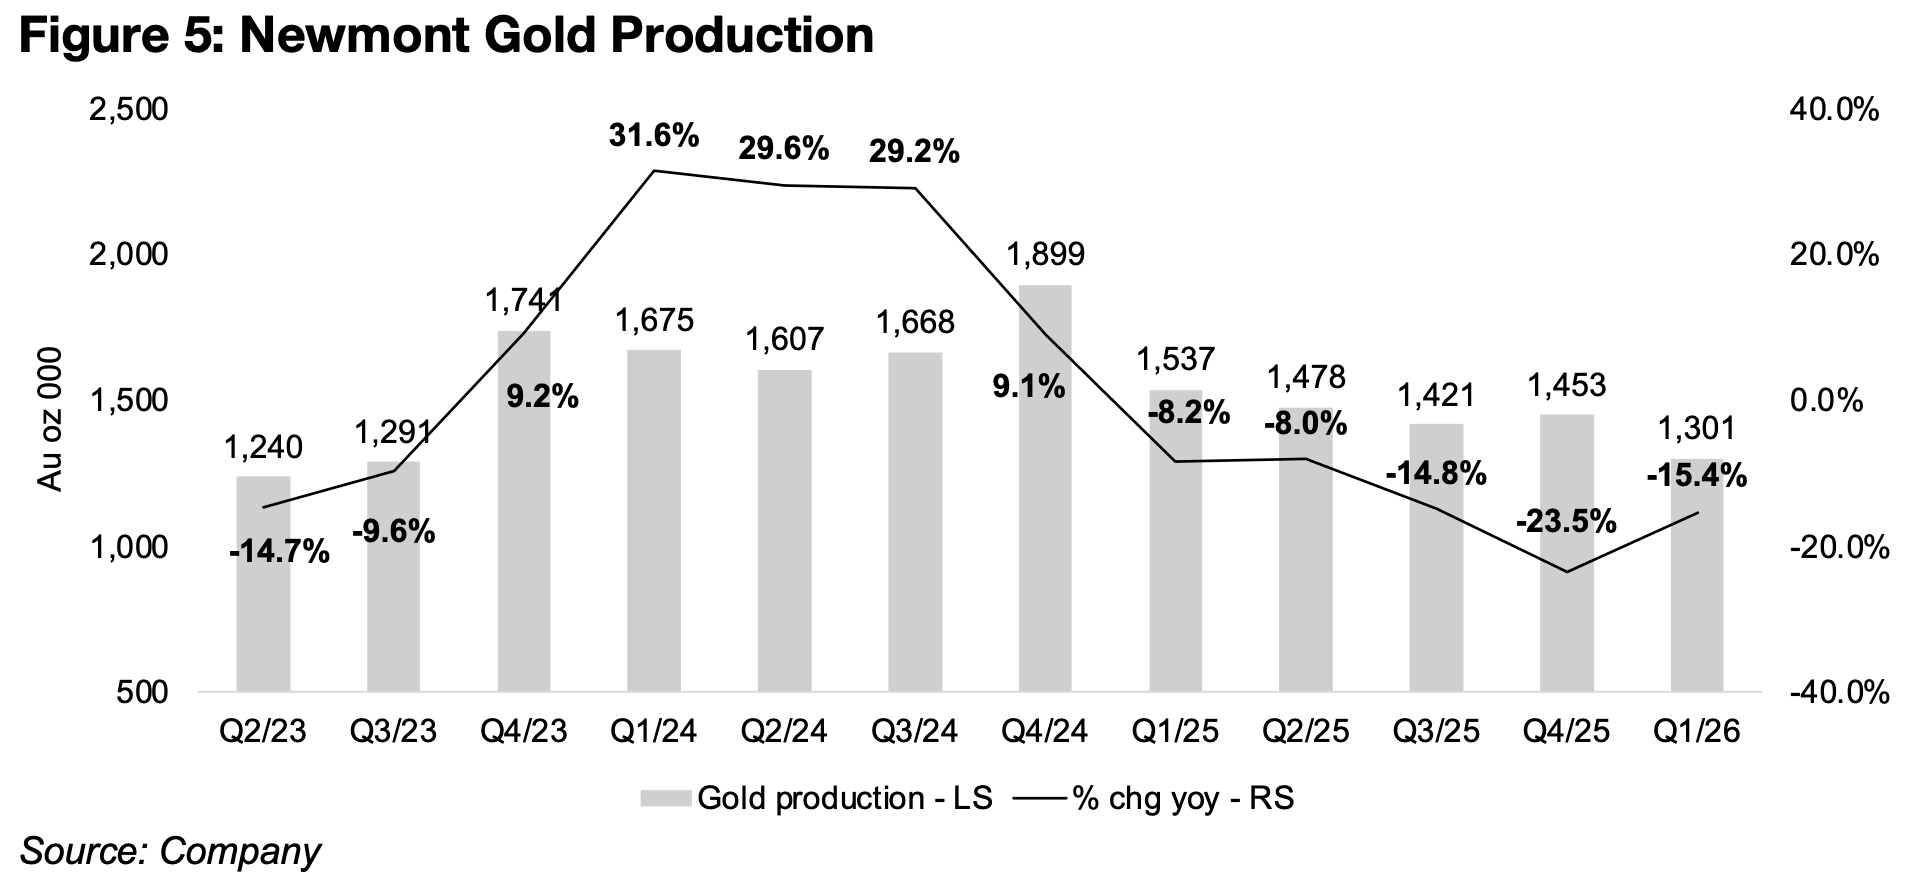
The Big Gold reporting season started with Newmont reporting its Q1/26, with Barrick and Agnico Eagle to release results this week. The company’s results were extremely strong both yoy and qoq, mainly on the rise in the gold price, versus a comparably moderate rise in costs. The company’s production was still down -15.4% to 1.30 mn oz Au, but this was an improvement from the -23.5% yoy decline in Q4/25 (Figure 5). Production did also decline a substantial -10.5% qoq from 1.45mn oz Au in Q4/25. Last quarter marked the bottom of a trend of consecutive declines in growth over two years from a peak at 31.6% at Q1/24.
The decline in production was driven partly by Ahafo South in Ghana, which had the second highest output for Newmont in Q1/25, but this dropped -37.6% in Q1/26 on a planned transition from higher grade to lower grade ore at the project (Figure 6). A similar expected shift to a lower grade was also the main driver of a -56.1% decline in output Penasquito in Mexico, and a more moderate -11.8% drop at the company’s Boddington mine in Australia. There was also a significant -31.1% decline from Lihir in Papua New Guinea, which had Newmont’s third largest output in Q1/25, with the mine facing major persistent geological and geothermal issues as it is on the site of a volcano. These declines were partly offset by a 9.3% rise in production at Nevada Gold Mines, which combined are Newmont’s largest source of output, a 37.1% gain at Yanacocha in Peru on technical improvements and a higher grade and a 43.9% increase from Brucejack in B.C on higher throughput and more efficient operations.
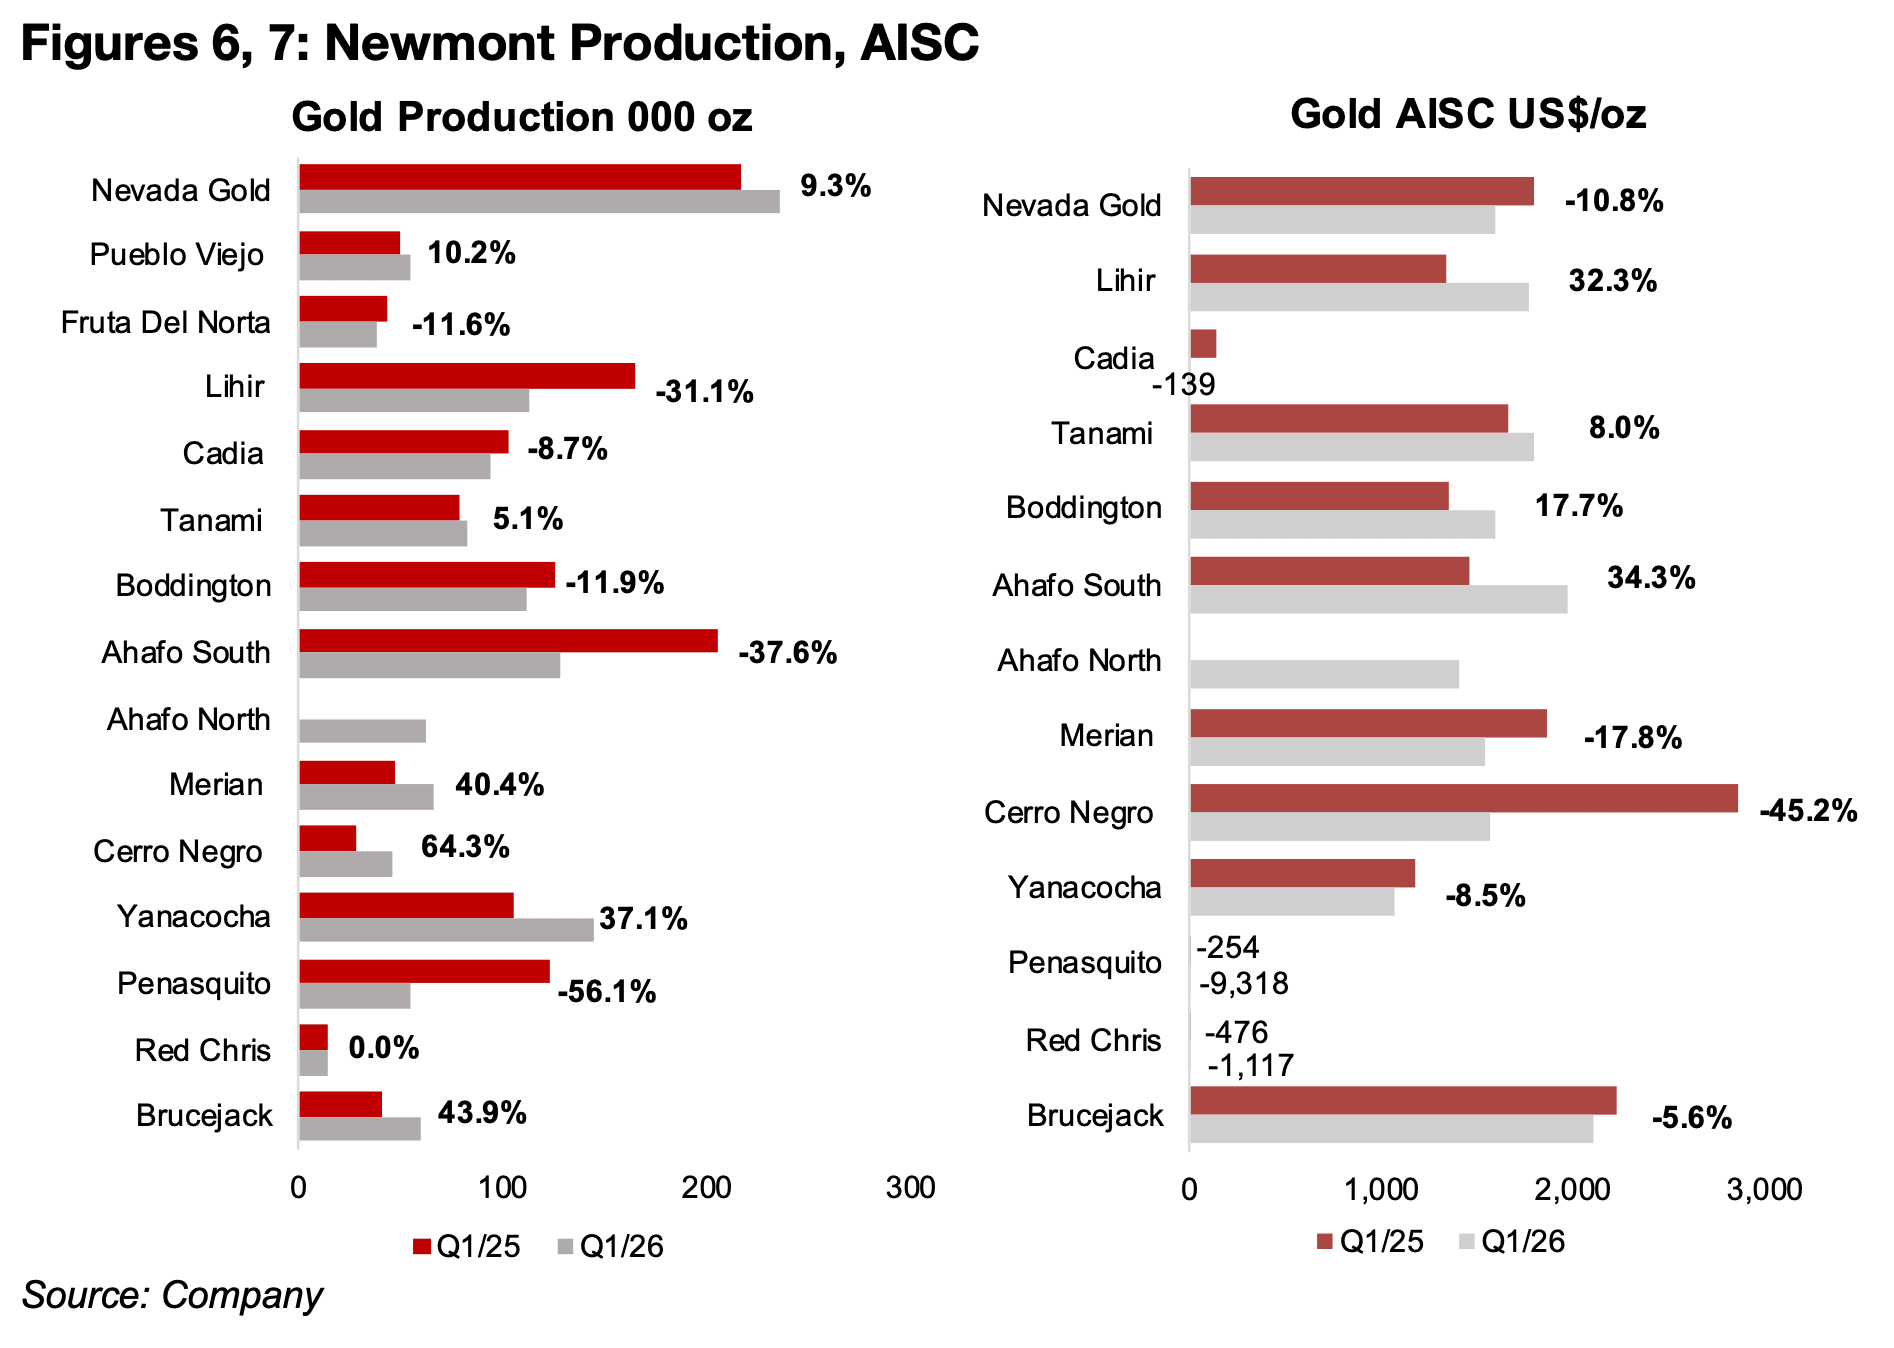
Costs have been rising at several mines, with the all-in-sustaining-cost for Lihir,
Boddington and Ahafo South up 32.3%, 17.7% and 34.3% yoy (Figure 7). An increase
in costs would be expected given the rise in the oil price since March 2026 and the
high proportion of energy to total expenses in the mining industry. However, higher
oil was not enough to drive up costs across all the mines, with Nevada Gold, Merian
and Cerro Negro all seeing substantial drops yoy of -10.8%, -17.8% and -45.2%, and
Yanacocha and Brucejack more moderate declines of -8.5% and -5.6%.
The AISC for some mines, Cadia, Penasquito and Red Chris, actually have negative
values, mainly because these figures are reported including byproduct credits. This
calculation generally takes the gross cost, and then subtracts the byproduct revenue,
which tends to be far lower, resulting in a non-negative number. However, in some
cases the byproduct revenue can actually be so high that it is above the total cost,
and when subtracted shows an artificially negative value.
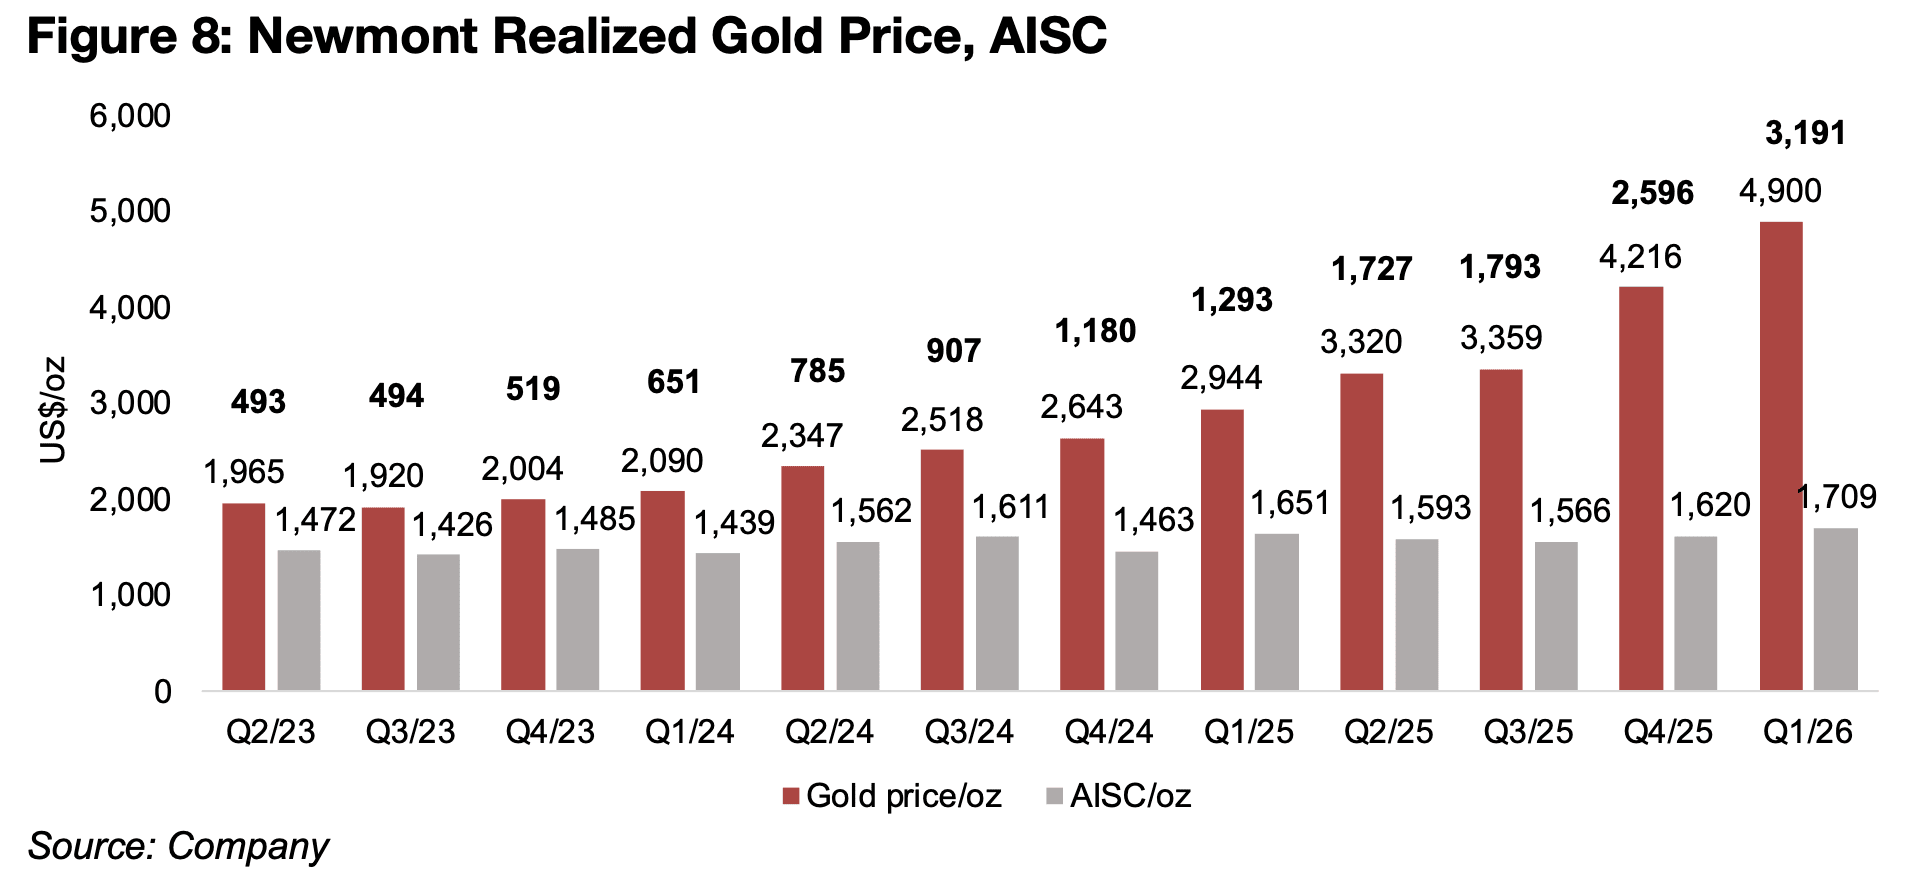
Newmont’s overall average AISC to US$1,709/oz rose just 3.5% yoy and 5.4% qoq,
quite muted given the jump in oil prices (Figure 8). This was far outpaced by the gain
in the realized gold price to US$4,900/oz, up 6.6% yoy and 16.2% qoq. This saw the
realized gold price to AISC spread jump to US$3,191/oz, up nearly US$600/oz from
Q4/25 and nearly US$2,000/oz from Q1/25. So while the abrupt drop in the gold price
in mid-March 2026 was a shock to a market given the extreme momentum in the
price, there certainly has been no major overall decline in the fundamental drivers of
the largest company in the sector.
As we have noted repeatedly since the gold price pullback, the drop seemed mainly
to be a clearing out of speculators, which although unsettling in the short-term, was
probably healthy for a price that had moved far above the medium-term trend. While
more significant increases in costs could still come through in Q2/26, as there will be
higher oil costs for whole period, rather than just the single month, there is more than
enough of a cushion to absorb this. Even if the gold price in Q2/26 dropped to an
average of just US$4,000/oz (which is very unlikely given that we are already two
months into the quarter already), and Newmont’s AISC were to rise to 20% yoy for
Q2/26 to US$1,912/oz, that would still leave the company with over a US$2,000/oz
spread. Even a plunge in the gold price to just US$3,000/oz, which seems unlikely
this year, would leave the company with a US$1,000/oz spread, far above the levels
of 2019 to 2024.
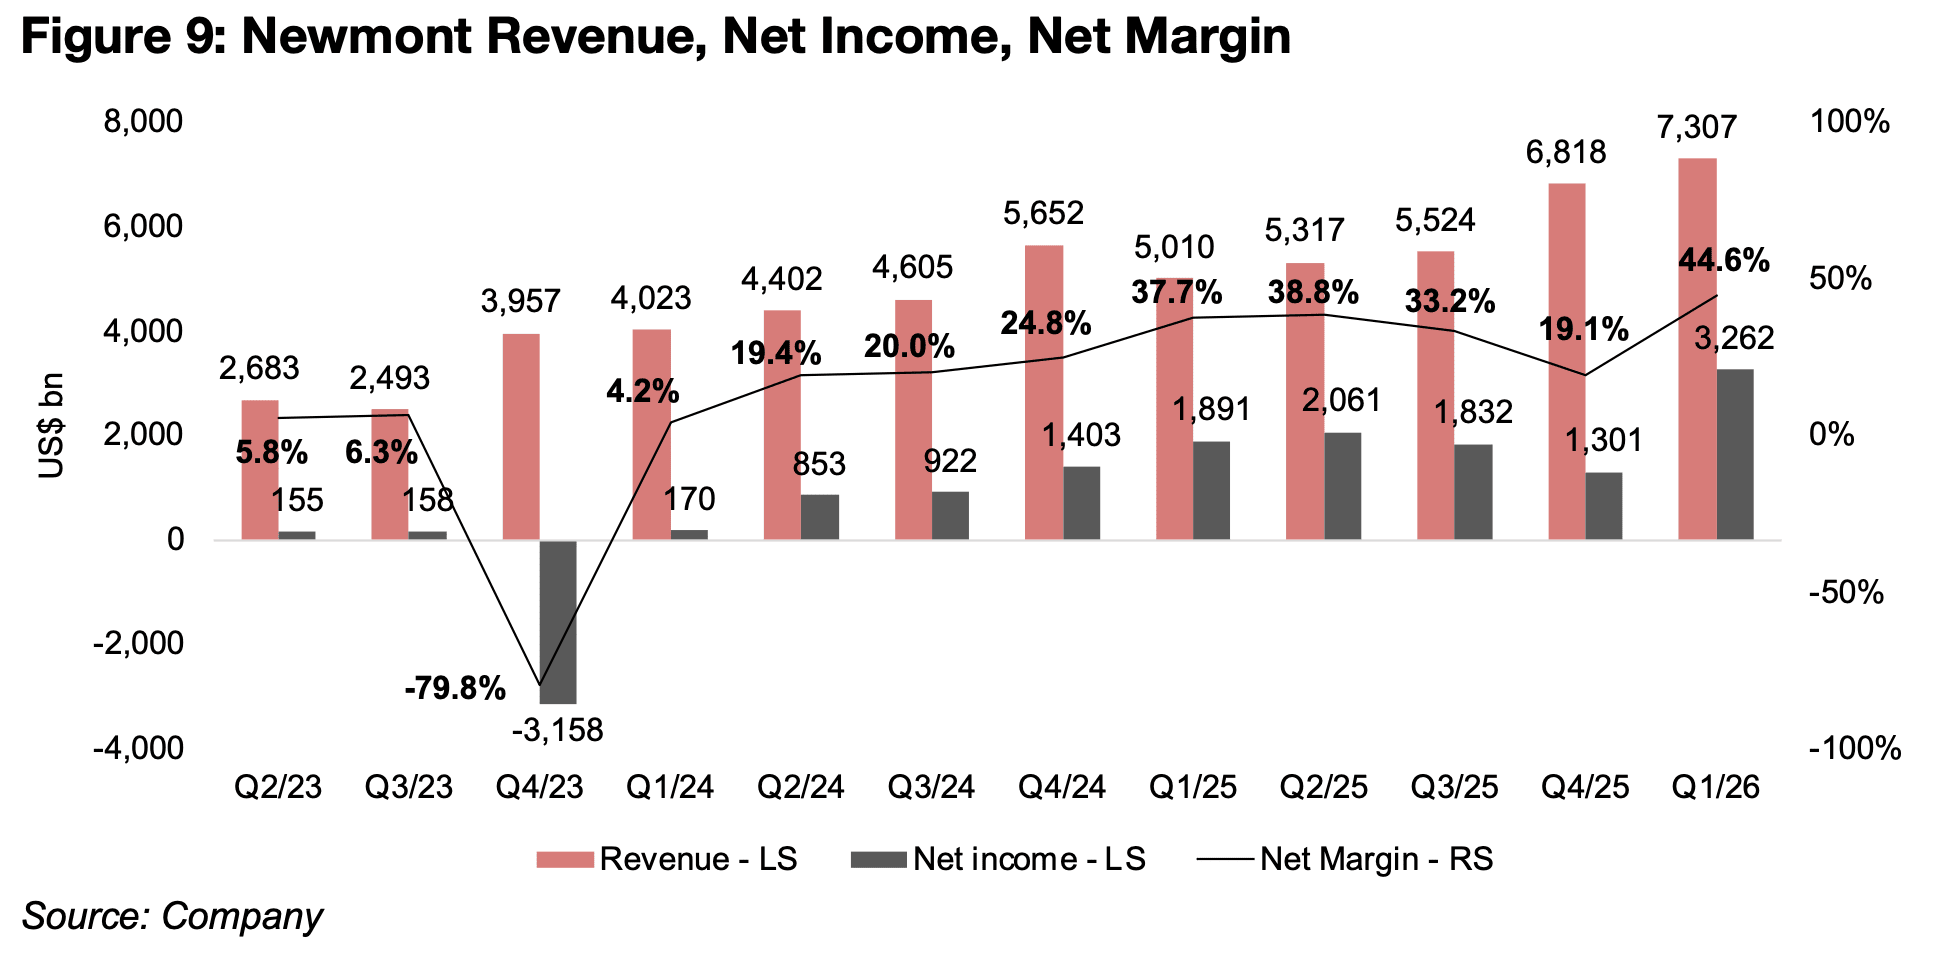
The rising gold price far offset the decline in production, driving revenue to a record US$7.3bn for Q1/26, up 45.8% yoy and 7.1% qoq, as well as net income at US$3.2bn, up 72.5% yoy and 150.7% qoq (Figure 9). The net margin also surged to its highest levels in year at 44.6%, up from just 19.1% in Q4/25 and an average 33.6% from Q4/24 to Q3/25. The relatively low net income in Q4/25, even though the operational spread remained high, was mainly on exceptional items, especially a US$0.8bn impairment charge from the Yanacocha Sulfides project after it was deferred indefinitely by the company. This was the first major negative exceptional item that the company had incurred since a charge in Q4/23 lead to a significant negative net income of US$-3.2bn.
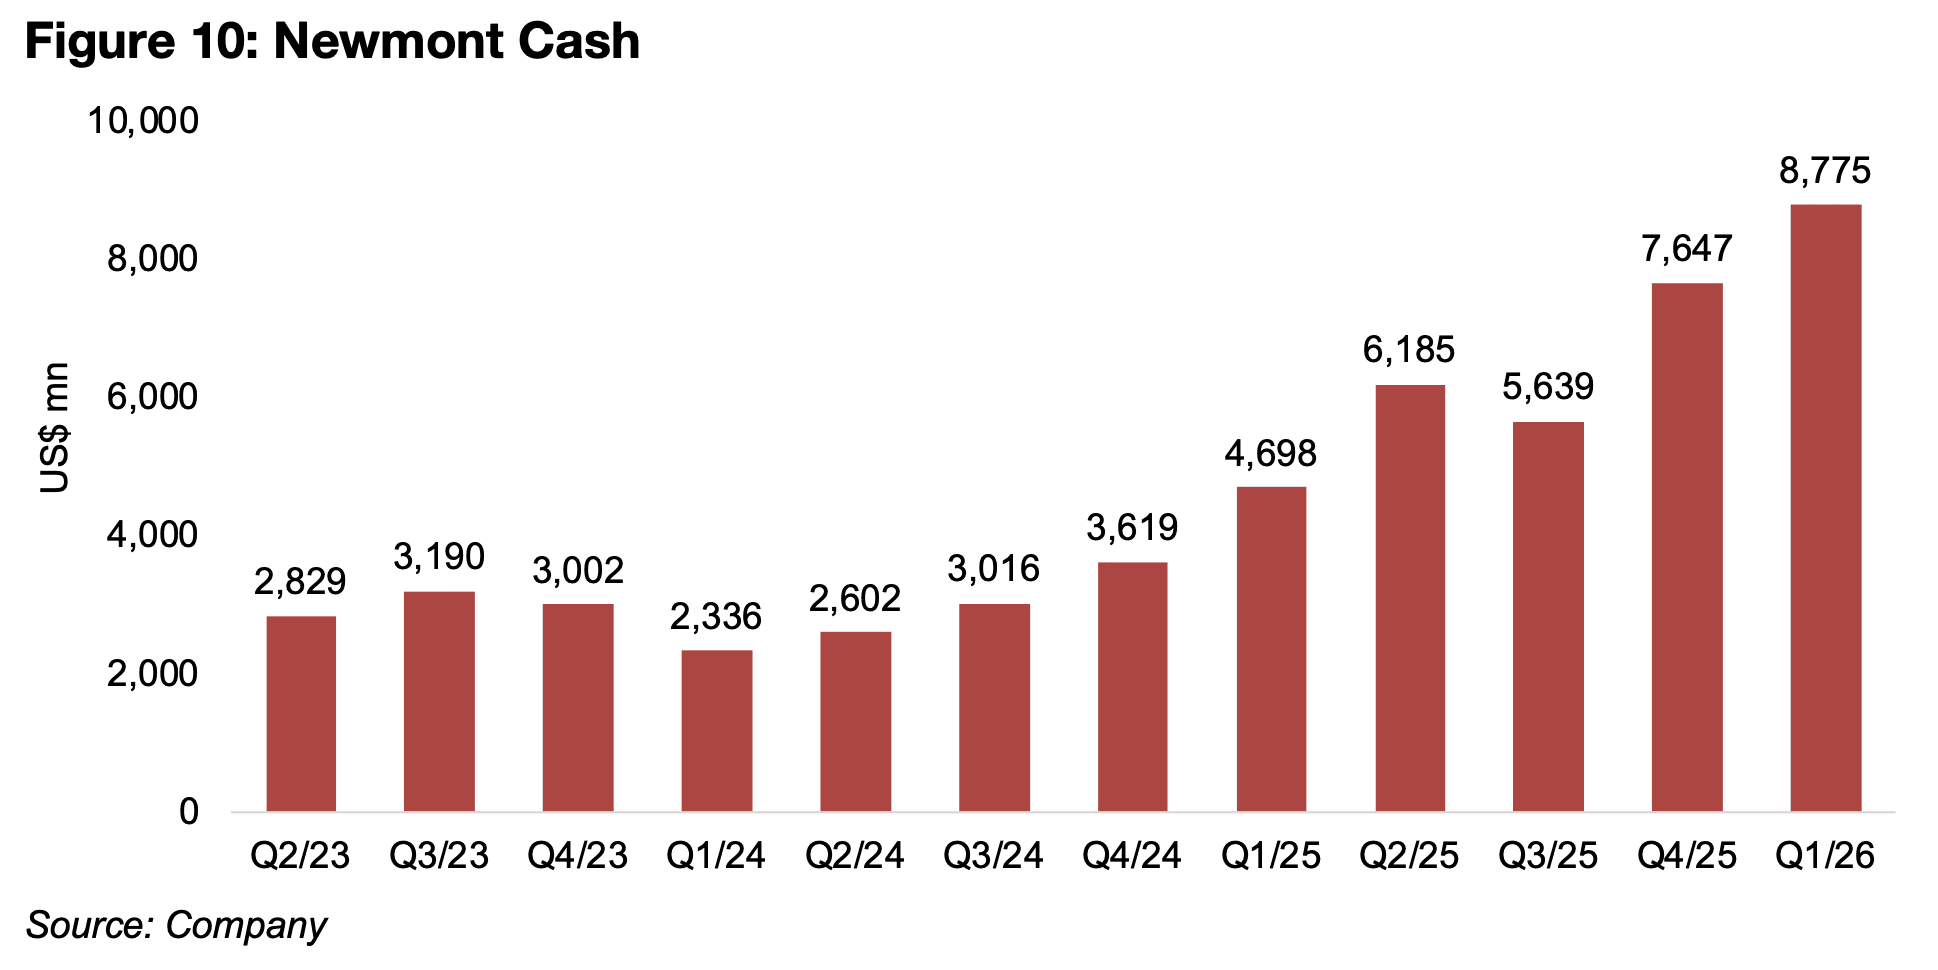
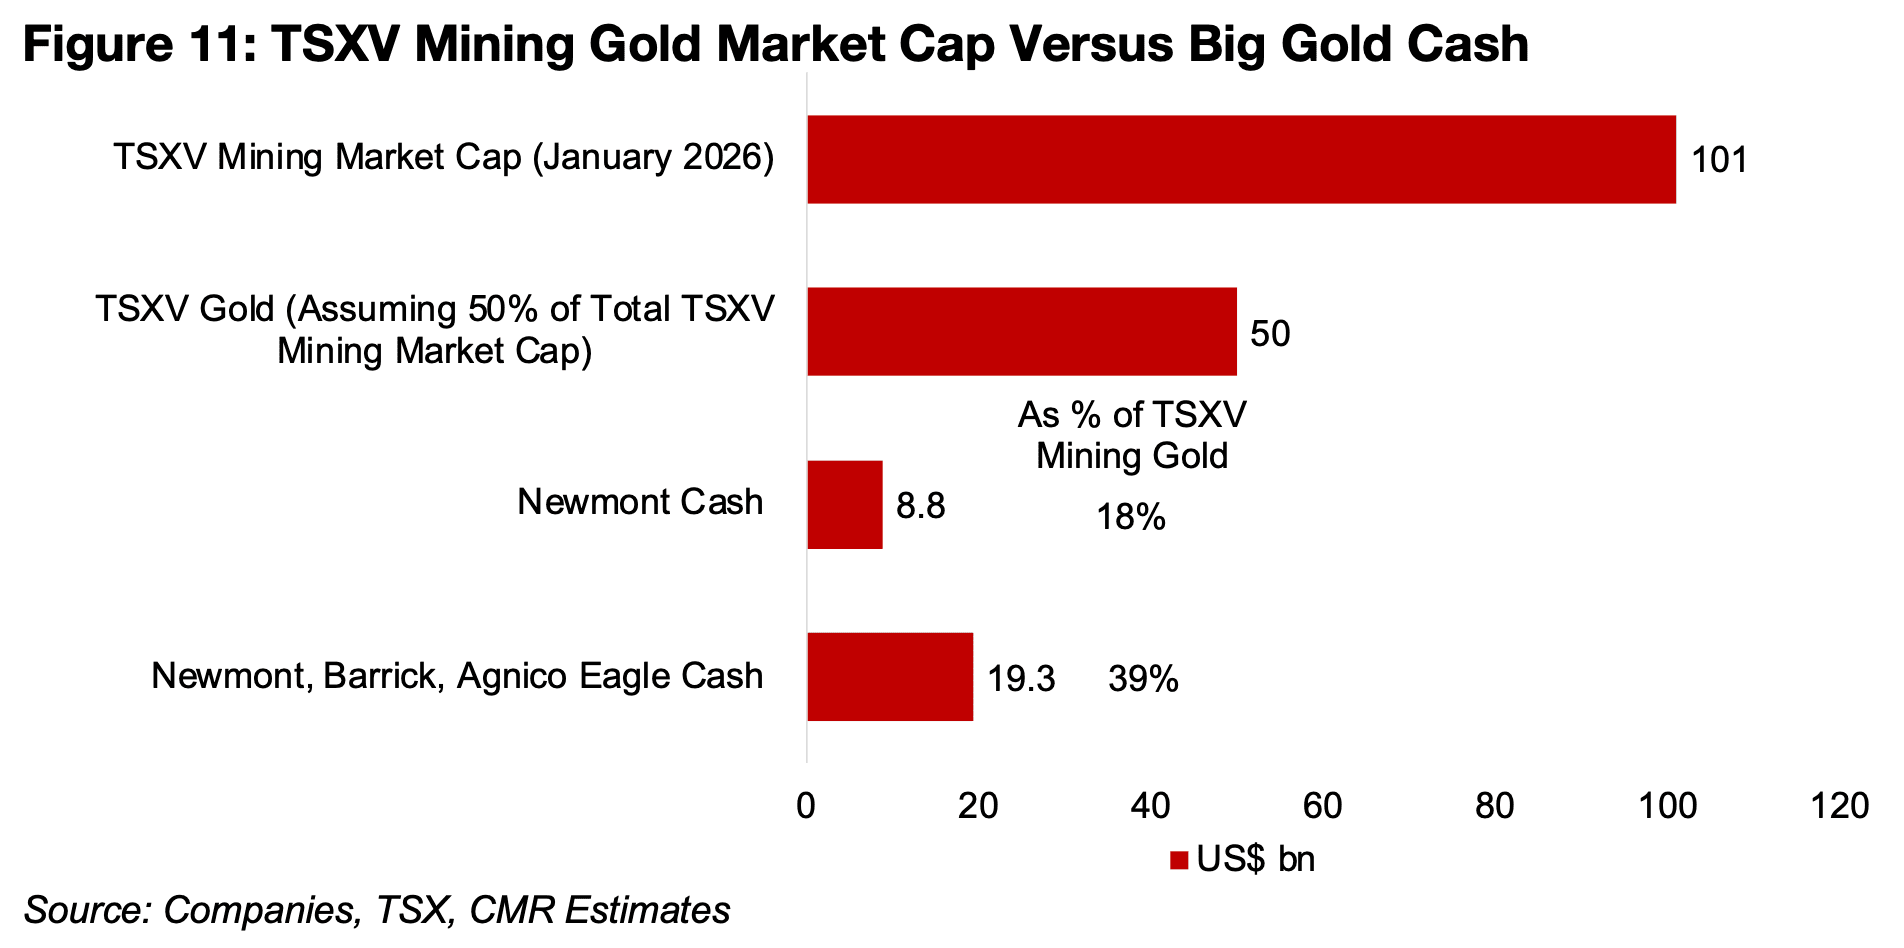
One issue that is clear from the drivers behind Newmont’s production decline, which were mainly planned reductions in grade, is that they are need of new major projects to drive output growth. They certainly have the cash for major acquisitions, with US$8.8bn as of Q1/26, up over US$1.0bn from US$7.7bn in Q4/25 and over US$4.0bn from US$4.7bn in Q1/25 (Figure 10). The total TSXV mining sector market cap was US$101bn, and if we assume around half of this, or US$50bn, are gold companies, Newmont alone could purchase 18% of TSXV gold with its current cash (Figure 11). Including the cash from Newmont plus the Q4/25 cash from Barrick and Agnico Eagle, this increases to 39% of the estimated TSXV gold mining market cap.
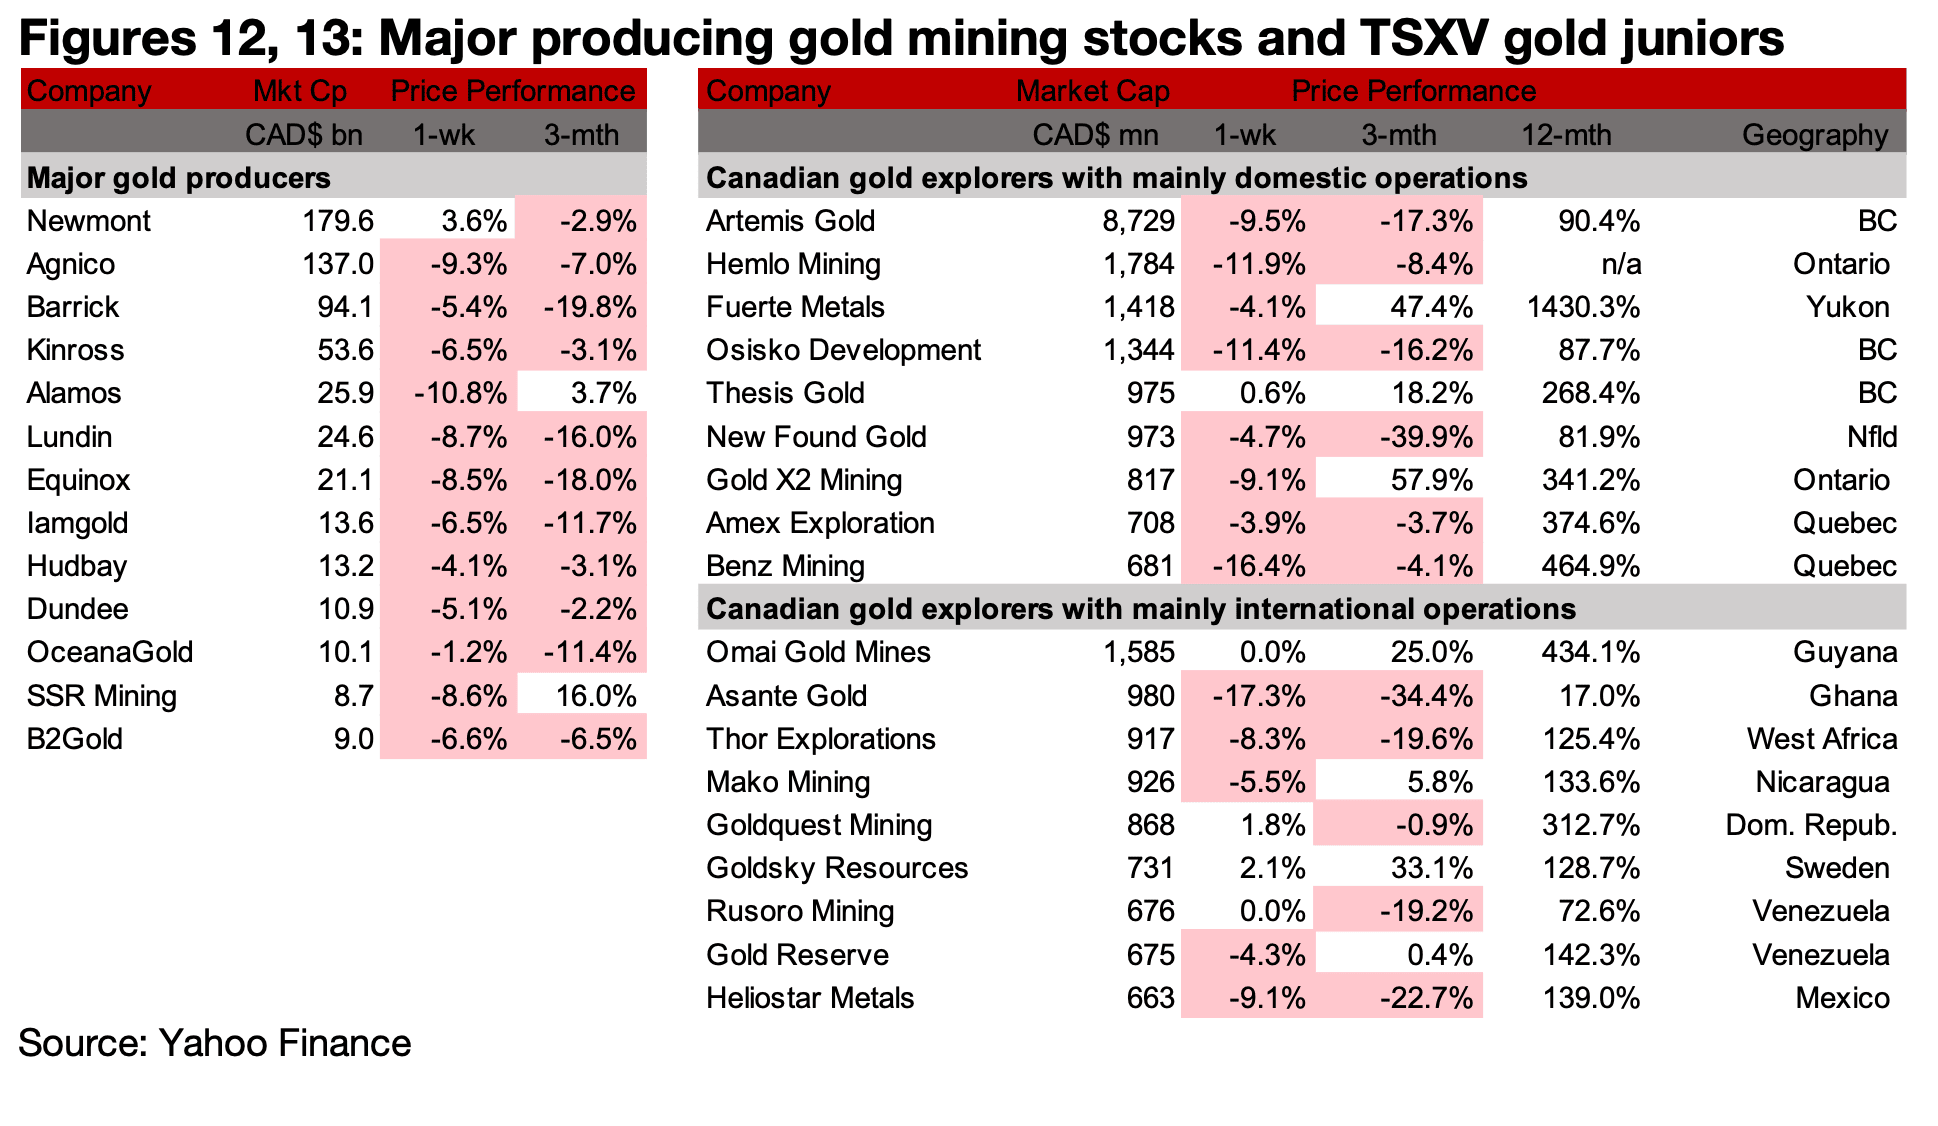
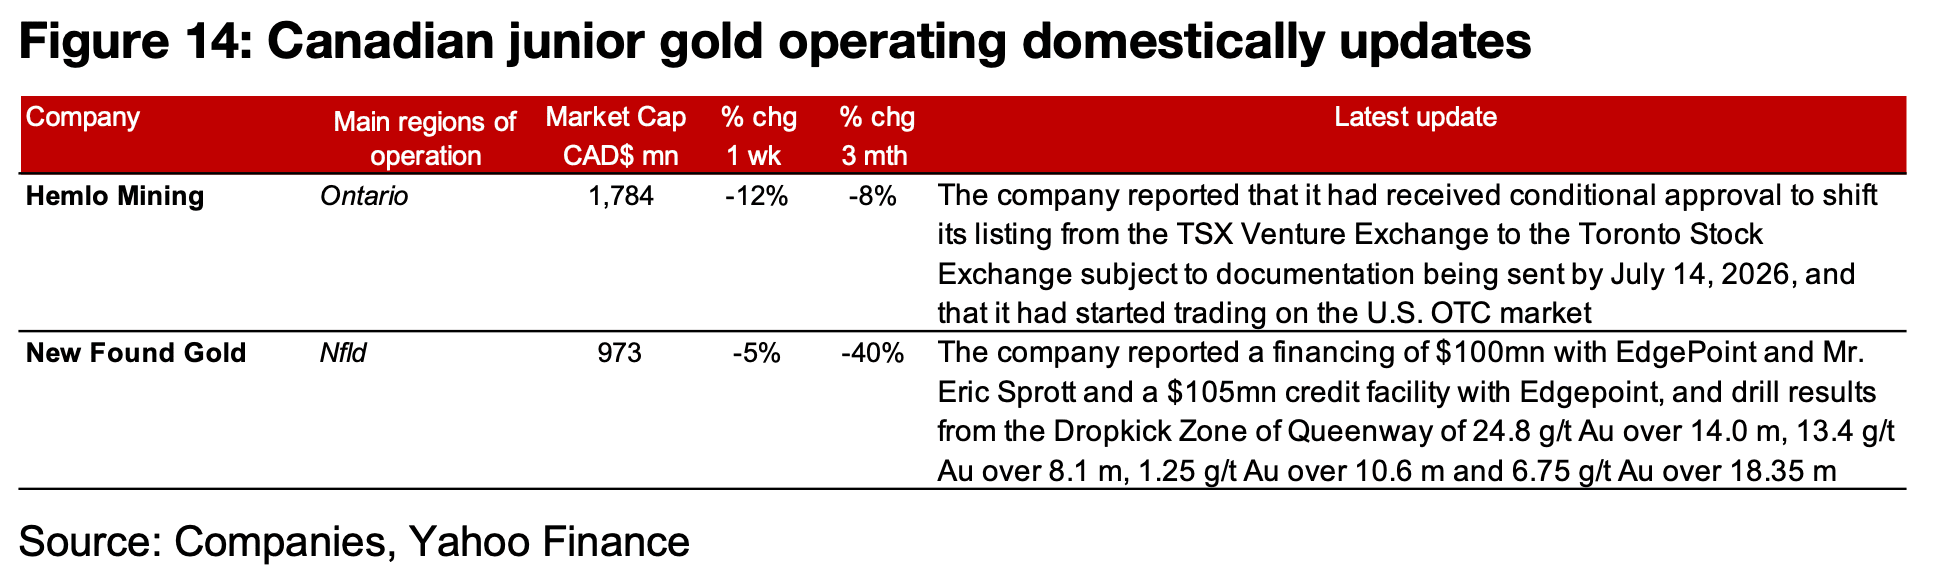
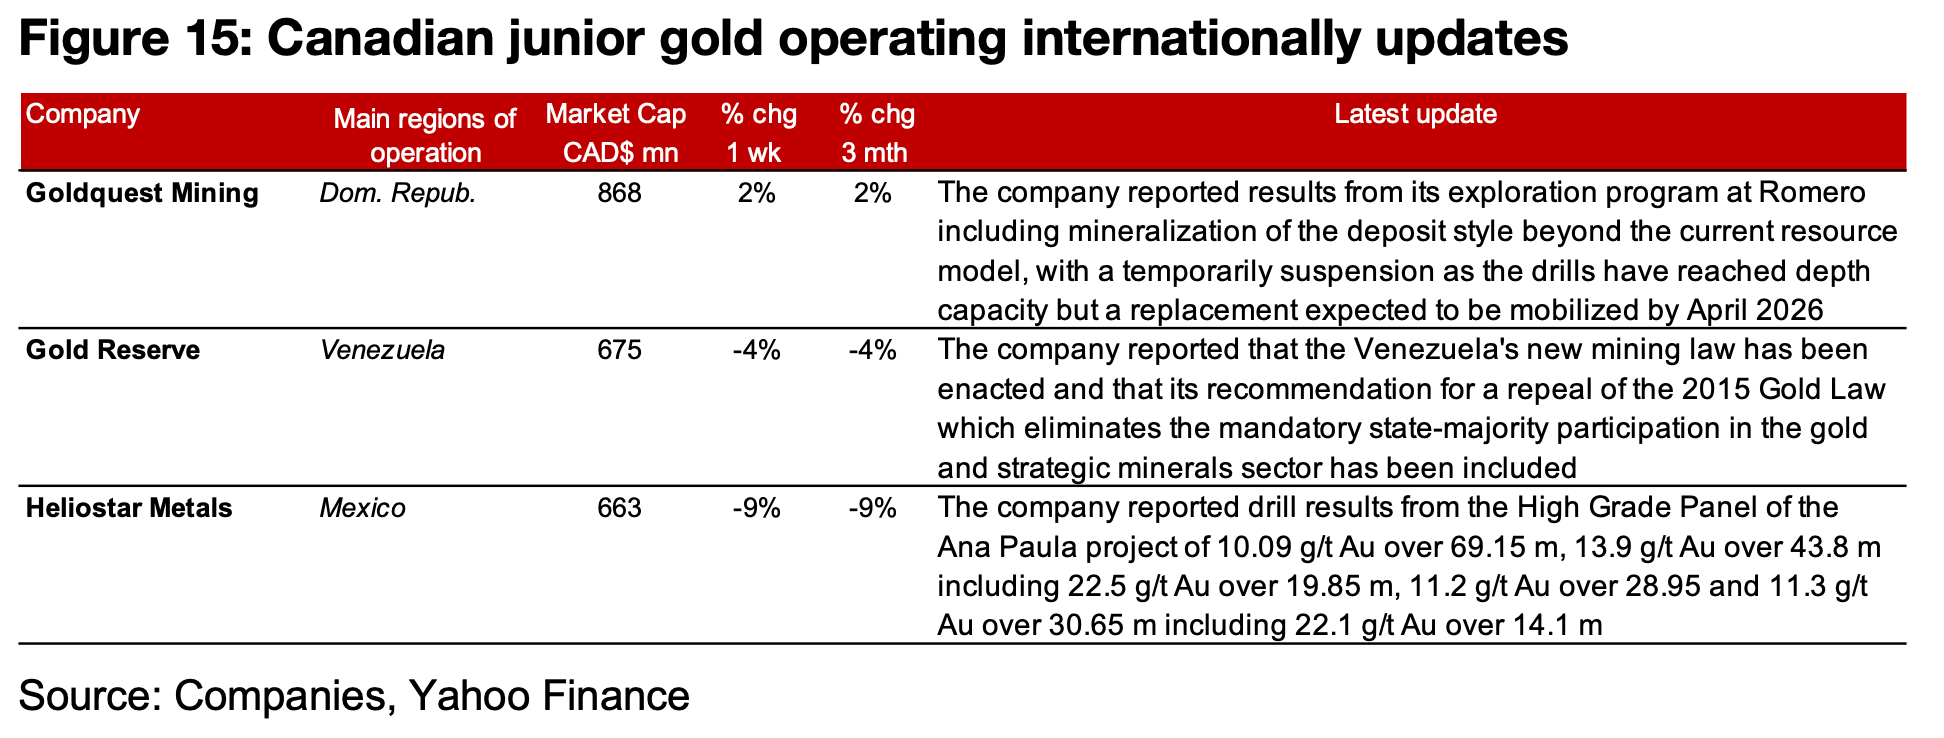
The major producers were all down except for Newmont which was boosted by the strong Q1/26 results, and most of TSXV gold declined (Figures 12, 13). For the TSXV gold companies operating mainly domestically, Hemlo reported it had received conditional approval to move its listing from the TSXV to TSX and that it started trading on the U.S. OTC market. New Found Gold reported two financings, a bought deal placement with participation by Mr. Eric Sprott and Edgepoint, and a US$105mn credit facility with Edgepoint (Figure 14). For the TSXV gold companies operating mainly internationally, Goldquest reported exploration results from Romero, Gold Reserve announced that Venezuela’s new mining law included the company’s recommendation to repeal the 2015 Gold Law, eliminating mandatory state-majority participation in the gold and strategic minerals sectors, and Heliostar announced drill results from the High Grade Panel of the Ana Paula project (Figure 15).
Disclaimer: This report is for informational use only and should not be used an alternative to the financial and legal advice of a qualified professional in business planning and investment. We do not represent that forecasts in this report will lead to a specific outcome or result, and are not liable in the event of any business action taken in whole or in part as a result of the contents of this report.
Author
Ben McGregor authors the Weekly Roundup at CanadianMiningReport.com, providing sharp analysis of the metals and mining sector. With a talent for spotting trends, Ben distills complex market shifts into clear, engaging insights on TSXV junior miners. His weekly updates cover gold, copper, uranium, and more, blending data-driven perspectives with a knack for identifying opportunities. A vital resource for investors, Ben’s work navigates the dynamic junior mining landscape with precision.