
March 04, 2024
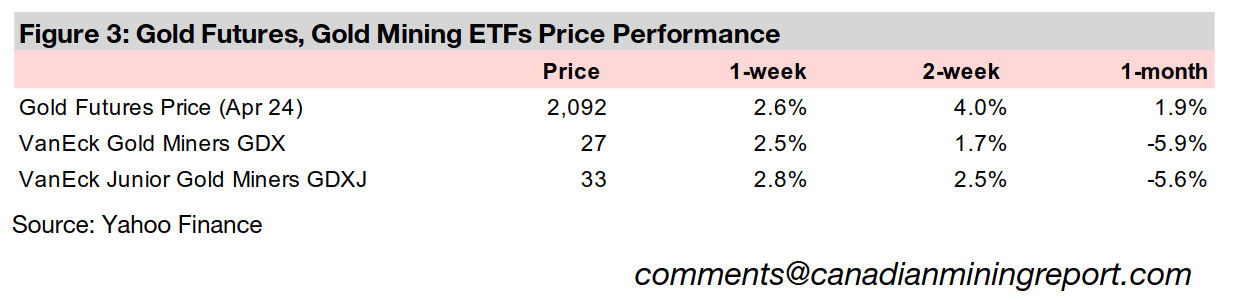
Gold jumped 2.6% to US$2,092/oz, even with Fed officials again pushing back on the chance for rate cuts soon, as they outlined measures the central bank was considering that could effectively lower interest rates through other mechanisms.
This week we look at the rare earth minerals market, where prices are showing signs of recovery and Canada is poised to become a major global player given already high levels of these resources and rising investment in processing capacity.
The gold stocks rose, with the GDX and GDXJ up 2.5% and 2.8%, on a big jump in gold for a second week and gain in both large and small cap equities, with the S&P 500 adding 0.9% and Russell 2000 surging 3.2%, while TSXV large gold was mixed.


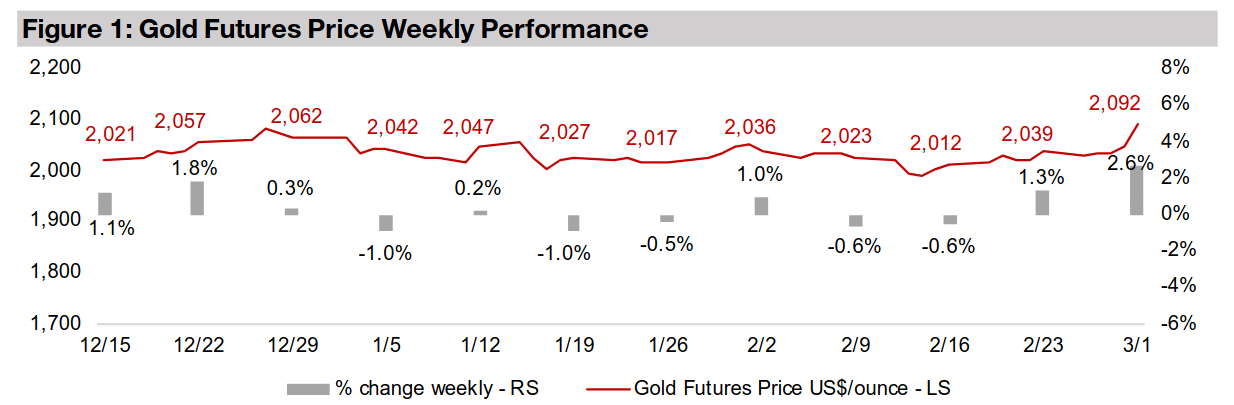
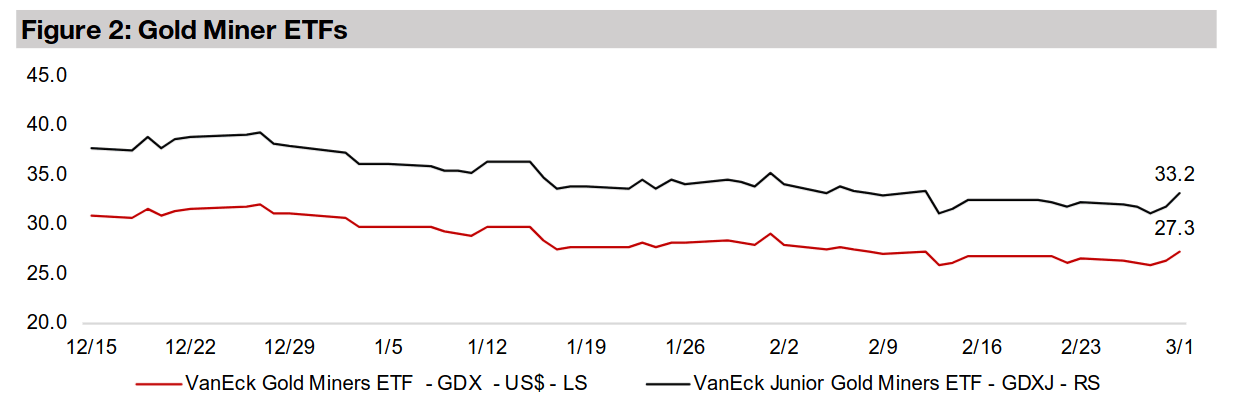
Gold saw a large gain for the second consecutive week, up 2.6% to US$2,092/oz, and gold stocks also rose, with the GDX and GDXJ gaining 2.5% and 2.8%, supported by a rise in large and small caps, with the S&P 500 and Russell 2000 adding 0.9% and 3.2%. This came even as there was again push back from Fed officials on the need for rate hikes anytime soon, which might have been expected to be negative for gold and equity markets. However, while actual direct cuts in the base rate do not appear to be coming anytime soon, central bank officials indicated other measures they might be taking which still implied a chance of lower yields.
Fed Governor Waller indicated that the Fed would like to increase the proportion of
its portfolio invested in short-dated securities, with Treasury Bills having declined to
just 5% of the total from over 30% before the global financial crisis in 2008-2009. If
the Fed buys more short-term bonds, this increases their demand, pushes up their
prices and lowers their yields, as bond prices and yields move inversely. If they sell
long-term bonds to do this, it would lower their demand and price, and increase their
yield, leading to a steeper yield curve. This steeper yield curve in turn tends to indicate
a healthier economic situation than a flat or inverted yield curve.
Another Fed official, Logan, also suggested the central bank could likely start to
reduce how rapidly it is reducing its balance sheet. This implies a lower supply of
bonds coming to the market, which with demand held flat would increase bond prices,
again lowering their yields. The overall implication is that even if the Fed did not
decrease its base rate directly in the coming months, other forces would be operating
that could reduce interest rates. This drove the major rise in both the bond markets
and gold, with the metal tending to gain with looser monetary conditions.
This week we look the rare earth minerals market, which although small in value terms,
has an outsized effect on global manufacturing given the crucial role they play in
many key processes and the lack of appropriate substitute materials. The sector has
even become quite politically charged in recent months, as China completely
dominates the industry, and the country recently banned exports of some rare earth
related technology, in line with a trend of increasing trade protectionism globally.
This has driven many countries, including the US, to reconsider the political security
of their rare earth supply, opening a significant opportunity for Canada, which has
huge levels of rare earth Resources. The country is currently developing both many
projects for raw rare earth mineral production, but also the capacity for processing
these raw natural resources, which is equally important as China also completely
dominates this segment of the industry.
China’s most recent December 2023 export ban specifically affected the export of
some technology for processing rare earth minerals related to permanent magnets.
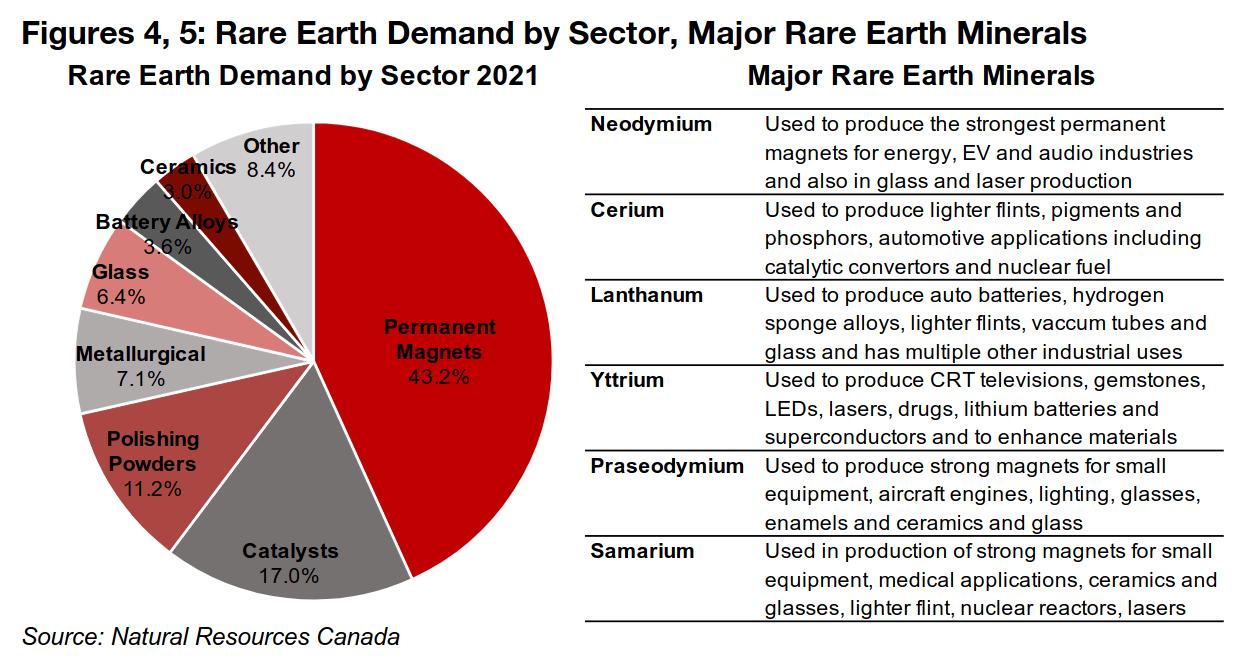
This is significant for the industry as these magnets are by far the largest source of
rare earth mineral demand, accounting for 43.2% in 2021 (Figure 4). The magnets are
critical for energy generation and electronics, including use by U.S. defense
companies, which in turn escalates the issue of limited rare earth minerals supply into
a potential national security threat.
Figure 5 shows the largest rare earth minerals markets, with Neodymium, Samarium
and Praseodymium factoring the most in permanent magnet production. The other
major rare earth metals are more critical for other industries. Cerium is used in auto
catalysts, while Lanthanum and Yttrium are also key in the auto industry through
battery production, while the two former have in common their use in lighter flints. All
three have an additional wide range of advanced industrial uses.
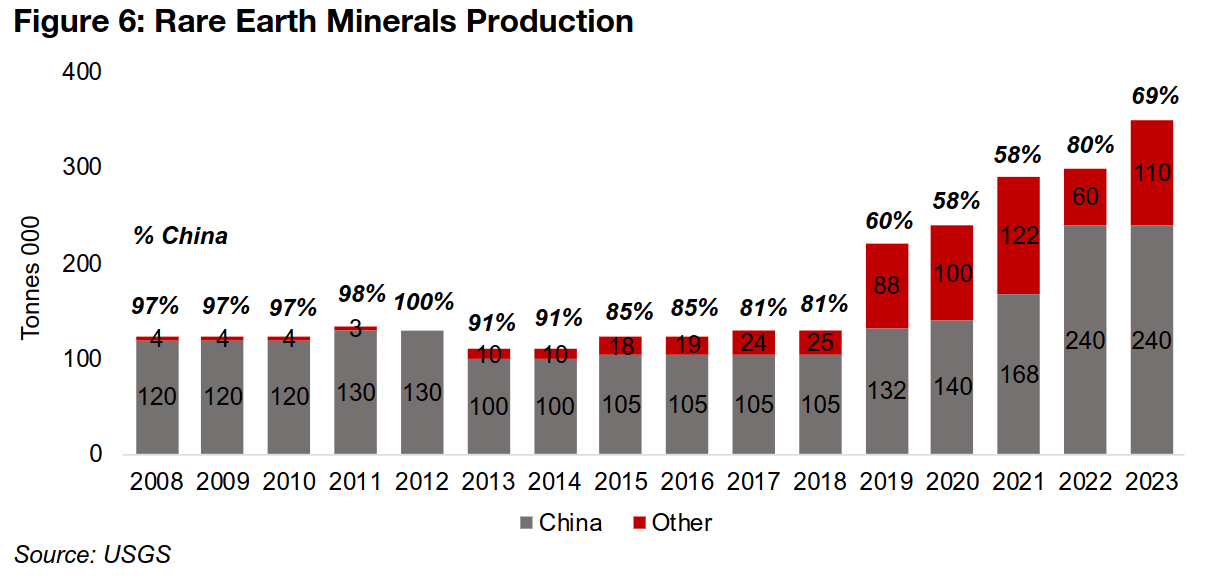
China’s dominance of raw rare earth mineral production is shown in Figure 6, with the country accounting for 69% of global output in 2023, down from 80% in 2022. However, China’s share had been even more extreme in the late 2000s and early 2010s, reaching as high as 100% in 2012. As global trade tensions started to grow by the end of the last decade, other countries started to expand their production. While China’s share of raw production is broadly declining, it still controls 85%-90% of the rare earth processing capacity. This further highlights the leverage of China’s rare earth processing technology ban, as it is not simply access to the raw materials, but also the ability to convert them into a usable form for industry, that would need to shift to reduce China’s dominance in the industry.
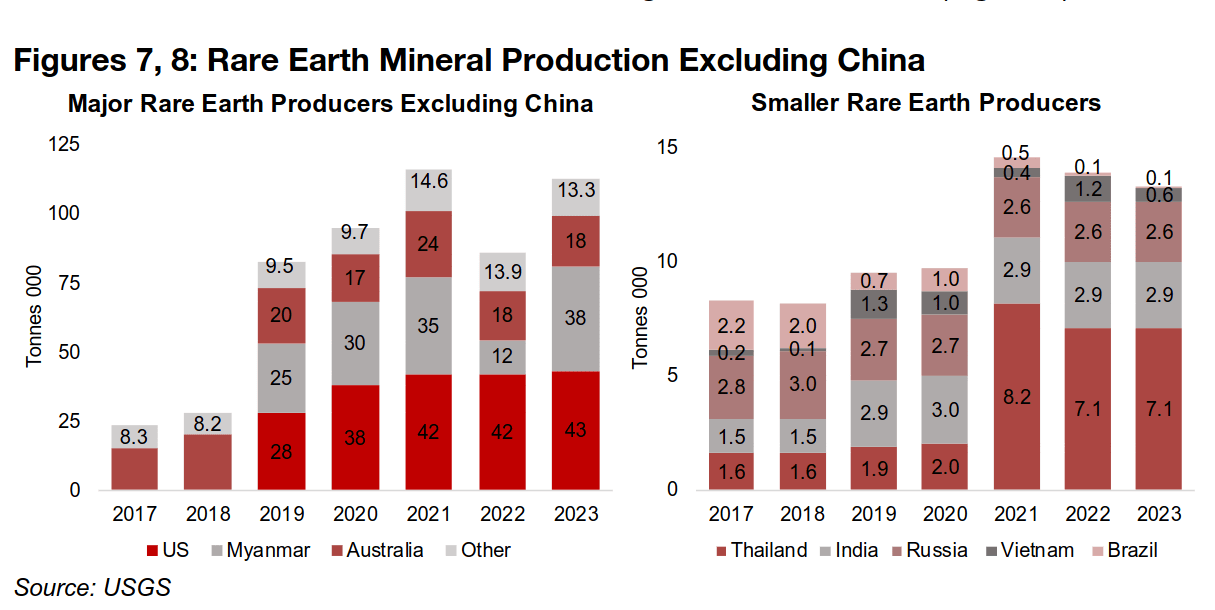
The three biggest new players in rare earth mineral production have been the US, which had been a major player in the decades before China’s rise, but had shutdown a key mine, and Myanmar, and Australia (Figure 7). While the reopening of this key US mine has made the country the second largest global producer, supply is still relatively limited from a security perspective. Supply from Myanmar, the third largest producer, and world’s largest exporter of rare earth minerals, is not accessible, with nearly all of it sent to China. While rare earth supply from Australia is politically secure, the extreme distance and recent disruptions to global shipping are still risks. There are a handful of other producers with currently small output, although some have substantial Reserves which could see them gain share over time (Figure 8).
This rising demand for secure rare earth mineral supply from the US, and other
countries where political issues could arise with China, especially brings Canada’s
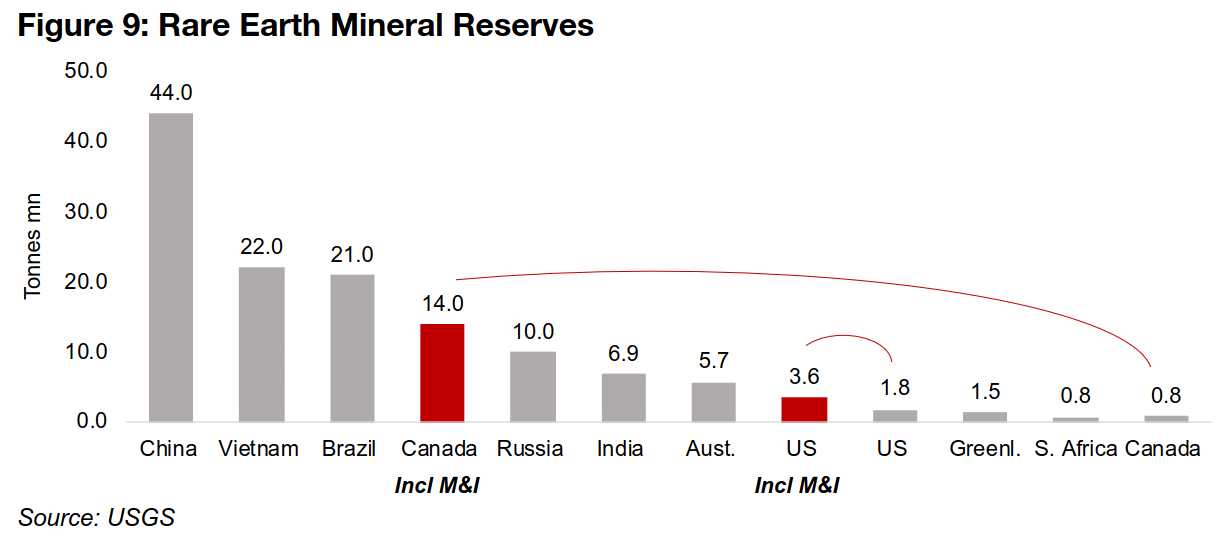
potentially huge supply into play. While the country’s Reserves just make it into the
top ten globally, at 0.8mn tonnes, using the slightly less strict Measured and Indicated
Resources (M&I) instead, it jumps to the fourth largest, with 14.0 m tonnes. Vietnam
and Brazil also have huge reserves, at 22.0 mn and 21.0 mn tonnes, giving scope for
these countries to dramatically increase rare earth mineral output (Figure 9).
So while China’s huge 44.0 mn reserves will see it likely maintain its number one
position in the industry for many years, a combination of Canada, Brazil and Vietnam
could conceivably rise to over fifty percent or more of raw rare earth supply long-term.
Of these three, from a US security perspective, the Canadian supply bears the lowest
risk of politically motivated disruption which is likely to bolster investment support.
However, even with raw production likely to become more balanced, there is still the
issue of China-dominated processing. Canada is already in the process of developing
this capacity, including a plant for neodymium-praseodymium, the minerals needed
for permanent magnets, which is planned to start operating by late-2024.
Data for the rare earth minerals market is extremely opaque, especially in contrast to
abundant price and supply and demand data for most of the major metals. There is
no equivalent core source like the World Gold Council, Silver Institute or International
Copper Study Group for regular data and forecasts. However, very rough estimates
can be compiled from the sparse publicly available data for five of largest metals
markets, Neodymium, Cerium, Lanthanum, Samarium, and Praseodymium. Yttrium
is also a major rare earth mineral market but has not been included given limited data
availability for the size of the market or recent prices.
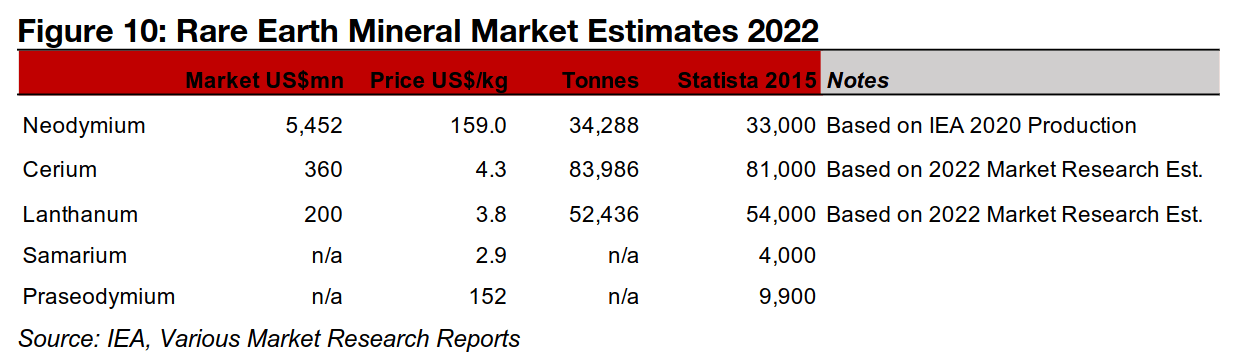
Neodymium is the largest market of all the rare earth minerals by far. Using an IEA
estimate for 2020 neodymium demand of 30.9k tonnes and growing it out five percent
over the next two years, gives an estimated 34.2 mn tonnes for 2022 production
(Figure 10). While this reconciles to a similar estimate for 33.0 mn from Statista, this
data is from 2015, and would suggest flat growth for the mineral for the last eight
years. This obviously contrasts with the overall growth in the market reported by the
USGS, and therefore both of these estimates remain questionable.
For the average price of Neodymium, Business Analytiq track several monthly rare
earth minerals back several years. However, they acknowledge that their estimates
are not exact and should not be the basis of investment decisions. For our purposes,
however, these figures are enough to get an idea of broad trends in rare earth prices,
and do reconcile roughly with several sources of spot prices selling the minerals
directly to consumers. Multiplying the neodymium production estimate by the
average US$159.0/kg 2022 price gives a US$5.4bn market size.
For Cerium there is no similar IEA estimate, and therefore we start from a total market
size indicated in some market research reports at US$360mn. Using the average
US$4.3/kg 2022 price from Business Analytiq implies Cerium production of 83.9k
tonnes in 2022. This again reconciles well with the 81.0k tonne estimate from Statista
2015, but has the same problem as the neodymium estimate of implying no growth
for eight years, which is unlikely. Using a similar calculation for Lanthanum a similar
issue arises. For Samarium and Praseodymium there does not appear to be publicly
available estimate for the 2022 market size.
While acknowledging that the Business Analytiq data may not be perfect, as does the
company itself, it is the only publicly available source for rare earth mineral prices
with a regular monthly history going back at least a couple of years. The prices also
do broadly correlate with the trends we see outlined in news articles for rare earth
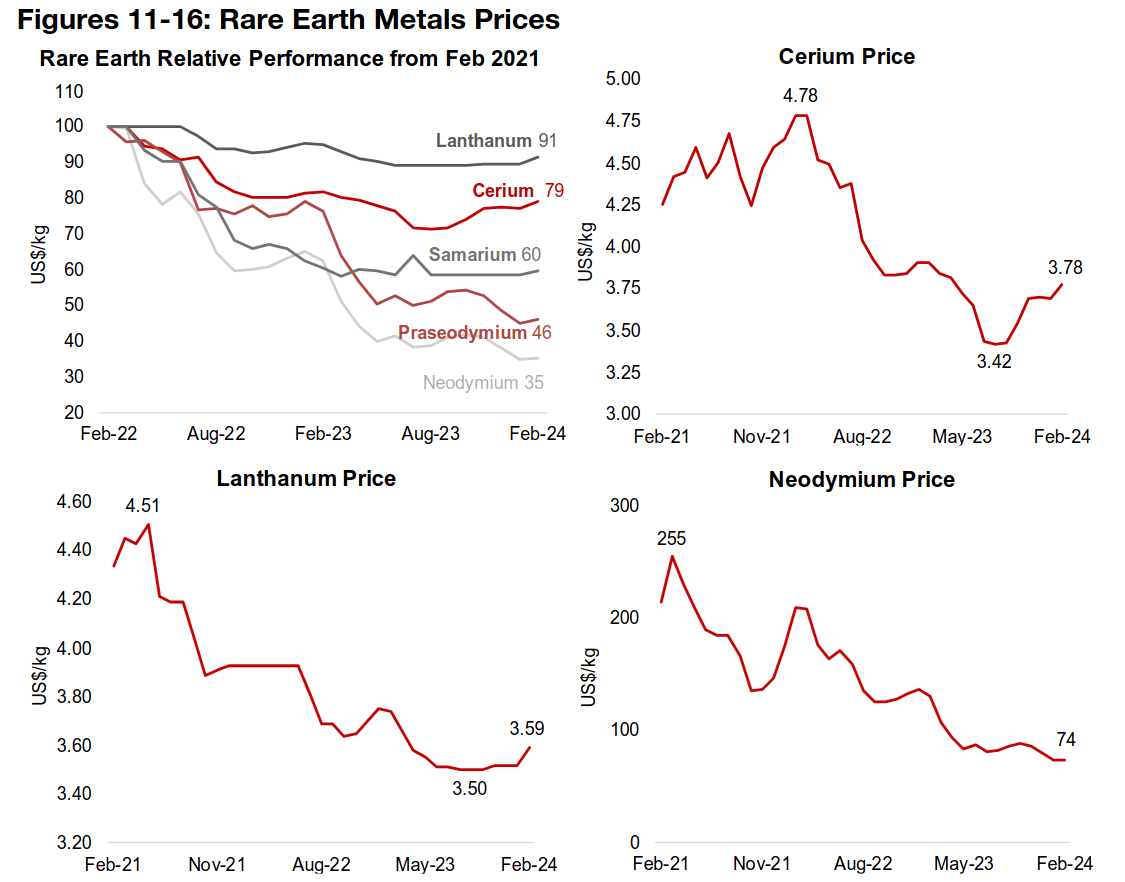
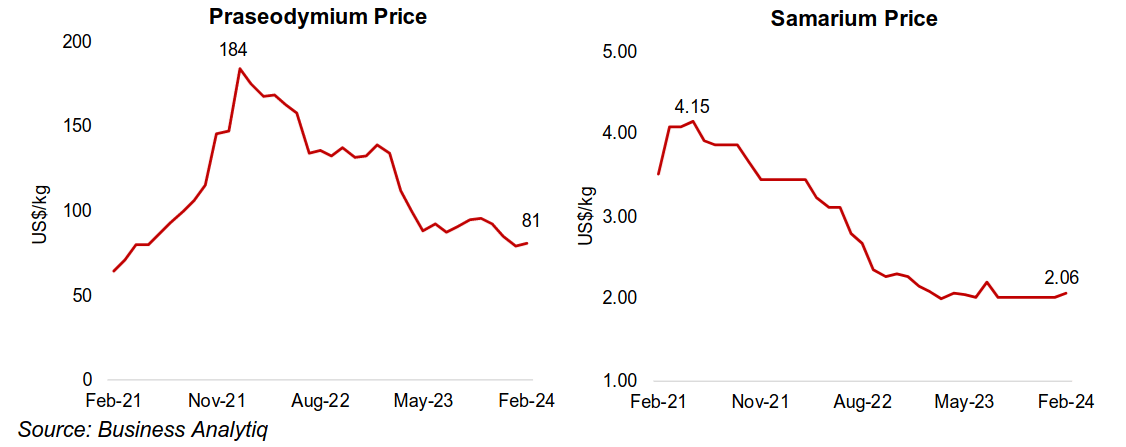
minerals. In terms of recent movements, rare earth metals prices have flattened
overall since mid-2023, after mostly plummeting through 2022. This was because of
a reversal of huge spikes for most of these metals in 2021 from the severe supply
chain disruptions caused by the global health crisis (Figures 11-16).
However, at least one, Cerium, has been in a clear rebound since mid-2023, and there
have been recent upticks in lanthanum and samarium. Neodymium and
Praseodymium rebounded in late 2023 but are back to new lows. Analyst consensus,
judging from press reports, is looking for a rebound in sector prices this year.
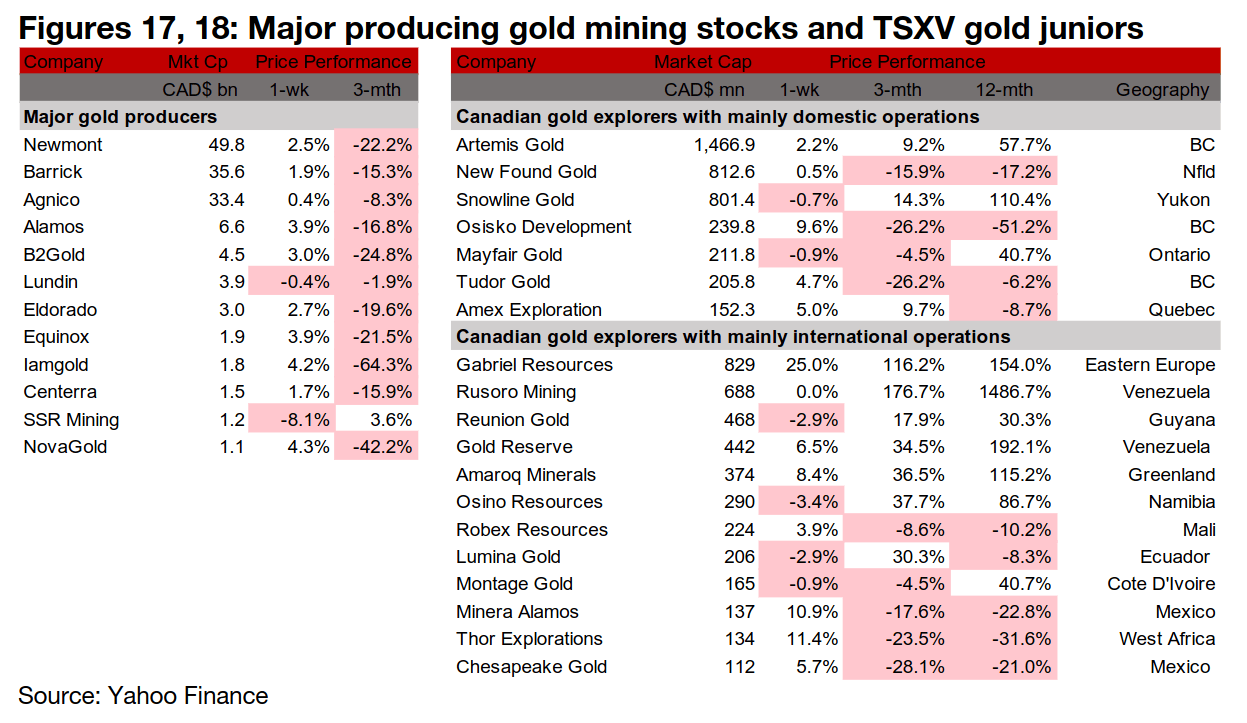
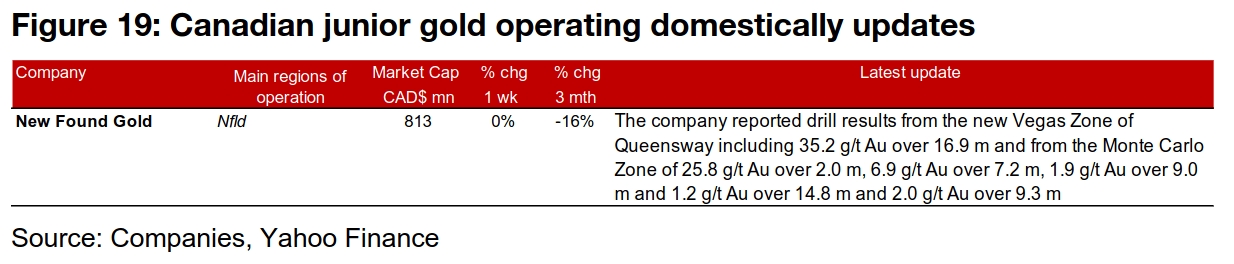
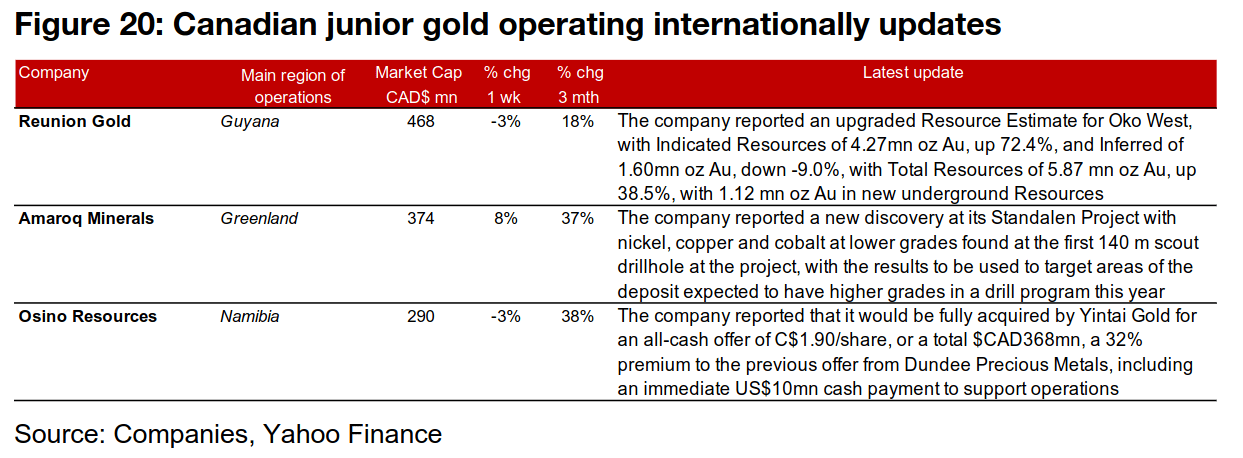
The large gold producers nearly all rose on the gain in the gold price, but the large TSXV gold stocks were mixed (Figures 17, 18). For the TSXV gold companies operating domestically, New Found Gold reported drill results from the new Vegas Zone and the Monte Carlo Zone of Queensway (Figure 19). For the TSXV gold companies operating internationally, Reunion Gold released an upgraded Mineral Resource Estimate for Oko West, with a 38.5% increase in Indicated and Inferred Resources, Amaroq reported a new nickel, copper and cobalt discovery at its Standalen Project and Osino Resources announced that it would be acquired for an CAD$368mn in an all-cash offer from Yintai Gold (Figure 20).
Disclaimer: This report is for informational use only and should not be used an alternative to the financial and legal advice of a qualified professional in business planning and investment. We do not represent that forecasts in this report will lead to a specific outcome or result, and are not liable in the event of any business action taken in whole or in part as a result of the contents of this report.
Author
Ben McGregor authors the Weekly Roundup at CanadianMiningReport.com, providing sharp analysis of the metals and mining sector. With a talent for spotting trends, Ben distills complex market shifts into clear, engaging insights on TSXV junior miners. His weekly updates cover gold, copper, uranium, and more, blending data-driven perspectives with a knack for identifying opportunities. A vital resource for investors, Ben’s work navigates the dynamic junior mining landscape with precision.