
May 15, 2023
This week we look at the drivers of the recent decline in the copper price, with production of the metal expected to outpace demand in 2023 and especially into next year, driving a substantial surplus in the market by 2024 according to the ICSG.
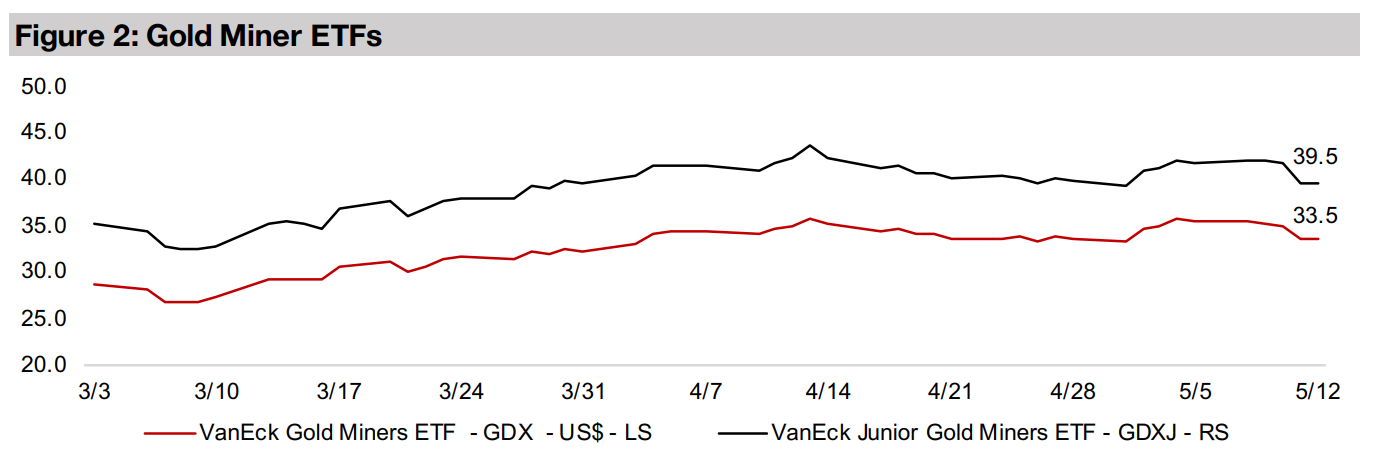
Gold stocks declined, with the GDX down -5.3%, the GDXJ falling -5.5% and the larger TSXV gold stocks mostly declined, even as both gold and equity markets were near flat, possibly on profit taking after sector gains over the past two weeks.


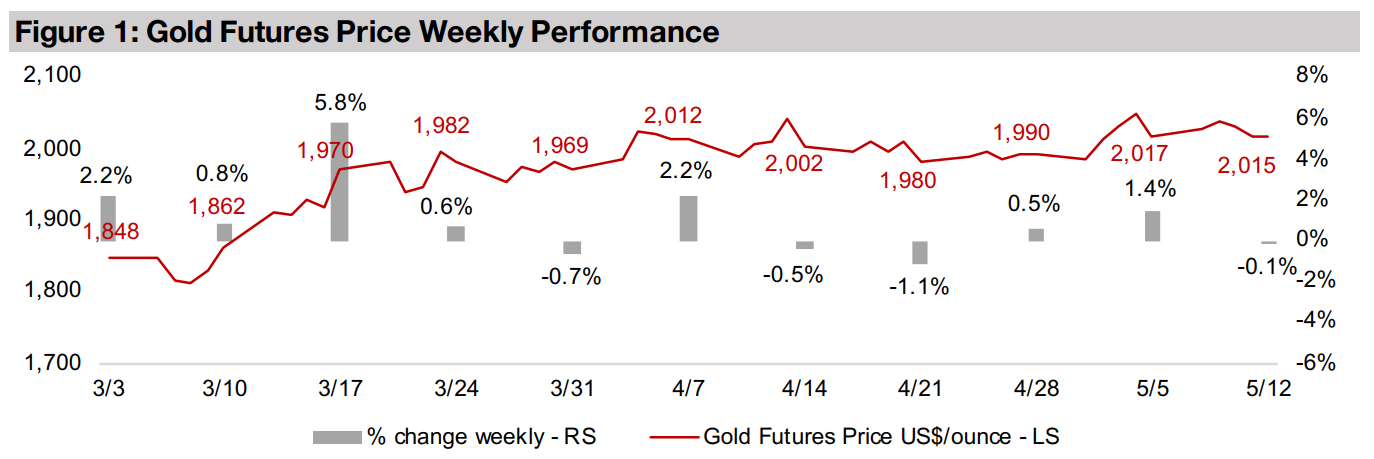
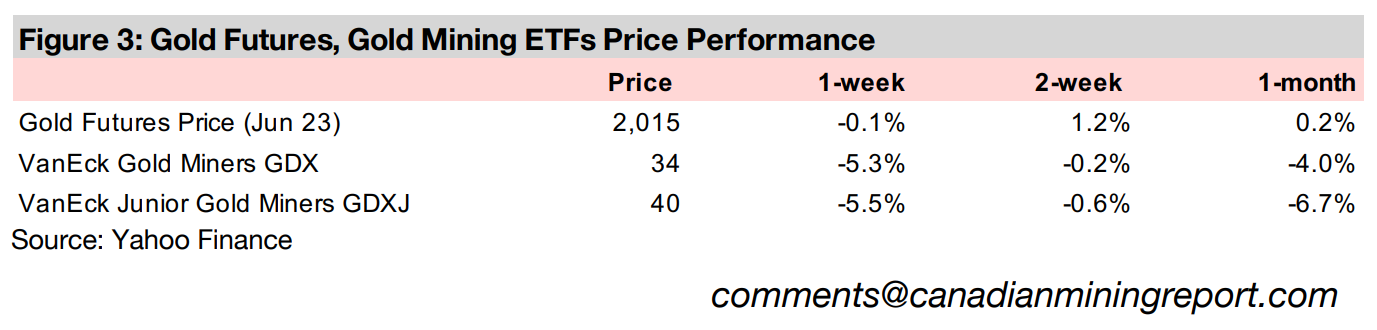
Gold was near flat this week, declining -0.1% to US$2,015/oz and importantly closed above the key US$2,000/oz level every day, not dipping below it anytime in intraday trading. This is key because while gold had breached the US$2,000/oz level several times in four of the last five weeks it had not held it consistently. The key economic news this week was US CPI Inflation data, with the markets neutral on the release in respect to both gold, which hardly moved, and equity markets, with the S&P 500 edging down just 0.2%, after two earlier more volatile weeks where a resumption of the banking crisis but strong US jobs numbers buffeted stocks.
US CPI inflation for April 2022 came in at 4.96%, remaining near flat compared to 4.99% in March 2022 (Figure 4). This is the first sign of stubbornness in US inflation since January 2023, when the CPI Index dropped 0.1% month on month. However, this was after a -1.0% month on month drop in March 2022, and US inflation has declined an average -0.32% month on month since July 2022, with the first half of 2022 the last time it was consistently rising (Figure 5). Just one month of a slowdown in the inflation rate would unlikely be enough to concern the Fed that its inflation fight was stalling, which engendered the relatively muted reaction by the market.
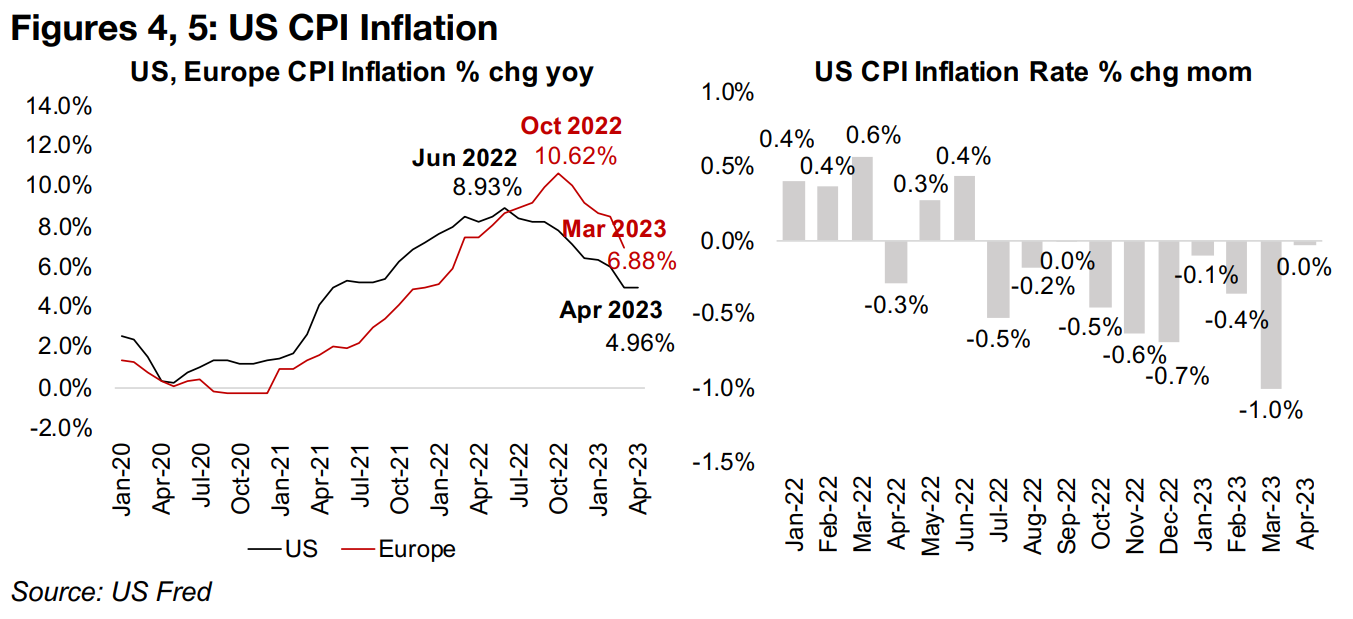
In Europe inflation has continued to drop significantly, reaching 6.88% yoy in March 2023. While this is still well above US levels, Europe also had a much higher, and later, peak, in October 2022 at 10.62%, as its rate hikes lagged the US considerably. However, it started to catch up with aggressive rate hikes in H2/22 and its drop in inflation has had somewhat of a steeper slope that in the US. However, CPI inflation in neither the US nor Europe has declined to a point where a rate cutting cycle might begin; it seems that a 'long pause' in rates is the most likely outcome.
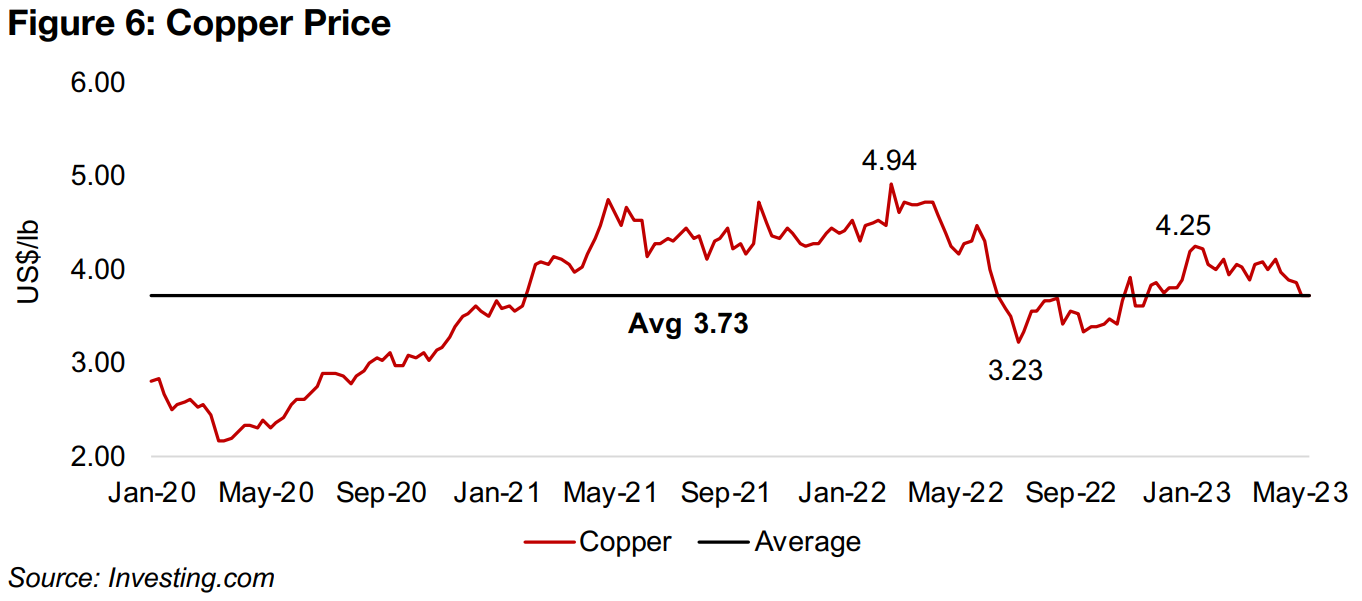
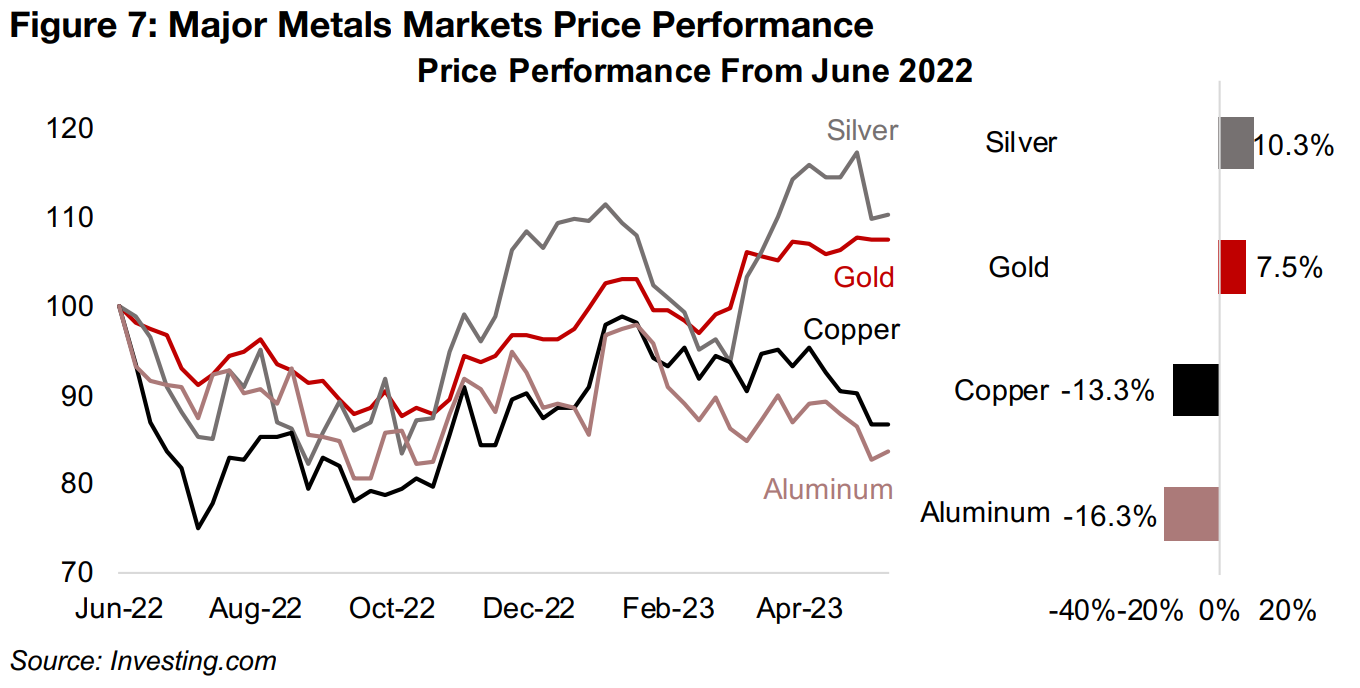
Copper has declined in 2023 from a peak of US$4.25/lb in mid-January, converging to its average since January 2020 of US$3.73, and is down -13.3% from June 2022, moderately outperforming aluminum, down -16.3% (Figures 6, 7). This contrasts with the rise in both gold and silver which began in October 2022 and accelerated with the onset of the banking crisis, with the metals up 7.5% and 10.3%, respectively, since June 2022. While copper also rose from October 2022 through to January 2023, it started to see pressure in February 2023 along with a general downtrend in other major base metals, as fears increased of an imminent global recession and the market moved more towards safe havens like gold and silver.
In addition to pressure on the copper price from rising fears that that global economic
demand could ease there is also the issue of a considerable supply surge which is
expected to start this year and gain momentum into 2024. The International Copper
Study Group (ICSG), which provides detailed forecasts for copper demand and
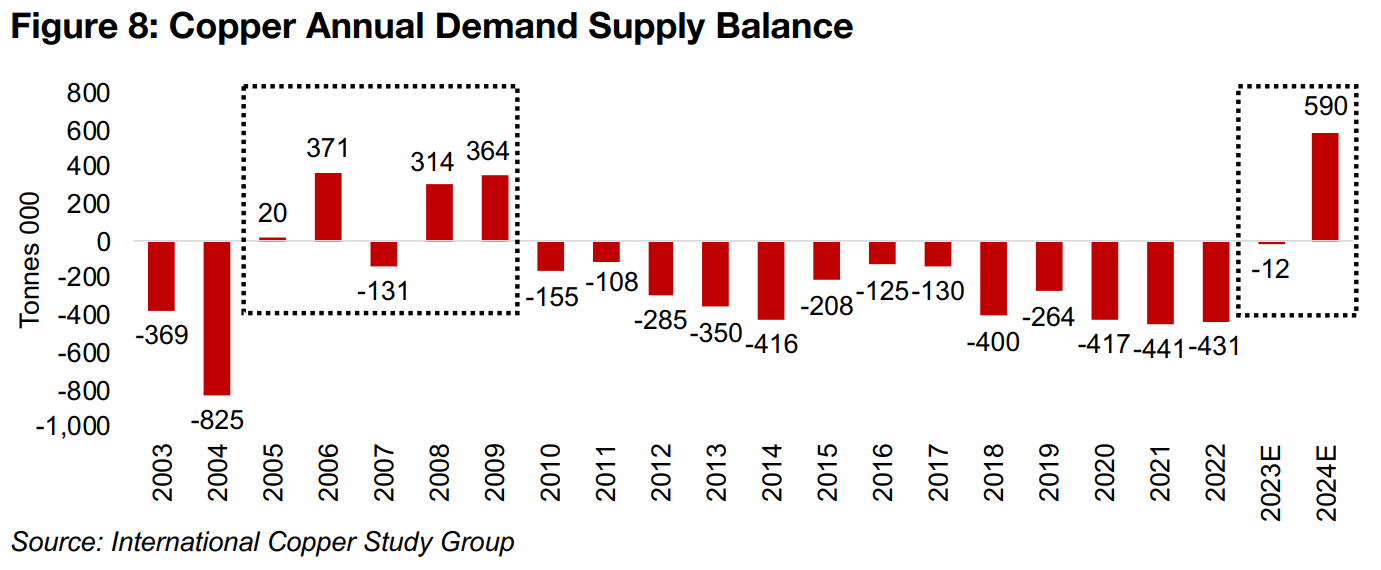
supply, expects the market to move from a deficit of -434k tonnes in 2022 to a near
balanced market with a marginal -12k tonne deficit in 2023E (Figure 8).
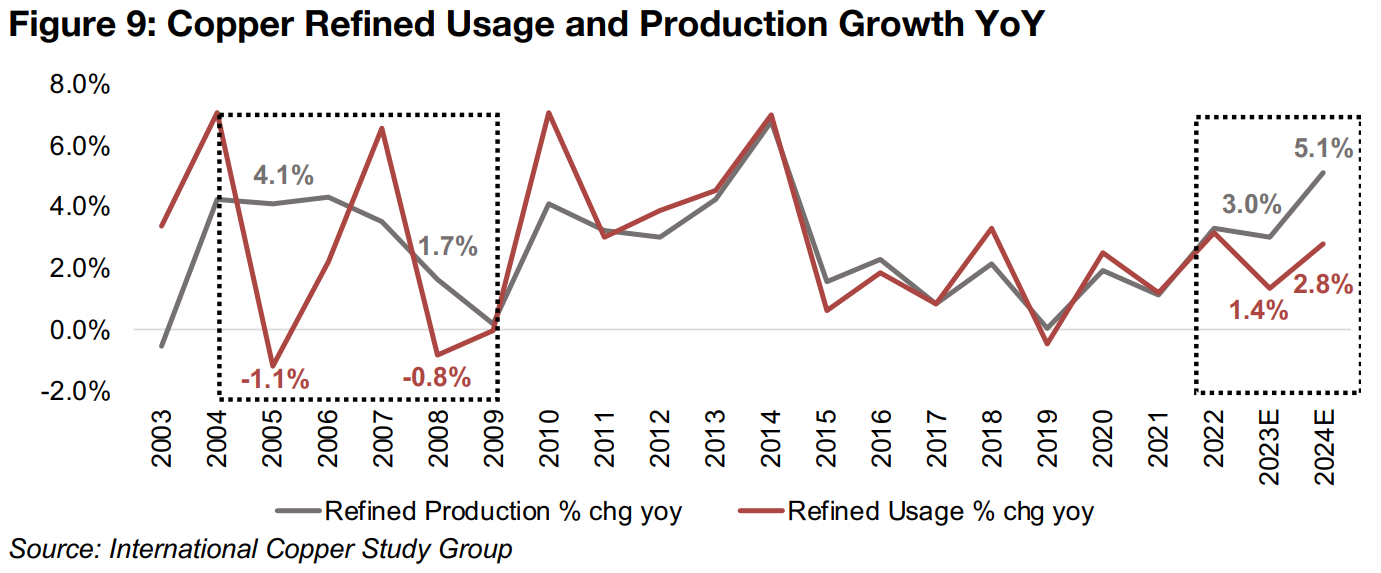
This is expected to be driven by an 3.0% increase in refined production, outpacing
the 1.4% growth in refined copper usage (Figure 9). The ICSG then expects a
substantial surplus of 590k tonnes by 2024E, with refined production spiking 5.1%,
its highest growth since 2014, but refined usage rising just 2.8%. A copper market
surplus has been rare over the last twenty years and not occurred at all for over a
decade, with a deficit every year from 2010 to 2022, averaging 287k tonnes, with the
last significant surpluses in 2006 and in 2008-2009 during the global financial crisis.
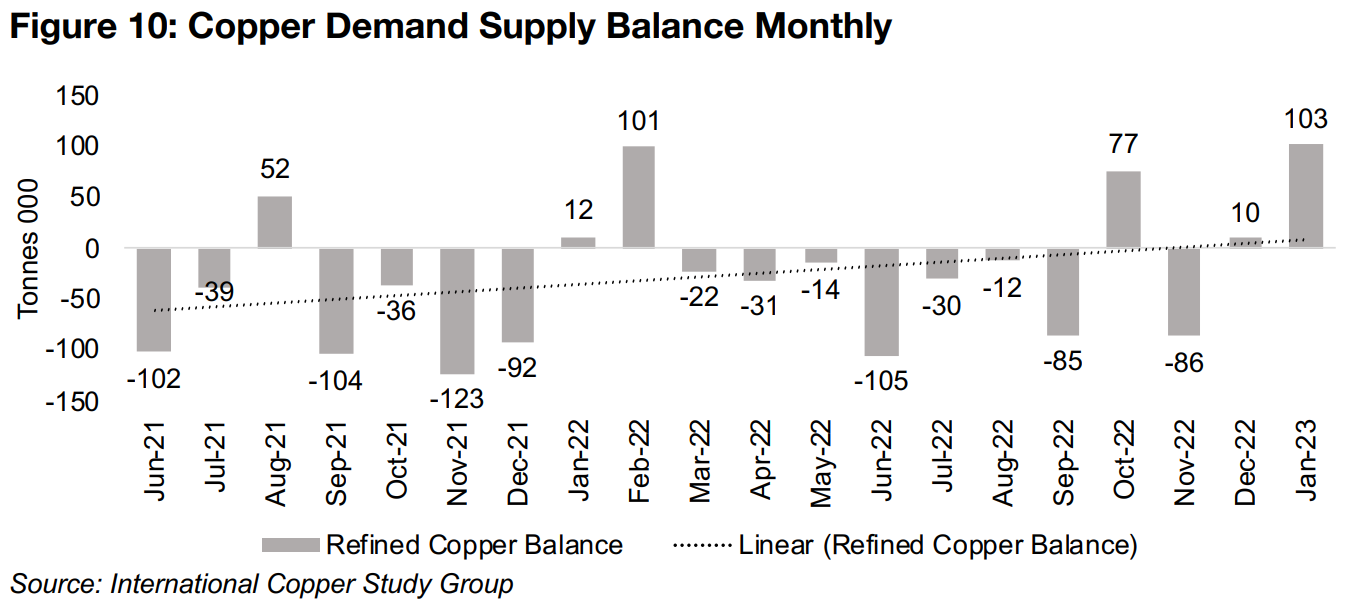
More recent trends in the copper demand supply balance are shown in Figure 10, with the trend line from June 2021 to January 2023 indicating a shift towards a surplus driven by large net supply especially in October 2022 and January 2023, and a nearly balanced market in December 2022. If this trend continues, as expected by ICSG, it could continue to add to downward pressure on the copper price, and drive more of a spread with gold and silver, which continue to be propelled by surging global risks.
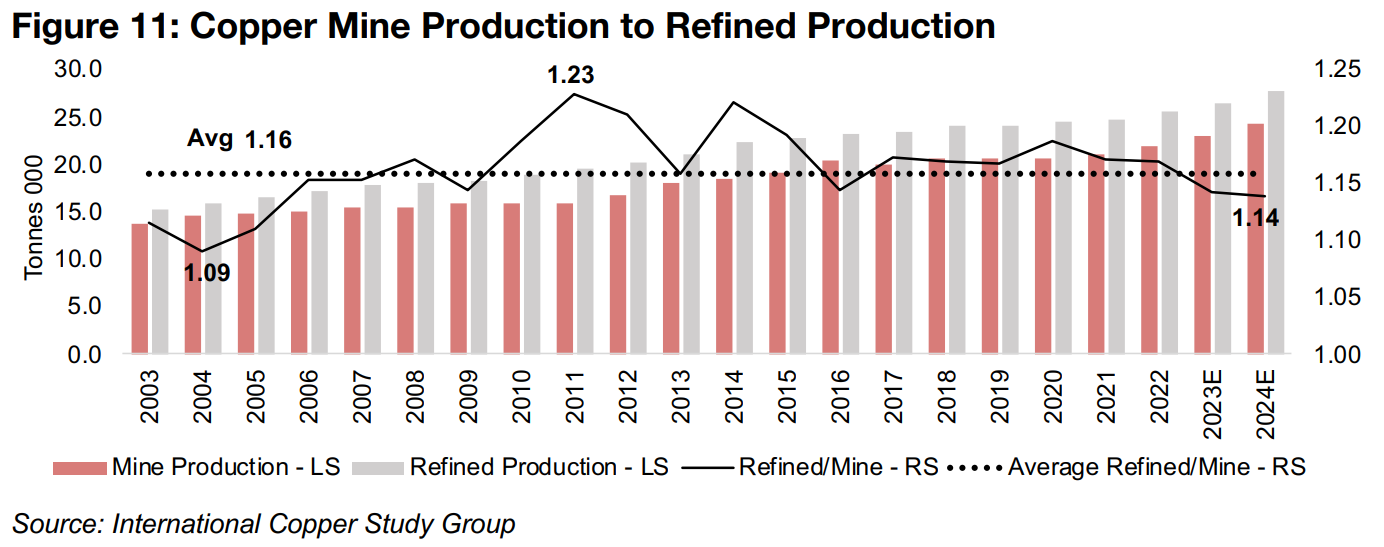
While copper mine production is the key underlying driver of supply, it still needs to be refined, and this refined supply is the measure used above to compare to refined usage. The ICSG provides forecasts for both, so we can see how underlying mined production translates into end-use copper. On average, refined production has been about 1.16x the level of mined production over the past twenty years, with a low of 1.09x in 2004, and a high of 1.23x in 2011 (Figure 11). The ICSG expects the ratio to slide moderately below the 1.16x average to 1.14x in both 2023E and 2024E as the large new supply drives up utilization rates of copper smelters.
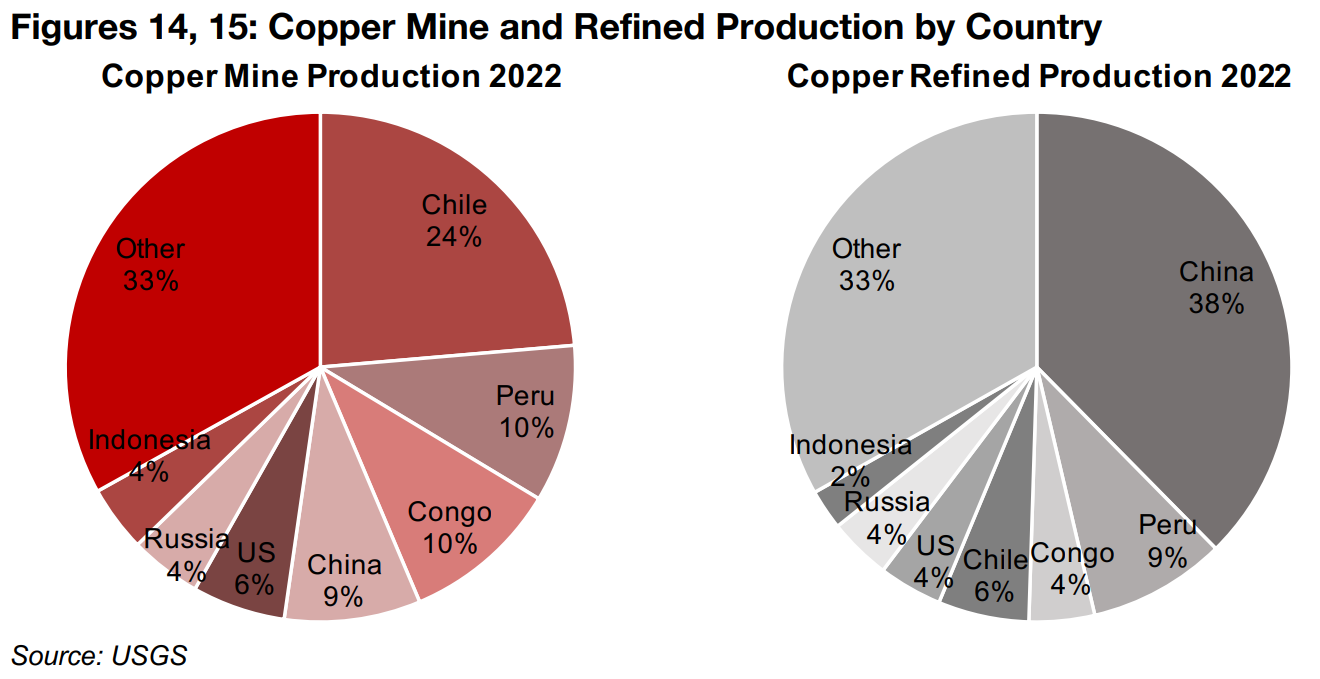
Copper mine production is concentrated especially in Latin America, with output forecast at 9.3 mn tonnes in 2023E or 40.1% of the total (Figure 12) with the region also expected to have the highest growth, up 8.7%. This comes mostly from Chile and Peru, which accounted for 23.6% and 10.0% of total production in 2022, according to the USGS (Figure 14). The second largest producer is Africa, at 3.5 mn tonnes in 2023E or 15.1% of the total, with growth expected at 7.7% and the output mostly coming from Congo, which was 10% of copper supply in 2022.
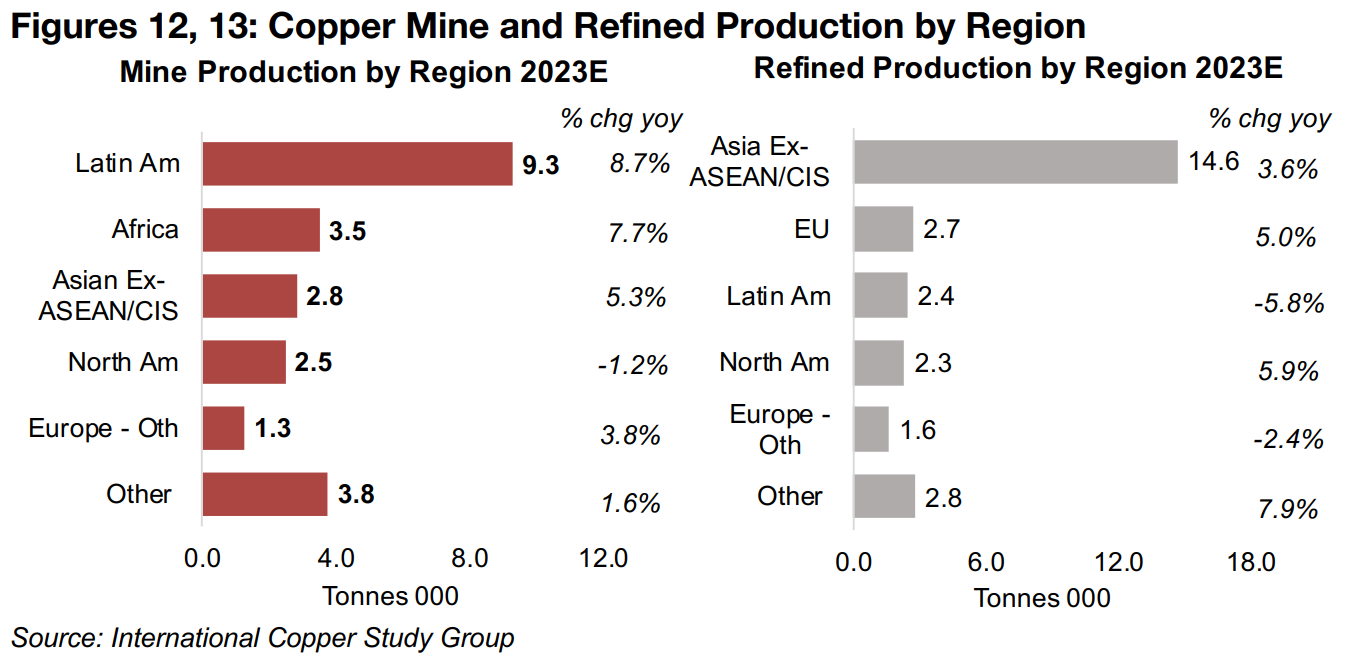
The third largest region is Asia excluding ASEAN (nations in Southeast Asia) and CIS
(nations formerly comprising the Soviet Union) at 2.8 mn tonnes, or 12.2% of the total,
growing at a relatively rapid 5.3%, mostly coming from China, at 9% of total
production. North America is 10.7% of the total, mostly from the US, and is expected
to contract -1.2%, while 'Other Europe,' or production outside the EU, is 5.5% of the
total, mainly from Serbia, and expected to grow 3.8% in 2023E. Production from the
rest of the world is 16.3% of the total and expected to grow a moderate 1.5%.
Refined copper supply is dominated by Asia excluding ASEAN and CIS (Figure 13),
which is expected to account for 55% of the total in 2023E and grow 3.6%, coming
mainly from China (Figure 15). The next three largest players are at similar levels, with
the EU, Latin America and Africa at 10.2%, 10.0% and 8.4% of the total and with
3.6%, 5.0% and -5.8% growth forecast, respectively. The rest of the world accounts
for just 16.5% of refined copper output and is expected to grow rapidly at 7.9%.
The ICSG forecasts raises the question of how long any potential surplus would last, and how this could affect the copper price, with the market tending to weight most highly expectations from the next twelve to eighteen months in their price estimates. Long-term forecasts from the International Energy Agency (IEA) offer some insight, based on supply from both operating mines and those under construction, and demand under two scenarios, one using current stated government policies, and another a sustainable development scenario with a more rapid shift to green energy, increasing copper demand substantially.
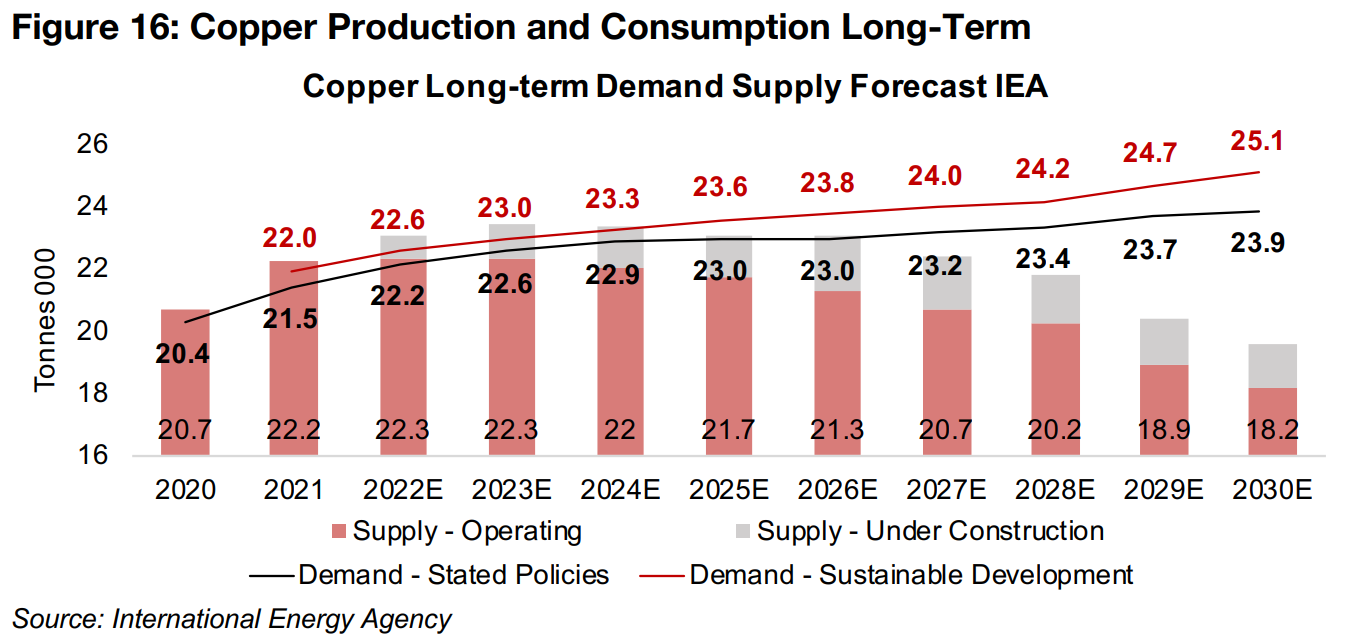
Based on these forecasts, using the more conservative 'stated policies' scenario, and including new supply under construction, copper supply is expected to outstrip demand significantly through to 2024E (Figure 16). The IEA expects a roughly balanced market from 2025E and 2026E and a shift into a substantial deficit only by 2027E, which is expected to widen to a severe level by 2030E. However, if we were to account for downside to demand from a recession in the near-term, there is a reasonable probability of a large surplus as far as three years out, which would be likely to put pressure on the current copper price. While the 'sustainable demand' scenario would see a deficit much earlier, by 2025E, this would require some major policy shifts that might not actually be realized that quickly.
Overall, given the forecasts of the ICSG and the IEA, with very strong supply growth likely especially into 2024E, and the potential for a slide into a global recession that could hit demand, there is potential for continued downward pressure on the copper price this year. While this fundamental underlying price could certainly weigh on the TSXV copper stocks overall, as ever, company specific drivers, especially strong drill results, still remain critical, and if strong enough, can offset broader macro pressures.
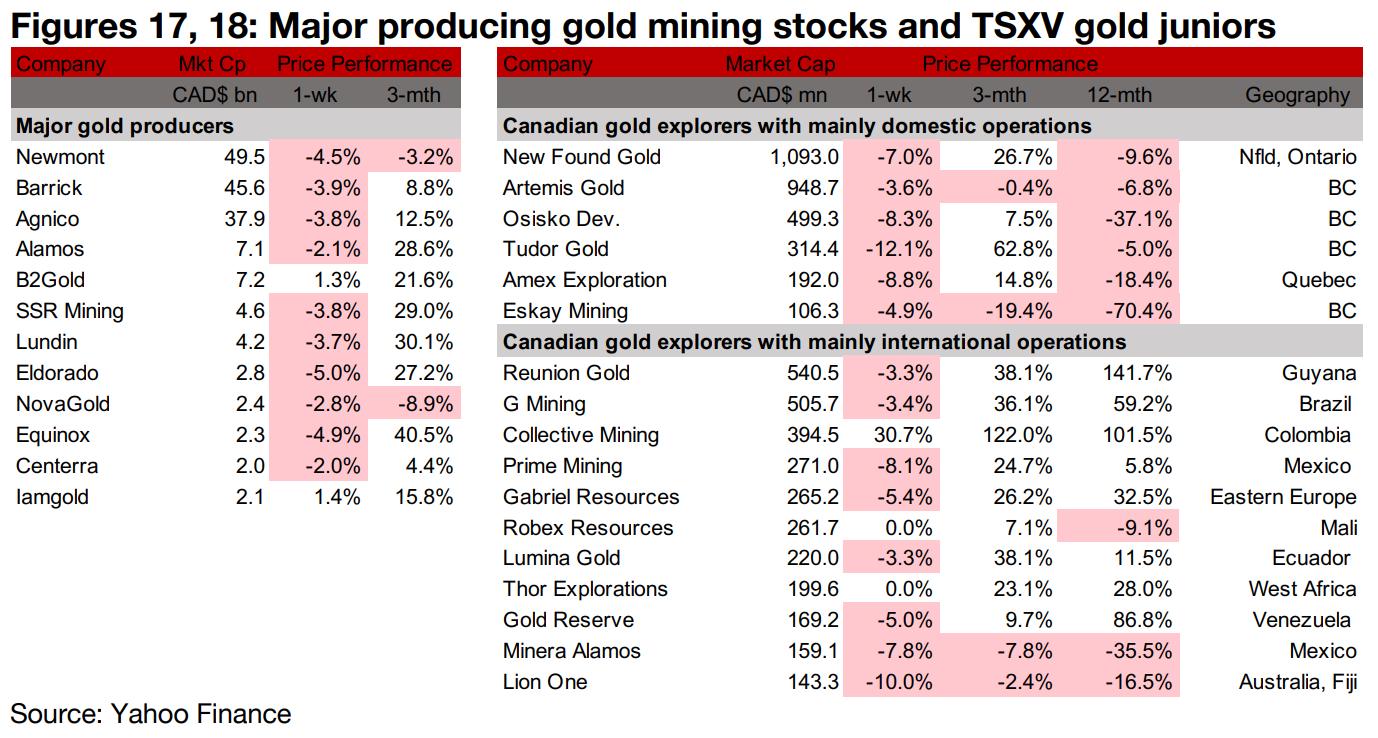
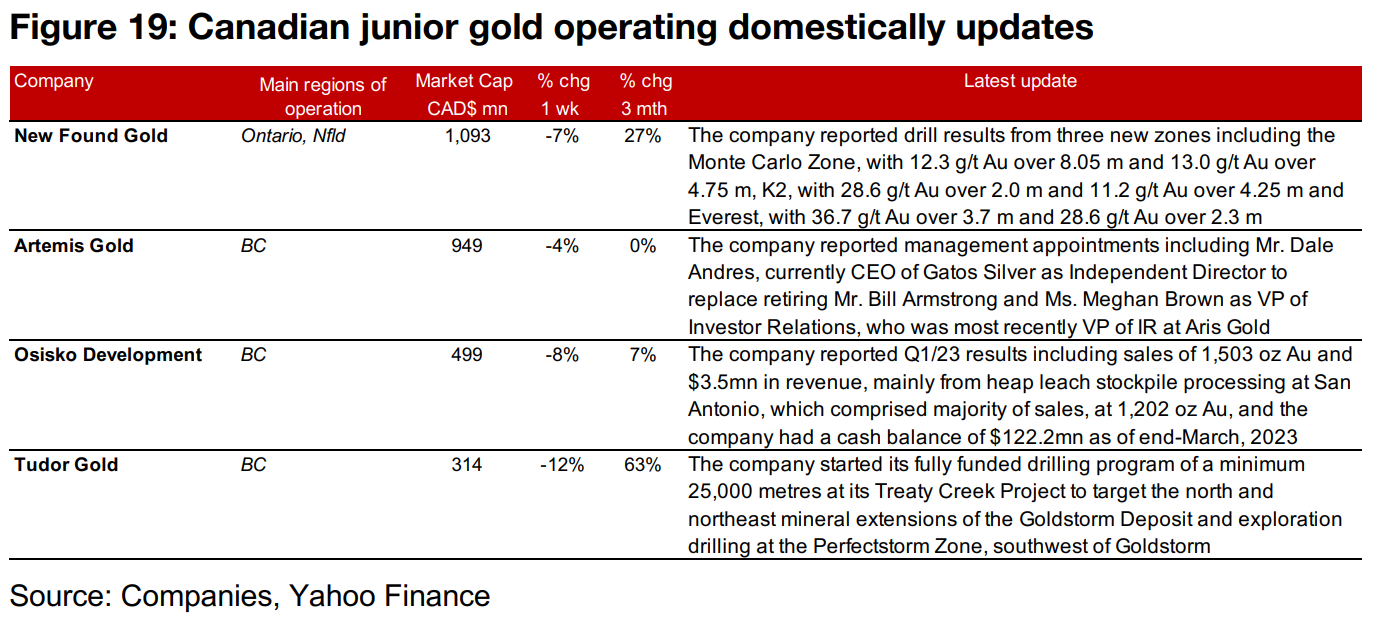
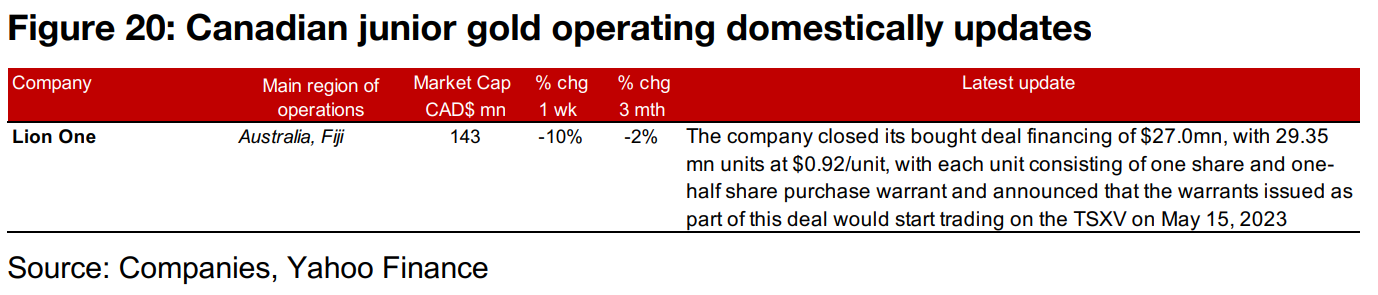
The gold producers and large TSXV gold were mostly down as the gold price and equity markets were nearly flat (Figures 17, 18). For the Canadian gold juniors operating mainly domestically, New Found Gold reported drill results from three new zones, Artemis Gold announced new management appointments, Osisko Development released Q1/23 results and Tudor Gold started its drill program at Treaty Creek (Figure 19). For the Canadian gold juniors operating mainly internationally, Lion One closed its $27.0mn financing (Figure 20).
Disclaimer: This report is for informational use only and should not be used an alternative to the financial and legal advice of a qualified professional in business planning and investment. We do not represent that forecasts in this report will lead to a specific outcome or result, and are not liable in the event of any business action taken in whole or in part as a result of the contents of this report.
Author
Ben McGregor authors the Weekly Roundup at CanadianMiningReport.com, providing sharp analysis of the metals and mining sector. With a talent for spotting trends, Ben distills complex market shifts into clear, engaging insights on TSXV junior miners. His weekly updates cover gold, copper, uranium, and more, blending data-driven perspectives with a knack for identifying opportunities. A vital resource for investors, Ben’s work navigates the dynamic junior mining landscape with precision.