

September 14, 2026
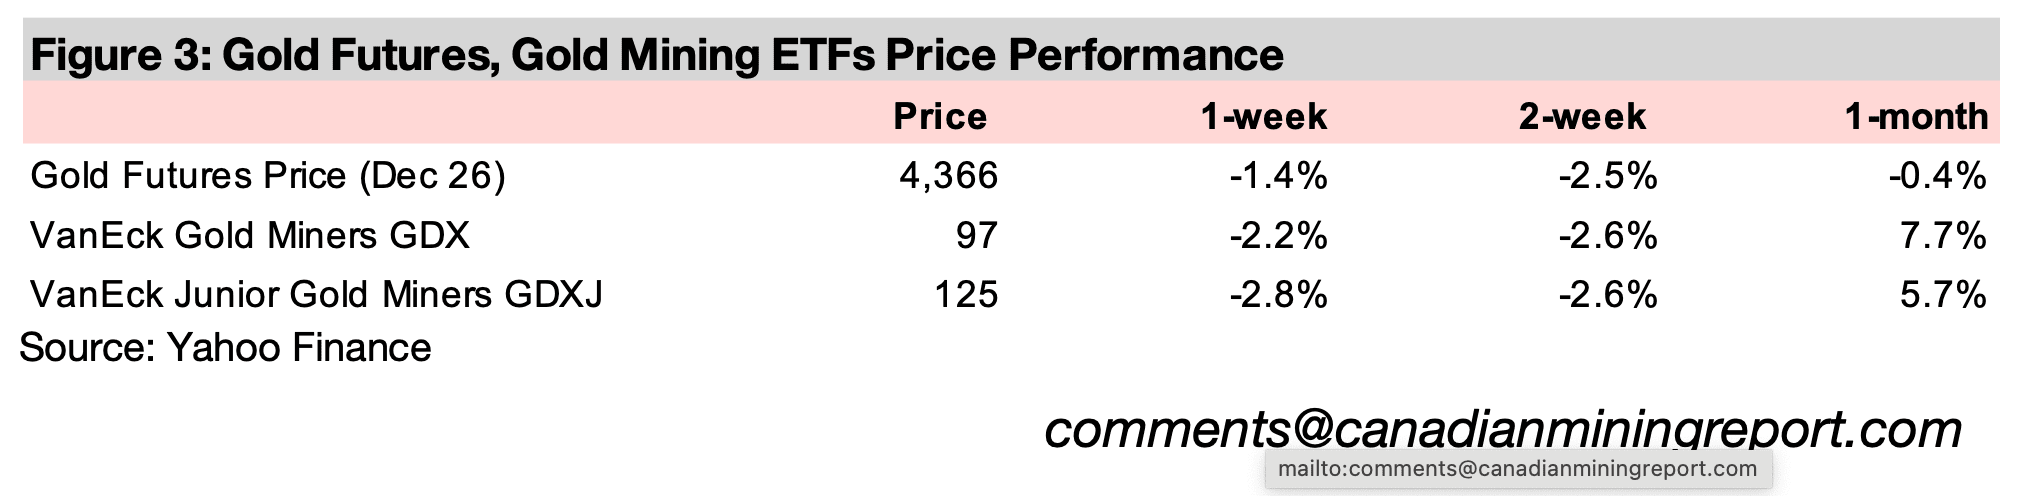
The gold price was down -1.4% to US$4,366/oz as US inflation was high but inline with expectations and oil prices jumped, implying cost pressures could continue, increasing the probability that the Fed will hike rates this week to near certainty.
The copper price slumped after reaching all-time highs earlier in the week, on news that the US government may be wavering on applying further tariffs on the metal, which have already created a huge imbalance in global inventories.
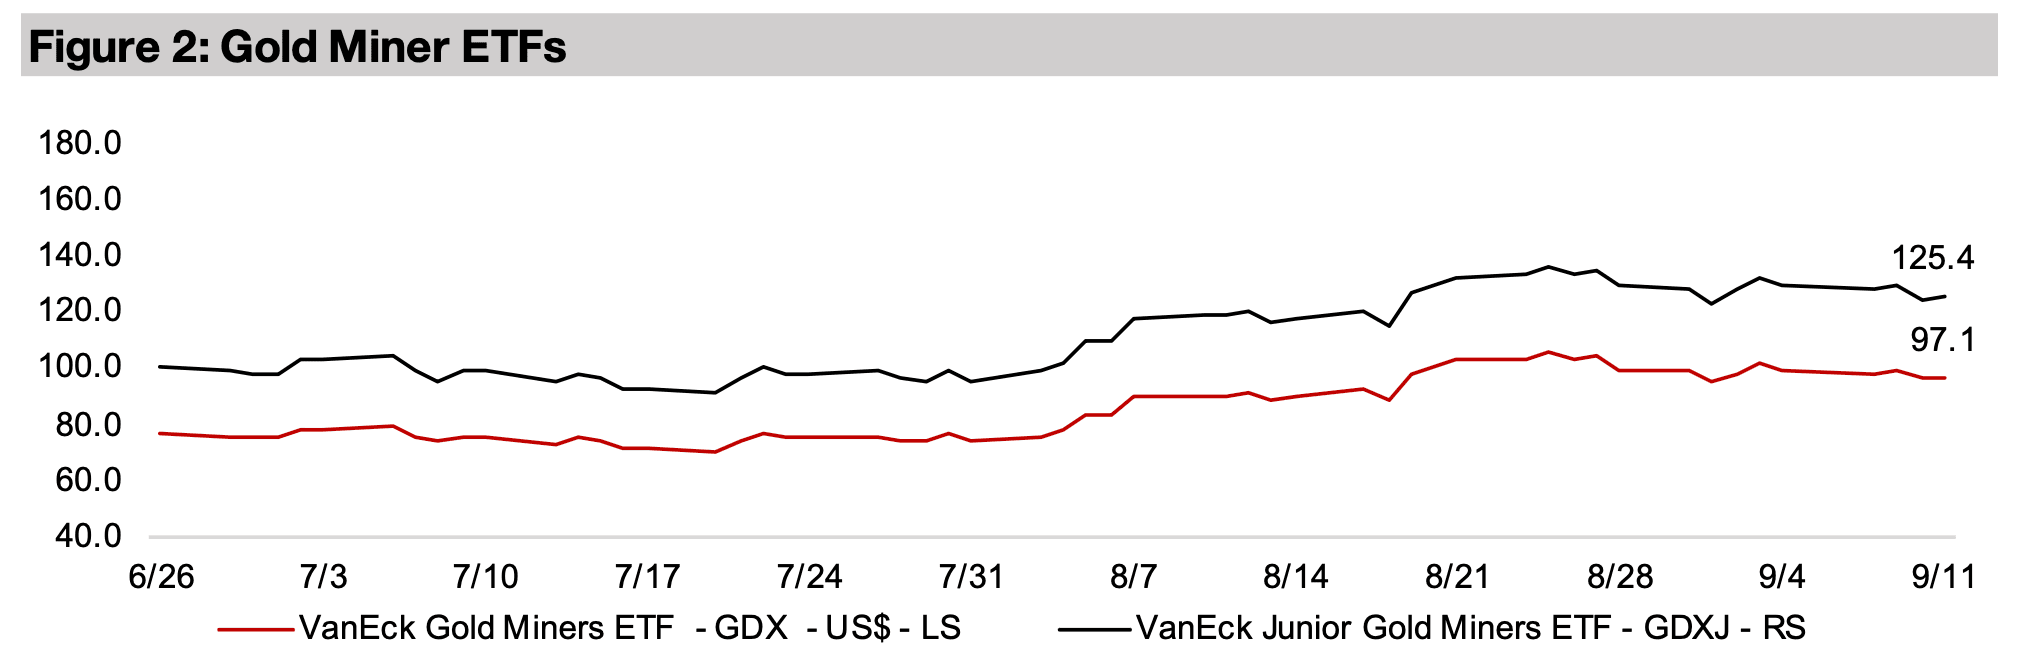
The gold stocks declined, with the GDX down -2.2% and the GDXJ losing -2.8%, underperforming the drop in equities markets, with the S&P 500 down -1.4%, the Nasdaq losing -0.6% and the Russell 2000 small cap index sliding -1.8%.


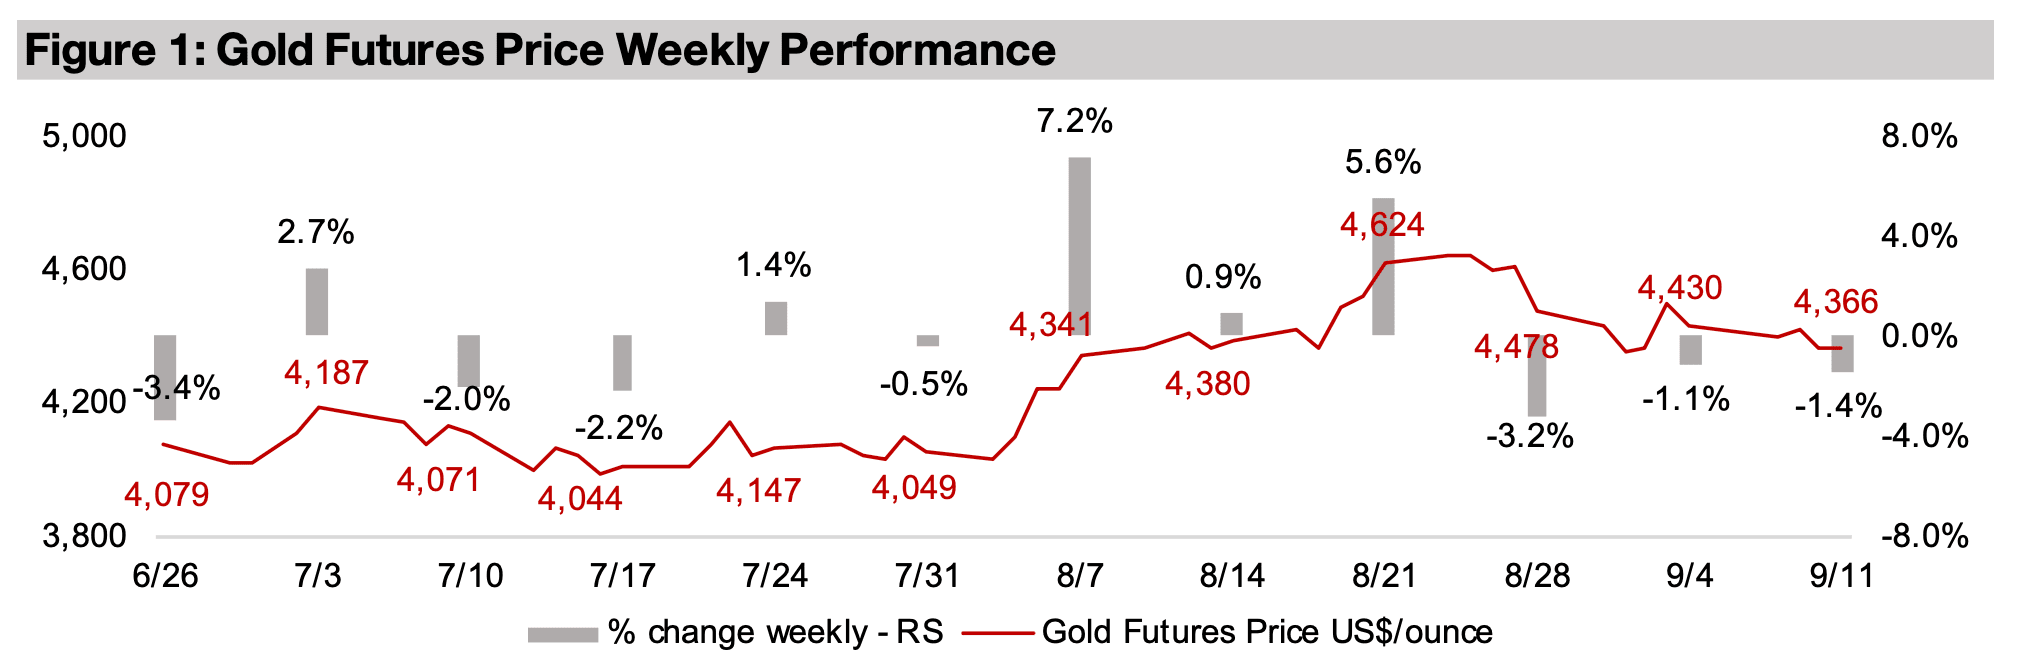
The gold price declined -1.4% to US$4,366/oz, easing for a second week, as US
inflation remained relatively high and there was a jump in oil, indicating that prices
have remained elevated and could again trend up on high energy costs. The inflation
report was viewed as particularly important by markets as it was some of the last
major data points to be incorporated into the US Fed’s upcoming rate decision this
week. The US CPI in August 2026 rose slightly to 3.35% from 3.30% in July 2026,
while core inflation dropped marginally to 2.45% from 2.47% over the same two
periods. While both were inline with consensus estimates and not a major shock, they
still remain well above the US Fed’s 2.0% target.
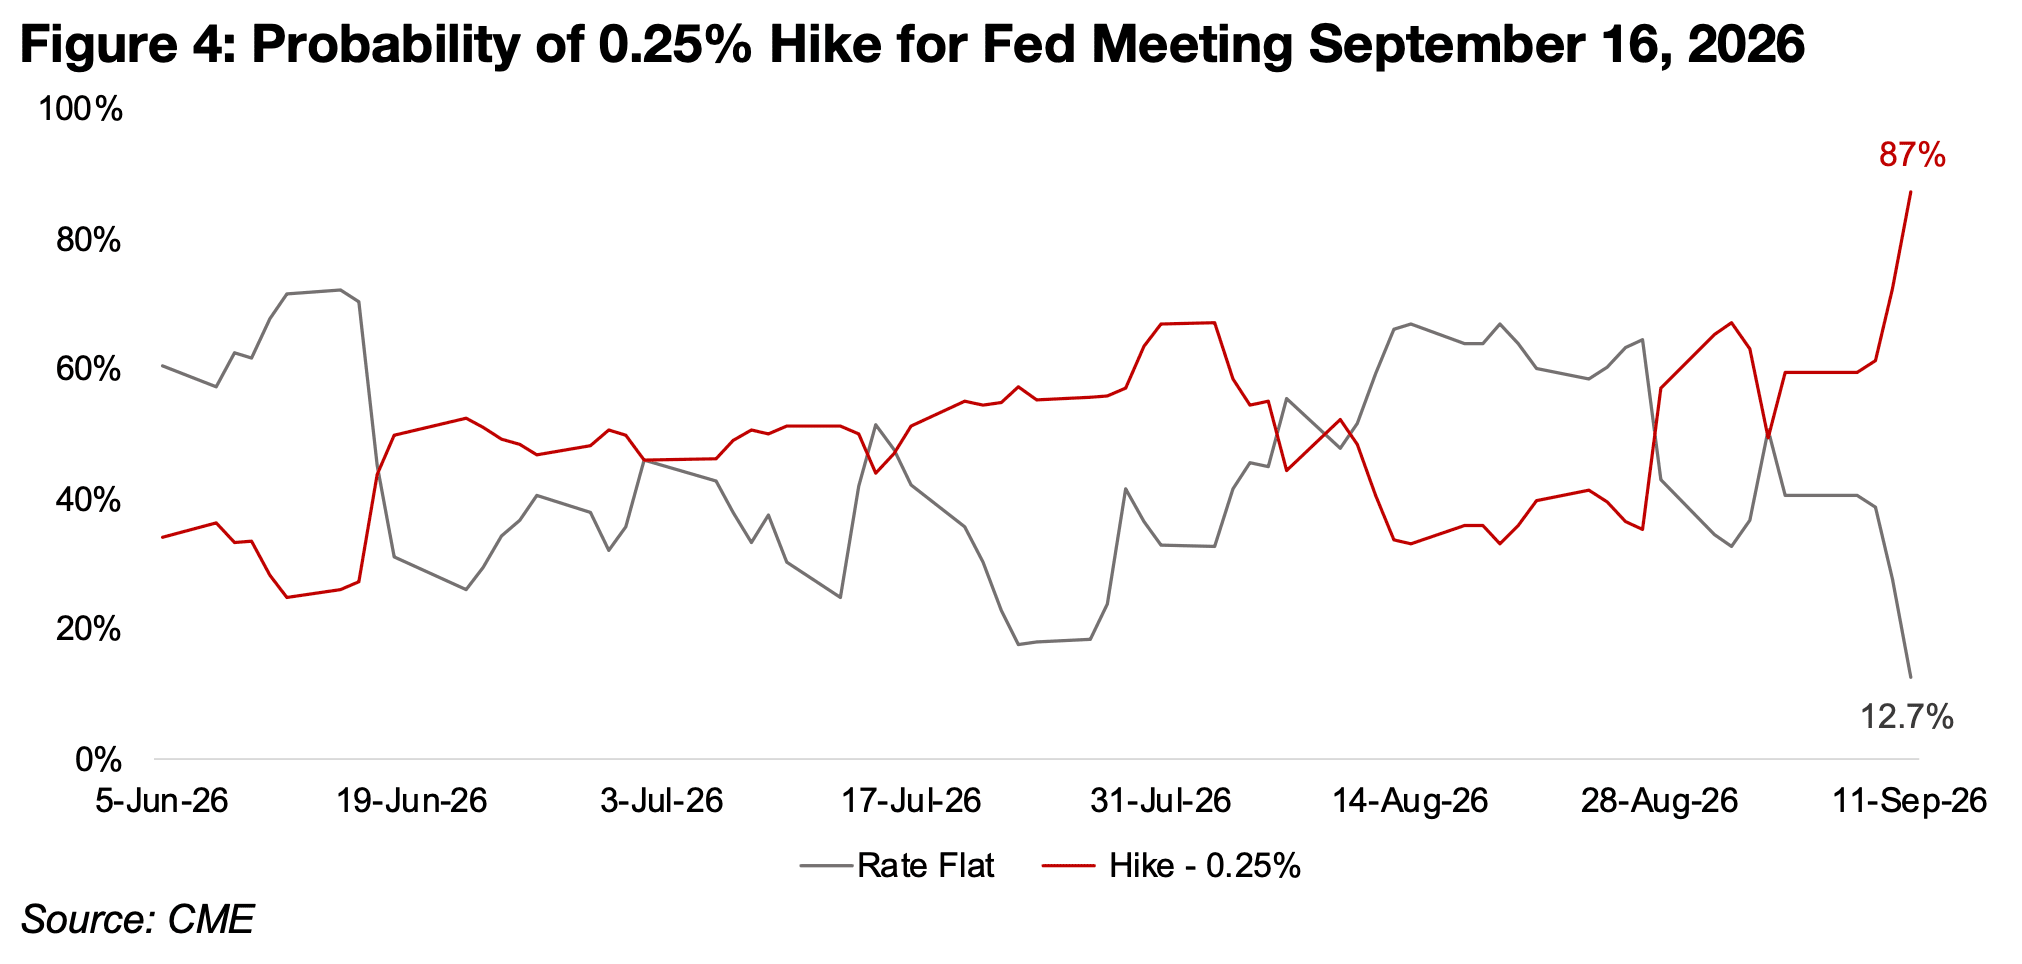
The market now sees a rate hike this week as quite certain at 86.5%, with only a 13.5%
probability that rates will remain flat, which has shot up from just 59.4% a week ago,
and is up from just 33.0% at the most recent lows on August 14, 2026 (Figure 4). With
the potential for higher US rates also implying higher real yields and a stronger dollar,
which tend to move inversely to the gold price, the metal was dragged down.
However, that it was not a severe down move indicates that there offsetting factors
still supporting gold, which likely include still very high geopolitical and economic risk,
especially with the spiking oil price.
All the major metals declined, with other precious metals likely also down on monetary factors similar to gold, and base metals hit by the potential that higher rates and oil prices could dampen global economy activity (Figure 5). The decline in palladium by -5.9% was an outlier, with it pressured, along with platinum, from lower vehicles sales forecasts, as autocatalysts are the largest source of demand for both metals. However, US warehouse stocks for platinum have declined substantially this year, but risen for palladium, suggesting weaker demand for the latter metal.
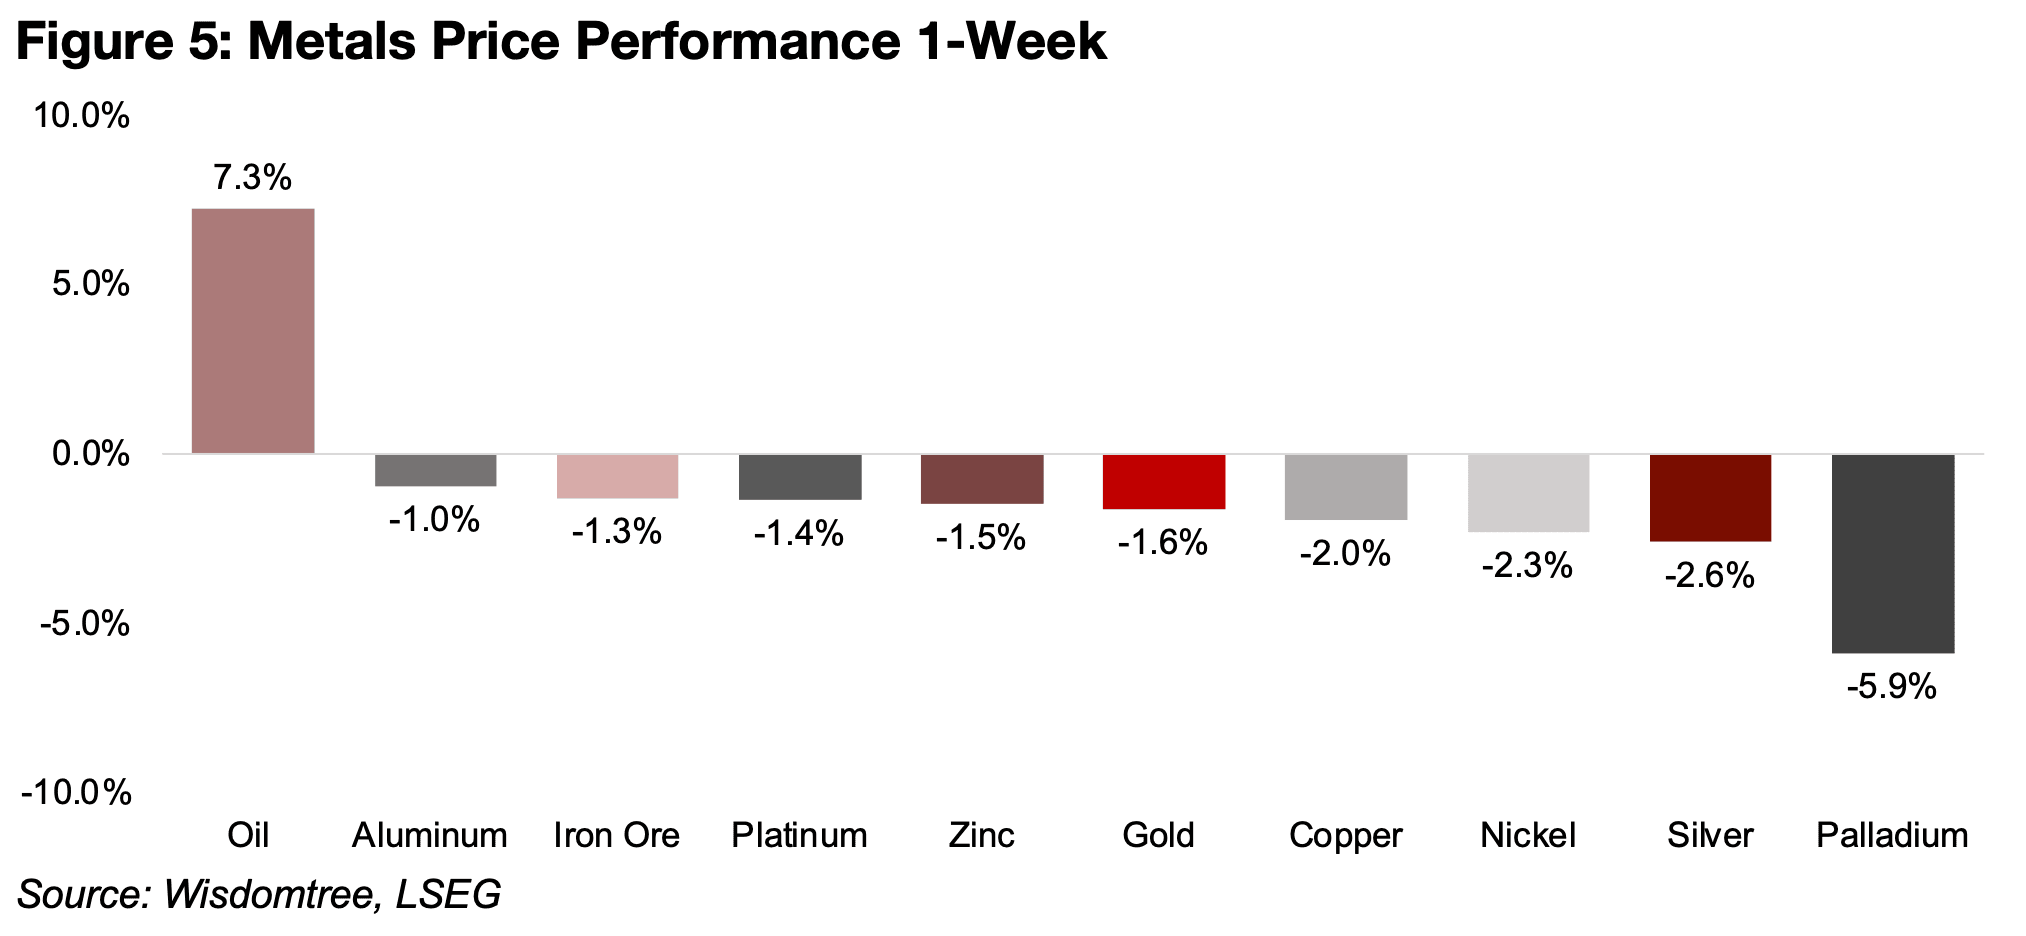
The equities market declined overall with the S&P 500 falling -1.4%, the Nasdaq dropping -0.6% and the Russell 2000 down -1.8% on the increased probability of higher interest rates. Gold stocks underperformed, with the GDX down -2.2% and GDXJ off -2.8%. The clear outlier to the upside was oil, with the price ETF jumping 7.3% after comments from the US president that he was not currently pursuing a deal with Iran and expected that energy costs would remain elevated.
High oil prices are starting to look chronic and hopes from earlier this year that the Middle East conflict would be short are fading. While larger scale attacks with severe damage have been reduced in recent months, there are still smaller scale operations ongoing from both sides targeting key infrastructure. This military conflict and the Russia-Ukraine war have substantially reduced global oil supply this year.
While this has driven many major oil consuming countries to release substantial
supply from their oil stocks to try to counteract this, this has seen reserves plunge for
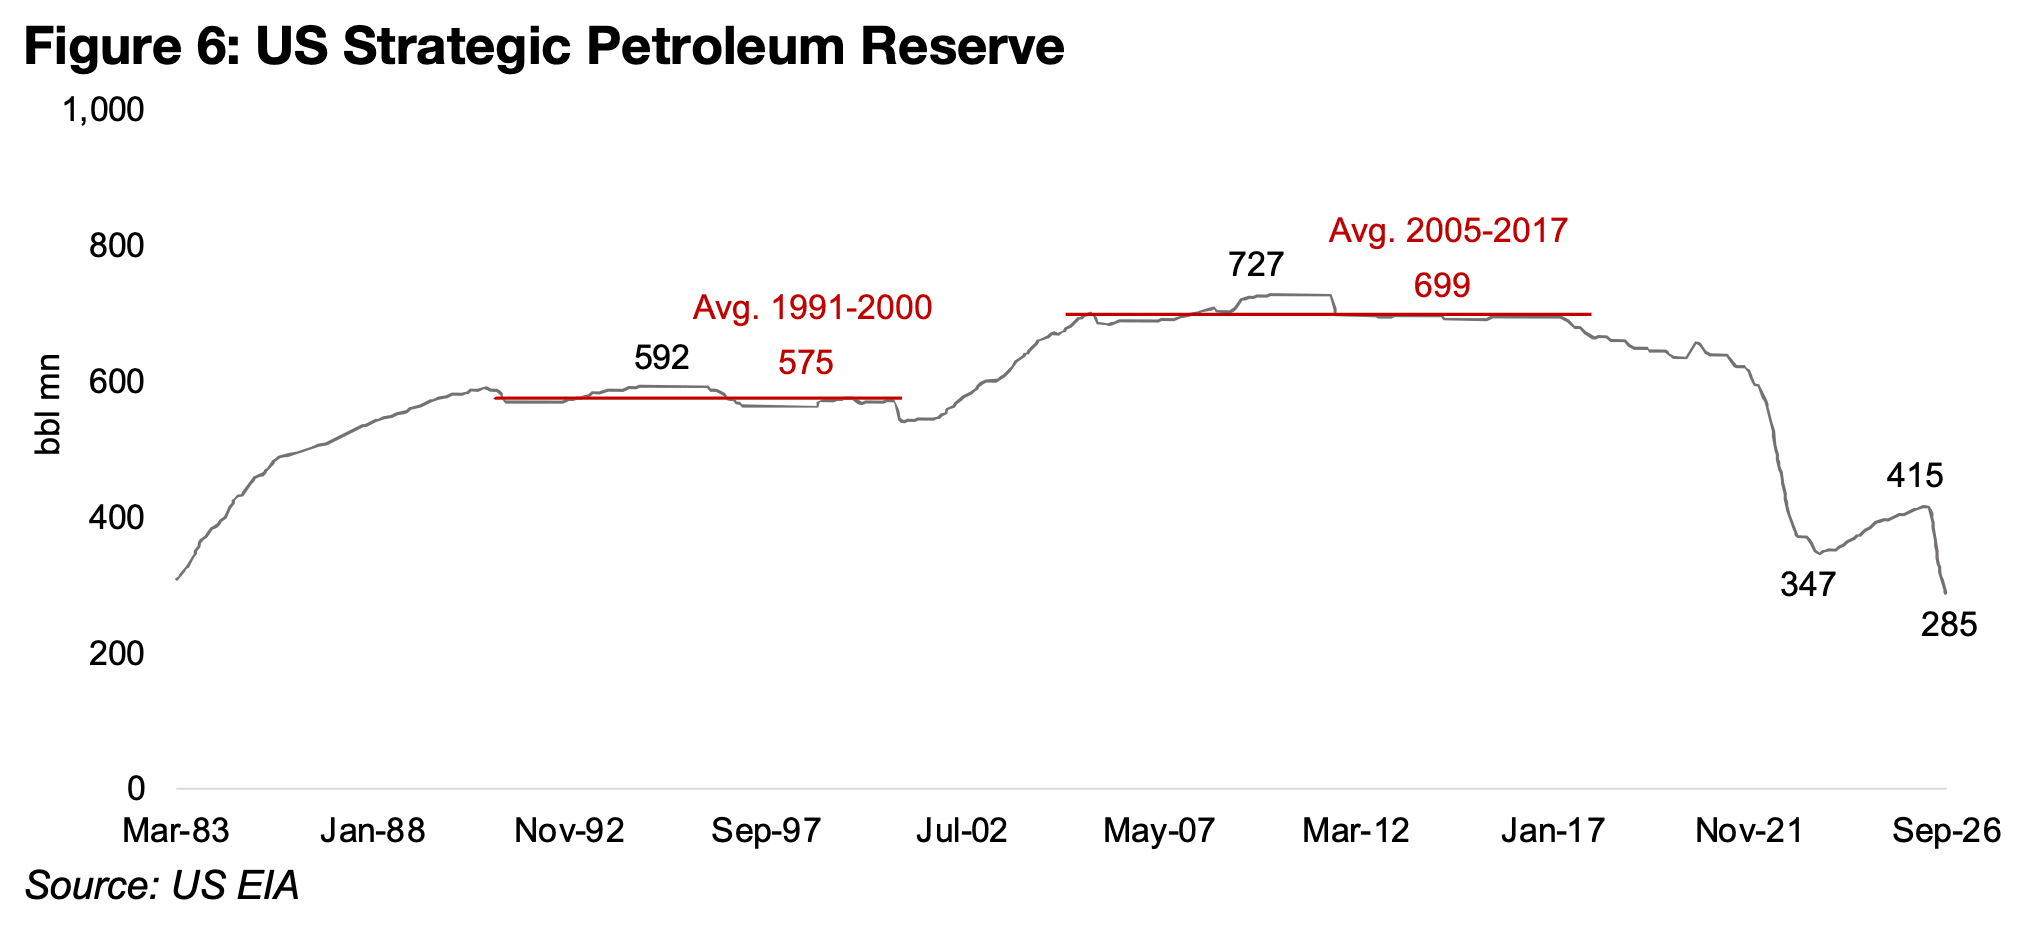
some, but still not offset the overall decline in output. The US petroleum reserve has
reached just 285mn barrels, the lowest since 1982, and off its highs from 2005 to
2017 where it averaged 699 mn barrels (Figure 6). While reserves had declined from
2021 through to the previous lows at 347 mn barrels in July 2023, they had been
rebuilt to 415 mn barrels as of January 2026 before the plunge this year.
China has by far the largest strategic petroleum reserve globally, estimated at 1.3-1.4
bn barrels, or almost five times the current US reserve, and around twice even its
2005-2017 peak. While China does not have regular updates on its petroleum reserve
levels, they are estimated to have only declined slightly this year, even as oil imports
plunged. The country slashed production at refineries to curb the demand for oil
imports and then cut exports of refined products to meet local demand, with the net
effect being only limited pressure on its reserves.
While the US previously had the second largest reserve, after the major decline,
Japan has risen to number two, at 360mn barrels, even after a -19.7% slump from
448 mn barrels in December 2025. However, as Japan imports almost all its crude
and is a net importer of refined products, reserve depletion issue is a more critical
than for China or the US. While both these countries are net crude oil importers, they
have substantial domestic production, and are net exporters of refined products and
have the option to reduce shipments to meet domestic demand, as China has done.
The major conflicts in the Middle East and Russia have seen huge declines in
production from many of the major global producers which has put further pressure
on supply. The outputs of several top ten global producers have declined
substantially, with production from Russia, Saudi Arabia, Iraq, Iran and Kuwait at 8.76
mn, 8.24 mn, 2.88 mn, 2.63 mn and 1.74 mn barrels in July 2026, down -0.8 mn, -
1.46 mn, -1.46 mn, -0.78 mn and -0.80 mn since December 2025.
The brent crude price is now at US$99.6/barrel, and the WTI price at US$99.9/barrel,
and investment banks are indicating that oil could reach as high as US$120-
US$150/bbl this year if these conflicts continue. The consensus for the average this
year is around US$80-US$90/bbl, and with Brent and WTI averaging US$92.6/bbl
and US$85.6/bbl so far this year, this would imply that oil prices would need to
average considerably below US$80/bbl in the fourth quarter to meet these targets.
Some in the market have noted that oil prices well above US$100/bbl will eventually
solve themselves, however, by causing global economic demand destruction, which
will reduce inflationary pressures. However, as this process can take considerable
time to have a substantial effect on oil prices, it is unlikely to drive a major reduction
in prices until well into next year, especially if the conflict in the Middle East persists.
While the copper price was down only 1.9% last week, this masked underlying volatility, with it first reaching all-time highs mid-week, but then slumping 4.9% in a single day. The rise in the price this year has been partly on high demand from the AI-driven tech boom, but there has been another huge driver since 2025, which has been expectations for a potential further rise in US copper tariffs. The big drop this week came from this second driver, with news that the U.S. could be wavering on the application of new tariffs on copper.
The country had originally indicated it could implement potential copper tariffs when
the new government that started in January 2025 began an investigation into copper
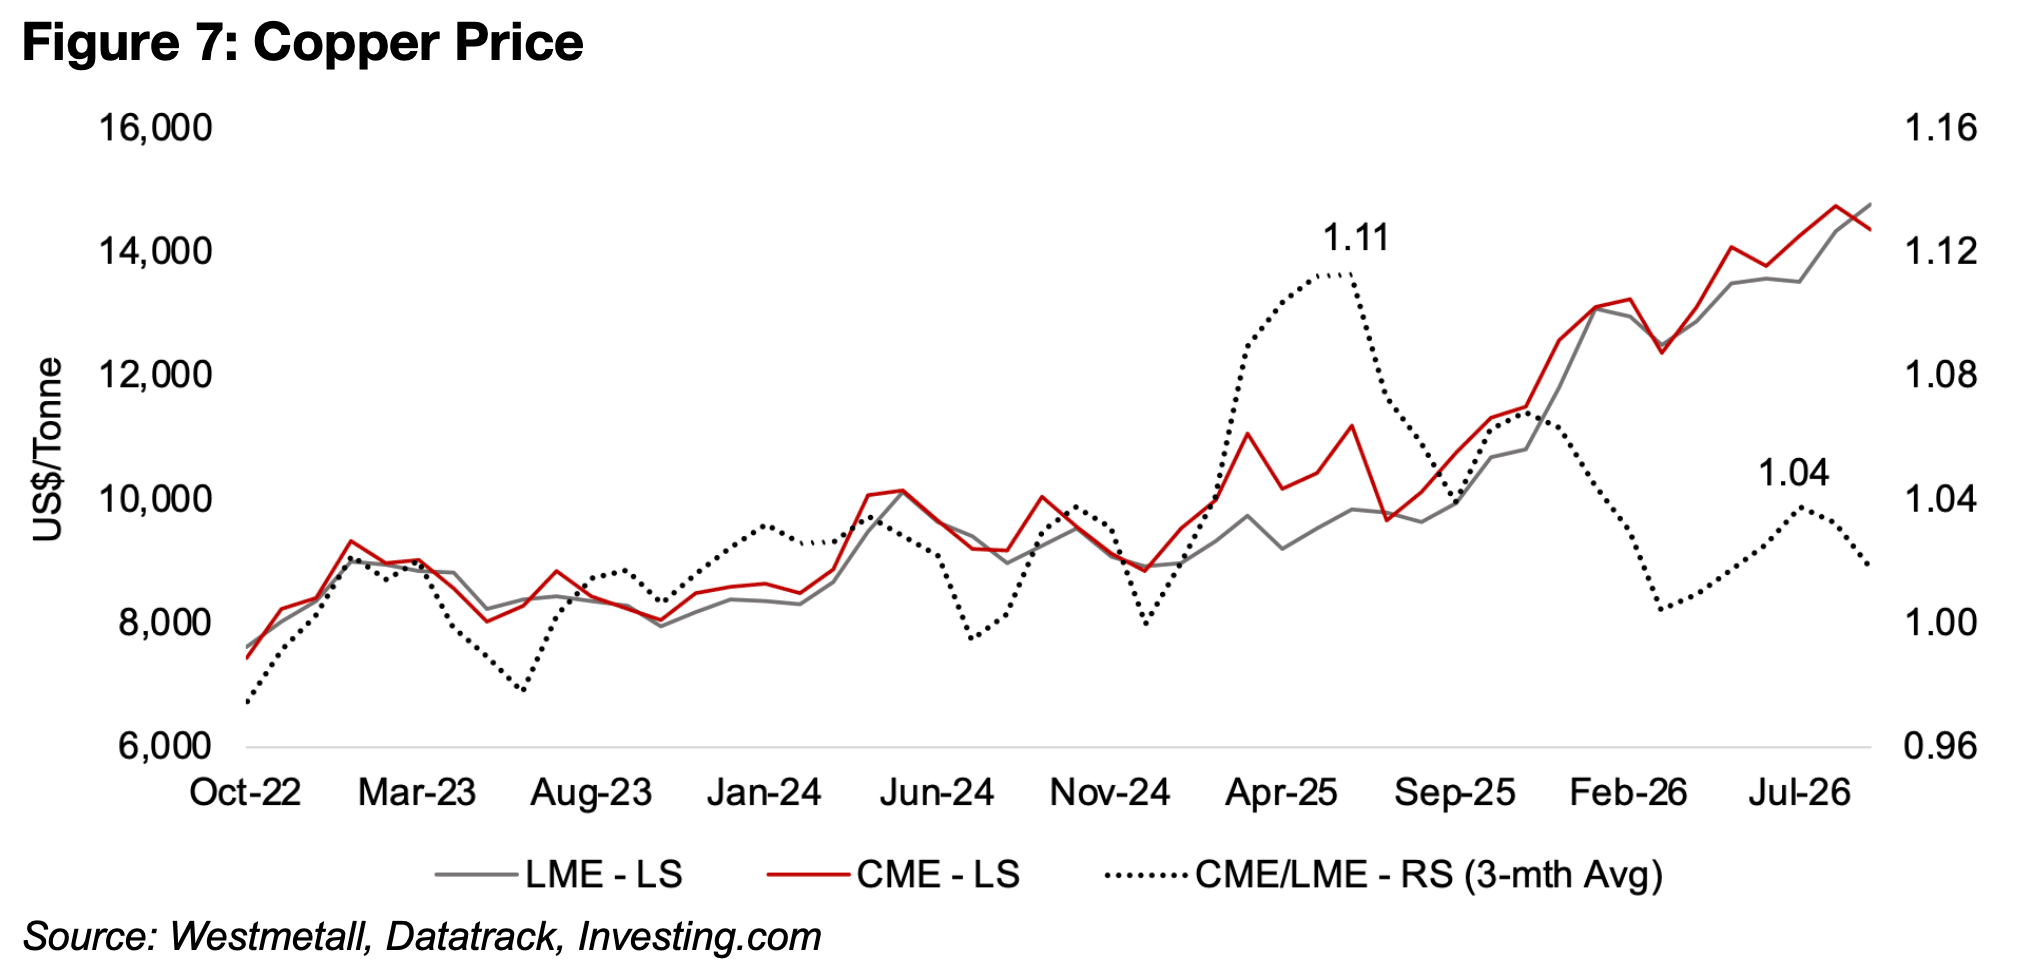
imports in February 2025. This led to a huge spread between the US CME and UK
LME prices for the metal by the middle of that year, with traders building up large
positions in the metal in the US in advance of the potential tariffs. The average
premium peaked in June 2025 with the average CME price 11.0% above the LME
price, far above the average of just 0.7% from 2022 to 2024.
However, with the announcement there would only be a 50% tariff applied to semifinished and derivative copper products on July 30, 2025, the spread plunged to just
4.0% by September 2025. While it rebounded somewhat to 7.0% by November 2025,
by March 2025 it had dropped again to zero, near the previous average. While it did
pick again through to July 2025, it reached only 4.0%, far below the highs last year,
as the US Commerce Department reported its recommendations to the government
as of the June 30, 2026 deadline. However, the government has not followed this up
with any actual announcement or action, which has left the markets unclear on the
situation so far this year. The reports this week were that the government was
considering not introducing boosting tariffs given rising US manufacturing costs.
Major purchases by US traders of copper have been consistent since the start of
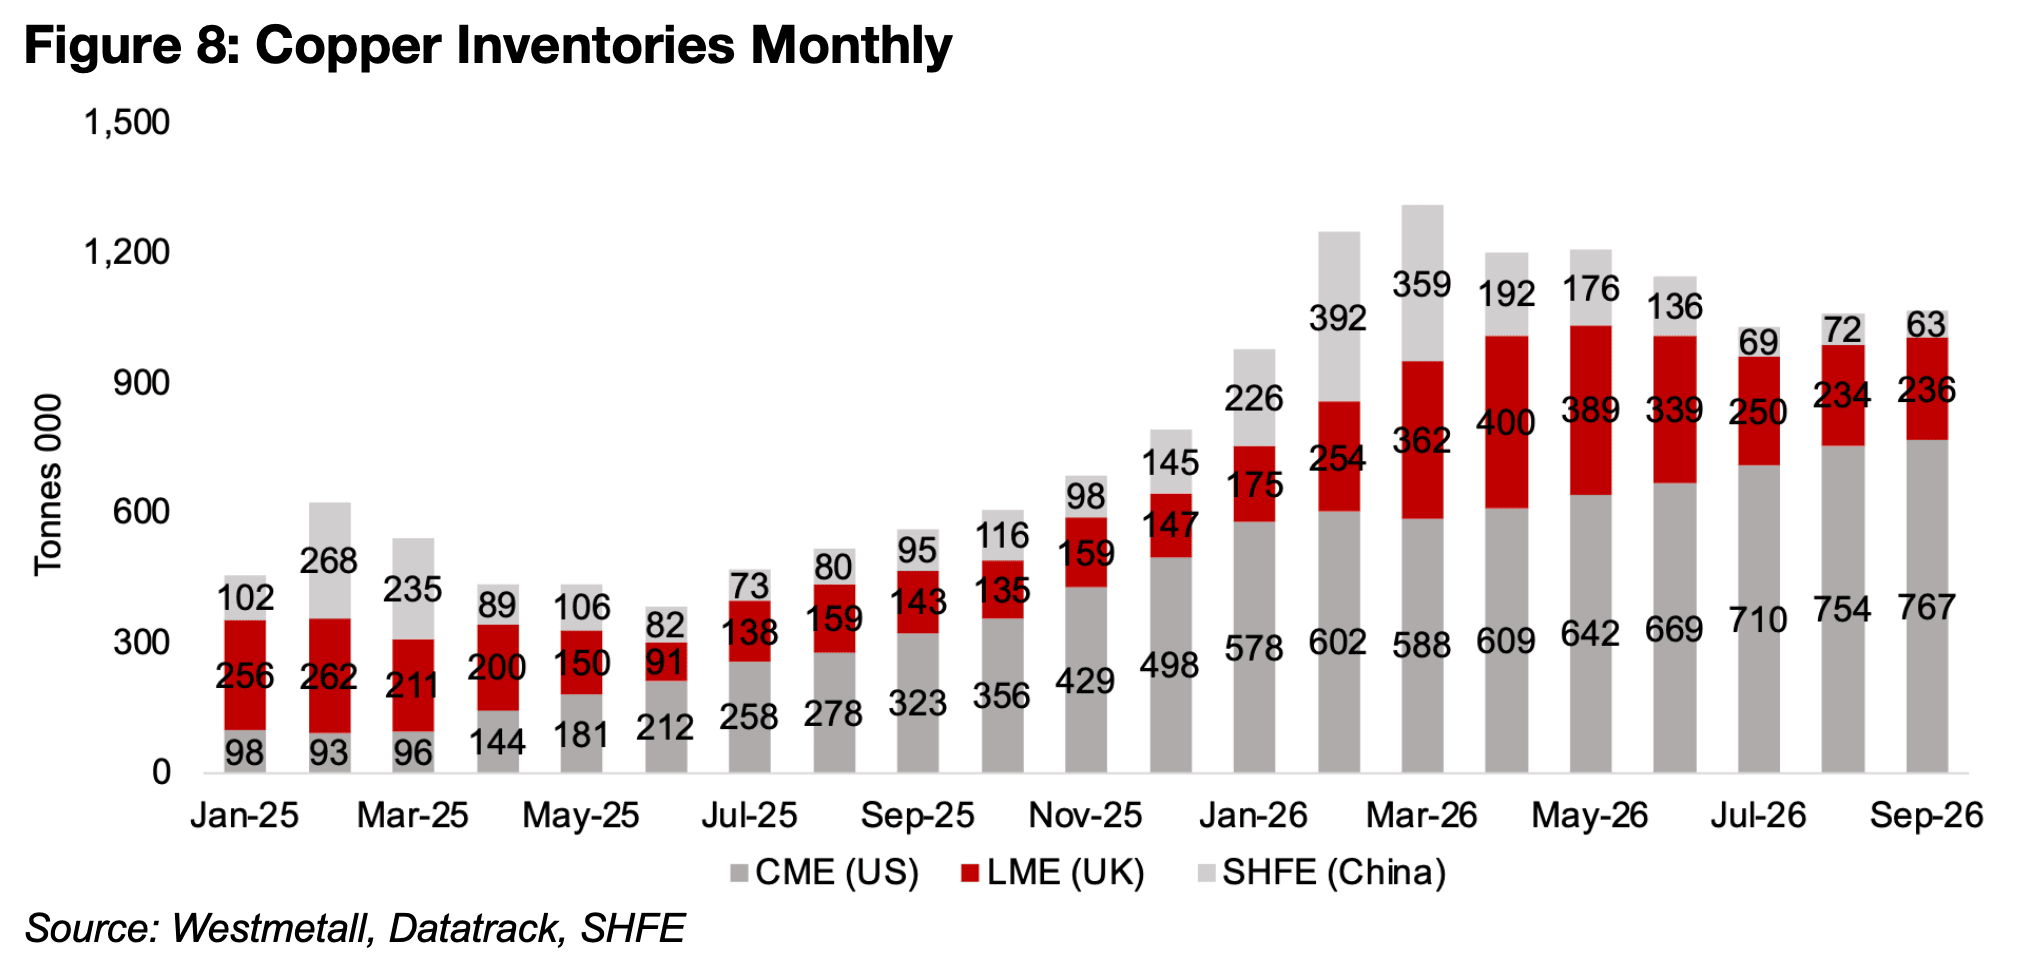
2025, seeing copper stocks at the CME warehouse surge to 767k tonnes, up from
just 98k tonnes in January 2025 (Figure 8). This has put major pressure on the copper
warehouse stocks at the both the LME and China’s SHFE, the two other leading
global holders of the metal. The reserves in these markets have been depleted twice
over the past two years to meet US demand, and caused substantial distortions in
inventories versus the historical standard.
In the build up to the original US decision on copper tariffs last year, stocks at the
LME and SHFE reached lows in June 2025 at 91k tonnes and 82k tonnes. However,
after the copper tariffs actually introduced were relatively mild, inventories gradually
rebuilt to a peak of 400k tonnes for the LME in April 2026 and to 392k tonnes in
February 2026 of the SHFE. However, stocks at both have declined again since, with
the SHFE down below the previous lows, at 63k tonnes, and for the LME decreasing
to 236k tonnes, down nearly half from the peak this year.
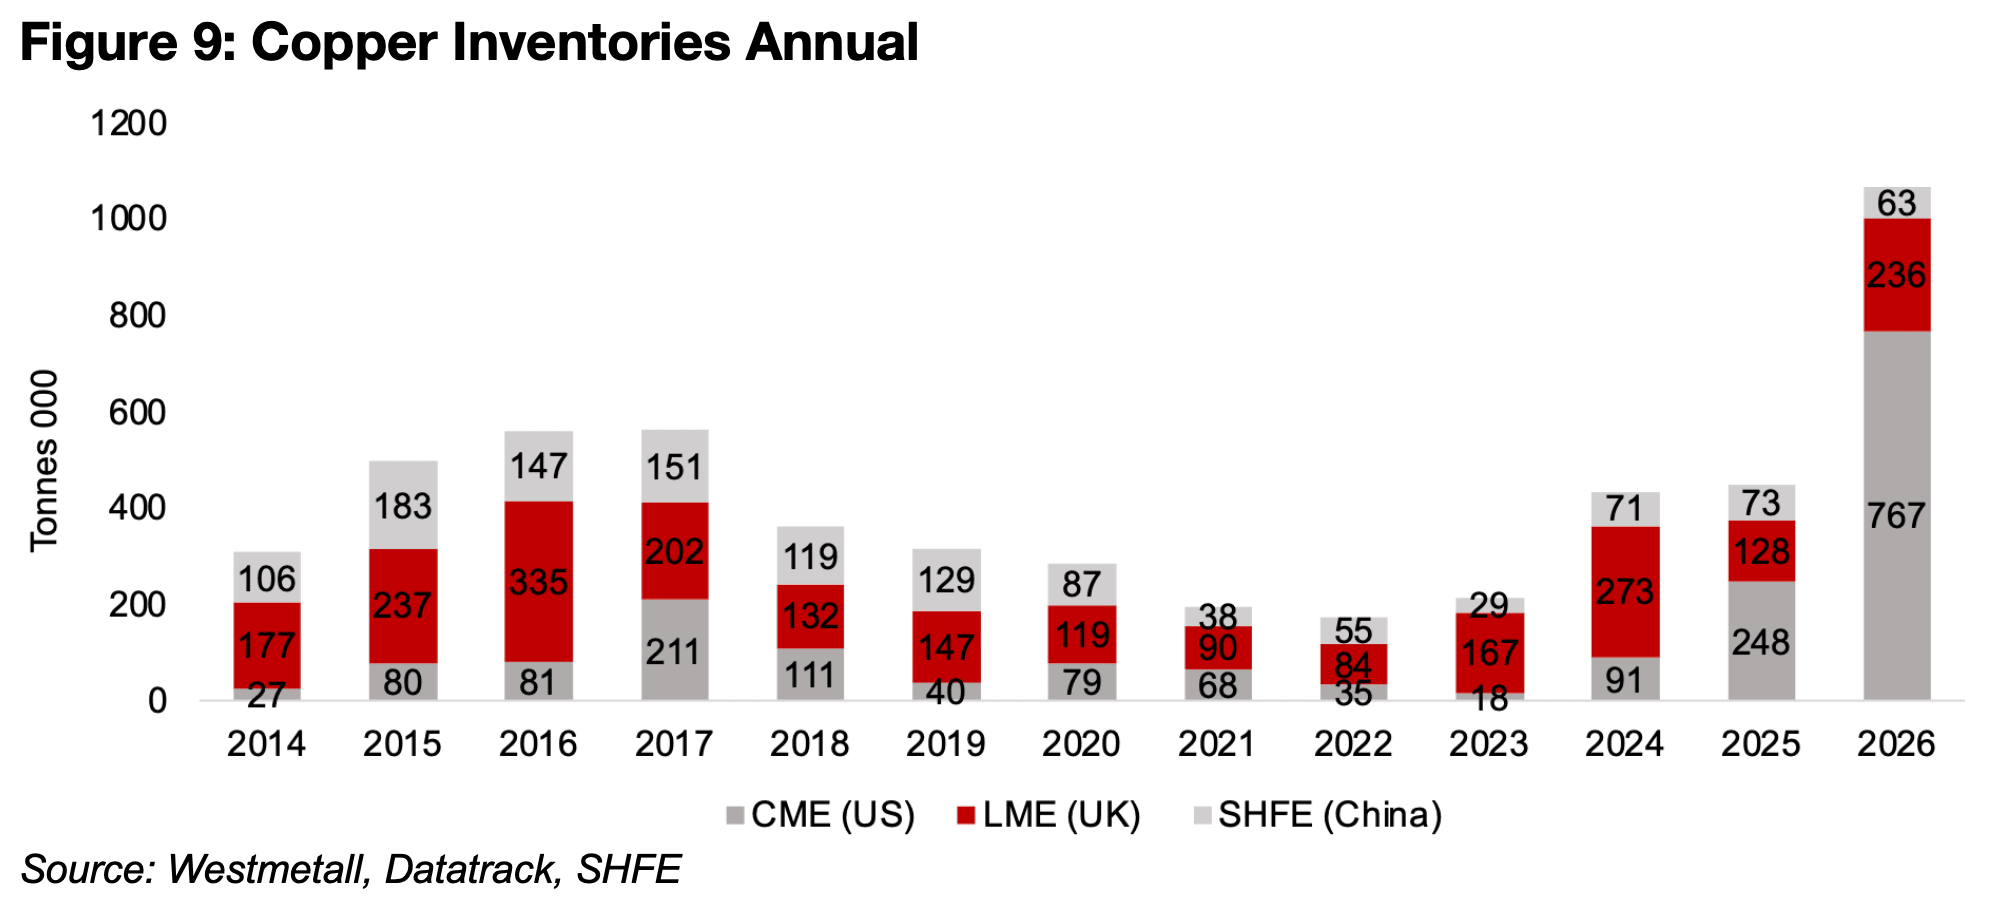
The annual inventories between the three show just how distorted the current situation is in terms of the overall level of stocks, not just the imbalance between the three countries. Overall stocks averaged just 365k tonnes from 2014 to 2025, ranging from 174k to 564k tonnes, with the current total at 1,066k tonnes in 2026 a severe outlier (Figure 9). For the balance between the markets, the CME is usually a much smaller holder of copper on average, at just 24% of the total from 2014 to 2025, with the LME having the highest proportion, at 49%, and the SHFE at 27%, actually slightly above the CME. At the current levels the CME is 72% of the total and the LME is at 22%, about half its average historical average. The SHFE at just 6% seems extremely unbalanced given the huge amount of copper processing and production in China.
If these trends were to unwind quickly, CME copper could completely flood the market and presumably drive a huge plunge in the copper price globally, and even a gradually rebalancing of global inventories could put significant pressure on the metal over the next few years. While for now the AI boom could continue to be a major offsetting driver, there are some concerns about the sustainability of that trend. The worst case scenario for copper would see a rapid copper inventory rebalancing at the same time as an AI bubble collapses. However, for now markets still seems to be pricing in some probability that more copper tariffs could come through and the AI boom will continue, given a price still near all-time highs even after last week’s slump.
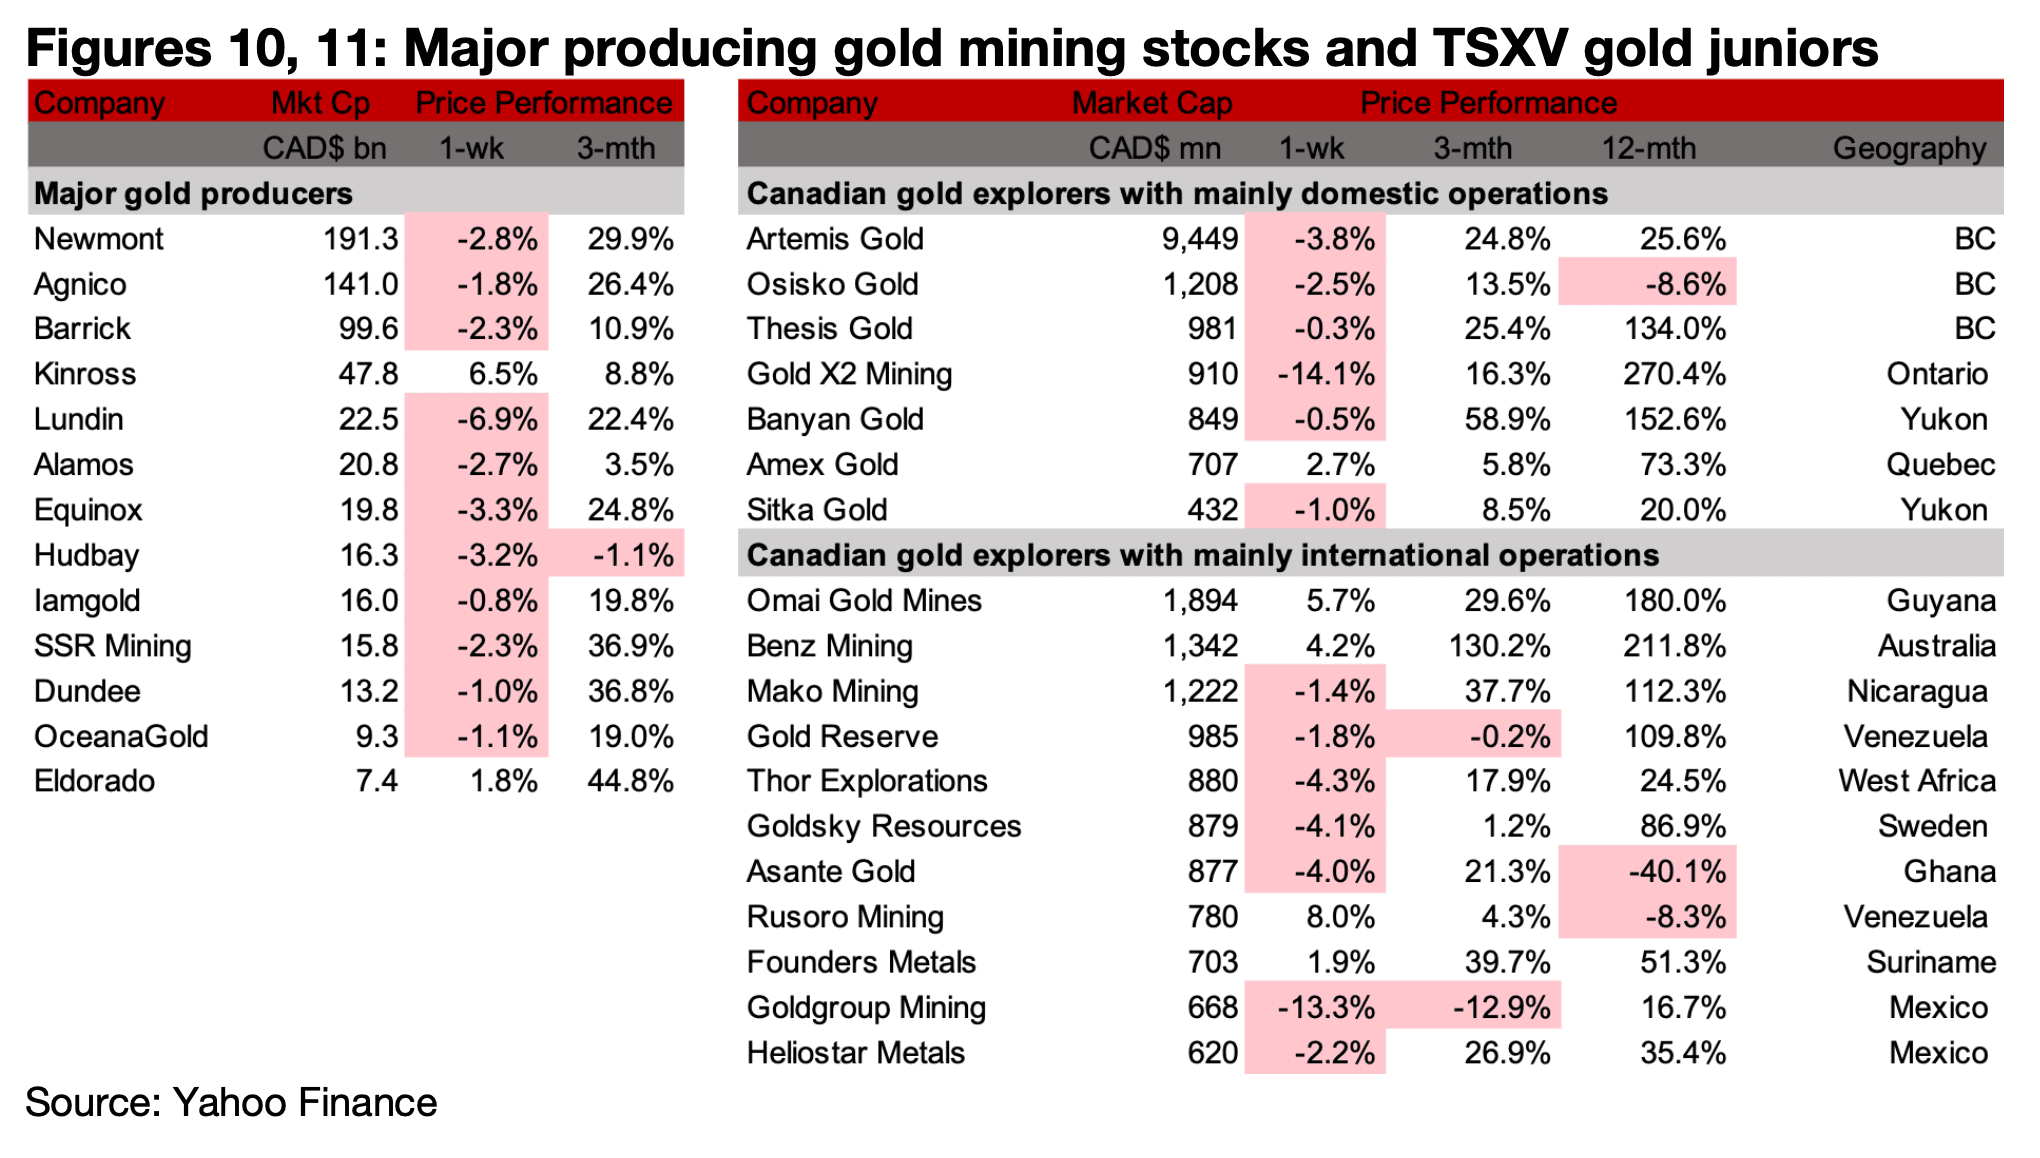
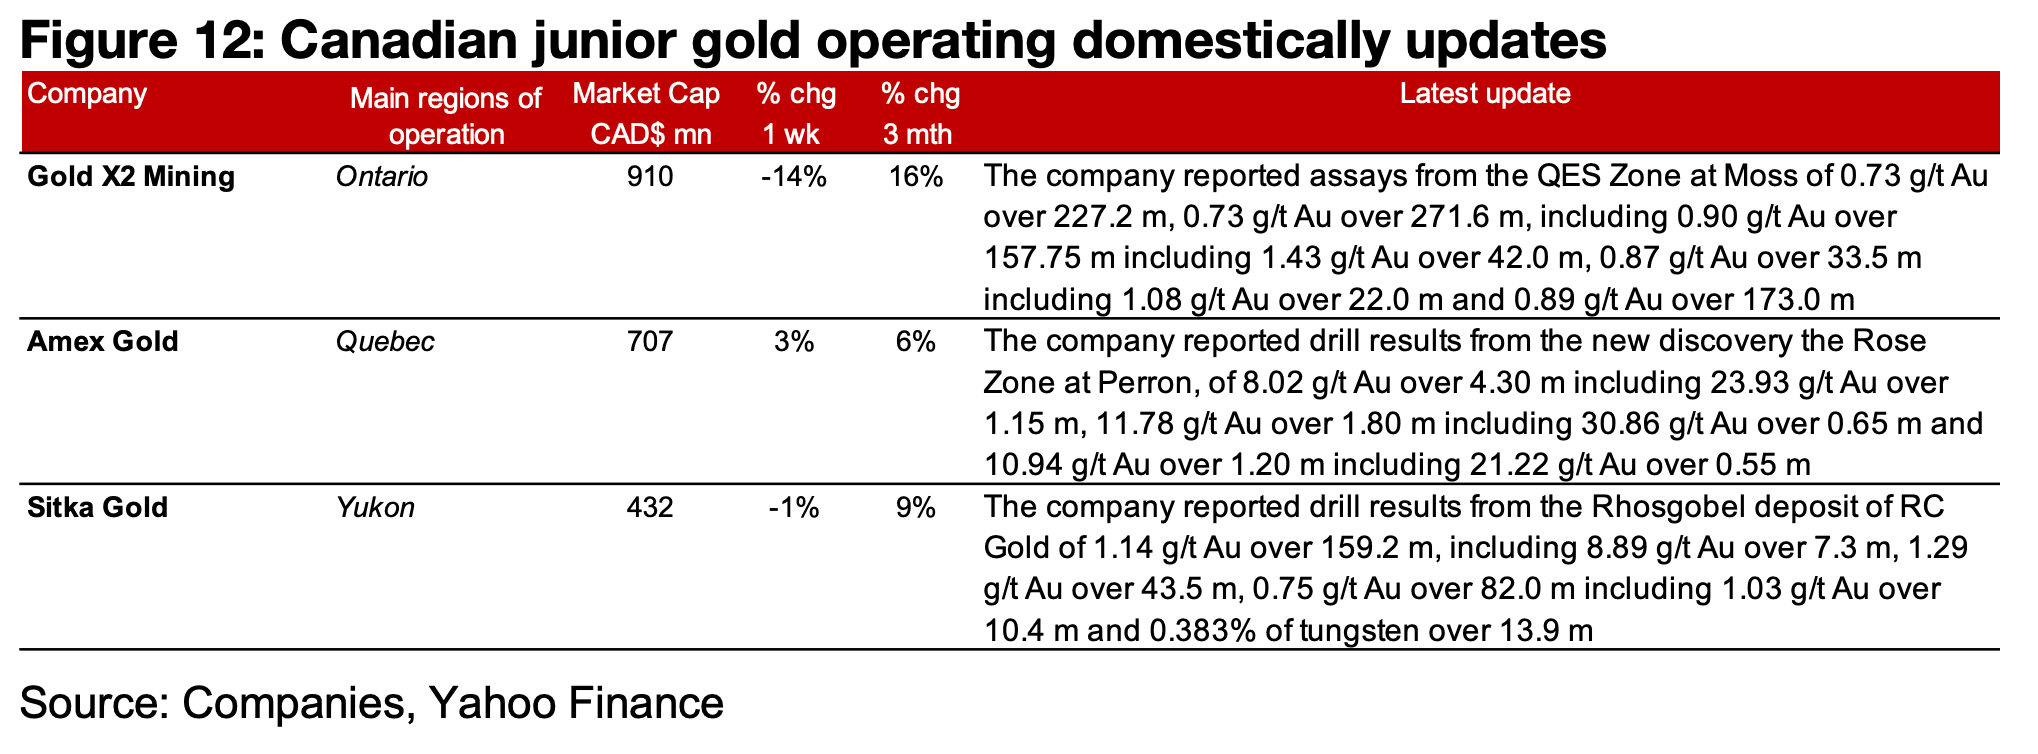
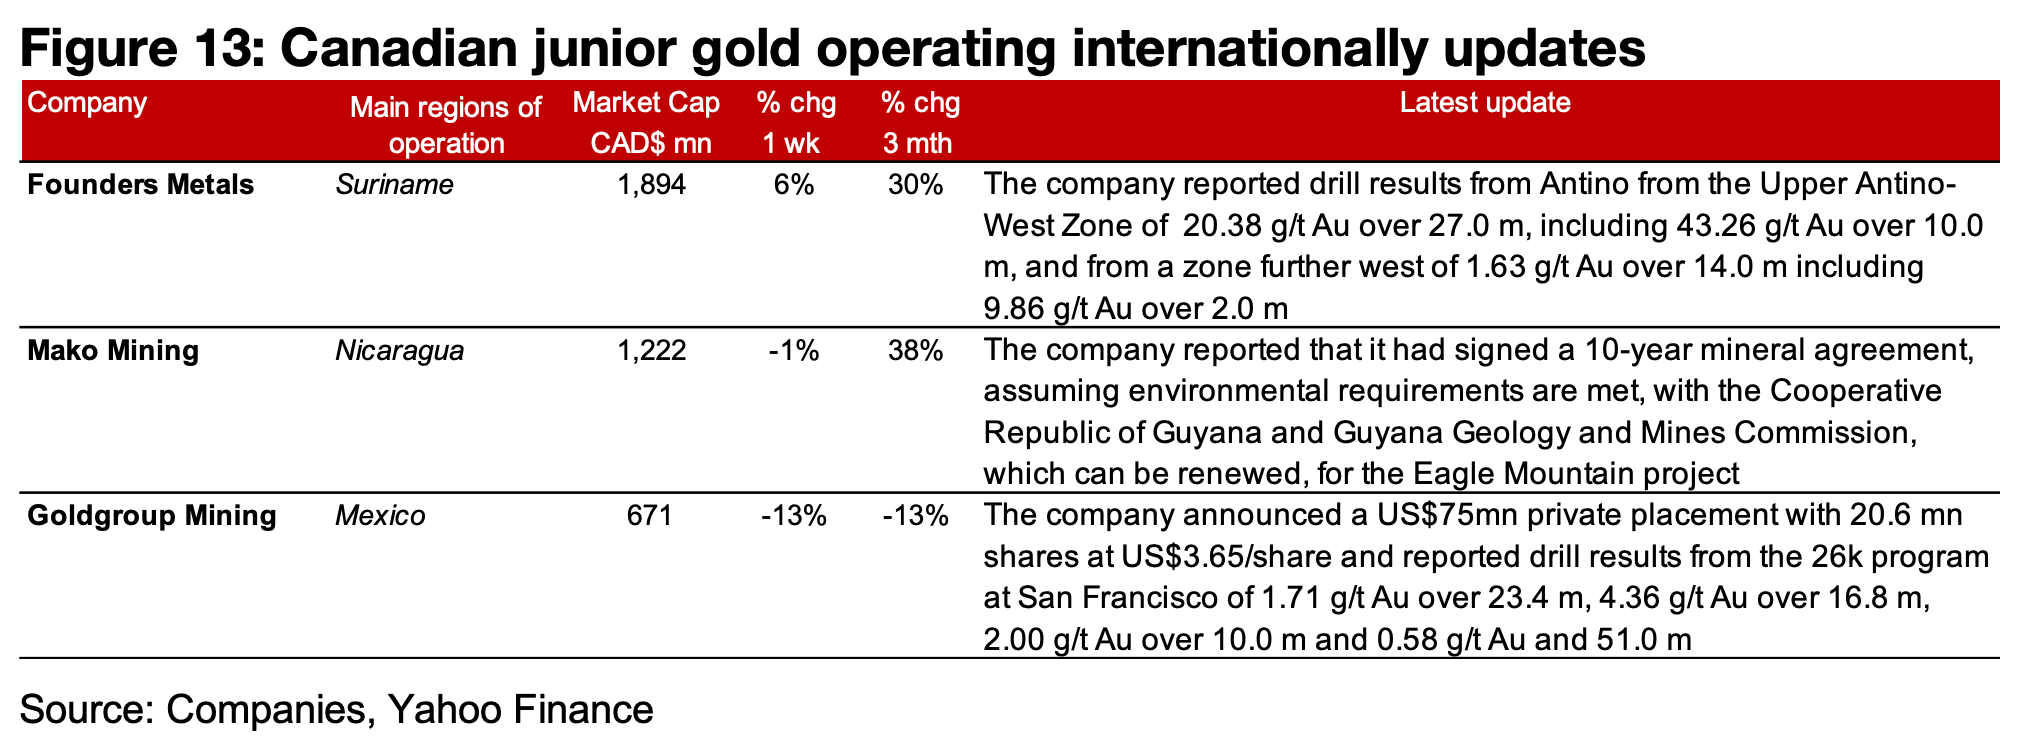
The major producers and TSXV gold mainly dropped on the decline in the metal price (Figures 10, 11). For the TSXV gold companies operating mainly domestically Gold X2 Mining reported drill results from the QES Zone of Moss, Amex Gold released drill results from the Rose Zone of Perron and Sitka Gold announced drill results from the Rhosgobel deposit of RC Gold (Figure 12). For the companies operating mainly internationally, Founders reported drill results from the Upper Antino-West Zone and also further west in Antino, Mako Mining signed a 10-year mineral agreement with the Guyana government for Eagle Mountain project and Goldgroup announced a US$75 mn private placement with US$60mn in committed participation from major natural resources investors including Trifigura, Mr. Eric Sprott, Mr. Rick Rule, Fiscal Wisdom, the Calu Fund and two other institutional investors (Figure 13).
Disclaimer: This report is for informational use only and should not be used an alternative to the financial and legal advice of a qualified professional in business planning and investment. We do not represent that forecasts in this report will lead to a specific outcome or result, and are not liable in the event of any business action taken in whole or in part as a result of the contents of this report.
Author
Ben McGregor authors the Weekly Roundup at CanadianMiningReport.com, providing sharp analysis of the metals and mining sector. With a talent for spotting trends, Ben distills complex market shifts into clear, engaging insights on TSXV junior miners. His weekly updates cover gold, copper, uranium, and more, blending data-driven perspectives with a knack for identifying opportunities. A vital resource for investors, Ben’s work navigates the dynamic junior mining landscape with precision.