
December 18, 2023
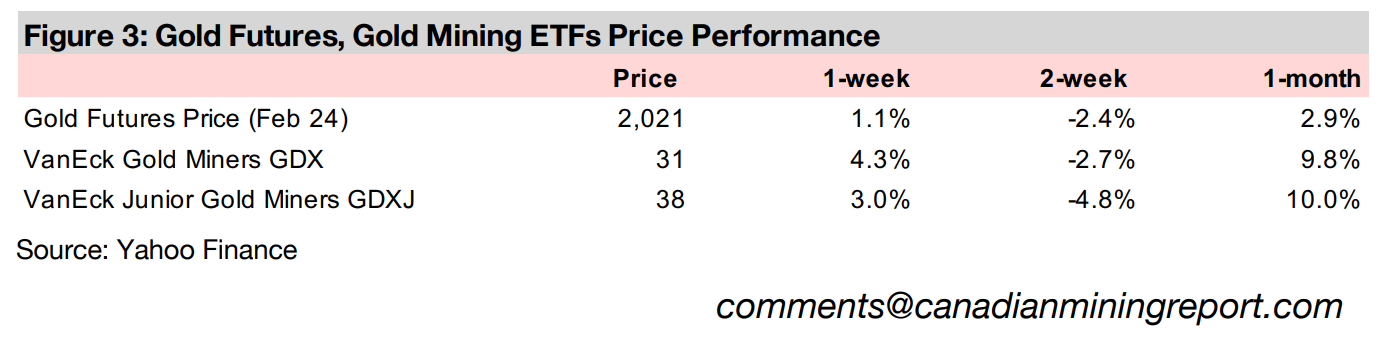
Gold rose 1.1% to US$2,021/oz as the Fed held rates steady and the central bank’s data and comments from Chairman Powell pointed to a more dovish monetary policy, indicating that not only had rate hikes peaked, but that cuts were likely into next year.
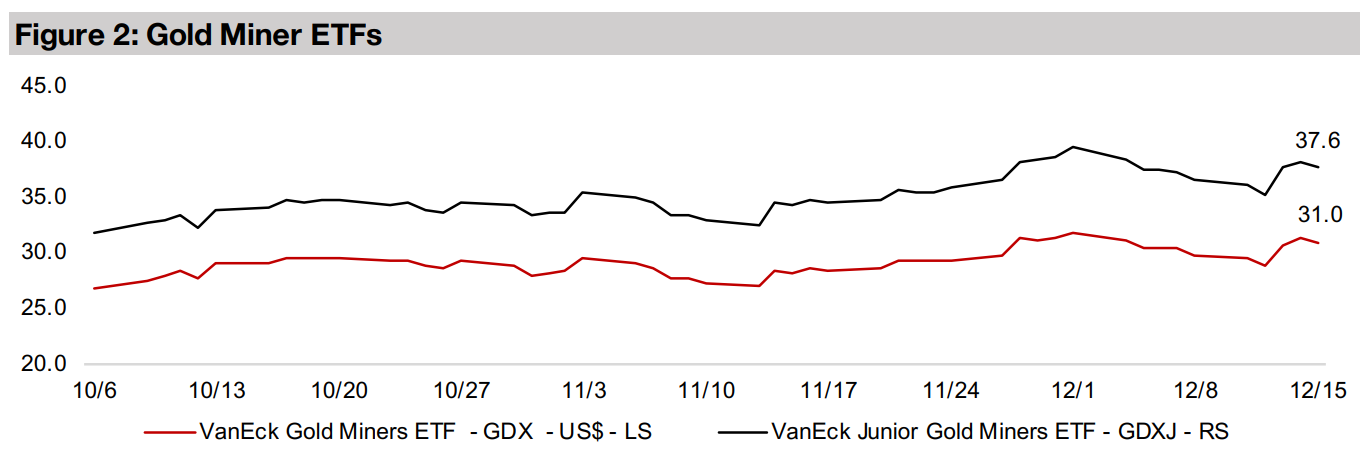
Gold stocks rose as the Fed pivot sent both gold and the equity markets soaring, with the GDX up 4.3% and GDXJ gaining 3.0% as the S&P 500 and Russell 2000 lifted 2.7% and 5.6%, and the TSXV larger cap gold stocks were mixed.


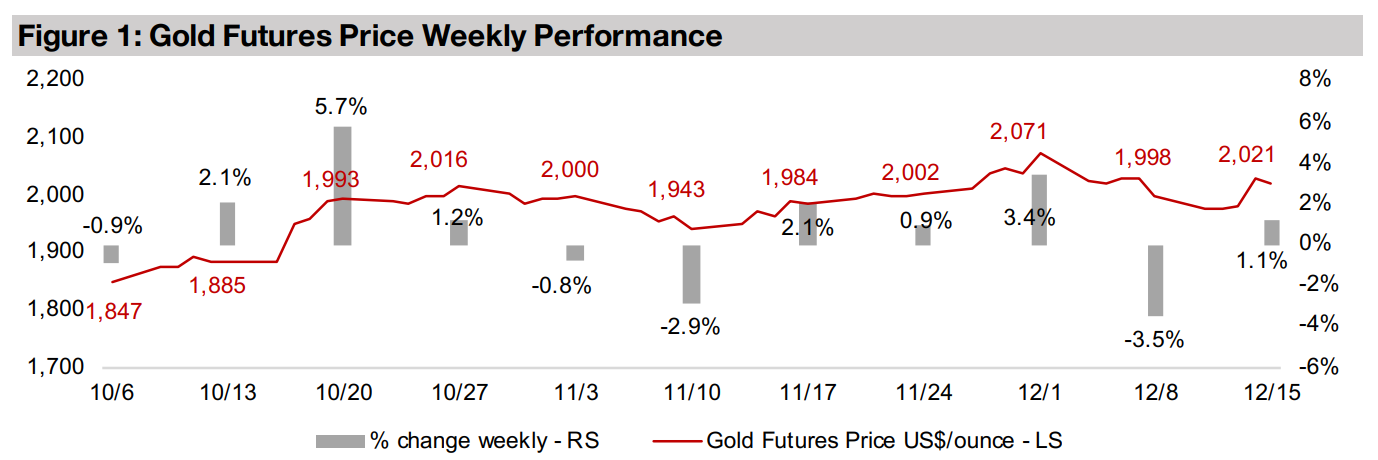
The gold price rose 1.1% to US$2,021/oz on declining US CPI inflation and the
outcome from the US Federal Reserve meeting. The Fed held rates steady, while the
central bank’s data and comments by Chairman Powell, including indications of rate
cut talks, were taken by the market as a dovish pivot. However, Williams, another Fed
Board member, contradicted this later in the week, indicating that it was too early to
consider rate cuts and that they had not been discussed. While this paused a rally in
equities, the S&P, Nasdaq and Russell 2000 still ended the week up 2.7%, 3.3% and
5.6%, and gold stocks rose with the GDX and GDXJ gaining 4.3% and 3.0%.
The Fed’s move surprised the market, especially in light of the hawkish language for
most of this year, with a ‘dot plot’ that looked particularly dovish. The plot summarizes
the Fed board members rate expectations, and pointed to a 0.75% decline in the
base rate to a 4.50%-4.75% range by 2024, down from 5.25%-5.50% currently.
While the Fed remains data dependent and the market’s expectations for dovishness
have been repeatedly dashed for two years, the bank may finally be easing up. The
Fed has a mandate to both control prices and maintain strong employment, and with
inflation declining and employment to potentially come down on an expected
recession, it may have some leeway for a looser monetary policy into next year.
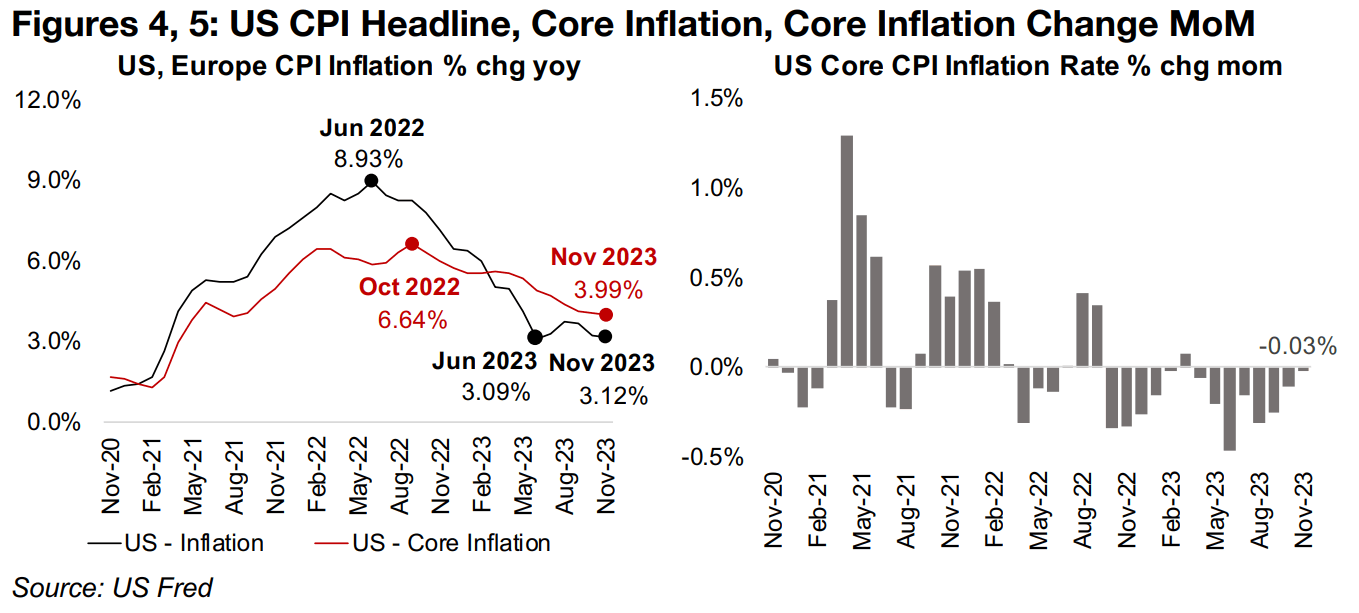
The most recent inflation data show the US CPI Index continuing to fall year on year,
supporting a more dovish Fed, although a slowdown in the rate of decline is a concern.
While there had been a precipitous 5.84% drop in headline inflation from a June 2022
peak of 8.93% to a trough of 3.09% in June 2023, it had picked back to as high as
3.71% in August 2023. Inflation has declined again since, to 3.12% in November 2023,
although this is still slightly above the mid-2023 trough.
However, the Fed tends to focus more on core inflation, which at 3.99% in November
2023, remains stubbornly above its 2.0% target. This is down 2.65% from a 6.64%
peak in October 2022, a much more gradual decline than for headline inflation. The
pace of the decline in core inflation has also slowed in recent months and was down
a minimal -0.03% in November 2023 (Figure 5). The market seems to be assuming
no resurgence in inflation that could hold the Fed held back on a potential rate cutting
path next year, thus leaving some room for a downside surprise from this measure.
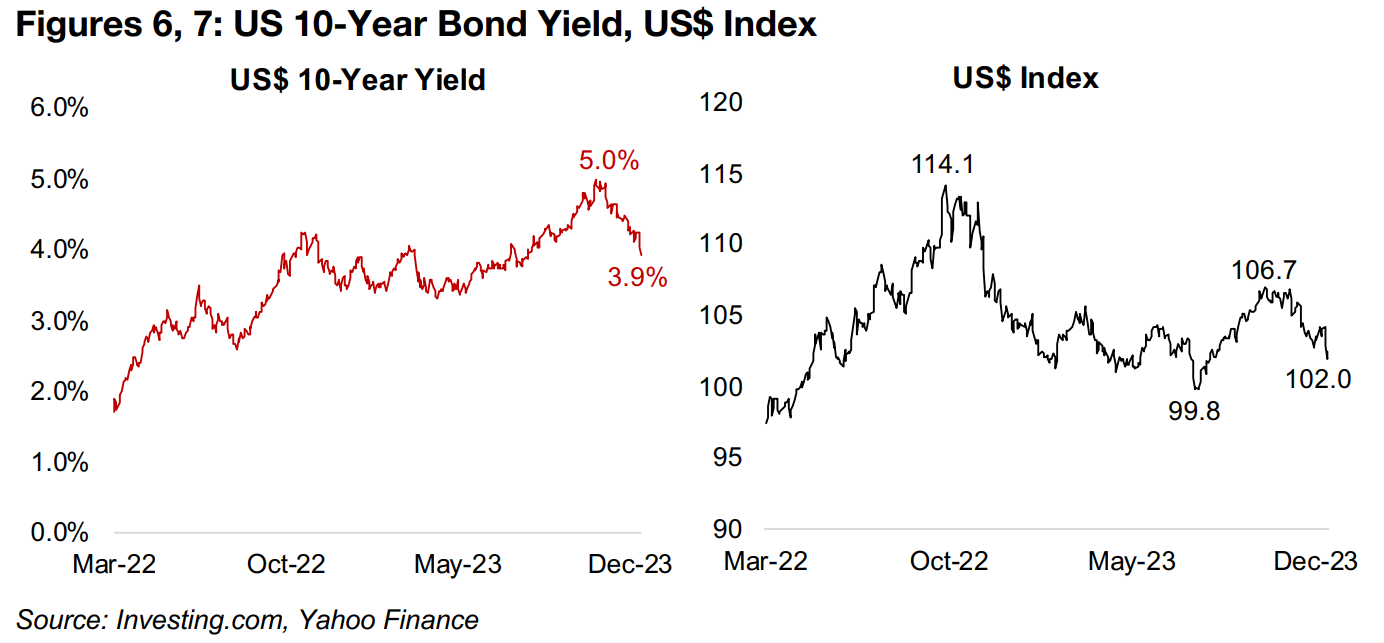
The expectations for monetary easing from the Fed has driven a considerable decline in US nominal bond yields, with the US 10-year dropping over a percent to 3.9% from highs of 5.0% in October 2023 (Figure 6). These lower yields have been a factor in driving down the US$, as the rate differential between the US and other countries contracts, driving outflows from the dollar (Figure 7). A weaker dollar tends to be supportive of the gold price, with the two generally moving inversely.
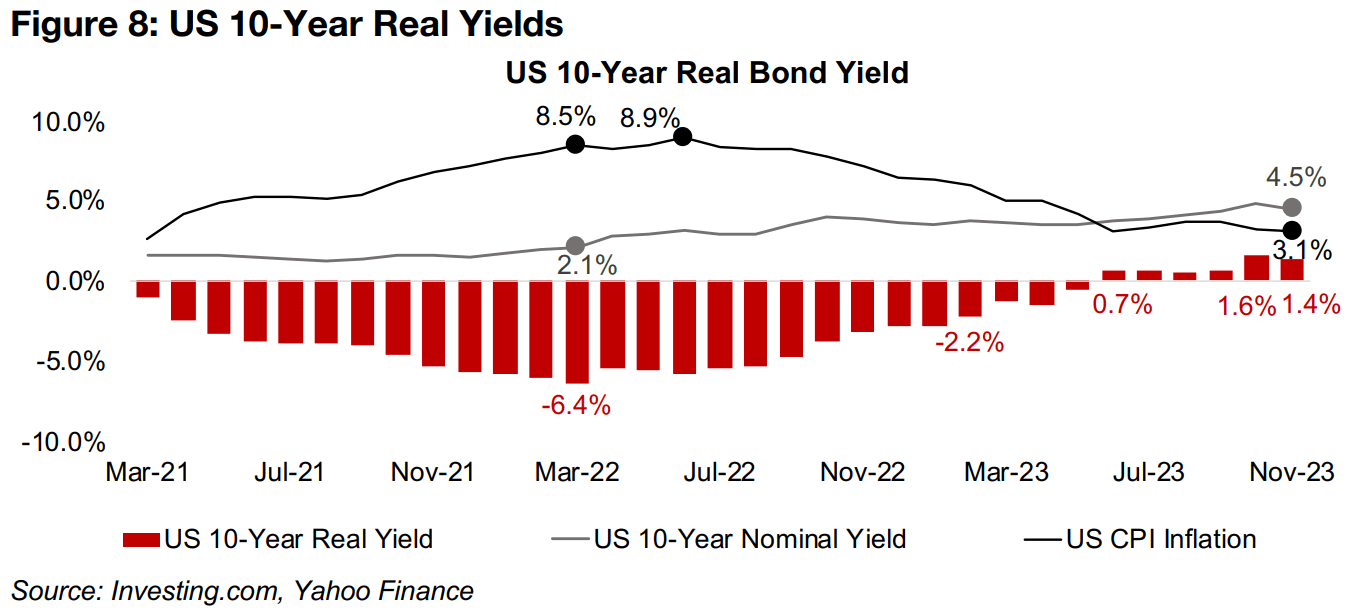
The falling nominal yields could support gold, as they can push down real yields, which also tend to move inversely to the metal, as the opportunity cost of holding gold rather than bonds declines. This occurred through 2021 and into early 2022, as nominal yields were low while inflation soared, sending real yields to a low of 6.4% in March 2022 and significantly driving up the gold price (Figure 8). Real yields became progressively less negative from mid-2022, turned positive in June 2023, and reached a peak of 1.6% in October 2023. However, real yields pulled back to 1.4% in November 2023, and may have declined further in December 2024 on the drop in nominal yields, assuming no rebound in inflation. This could have added to gold’s run in recent months, showing that while geopolitical issues where probably the greatest catalyst, fundamental economic factors have also likely been at work.
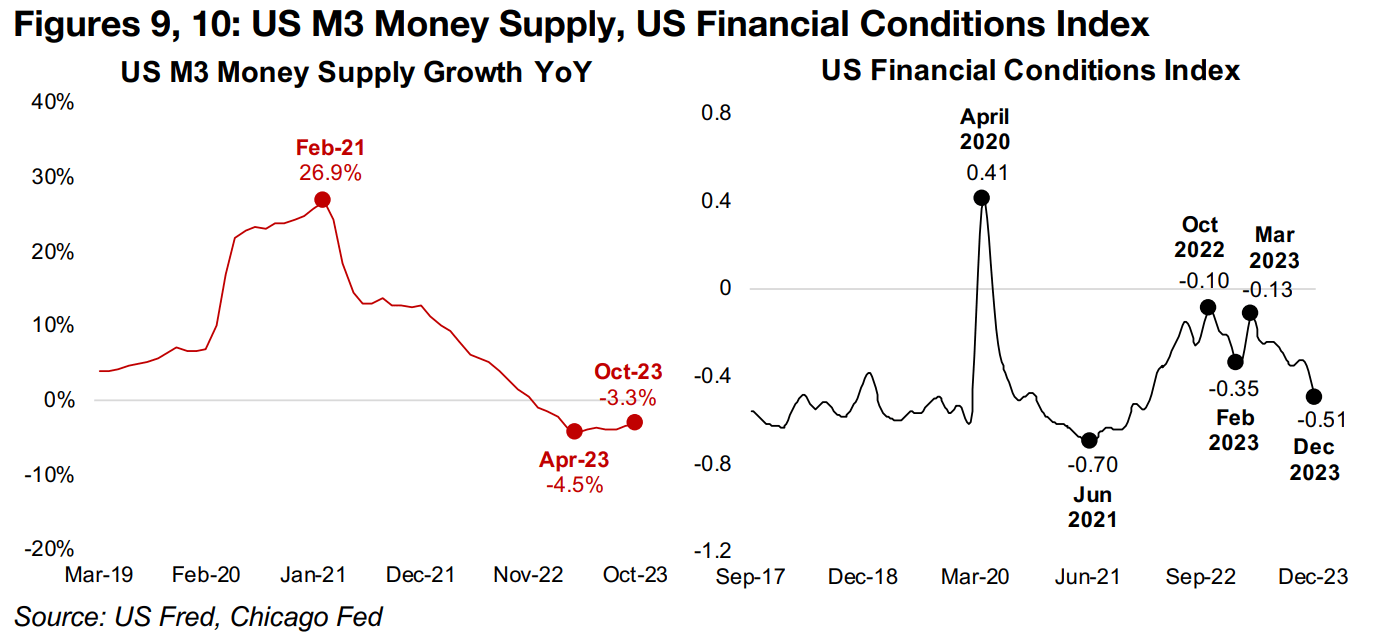
Another broader macro driver is the money supply, with gold tending to rise as it increases and vice versa. This had been moving against gold from the February 2021 peak in US M3 growth of 26.9% to a low of -4.5% in April 2023 (Figure 9). Both these figures were extremes, with M3 growth usually ranging from 3.0% to 10% since 1960. While the M3 decline remains towards the bottom of this range, it has improved slightly to -3.3% as of October 2023. The National Financial Conditions index, with readings below zero indicating looser, and above zero, tighter, conditions, has tended to reflect the money supply growth. Conditions tightened from 2021-2022, with the index rising from -0.70 in June 2021 to -0.10 in October 2022, but have eased in recent months on a less severe contraction in the M3 (Figure 10). If the Fed delivers on its pivot, both these drivers could continue to move in gold’s favour into next year.
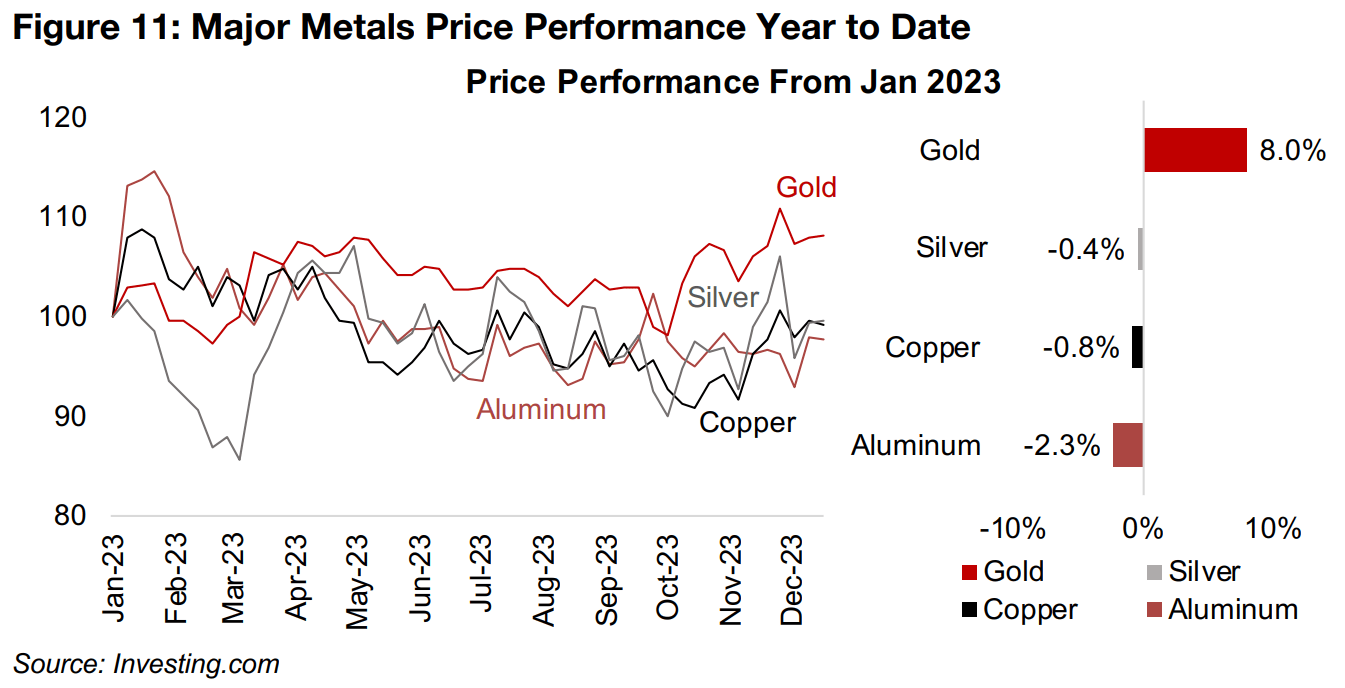
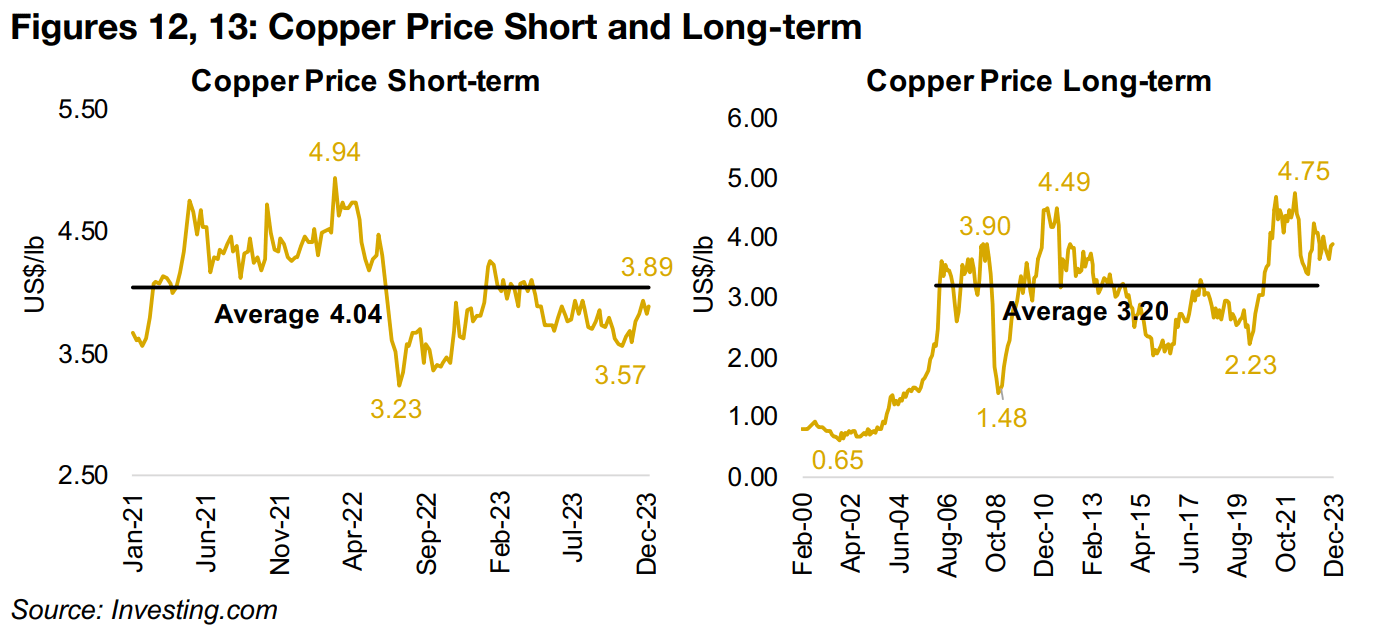
Along with the geopolitical risk premium, all these economic drivers have seen gold put in the stand-out performance this year of major metals, up 8.0%. The base metals that are more driven by the industrial cycle, in contrast, have struggled to stay even flat this year, as concerns over a global recession in 2024 continue, with silver down -0.4%, copper, -0.8% and aluminum, -2.3% (Figure 11). This is even after the copper price has picked up over the past two months to US$3.89/lb from US$3.57/lb in October 2023, reverting towards its US$4.04/lb average since 2021 (Figure 12). While the price remains about a US$1.00/lb off its US$4.75/lb highs set in March 2022, it is still considerably above its average of US$3.20/lb since 2006 (Figure 13).
The outlook for copper heading into 2024 has become clouded by the shutdown of
a major mine in Panama, First Quantum’s Cobre, with an output substantial enough
to significantly affect the forecast supply demand balance for the metal, and therefore
its price. The mine was ordered to be shut down after a Panama court ruled in
November 2023 that the law under which the mine operated was unconstitutional,
with a decision made originally in 2017, subsequently challenged, and upheld in 2021.
This drove new negotiations by First Quantum and Panama and a new law announced
on October 20, 2023 gave the company a new twenty year contract, extendable by
an additional twenty years. However, there have been protests by Panama’s major
labour union, claiming that the contract heavily favored First Quantum and that the
mine had high environmental risk. These have been seen as related to the country’s
2024 presidential election with politicians pushing for more state control of mines.
These protests eventually culminated in both the passing of a law which bans new
mining concessions in the country and the shutdown of the Cobre mine. There will
now be a ninety-day period of talks between First Quantum and the government, and
depending on the resolution, the issue could shift to international arbitration, which
can drag on for years. This could potentially see the mine out of operation through at
least 2024, and potentially much longer, even if First Quantum gets a new contract
or the mine is eventually nationalized by the government in Panama.
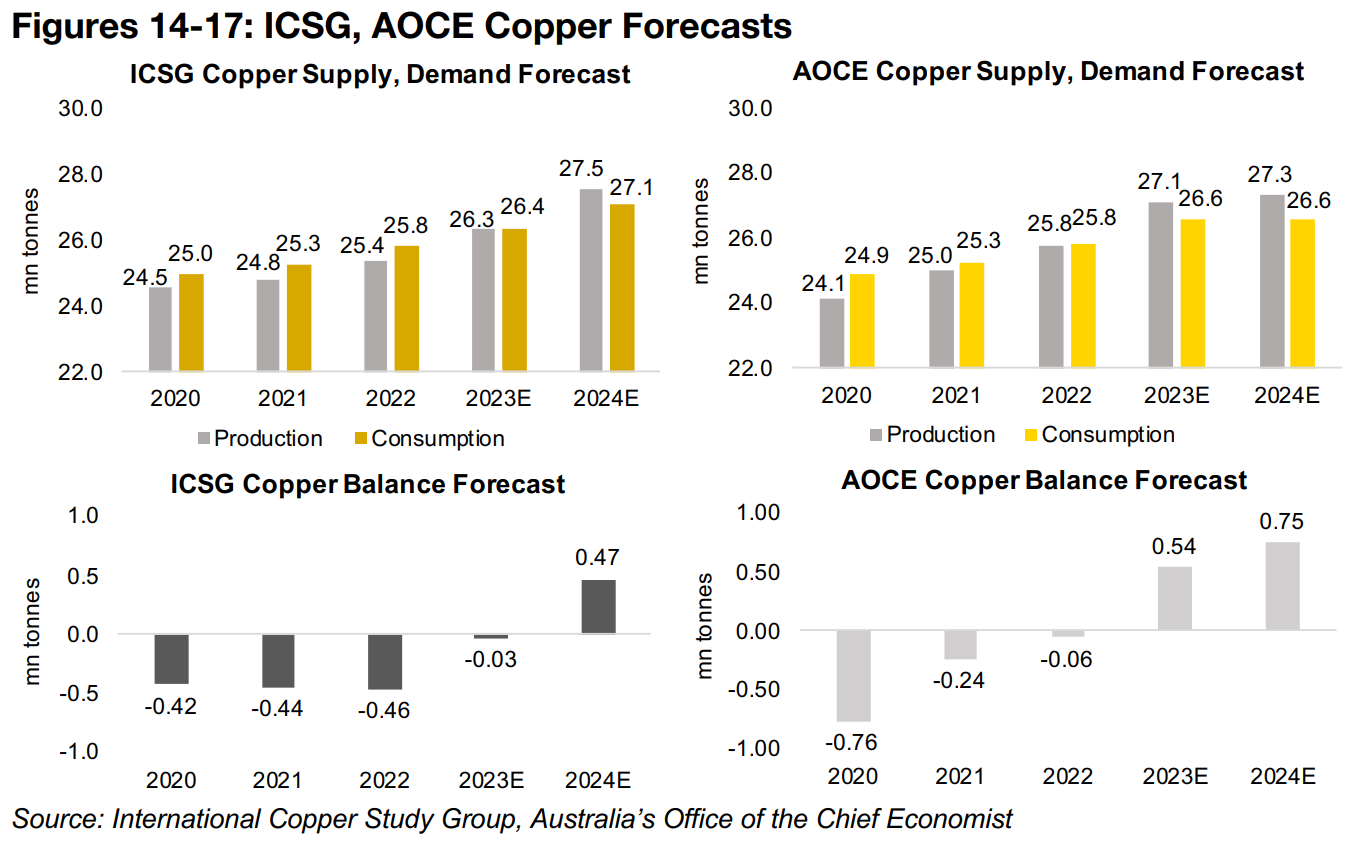
The shutdown in Panama is likely to drive forecast revisions from the two major
sources of estimates for copper supply and demand, the International Copper Study
Group (ICSG) and Australia’s Office of the Chief Economist (AOCE). While the
forecasts for the supply and demand from both are similar for 2023 and 2024, at
around 26.0 to 27.0 mn tonnes, small differences in these large magnitudes can lead
to significant disparities between the market balances across these sources (Figures
14-17). As this can mean the difference between a market surplus or deficit, it can
have a significant effect at the margin on the expected copper price.
For 2022, for example, the ICSG estimate a 460k deficit and the AOCE only a 60k
deficit, and for 2023 ICSG expects a 30k tonne deficit and the AOCE a 540k tonne
surplus. For 2024, they are both are expecting a surplus, of 470k for ICSG and 750k
for AOCE. This is where we can see the large effect of the Panama mine shutdown,
which was reported after these forecasts were released. Assuming that Cobre in 2024
would have had a similar output to the 350k tonnes produced in 2022, it would reduce
the ICSG surplus by 75% and the AOCE surplus by 47% next year.
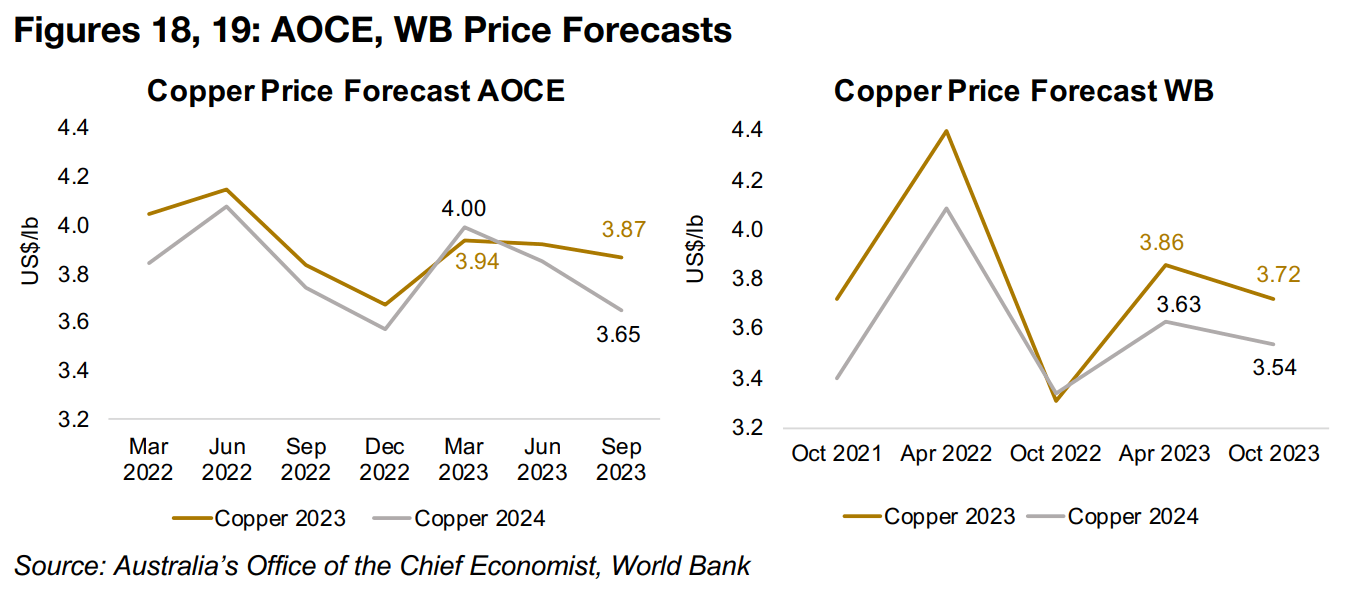
There are regularly released copper price forecasts by the AOCE and the World Bank,
with both currently expecting a considerable decline in 2024, and estimates from both
have come down over the past six months (Figures 18, 19). The AOCE is moderately
more bullish, with a US$3.87/lb forecast for 2023, near the current price, with a 5.7%
drop to US$3.65/lb in 2023, and the World Bank forecasts US$3.72/lb for 2023 and
a 4.8% drop to US$3.54/lb for 2024. It is possible that supply estimates will be cut in
the next round of forecasts, which could drive up copper price estimates. However,
demand forecasts may also be reduced as global recession concerns rise, which
could lead to relatively flat copper price estimates.
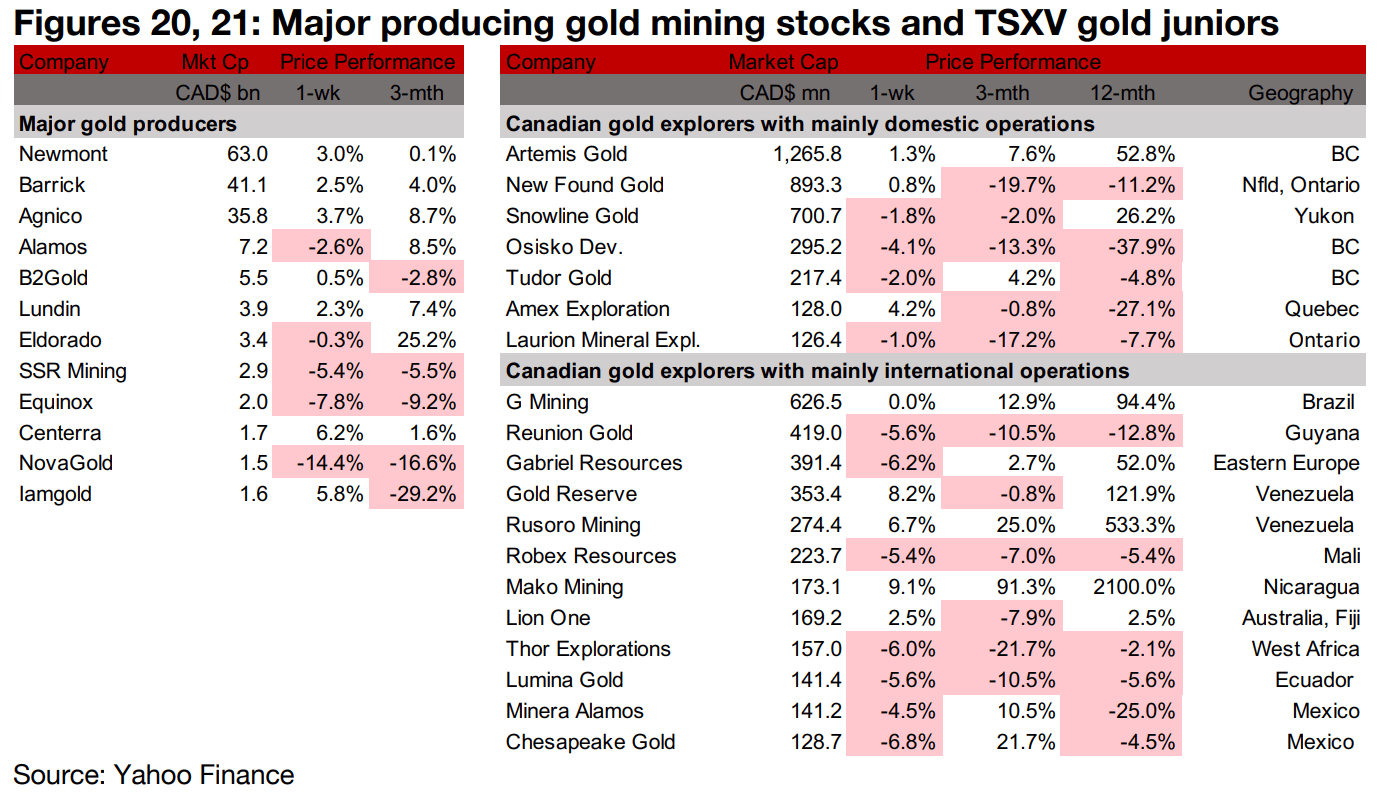
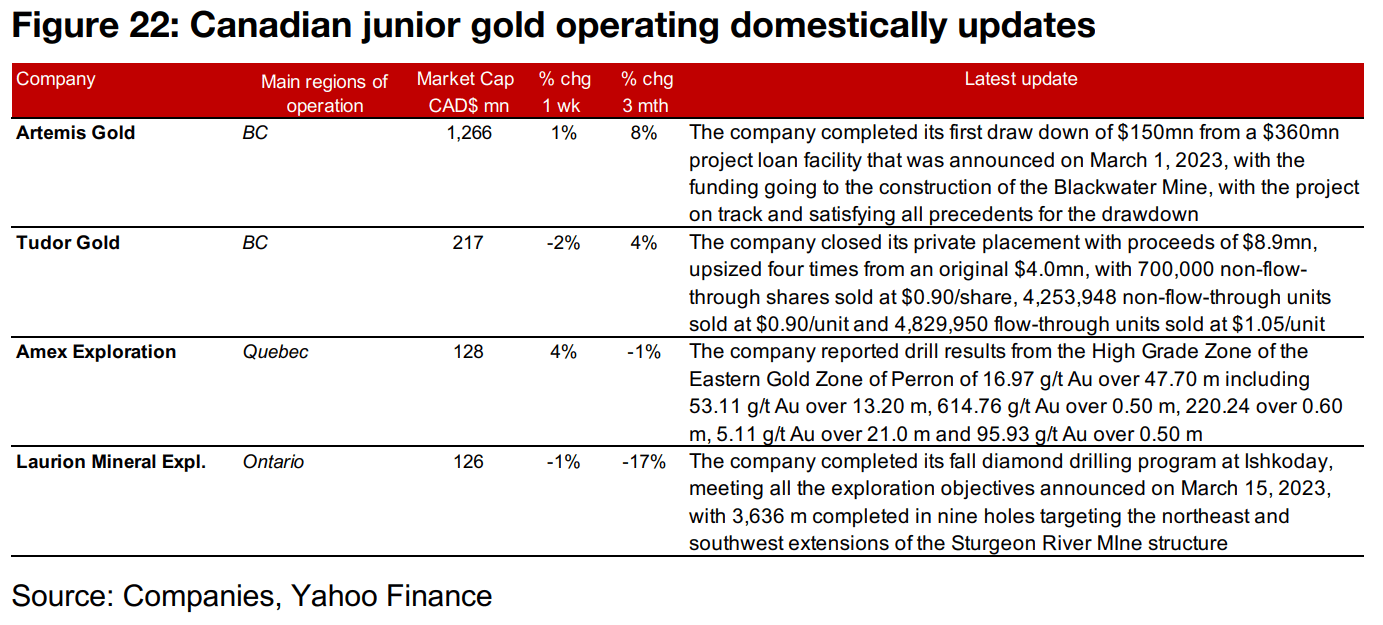
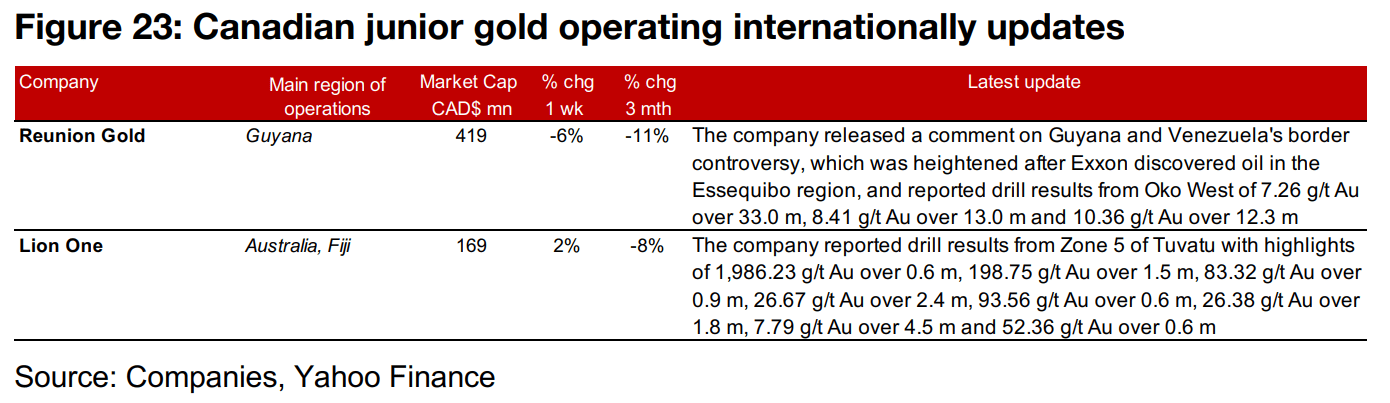
The major gold producers were mixed although the three largest gained, while TSXV larger gold was mixed (Figures 20, 21). For the TSXV gold companies operating domestically, Artemis Gold completed the first $150mn drawdown of its $360mn project loan facility for Blackwater, Tudor closed its four-times upsized $8.9 mn private placement, Amex Exploration reported drill results from the High Grade Zone of Perron and Laurion completed its fall diamond drilling program at Ishkoday (Figure 22). For the TSXV gold companies operating internationally, Reunion Gold commented on the Guyana and Venezuela border dispute and released drill results from Oko West and Lion One reported drill results from Zone 5 of Tuvatu (Figure 23).
Disclaimer: This report is for informational use only and should not be used an alternative to the financial and legal advice of a qualified professional in business planning and investment. We do not represent that forecasts in this report will lead to a specific outcome or result, and are not liable in the event of any business action taken in whole or in part as a result of the contents of this report.
Author
Ben McGregor authors the Weekly Roundup at CanadianMiningReport.com, providing sharp analysis of the metals and mining sector. With a talent for spotting trends, Ben distills complex market shifts into clear, engaging insights on TSXV junior miners. His weekly updates cover gold, copper, uranium, and more, blending data-driven perspectives with a knack for identifying opportunities. A vital resource for investors, Ben’s work navigates the dynamic junior mining landscape with precision.