June 02, 2025
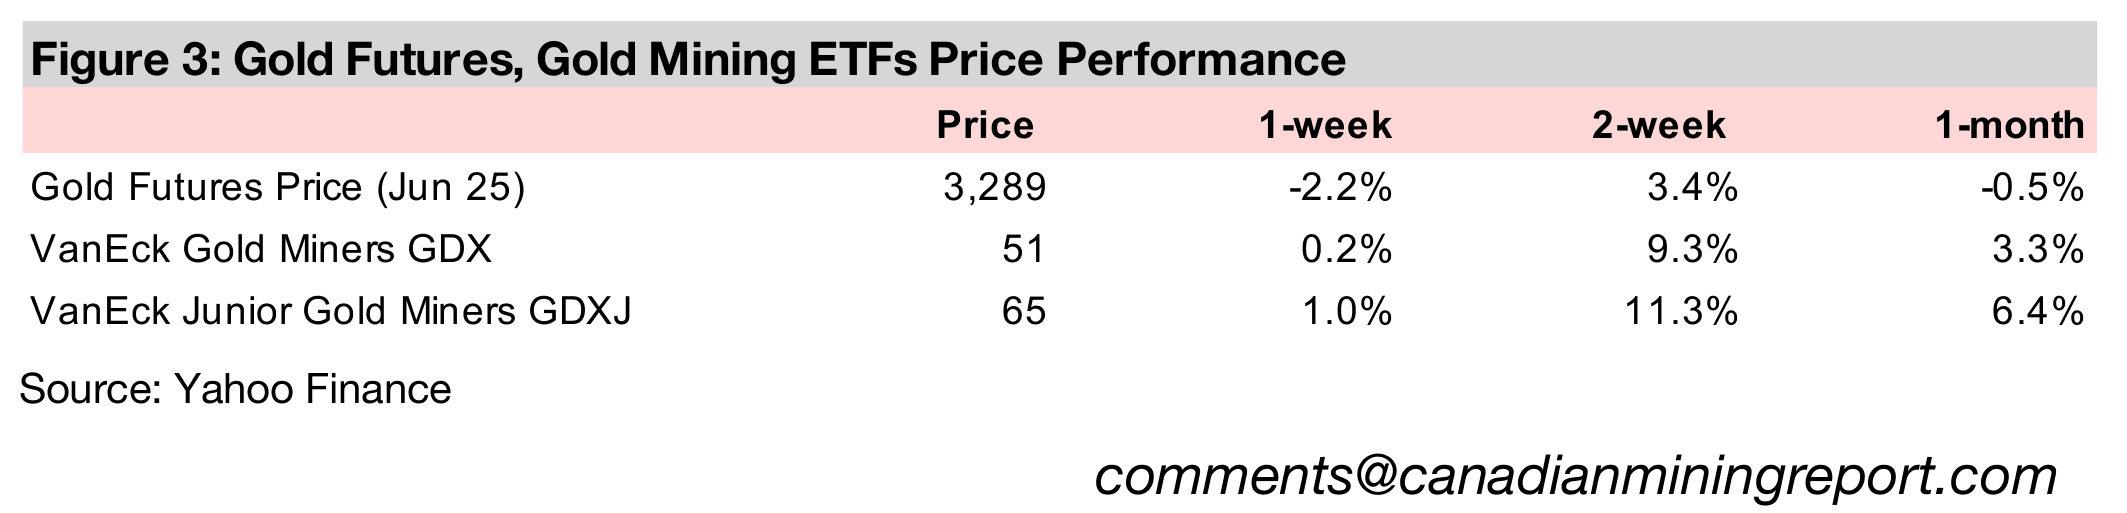
Gold declined -2.2% to US$3,289/oz, putting it nearly in the middle of the range that has held now for eight weeks, as a strong risk on move in markets continued even as the global economic and politic situation remained in a state of turmoil.
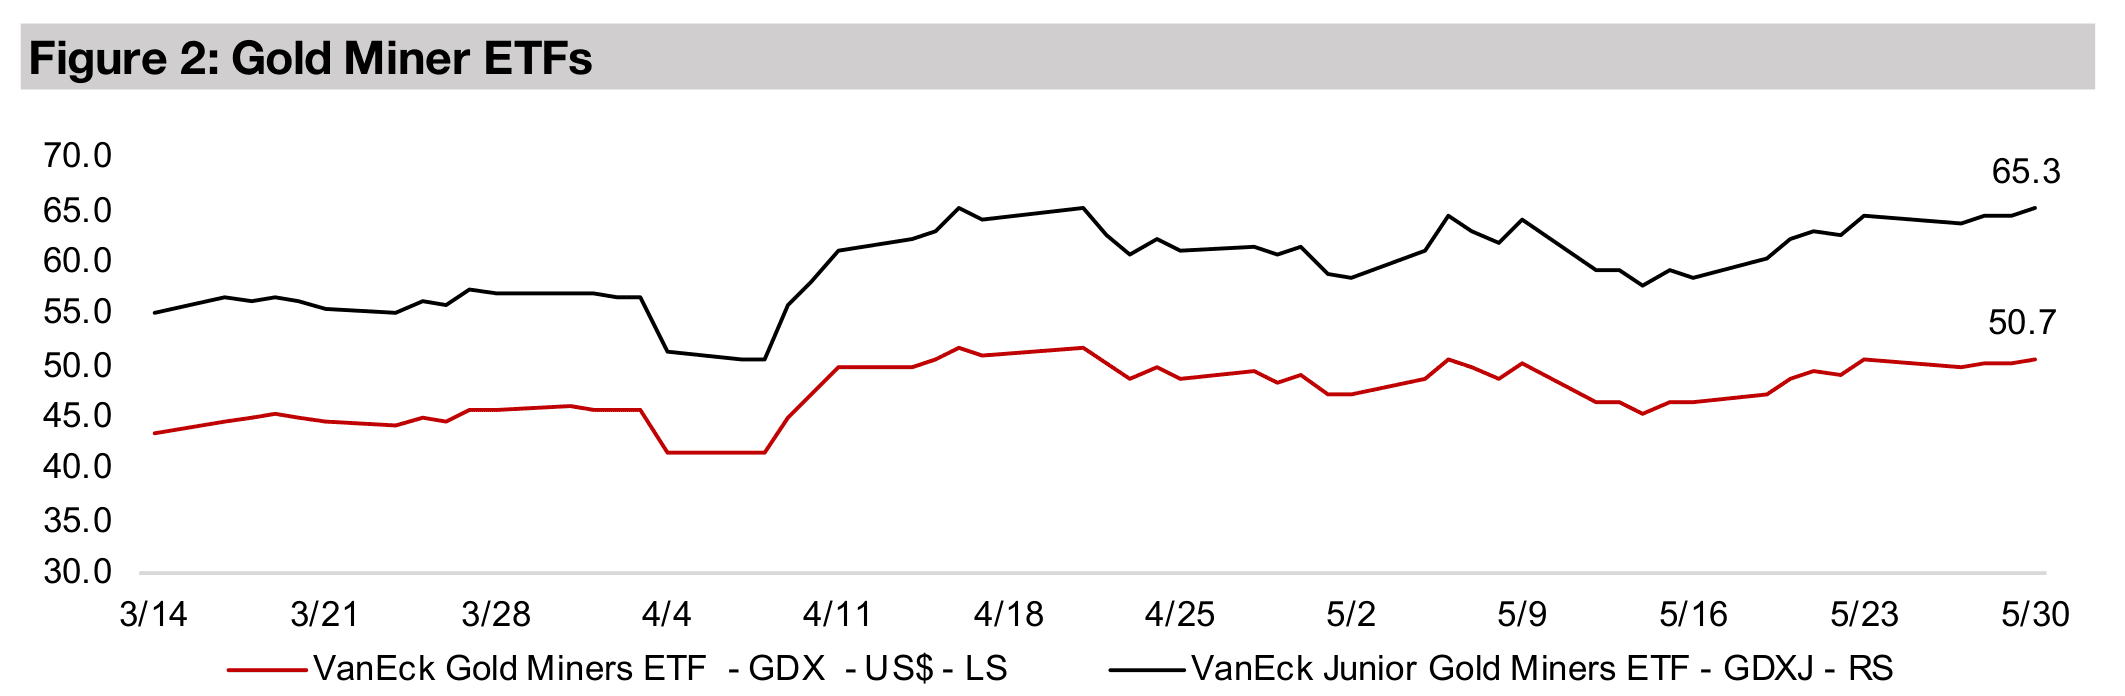
The gold stocks rose, with the juniors outpacing the majors, as the GDXJ gained 1.0% but GDX edged up just 0.2%, partly as the risk on move drove an increase in smaller, riskier companies with the Russell 2000 up 2.6% versus a 2.2% gain for the S&P 500.


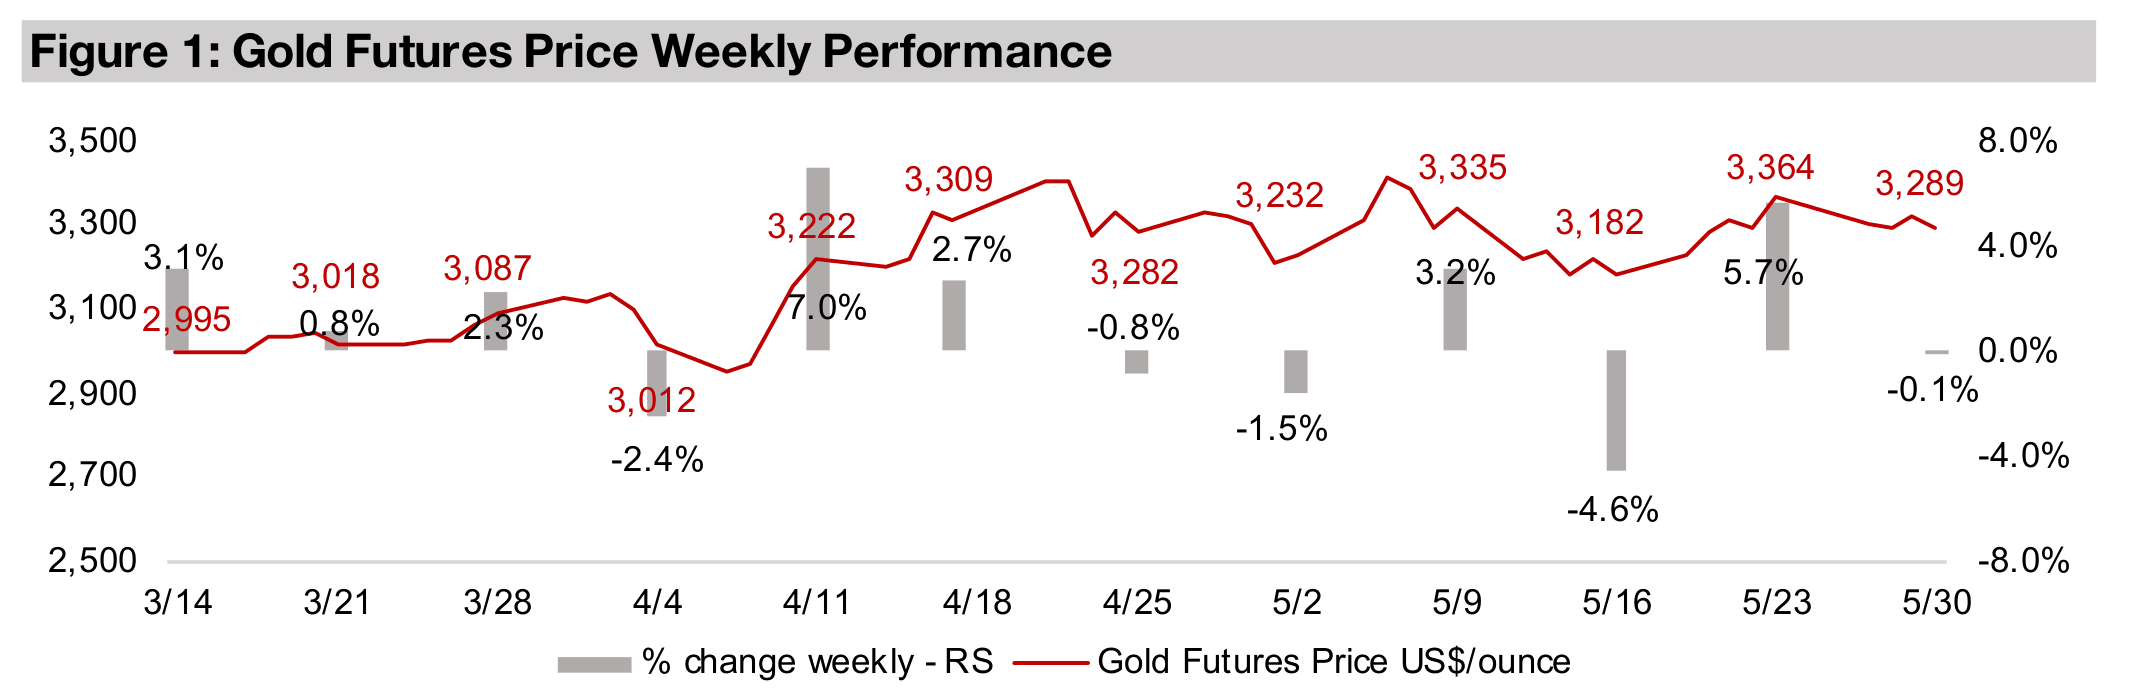
Gold declined -2.2% to US$3,289/oz, near the middle of the range that has held for
the past two months. This came as the upward move in equities continued, with the
Nasdaq and Russell 2000 both gaining 2.6% and outperforming the 2.2% rise in the
S&P 500, indicating a market move into riskier sectors like tech and small caps. The
gold stocks rose, with the rise in equities offsetting the drop in the metal price,
although the major producers were outpaced by the juniors, with the GDX only edging
up 0.2% but the GDXJ increasing 1.0%, likely driven by the strength in small caps.
The rise in US equities may have been partly from a decline in yields, with the US 10-
year down to 4.40% from its recent peak at 4.60% on May 21, 2025, while yields in
several large European markets declined, but were mixed for major Asian markets.
The US$ index also declined, to 99.3, still up from multi-year lows of 98.3 reached on
May 21, 2025, but well off 2025 highs of 110.0 on January 13, 2025. A decline in gold
would not usually be expected on a fall in yields and the dollar, which tend to move
inversely to the metal. However, the metal’s decline may partly be because markets
view its very strong run this year as already having priced in a range of risks, while
the general risk on move has led to more subdued interest in safe havens.
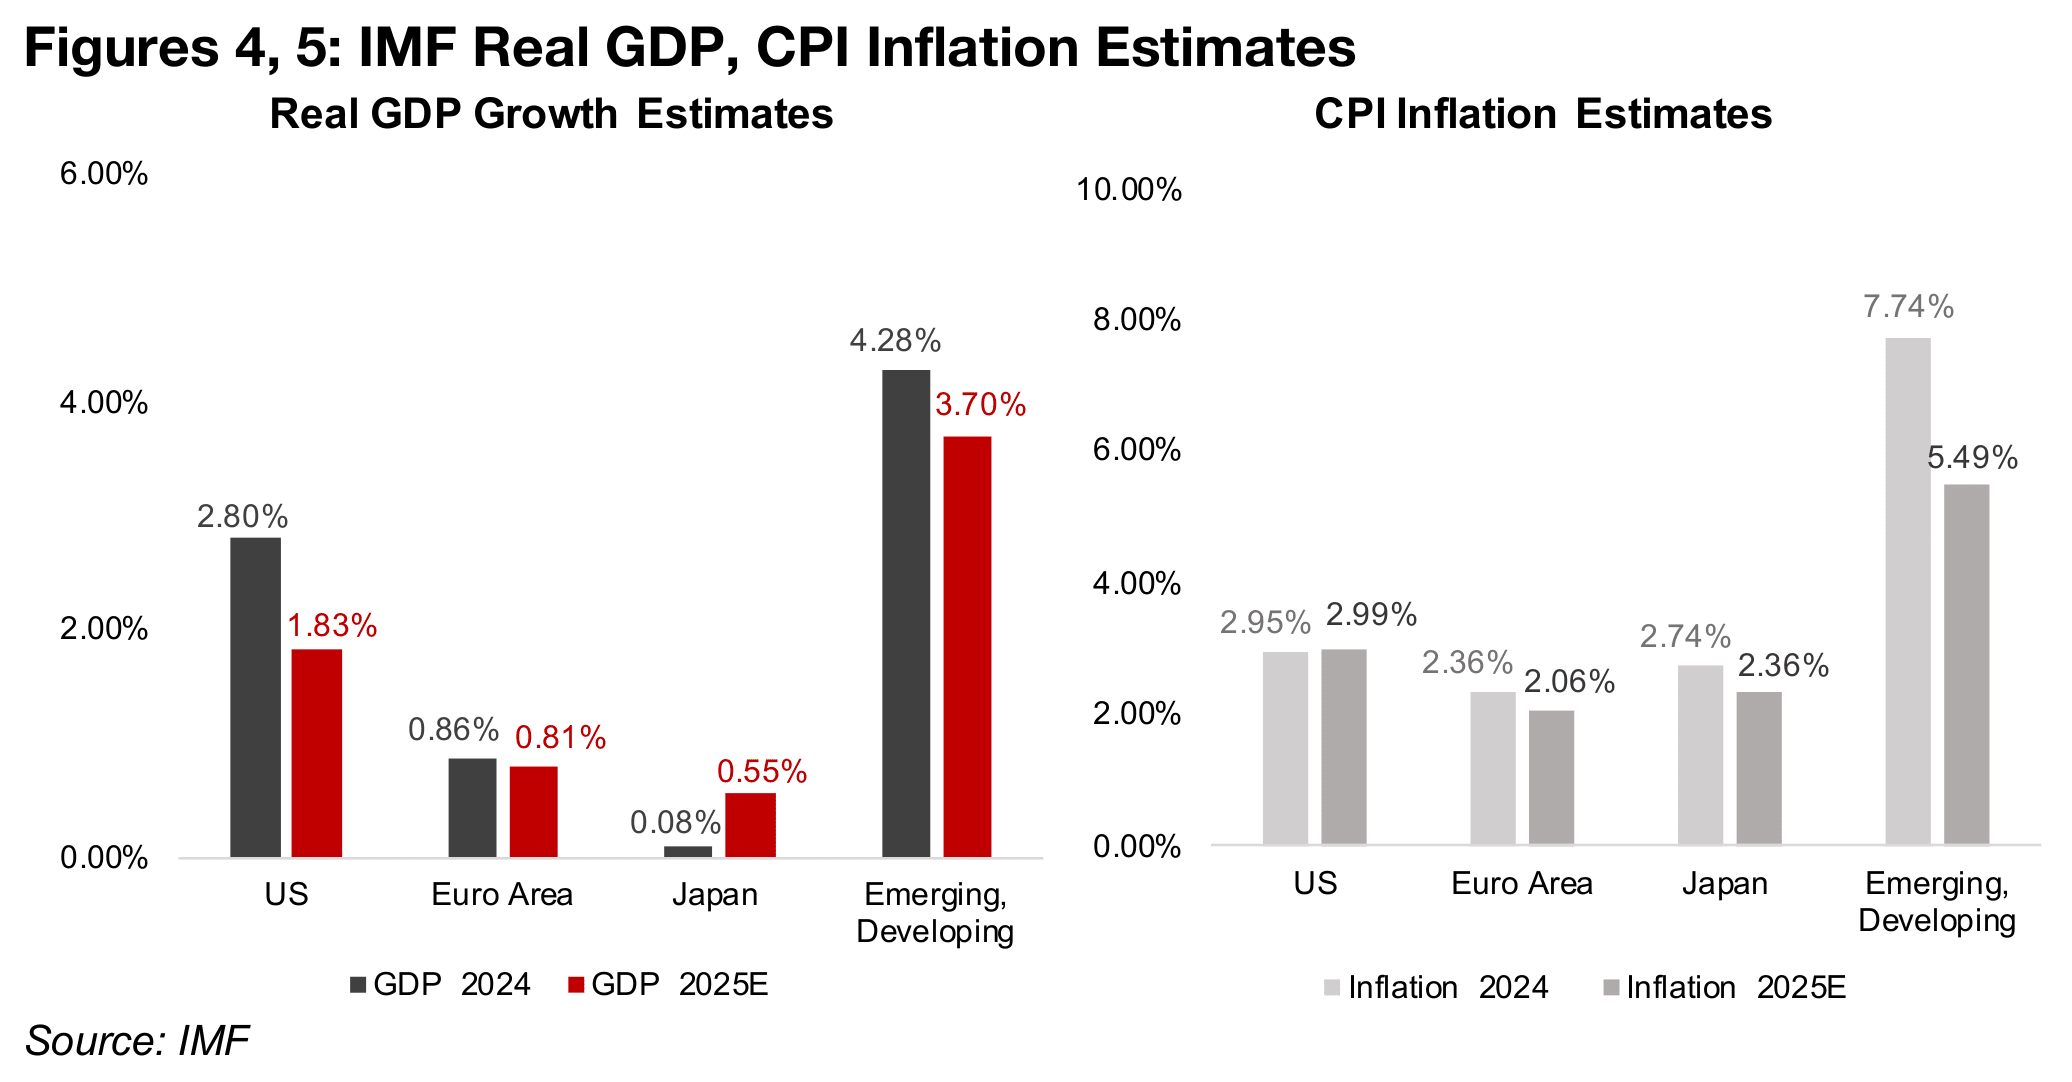
The question now is how much farther the risk on move can go, with yields elevated
and a slowdown in global growth and relatively high inflation expected for 2025. The
IMF forecasts a significant decline in US growth to 1.83% this year from 2.80% in
2024, with emerging markets also falling to 3.70% from 4.28% (Figure 4). Nearly flat
growth is expected for the Euro Area at 0.81% versus 0.86% last year, while Japan’s
growth is forecast to rise to 0.55% from near zero in 2024. Inflation is expected to
rise in the US, and decline in other regions, but remain relatively high (Figure 5).
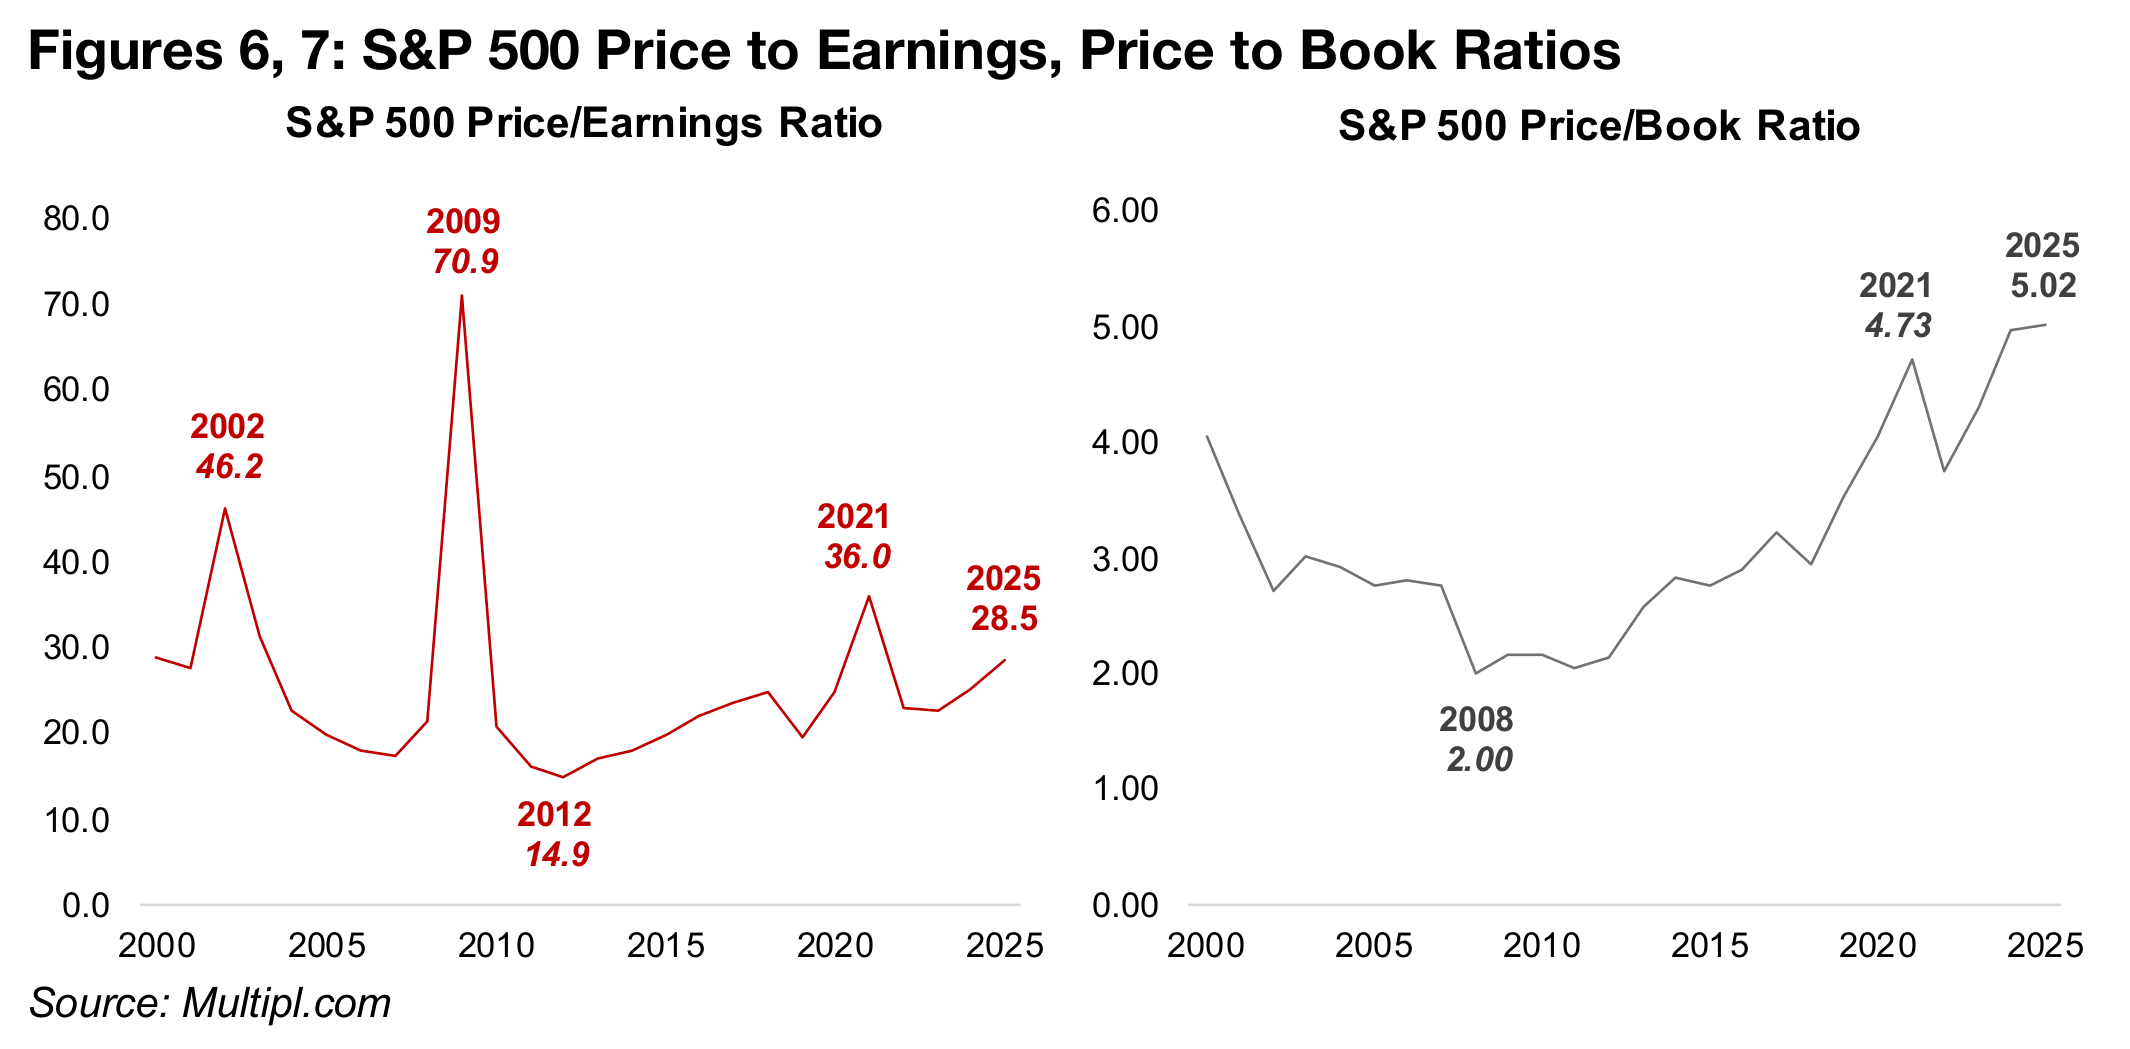
Valuations for US markets are also still looking high, with the S&P 500 price to earnings ratio at 28.5x, with it only higher during the extreme crises of 2021 of 2009, at 36.0x and 70.9x, and at 46.2x in 2022 following the dot.com bust (Figure 6). The S&P 500 price to book valuation at 5.02x is at its highest level ever, and has surpassed even the 4.73x peak in 2021 during the global health crisis (Figure 7). Combined with the uncertainty generated by US trade policy and still elevated geopolitical risk, the market rebound looks increasingly risky.
Theoretically a market reversal should drive a flight to safety and potentially lead to a
higher gold price. However, like the equity market, the ratios of the metal versus key
comparable assets like silver, copper, oil and commodities have become very high,
and far above historical averages. The market may see this as justified, backed by
stagflationary expectations for a major monetary expansion which will drive up gold
at the same time as an industrial slowdown drives down these other metals. However,
it could also be argued that the gold price has already more than priced in this
scenario, and is still poised for a pullback.
However, if the upward pressure of a flight to safety is balanced by the downward
pressure of extreme ratios versus other assets, gold could simply remain relatively
flat. This is precisely what we have seen for the past eight weeks. There was a similar
situation following the surge in gold in late 2019 and into 2020 as it moved out of the
2013-2018 gold bear market. From 2021 to late 2024, the price remained range
bound, making moves down towards US$1,700/oz and up towards US$2,100/oz but
continually reverting to an average around US$1,800/oz. It could well be that gold
has already begun a new extended range bound period, with recent trading indicating
at an average around the US$3,200/oz level, with potential lows somewhere under
US$3,000/oz and highs up to US$3,500/oz.
We view a rise in the global money supply as the main driver that could see gold
substantially rise above the current trading level. Gold is a currency at its most
fundamental, and therefore the value of the outstanding global stock to the global
money supply could be considered its main long-term fundamental indicator. As the
volume of the gold stocks grows at only about 2.0%, the balancing factor for this
ratio is movements in the gold price. While this ratio has become somewhat elevated
currently on the rise in the gold price, it is still far off its historical peak. Global central
banks have already been easing monetary policy for nearly a year, with the US the
last major central bank to start cutting rates. Such cuts generally correlate with a rise
in the global money supply, and a global economic slowdown, as already predicted
by the IMF, could see rates reduced further. This could in turn drive a higher global
money stock value and implies a rise in the gold price.
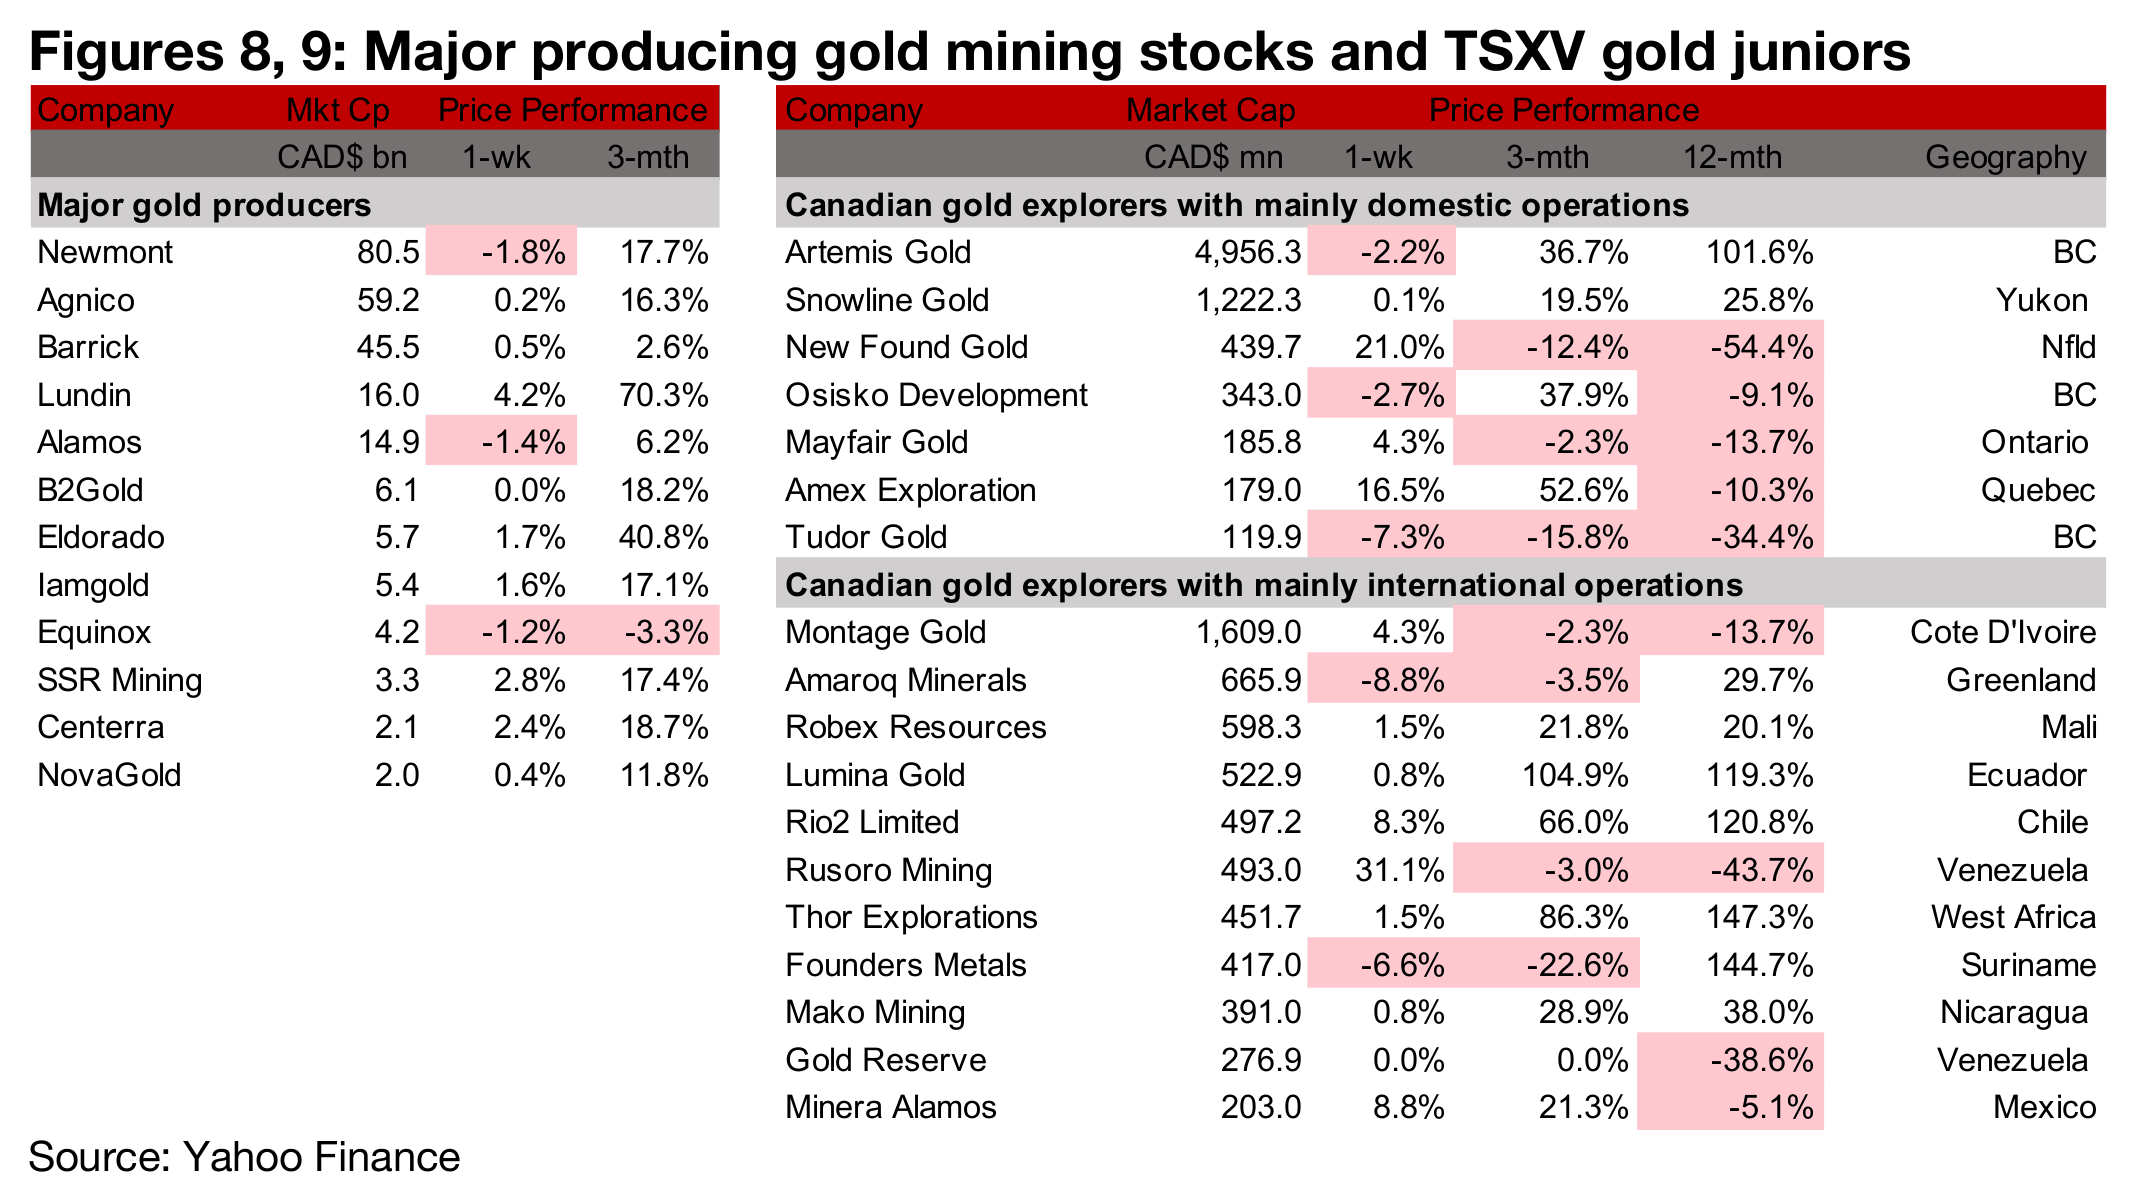
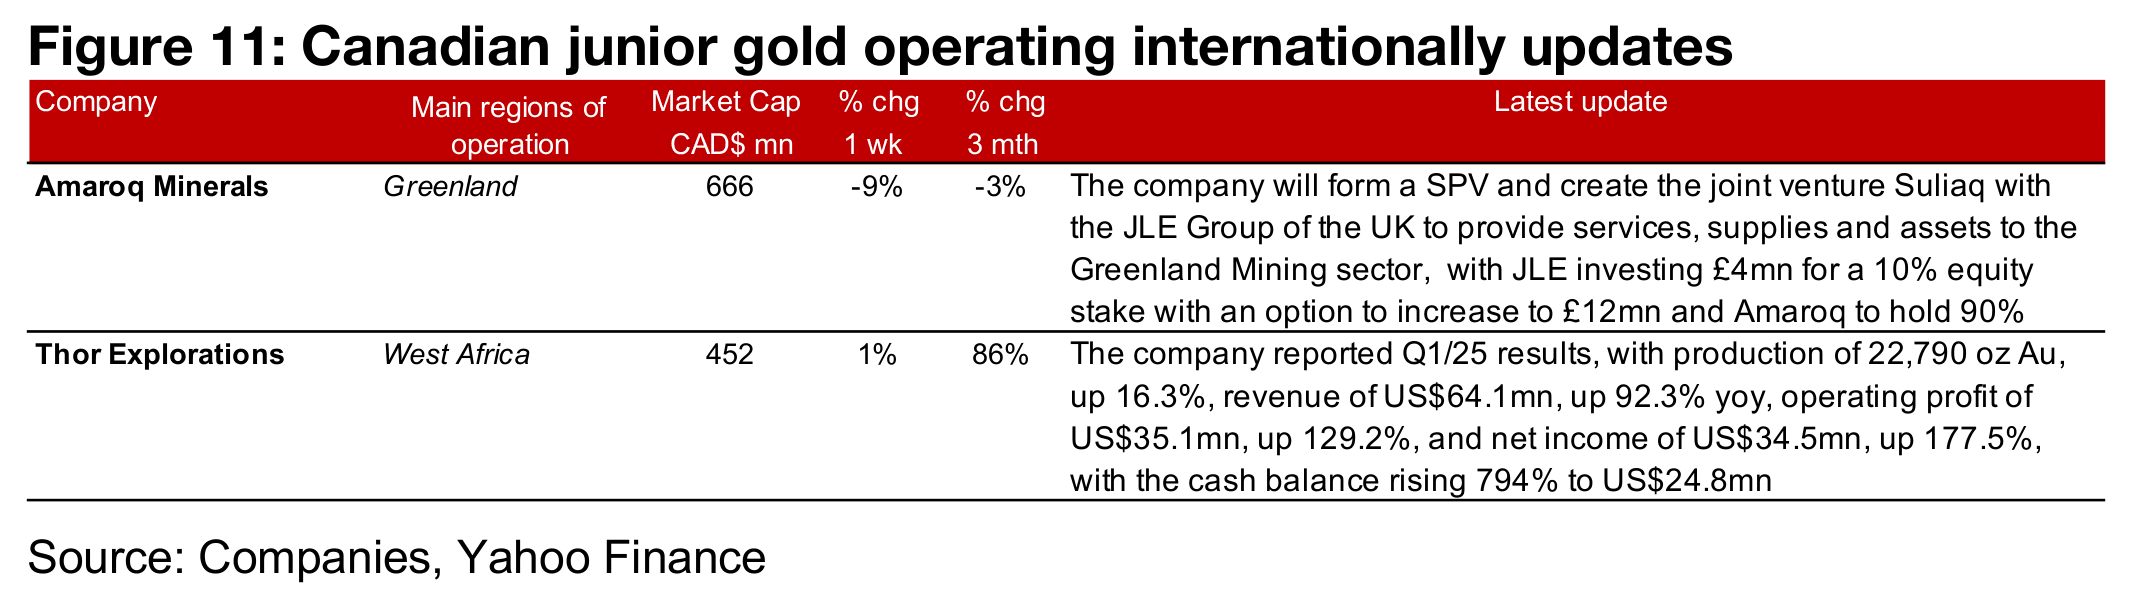
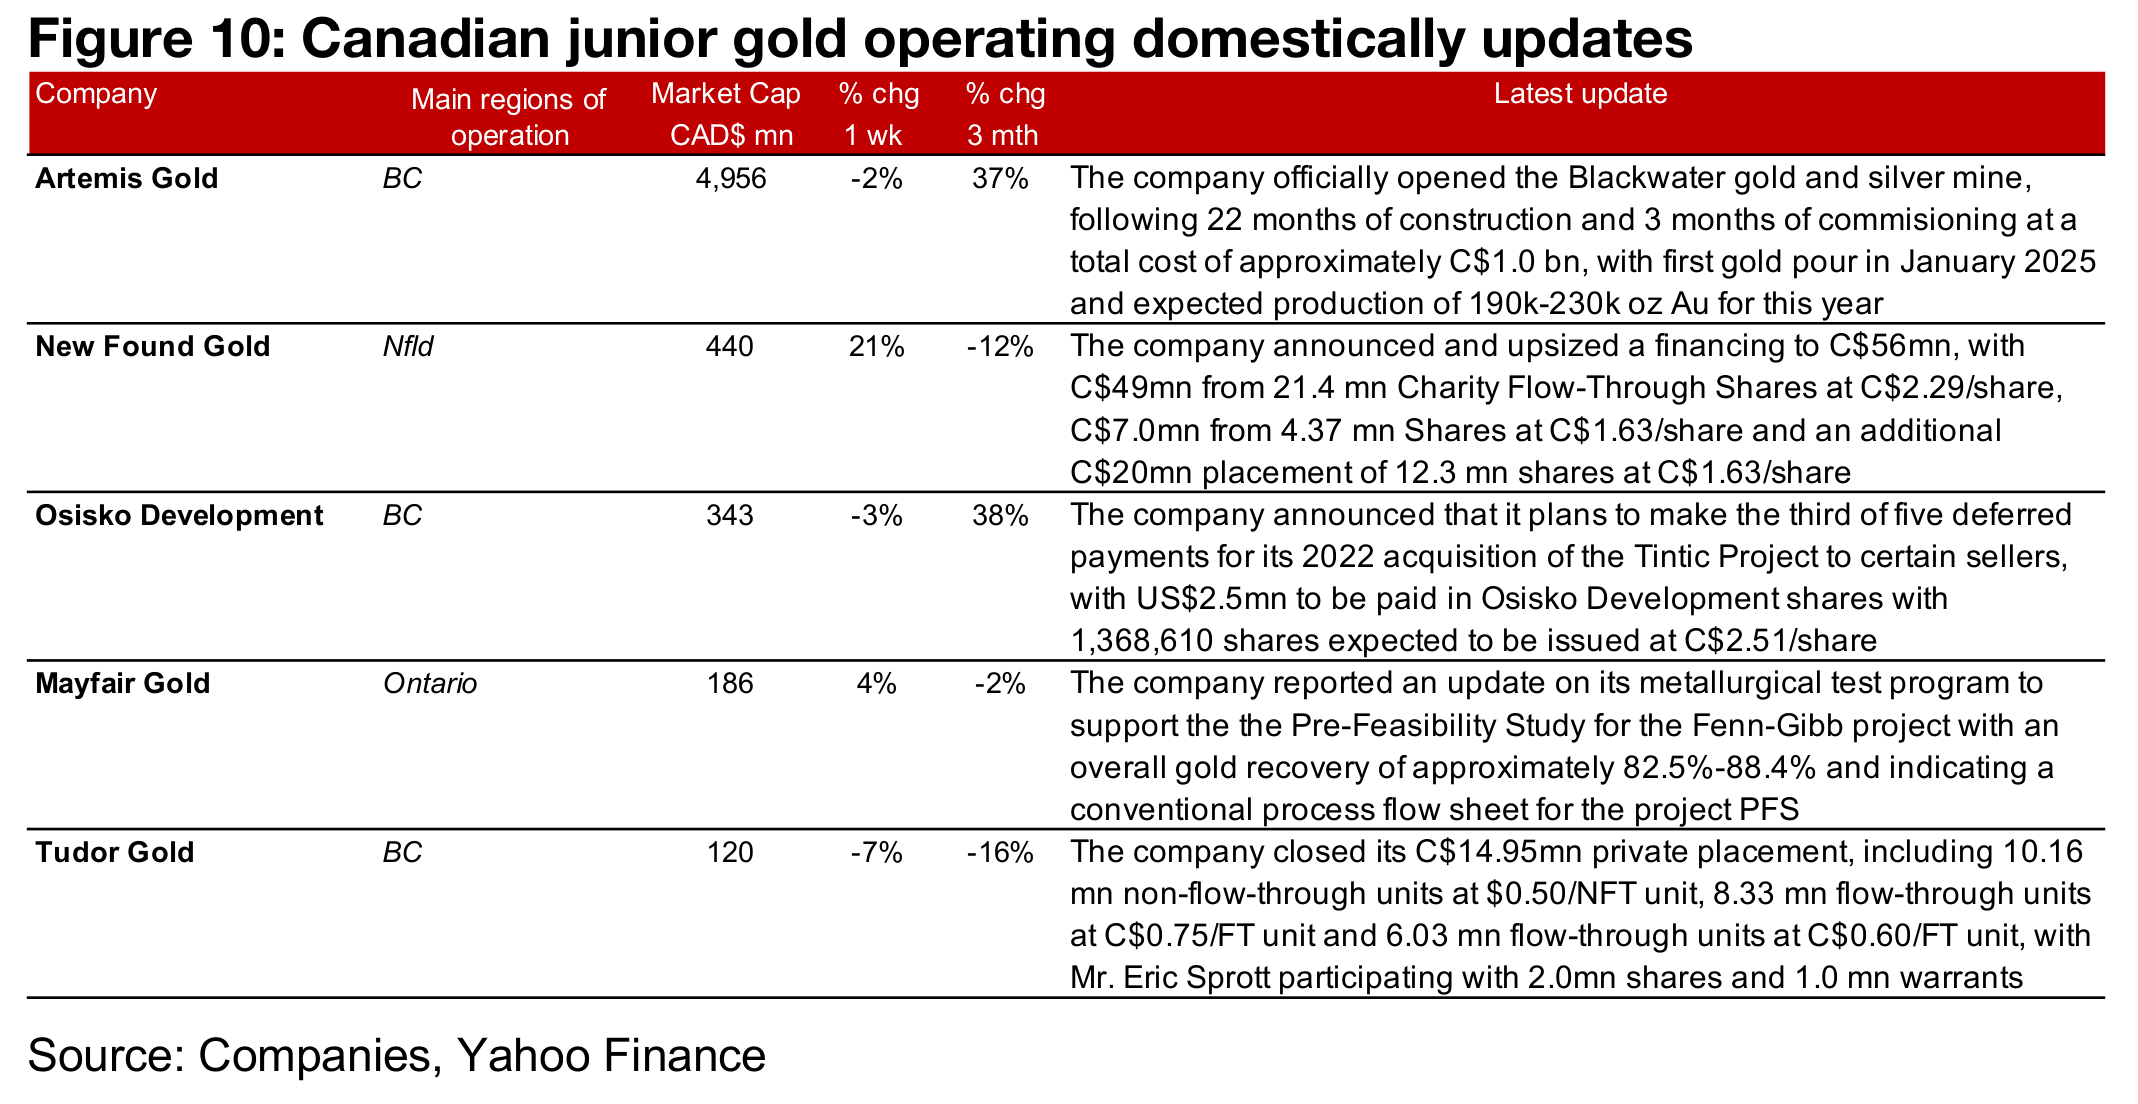
Most of the major producers and junior gold stocks mostly gained, although Newmont declined (Figures 8, 9) For the TSXV gold companies operating mainly domestically, Artemis officially opened Blackwater, New Found Gold announced an upsized financing of C$56mn, Osisko Development made the third of the five deferred payments for the Tintic acquisition, Mayfair Gold proved an update on its metallurgical testwork for the PFS for Tintic and Tudor Gold closed its C$14.95mn placement (Figure 10). For the TSXV gold companies operating mainly internationally, Amaroq announced it would form Suliaq, a JV with the UK’S JLE to provide services and assets to Greenland’s mining industry and Thor Explorations reported Q1/25 results (Figure 11).
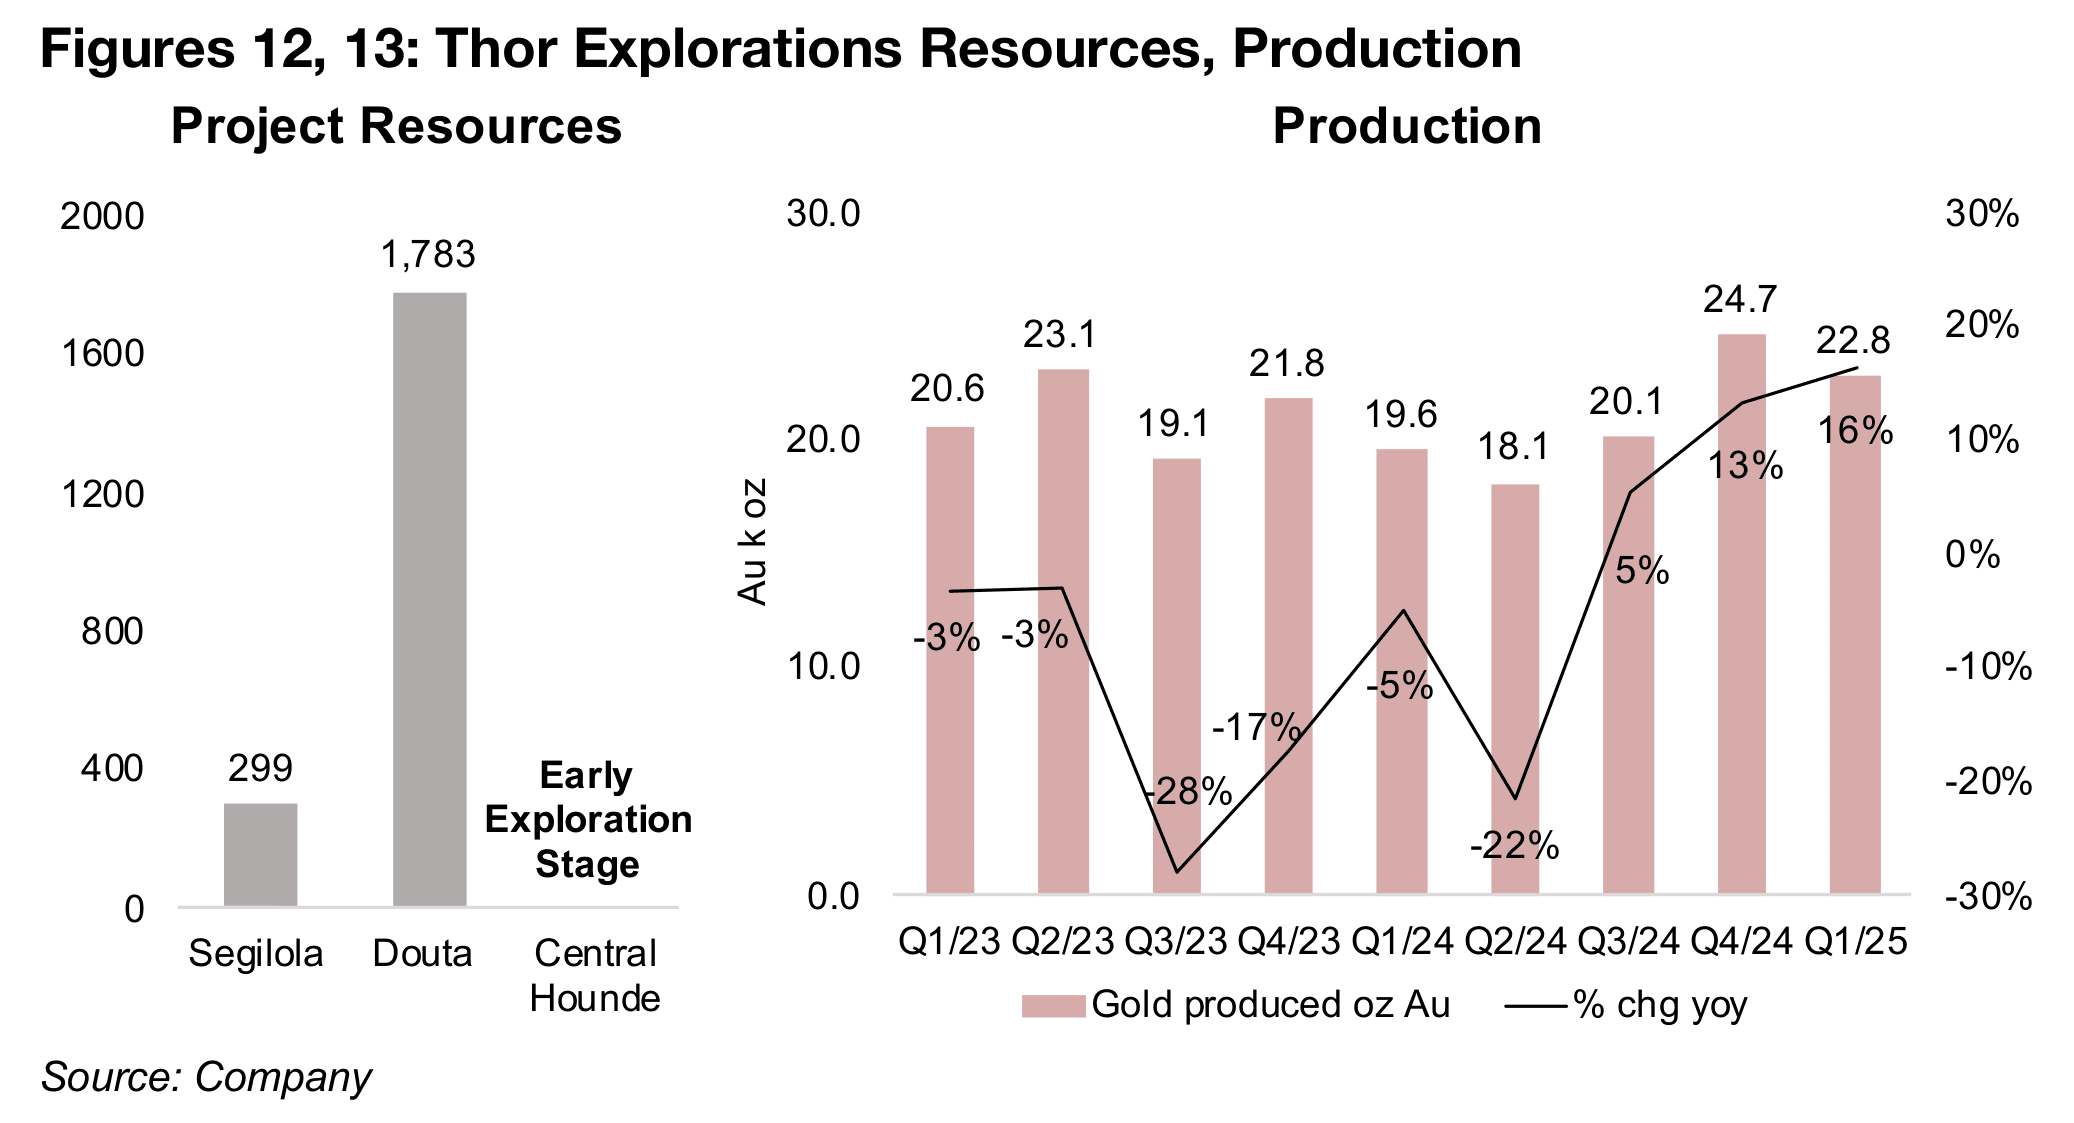
Thor Explorations has the highest production of the group of three TSXV gold
producers operating internationally, which also includes Robex Resources and Mako
Mining. This looks likely to continue based on Thor’s recently reported Q1/24
financials, with Robex and Mako not having yet released results. Thor operates three
main projects, the currently producing Segilola mine in Nigeria, although we estimate
that this mine only has about 0.3 mn oz Au remaining (Figure 12). This will make
bringing the Douta project in Senegal into production critical to Thor’s long-term
output, given 1.7 mn oz Au in resources, with drilling ongoing and a PFS targeted. It
is also exploring the early-stage Central Hounde project in Burkina Faso.
Robex operates the producing Nampala mine in Mali, with 0.8mn oz Au in Resources,
and the Kineiro project in Guinea, with 2.7mn oz Au in Resources, with an upgraded
Feasibility Study released in January 2025 and first gold expected by the end of this
year. Mako Mining operates the producing San Albino project in Nicaragua, with
0.4mn oz Au in Resources, and the development Moss and Eagle Mine projects, with
0.5mn oz Au and 1.8mn oz Au, respectively, in Resources.
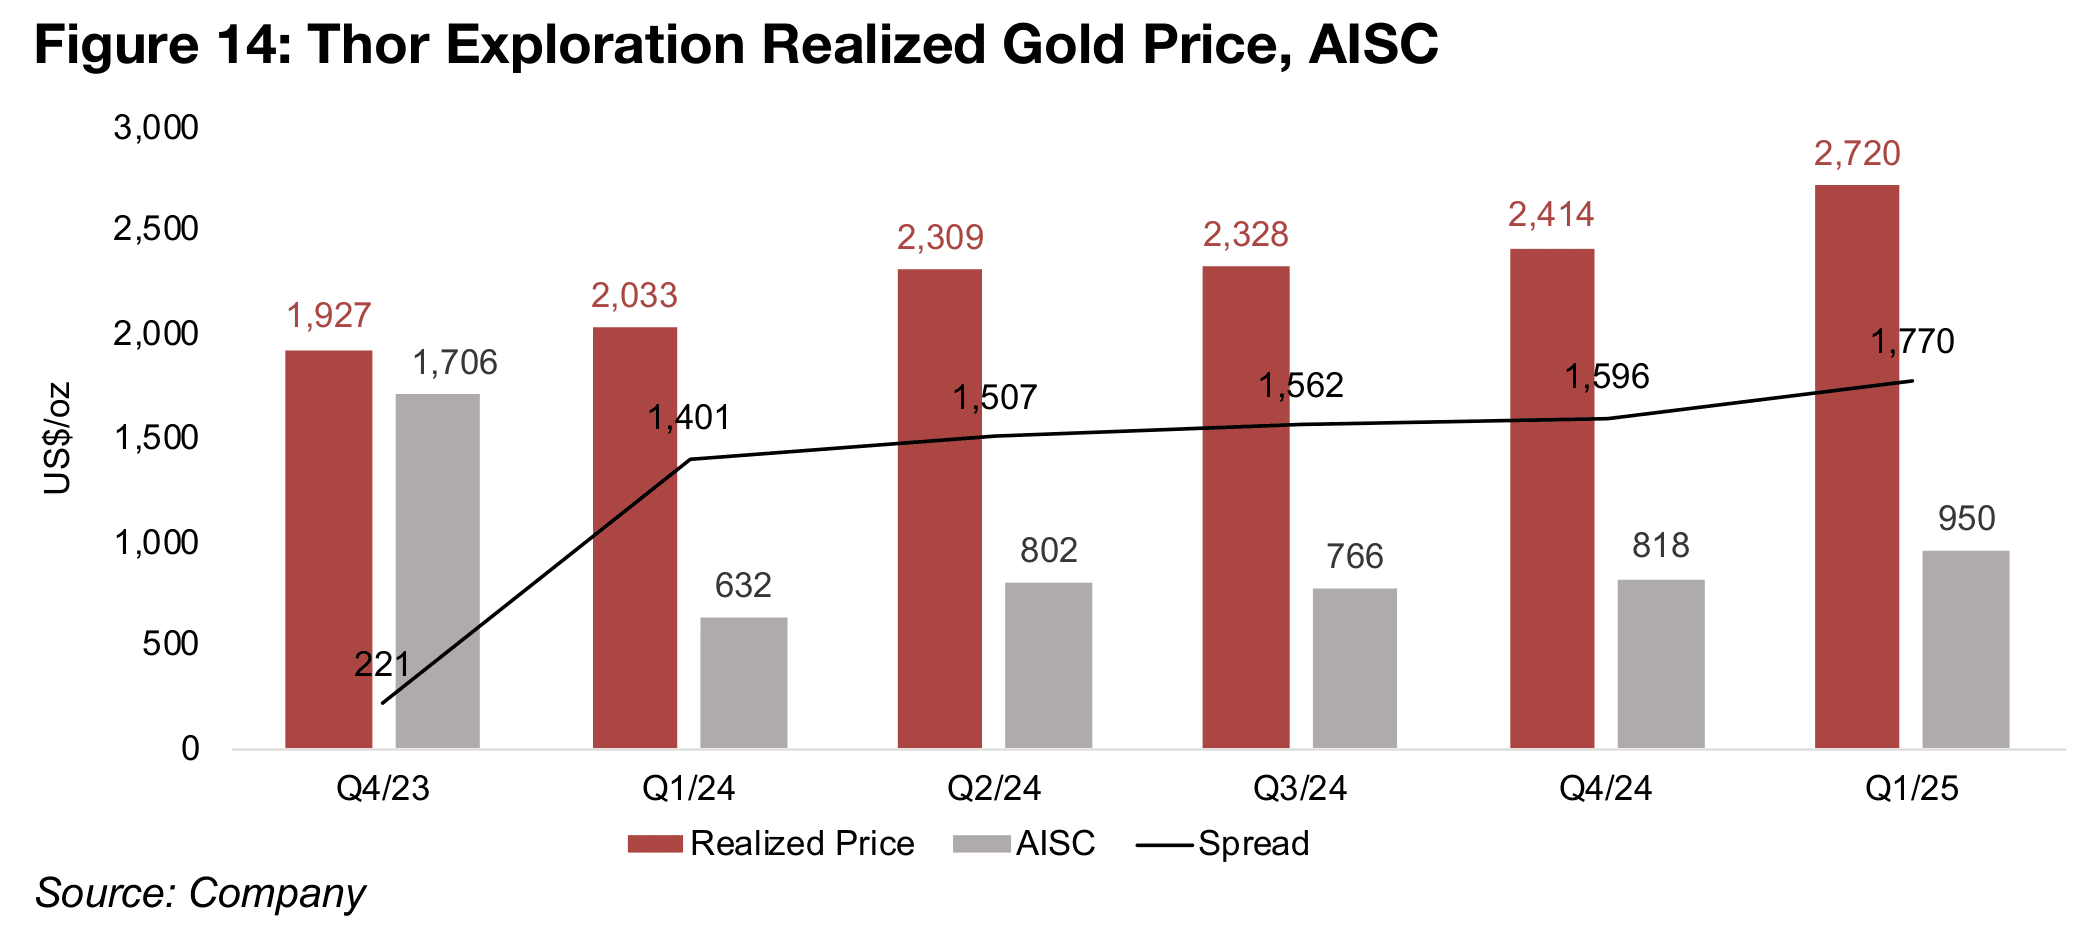
Thor’s production was 22.8 mn oz Au in Q1/25, down moderately off highs of 24.7 mn oz Au reached in Q4/24, but still up 16% yoy from 19.6 mn oz Au in Q1/24 (Figure 13). The realized gold price of US$2,720/oz was up 33.8% yoy, and while costs jumped with the AISC rising 50.3%, it was still relatively low at US$950/oz, given a low base in Q1/24 at just US$632/oz (Figure 14). This led to a widening of the realized gold price to AISC spread to US$1,770/oz, up 26.3% yoy from US$1,401/oz. This was also far above the very low US$221/oz spread of Q4/23, which was driven by a high US$1,706/oz AISC on exceptionally high cash operating costs.
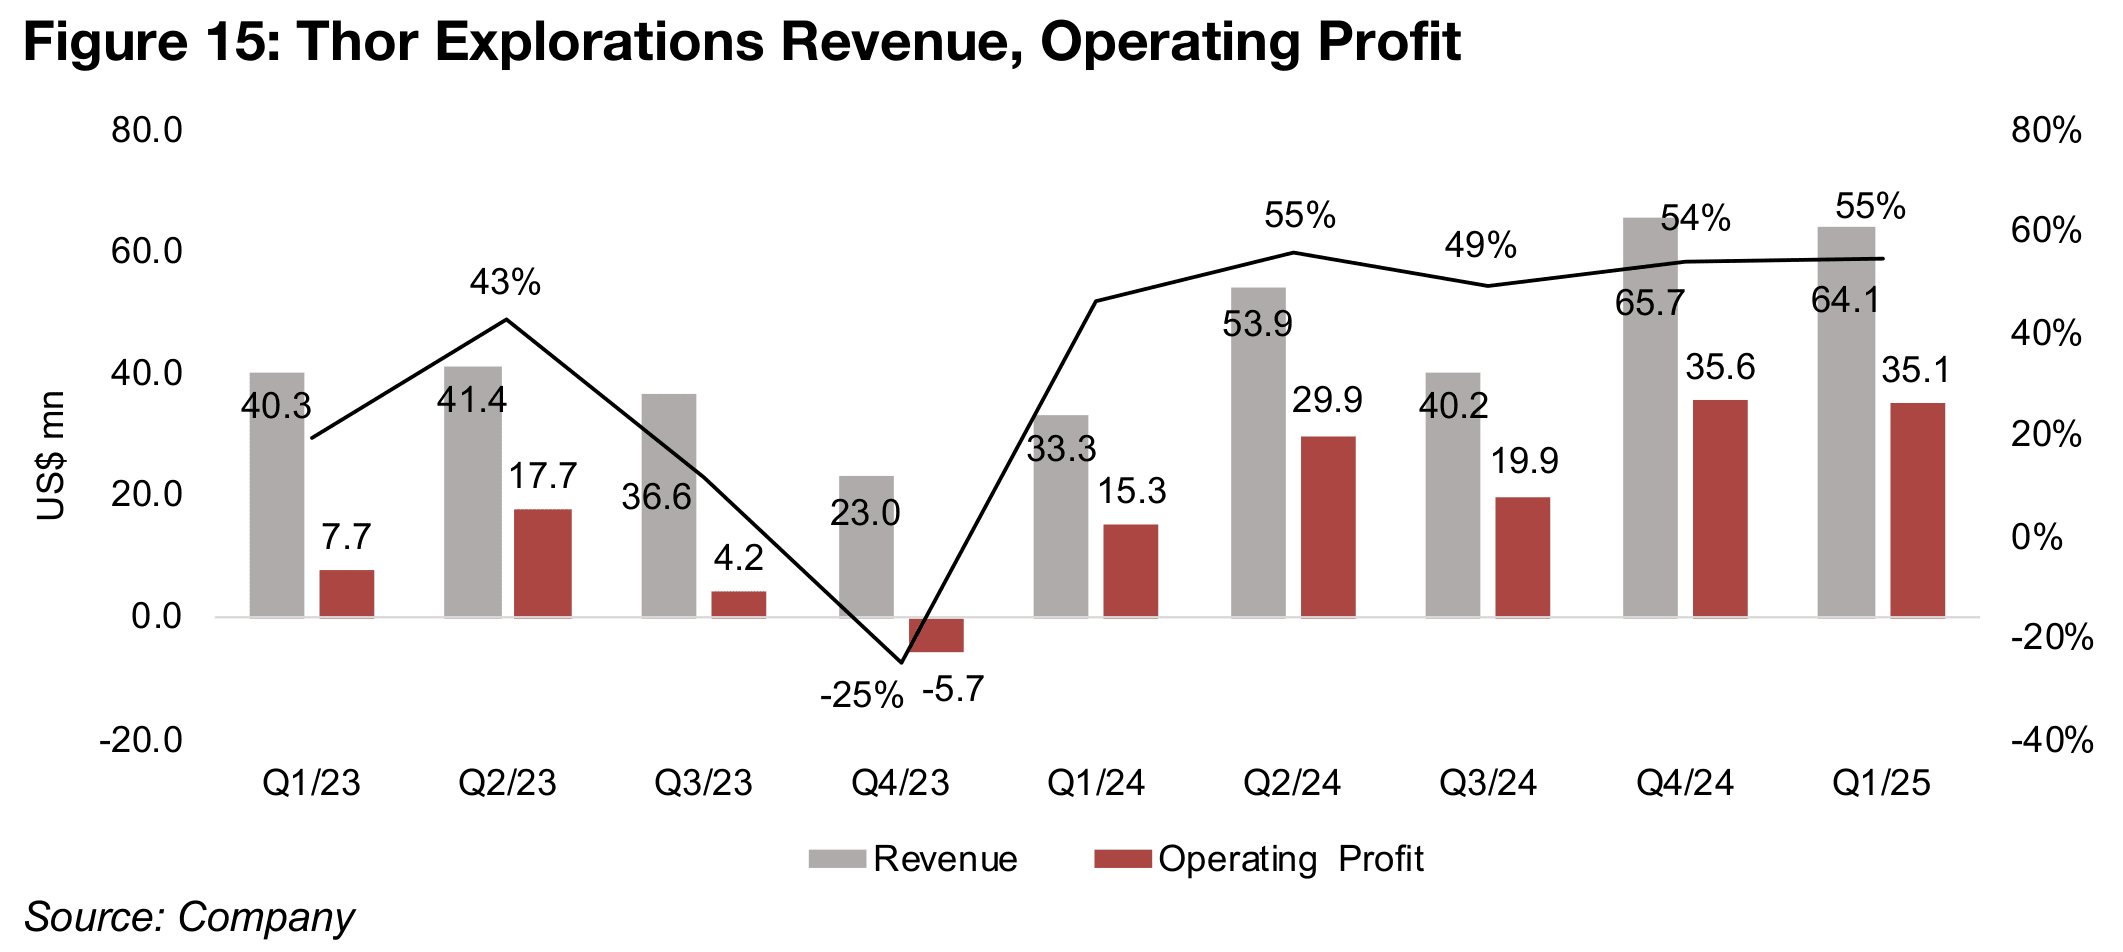
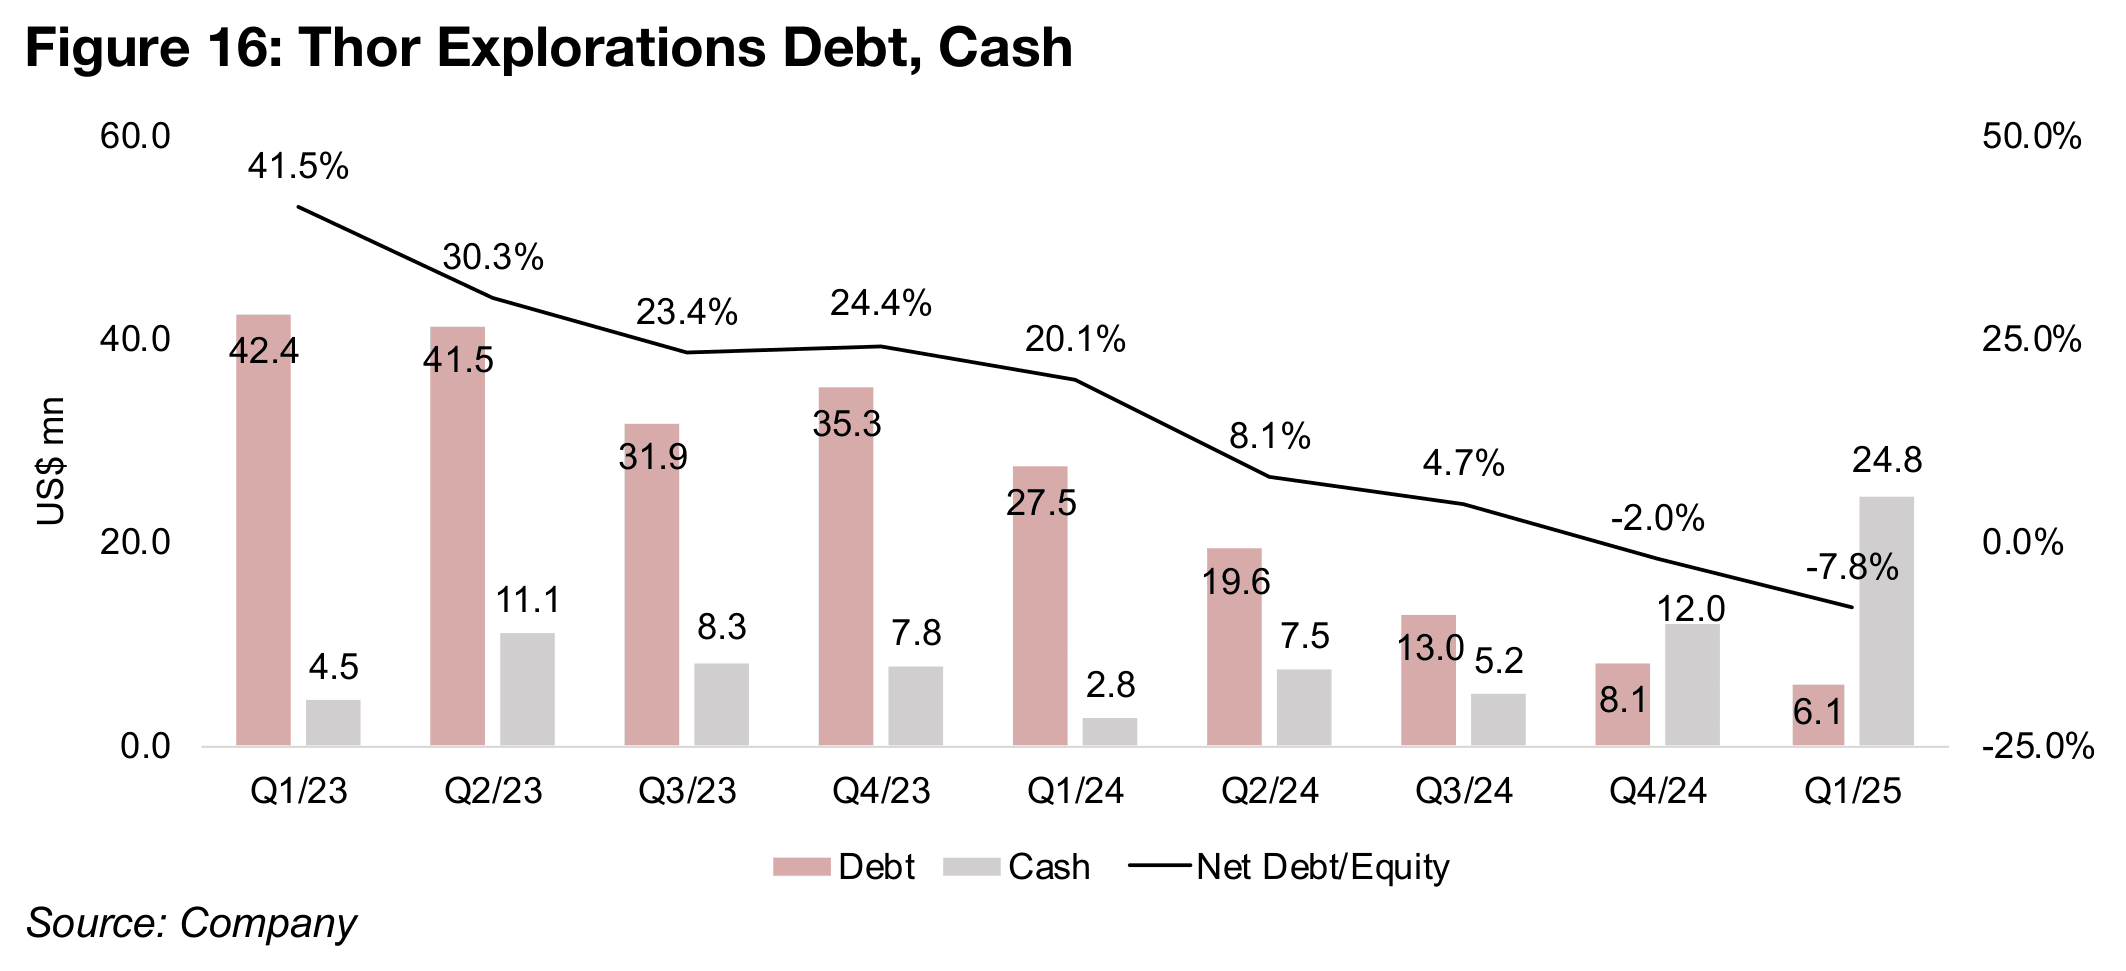
The rising production and gold price saw revenue jump 92.3% yoy to US$64.1mn, and operating profit rise 129.2% to US$35.1mn (Figure 15). However, the results were relatively flat versus the prior quarter, with revenue edging down -2.5% in Q1/25 as the qoq decline in production offset the 12.7% rise in the gold price. Operating profit also declined 1.4% qoq on the revenue decline and a 16.1% rise in the AISC (Figure 16). The balance sheet continued a two-year trend of improvement, with debt down to US$6.1mn, with all of this lease liabilities, and its remaining loans paid down in the quarter (Figure 16). With cash of US$24.8mn, net debt declined to US$-18.6mn in Q1/25, and the net debt to equity dropped to -7.8%, down from 41.5% in Q1/23.
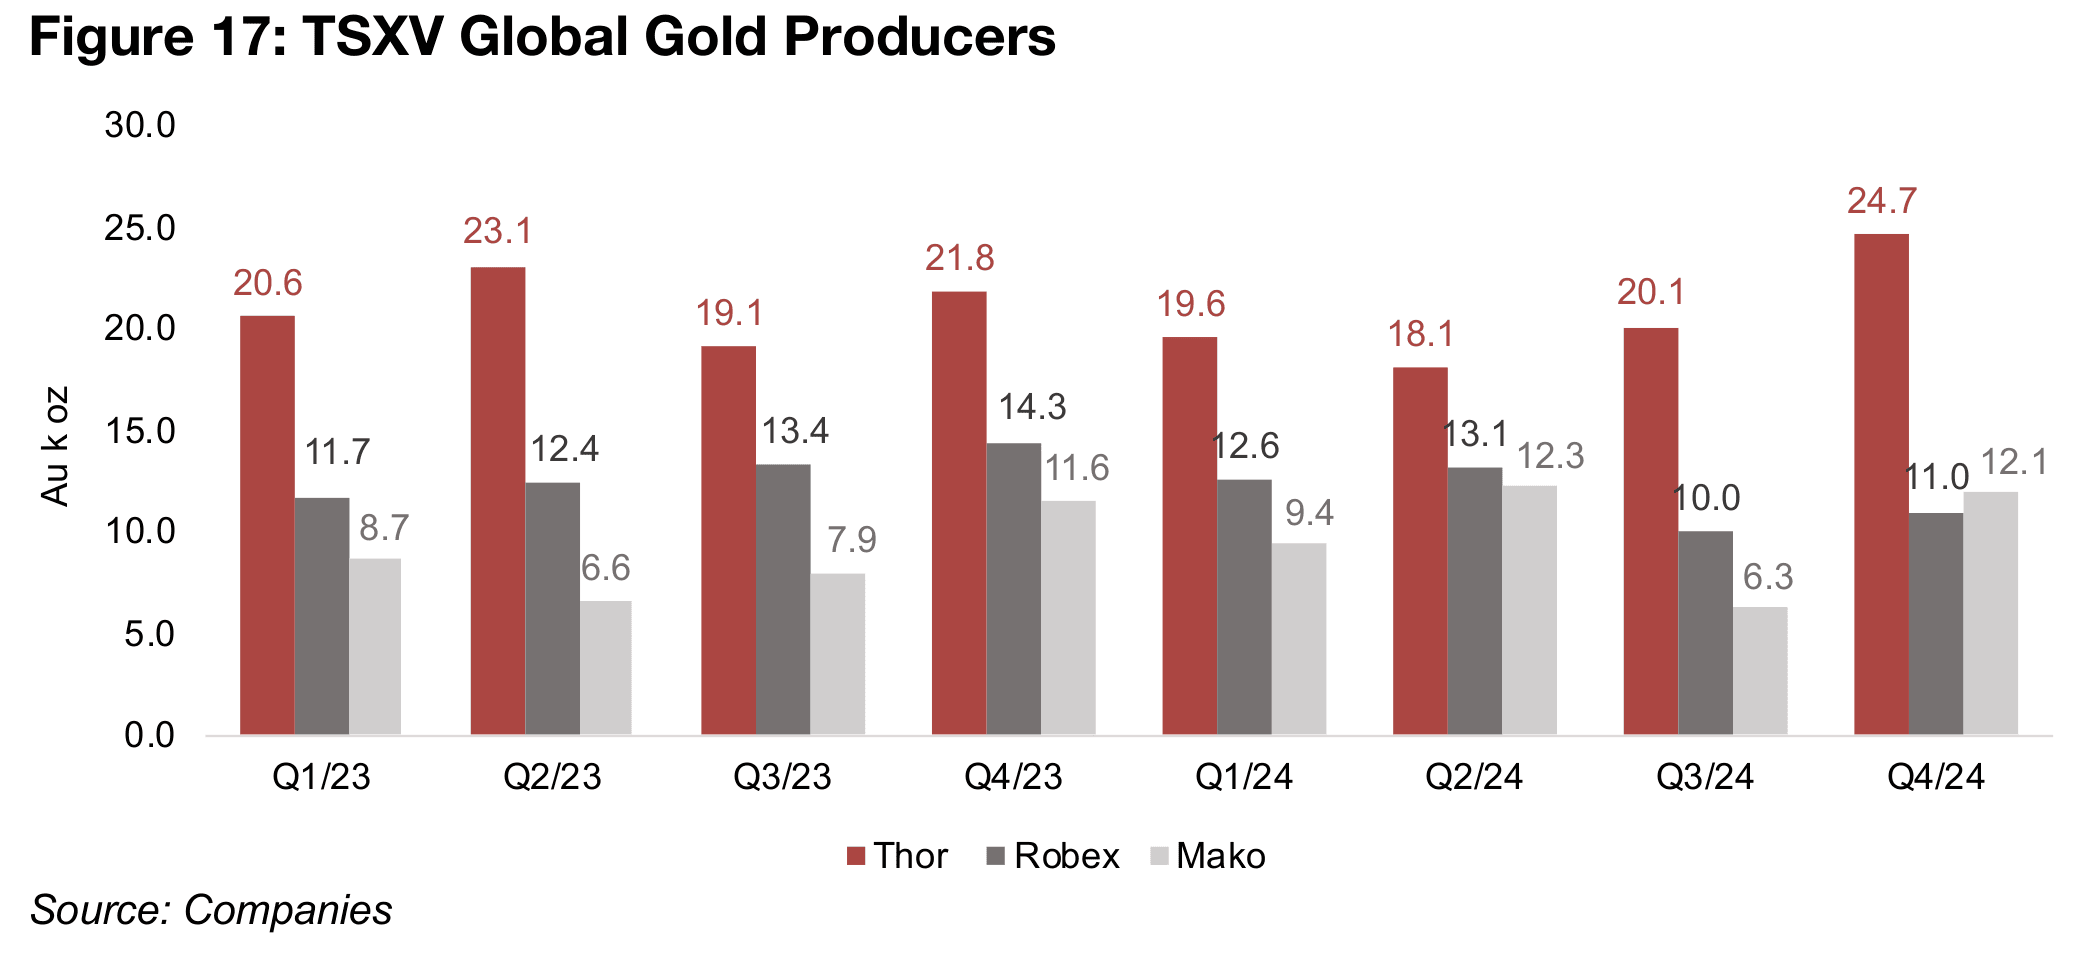
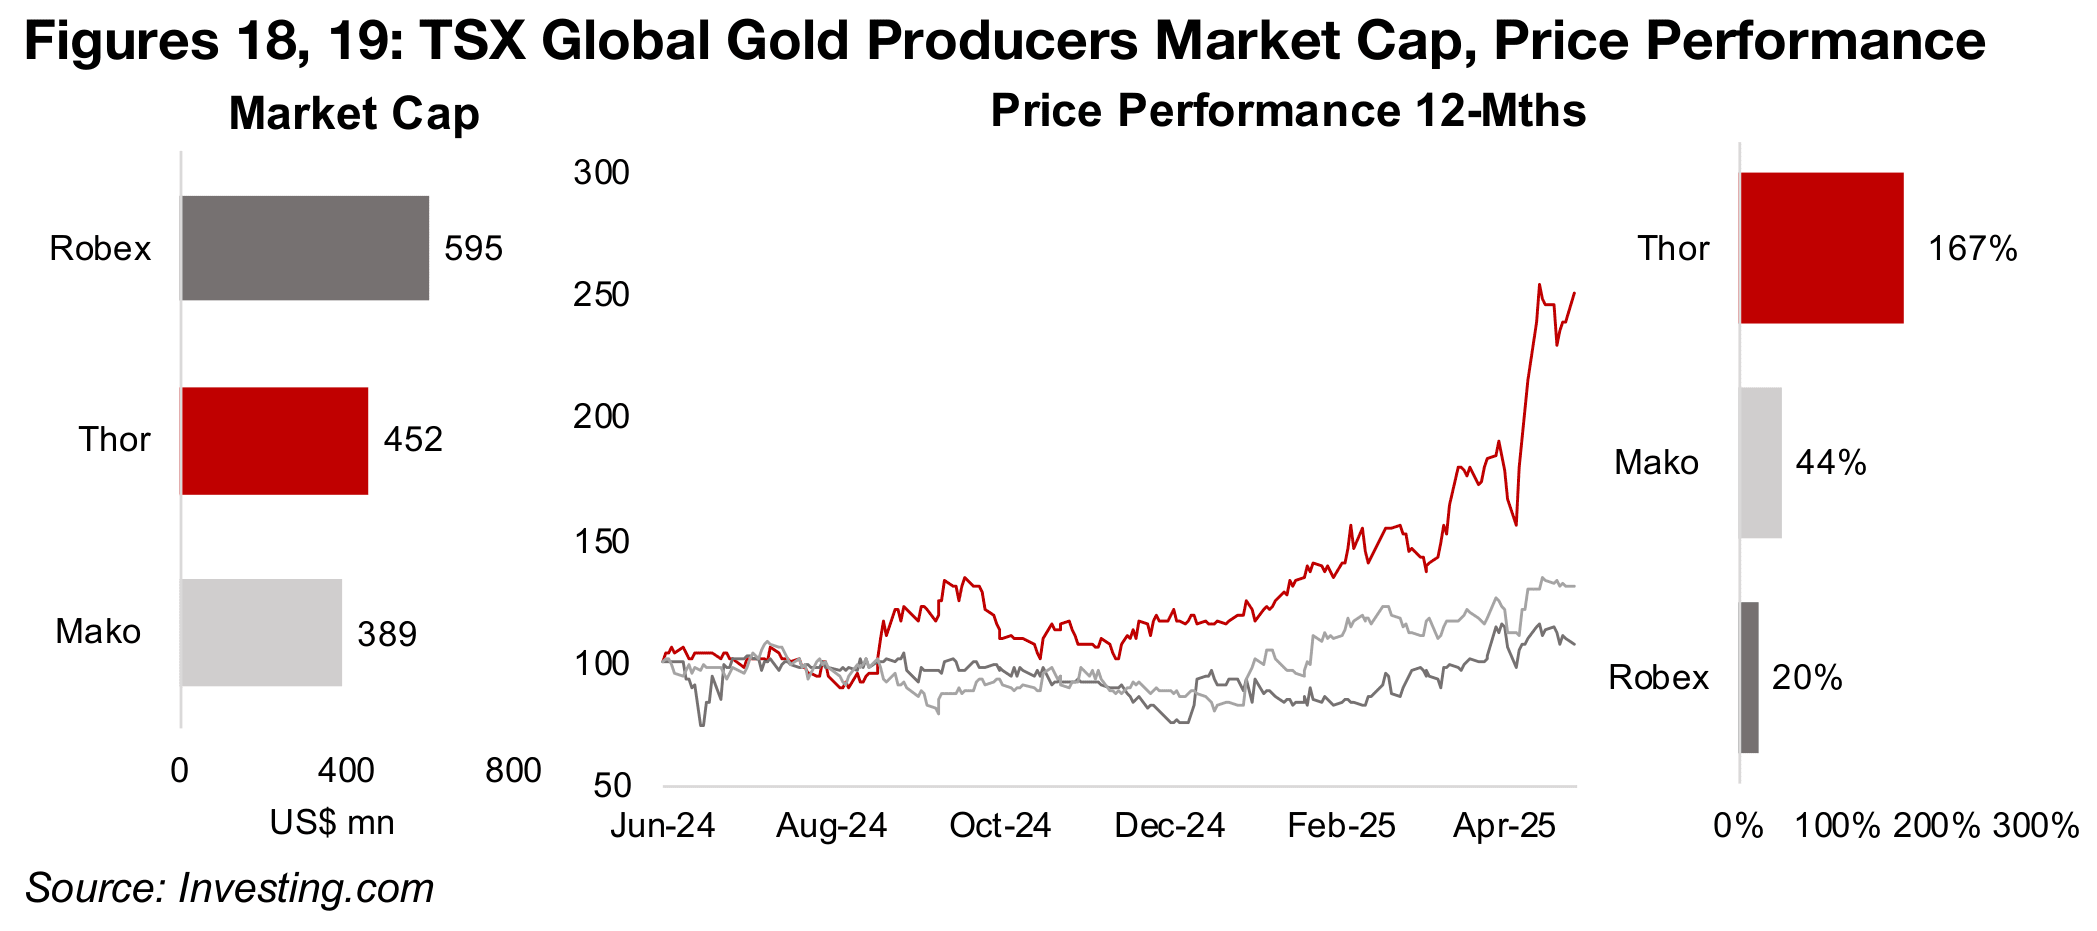
Thor’s production in Q4/24 of 24.7 mn oz Au was slightly above the combined level of Robex, at 11.0 mn oz Au and Mako, at 12.1 mn oz Au (Figure 17). While Robex and Mako have not reported Q1/25 results, we can expect that Thor’s production will continue to the highest of the three producers by far. Thor’s CAD$452mn market cap is in the middle of the TSXV global gold producers, below Robex’s CAD$595mn and above the CAD$389mn of Mako (Figure 18). However, its price performance has far outpaced both of these companies, with Thor up 167% versus 44% for Mako and 20% for Robex, driven by its strong operations and improving balance sheet (Figure 19).
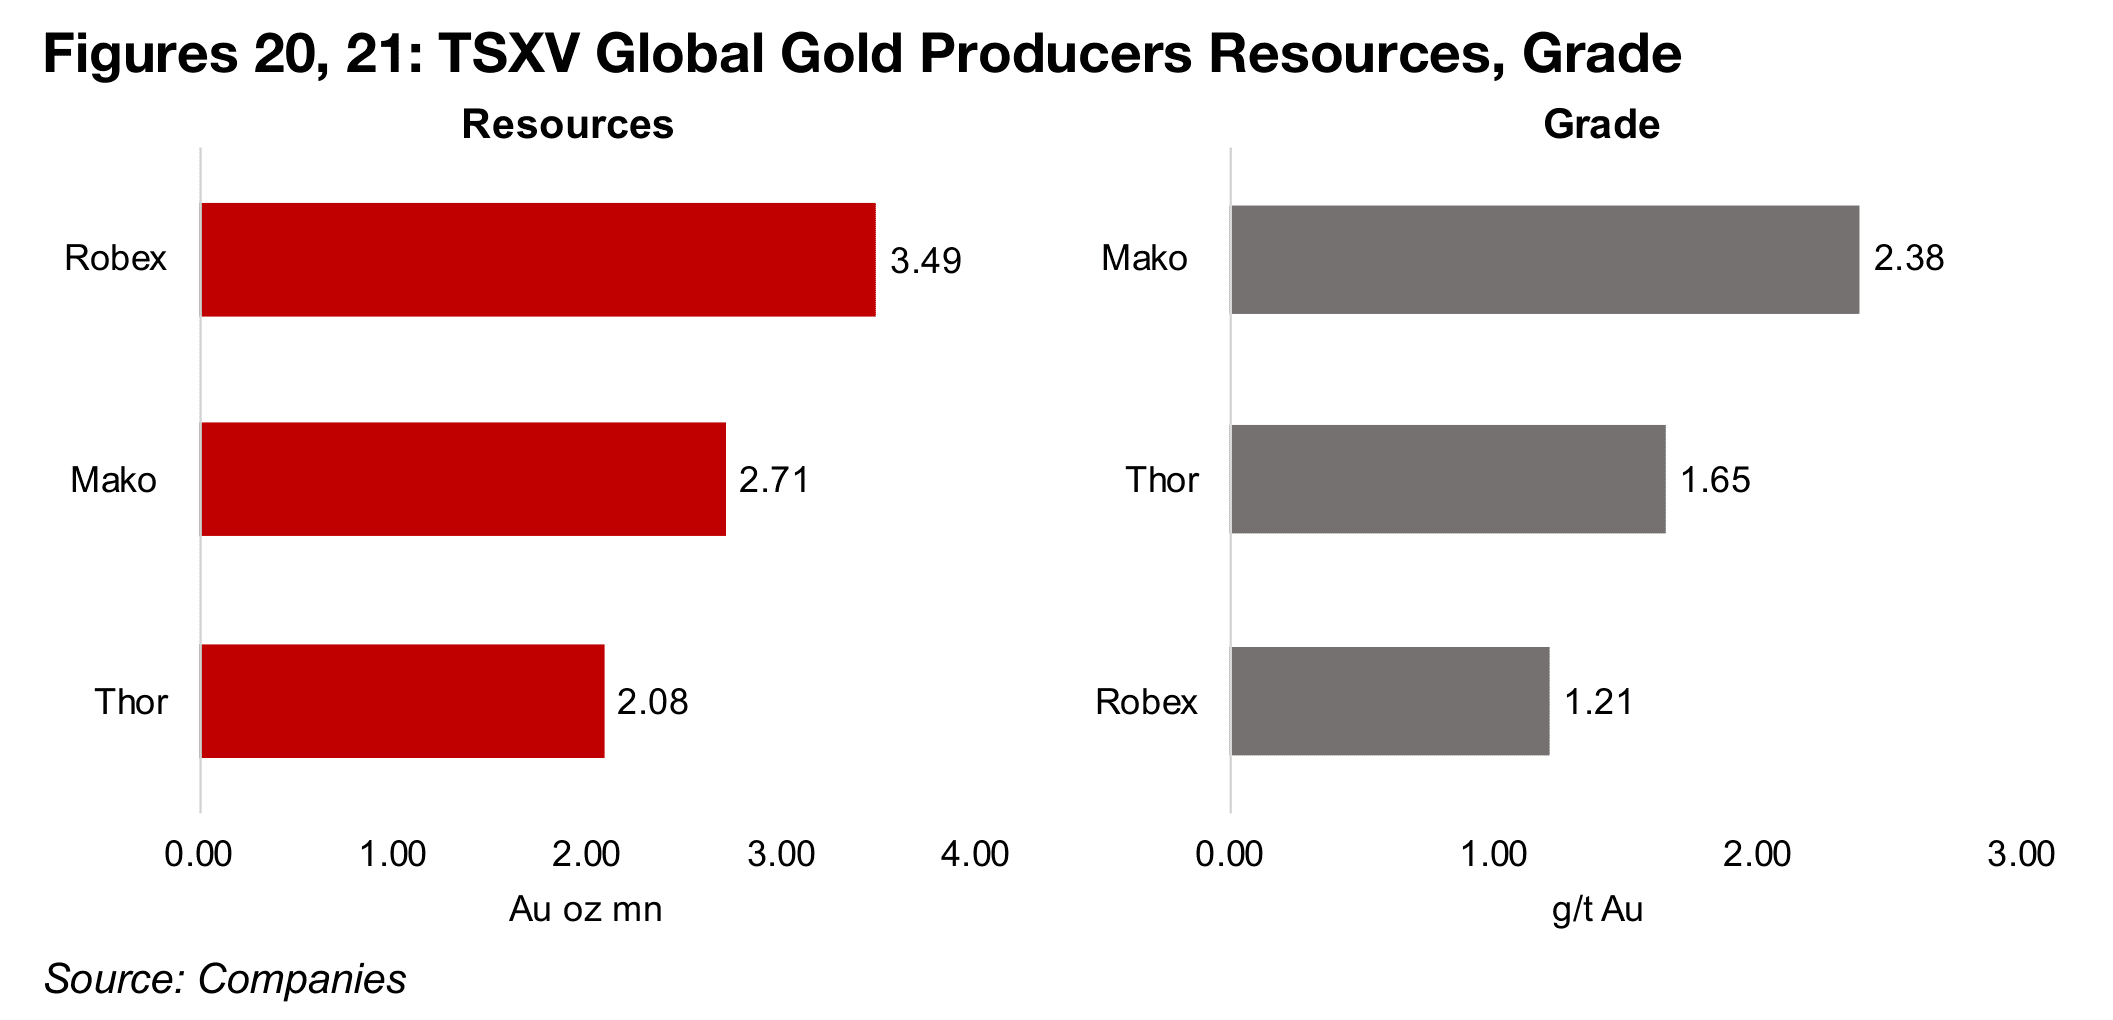
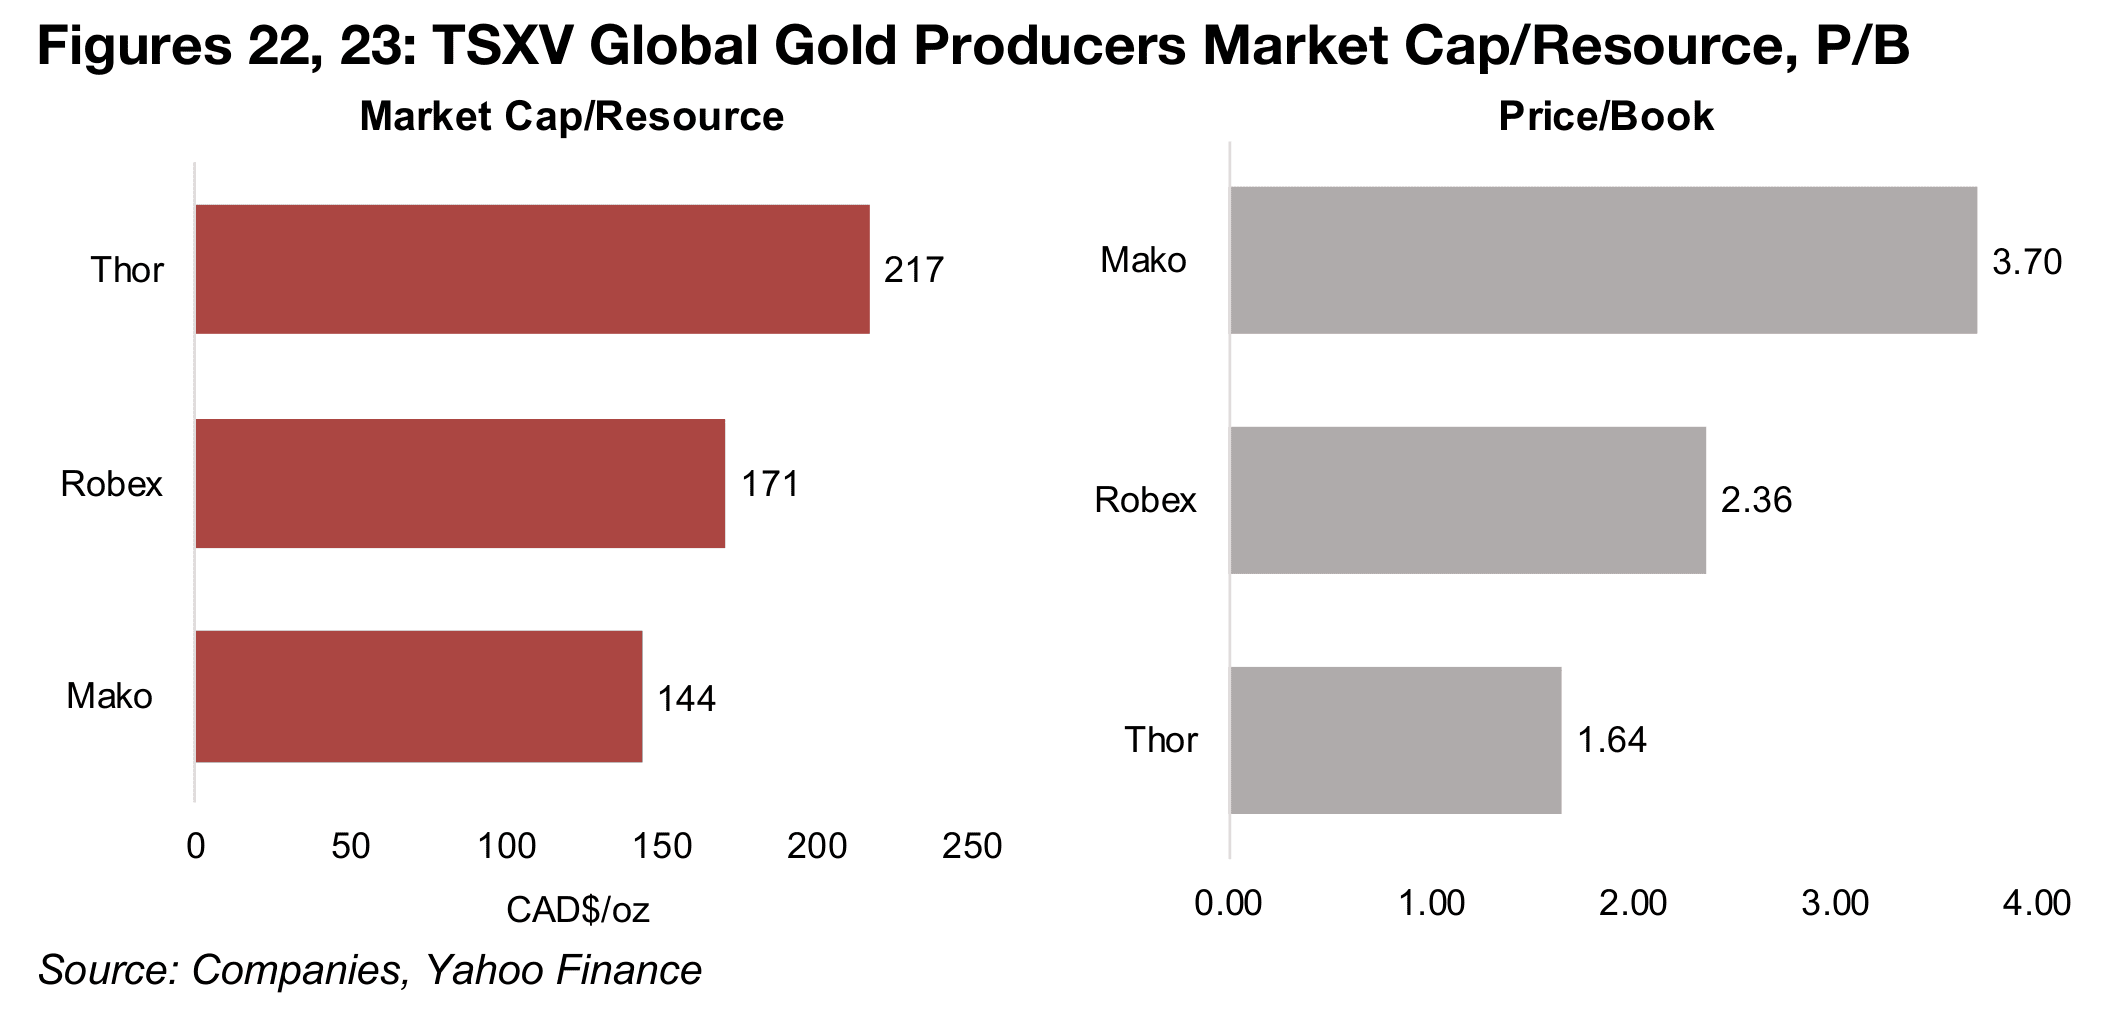
Robex has the highest Resources of the three, at 3.49 mn oz Au, versus Mako at 2.71 mn oz Au and Thor at 2.08 mn oz Au (Figure 20). Mako has the highest grade, at 2.38 g/t Au, with Thor at 1.65 g/t Au and Robex at 1.21 g/t Au (Figure 21). The market is paying the most per ounce for Thor, at a Market Cap to Resource of CAD$217/oz, with Robex at CAD$177/oz and Mako at US$144/oz (Figure 22). Mako has the highest price to book multiple, at 3.70x, with Robex at 2.36x and Thor at 1.64z (Figure 23).
Disclaimer: This report is for informational use only and should not be used an alternative to the financial and legal advice of a qualified professional in business planning and investment. We do not represent that forecasts in this report will lead to a specific outcome or result, and are not liable in the event of any business action taken in whole or in part as a result of the contents of this report.
Author
Ben McGregor authors the Weekly Roundup at CanadianMiningReport.com, providing sharp analysis of the metals and mining sector. With a talent for spotting trends, Ben distills complex market shifts into clear, engaging insights on TSXV junior miners. His weekly updates cover gold, copper, uranium, and more, blending data-driven perspectives with a knack for identifying opportunities. A vital resource for investors, Ben’s work navigates the dynamic junior mining landscape with precision.