May 26, 2025
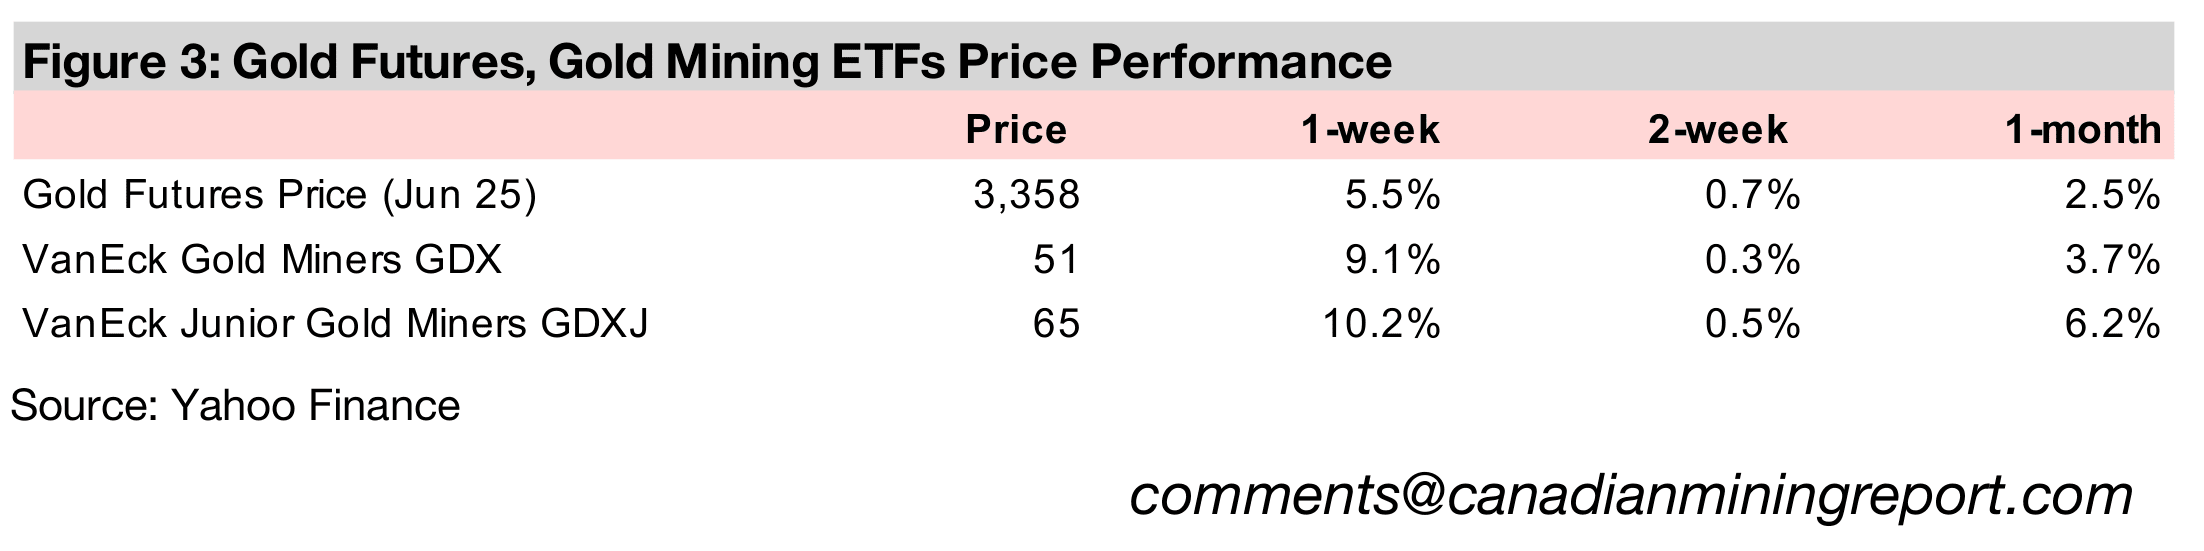
Gold jumped -5.5% to US$3,358/oz, near the top of a US$3,200-US$3,400/oz range that has held for the past seven weeks, as concerns again rose over global trade with the US administration suggesting 50% tariffs on the EU and 25% on Apple products.
This week we look at growth in major metals markets, with gold the largest, overtaking iron ore, and the increase in Canada’s mining shipment value, driven by rising gold production and prices, with copper down, and silver a small contributor.
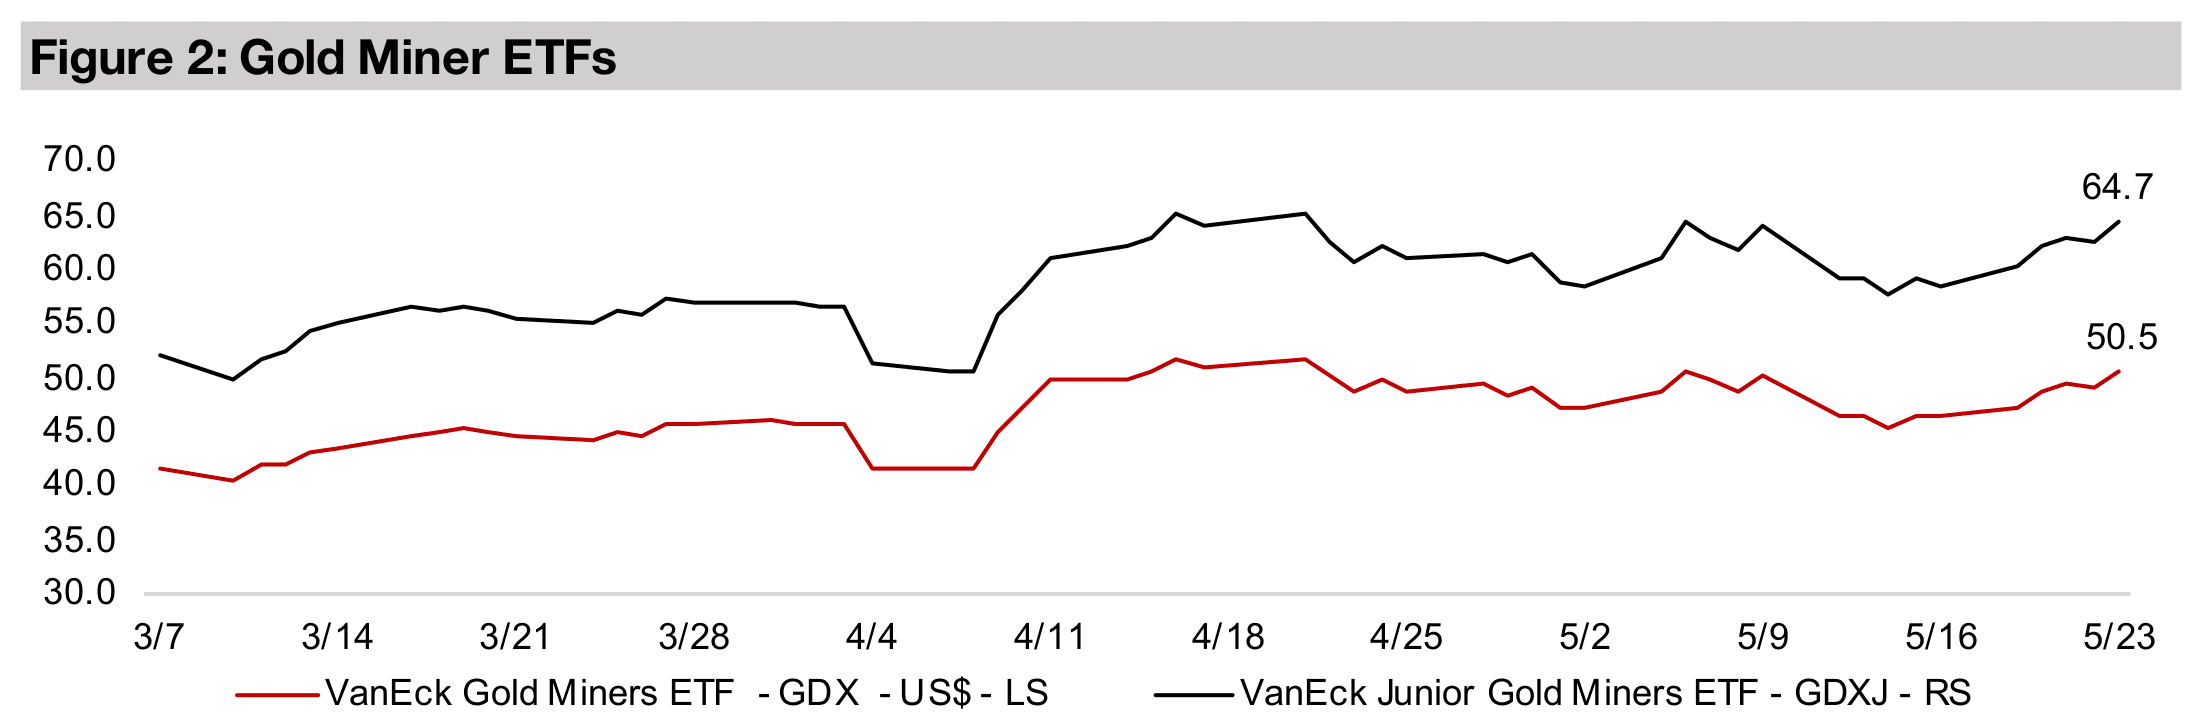
The gold stocks surged, with the GDX up 9.1% and GDXJ gaining 10.2%, on the rise in the metal price, as equities pulled back with the S&P 500 down -1.7%, while TSXV gold company Amex announced a 40.8% increase its Perron Resource estimate.


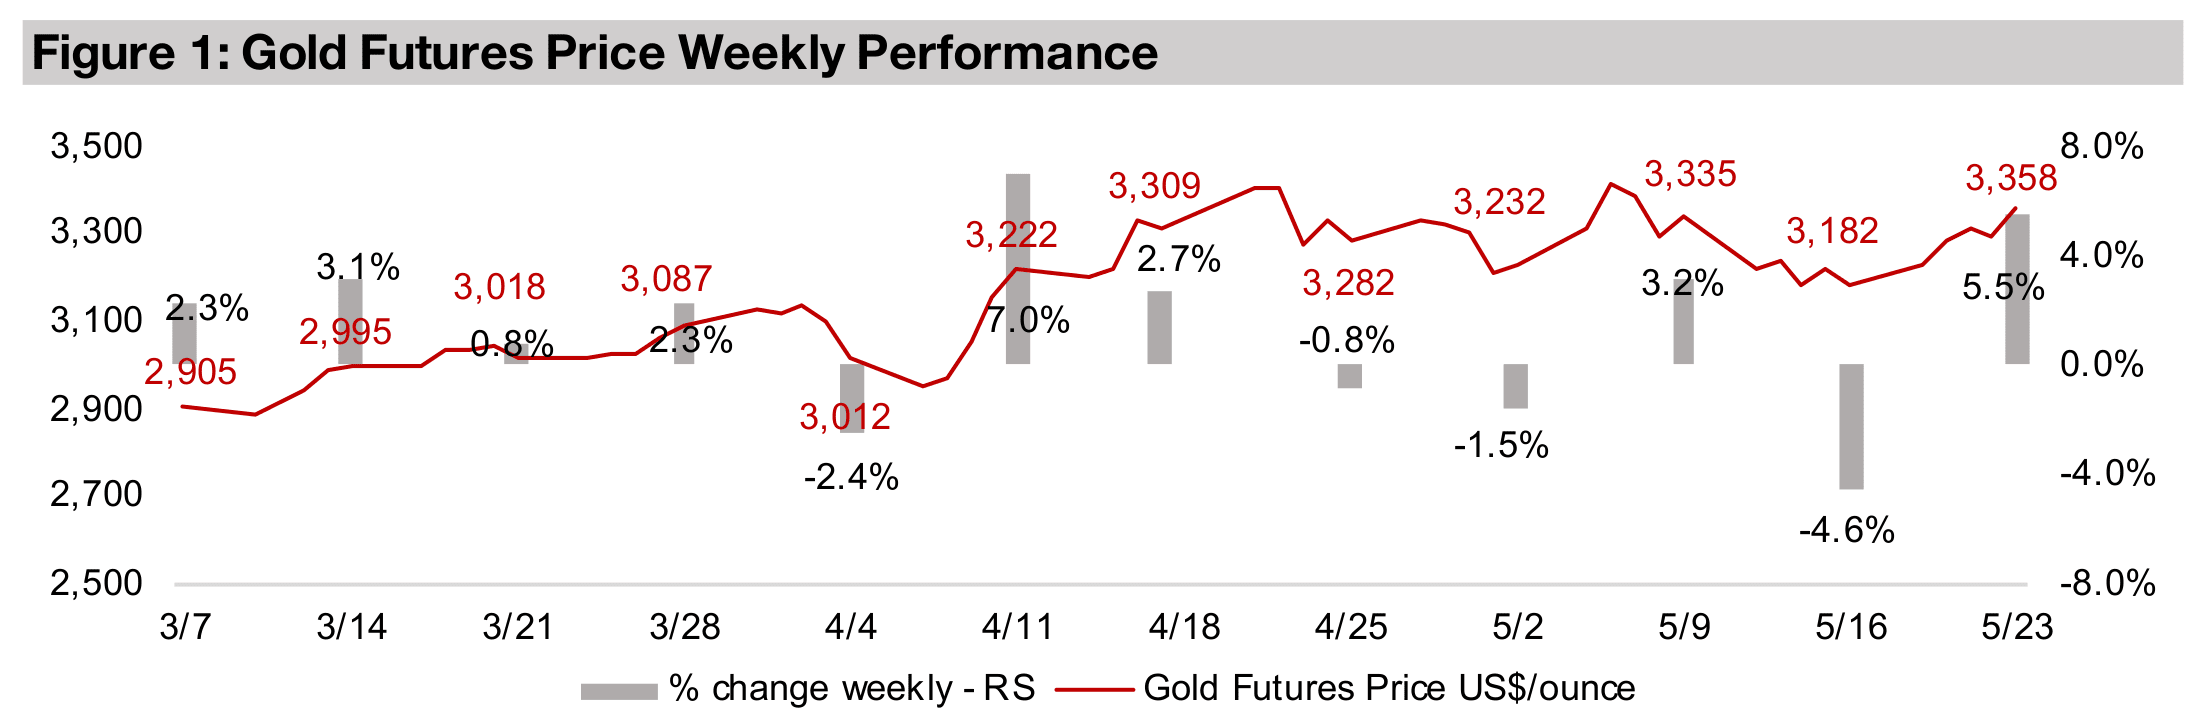
Gold jumped 5.5% to US$3,356/oz, which entirely reversed last week’s decline, and
saw the metal continue to trade in a range around US$3,200/oz-US$3,400/oz that
has persisted for seven weeks. The major driver was a rise once again in concerns
over global trade, with the US indicating it could apply 50% tariffs on the European
Union and 25% tariffs on some Apple products not manufactured domestically. This
targeting of the US’s largest trading partner and one of its largest companies drove
considerable volatility in markets.
However, the US government already pulled back on these proposed measures over
the weekend, announcing it would pause the EU tariffs for ninety days. This has been
typical of the new administration, with a negotiating style of leading with an initial
extreme proposal, only to then ease the severity substantially, and often quite quickly,
from the original announcement. Previous threats of huge tariff increases against
other countries, including China, another major US trade partner, have been resolved
with far lower levels than originally proposed.
Stock markets pulled back on the news after a strong month of gains, with the S&P
500 down -1.7%, Nasdaq off -1.0% and Russell 2000 falling -2.0%. Gold stocks
surged, with the GDX up 9.1% and GDXJ up 10.2%, and both back just below late-
April 2025 highs. However, this was not a typical flight to safety with respect to the
U.S. dollar, which would be expected to rise in a major risk-off move, but actually
declined. The US$ has struggled this year, even during periods of rising equities, as
global markets remain on edge from the big swings in US trade policy. This has raised
some concern over whether the dollar will retain its traditional safe-haven status.
The US 10-year yield pulled back on the EU tariff news, implying a rise in bond prices,
more in keeping with a flight to safety. This has followed a month-long surge in US
yields, along with several other major debt markets, with many near their highs for
the year. While a decline in bonds, or a move away from safety, could be expected
during a major upswing in equities, recent debt market weakness has been severe,
with recent auctions in the US and Japan seeing low demand. Rising yields can
eventually curb gains in equities, as they drive up discount rates and lower valuations.
The bond yields in several of the largest global debt markets, all hit lows
simultaneously on April 4, 2025, at the depths of the equity market crash. This
included the US, with the 10-year yield bottoming at 3.99% and rising 0.52% to
4.51%, and Canada, with yields rising 0.47%, up from 2.88% to 3.35%. The rise in
European yields has been more moderate, with France actually declining -0.06%
from 3.27% on April 4, 2025 to 3.33%, UK yields increasing 0.23% from 4.45% to
4.68%, and German yields flat at 2.57%. Japan yields hit a trough slightly later, on
April 7, 2025 at 1.13%, and have seen a strong 0.41% rise to 1.54%, while there has
been a subdued 0.03% rise in China’s yields from lows of 1.64% to 1.67%.
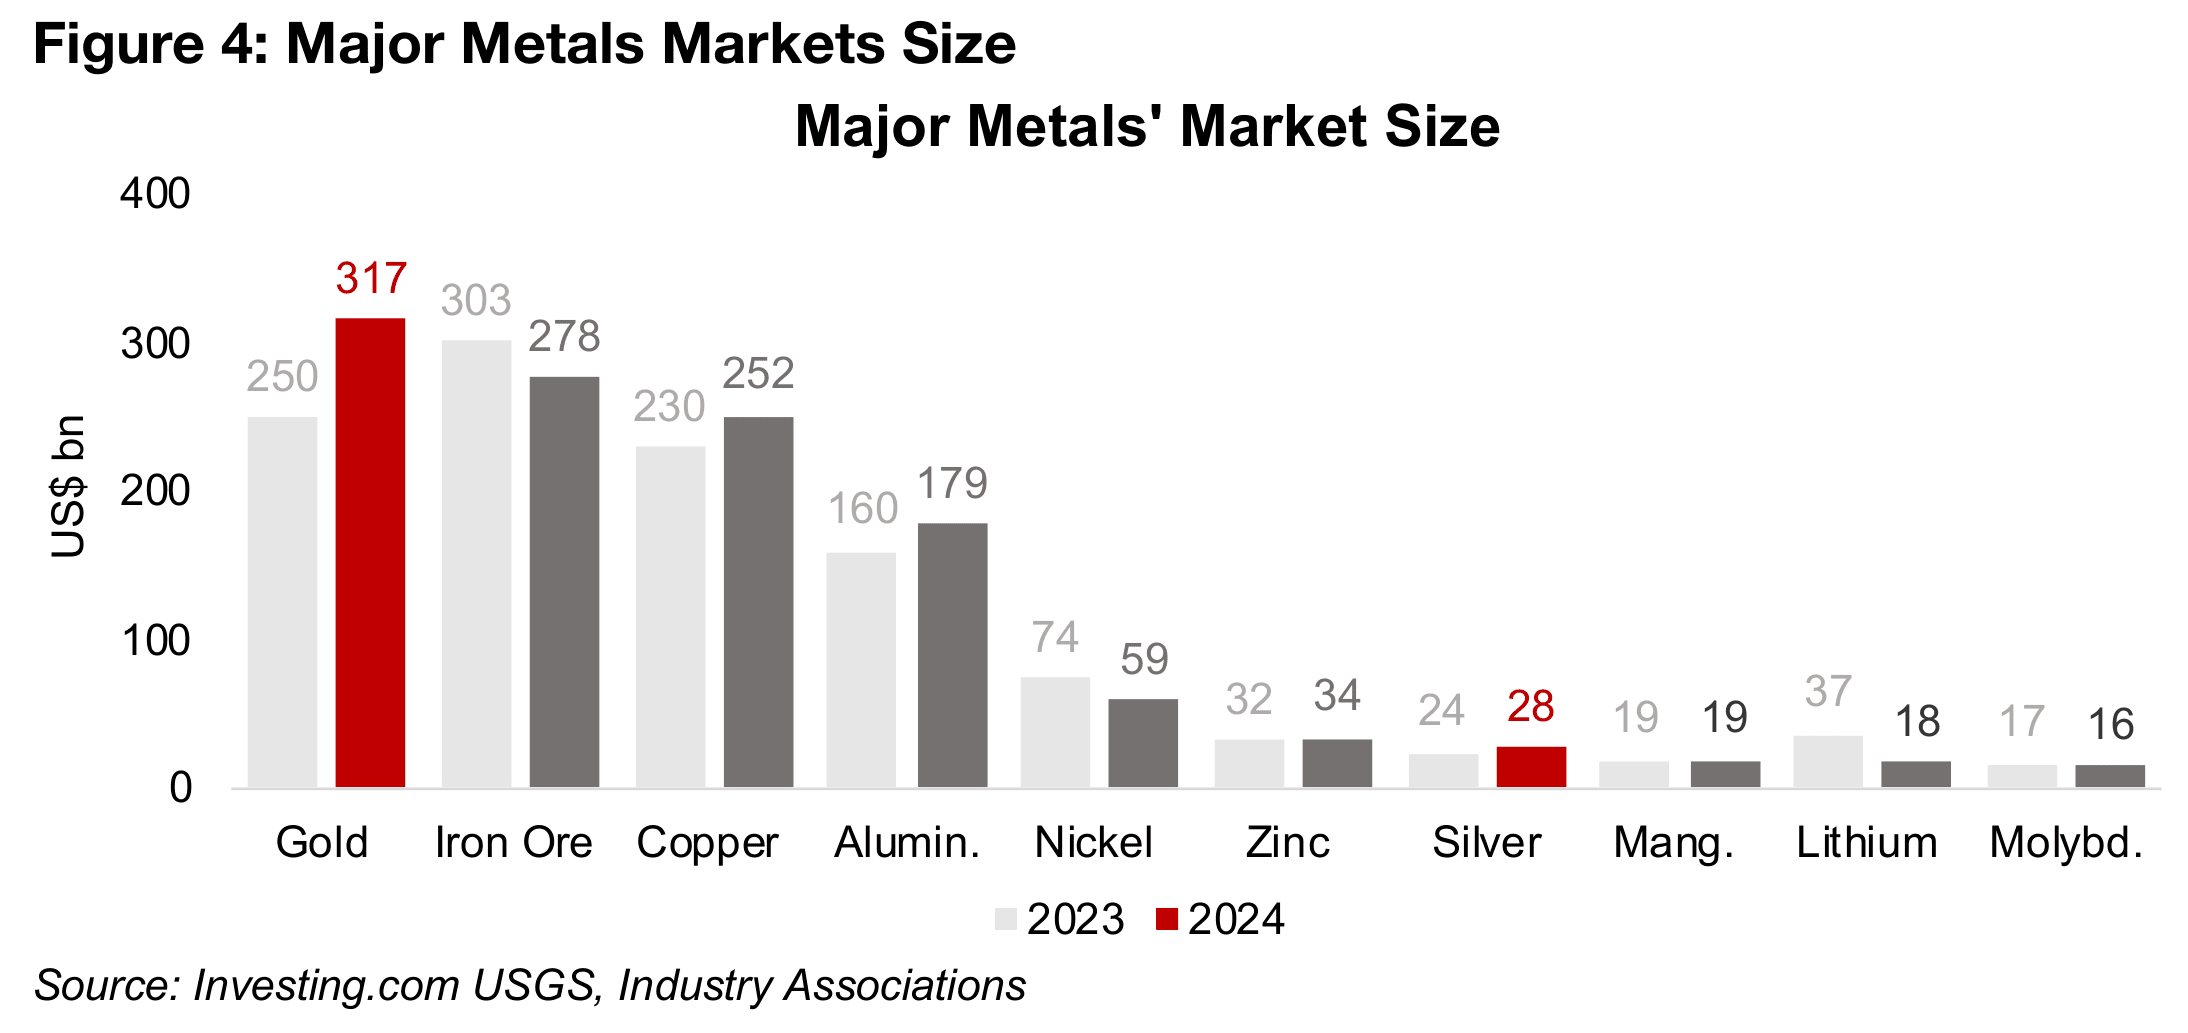
The continued rise in the gold price saw gold overtake iron ore as the largest metals market as of 2024, and this gap will likely have widened this year, as the price of the former has significantly outperformed the latter. The gold market reached US$317bn in 2024, up 26.6% from US$250bn, while the iron ore market declined -8.4% to US$278bn from US$303bn (Figures 4, 5). Iron ore demand is almost entirely from the steel industry, which saw relatively weak growth last year, a trend which has persisted into 2025. While a main driver was a slow property market and infrastructure growth in China, which comprises about 50% of steel demand, growth in the rest the world, which had been a bright spot from mid-2023 to mid-2024, has weakened since.
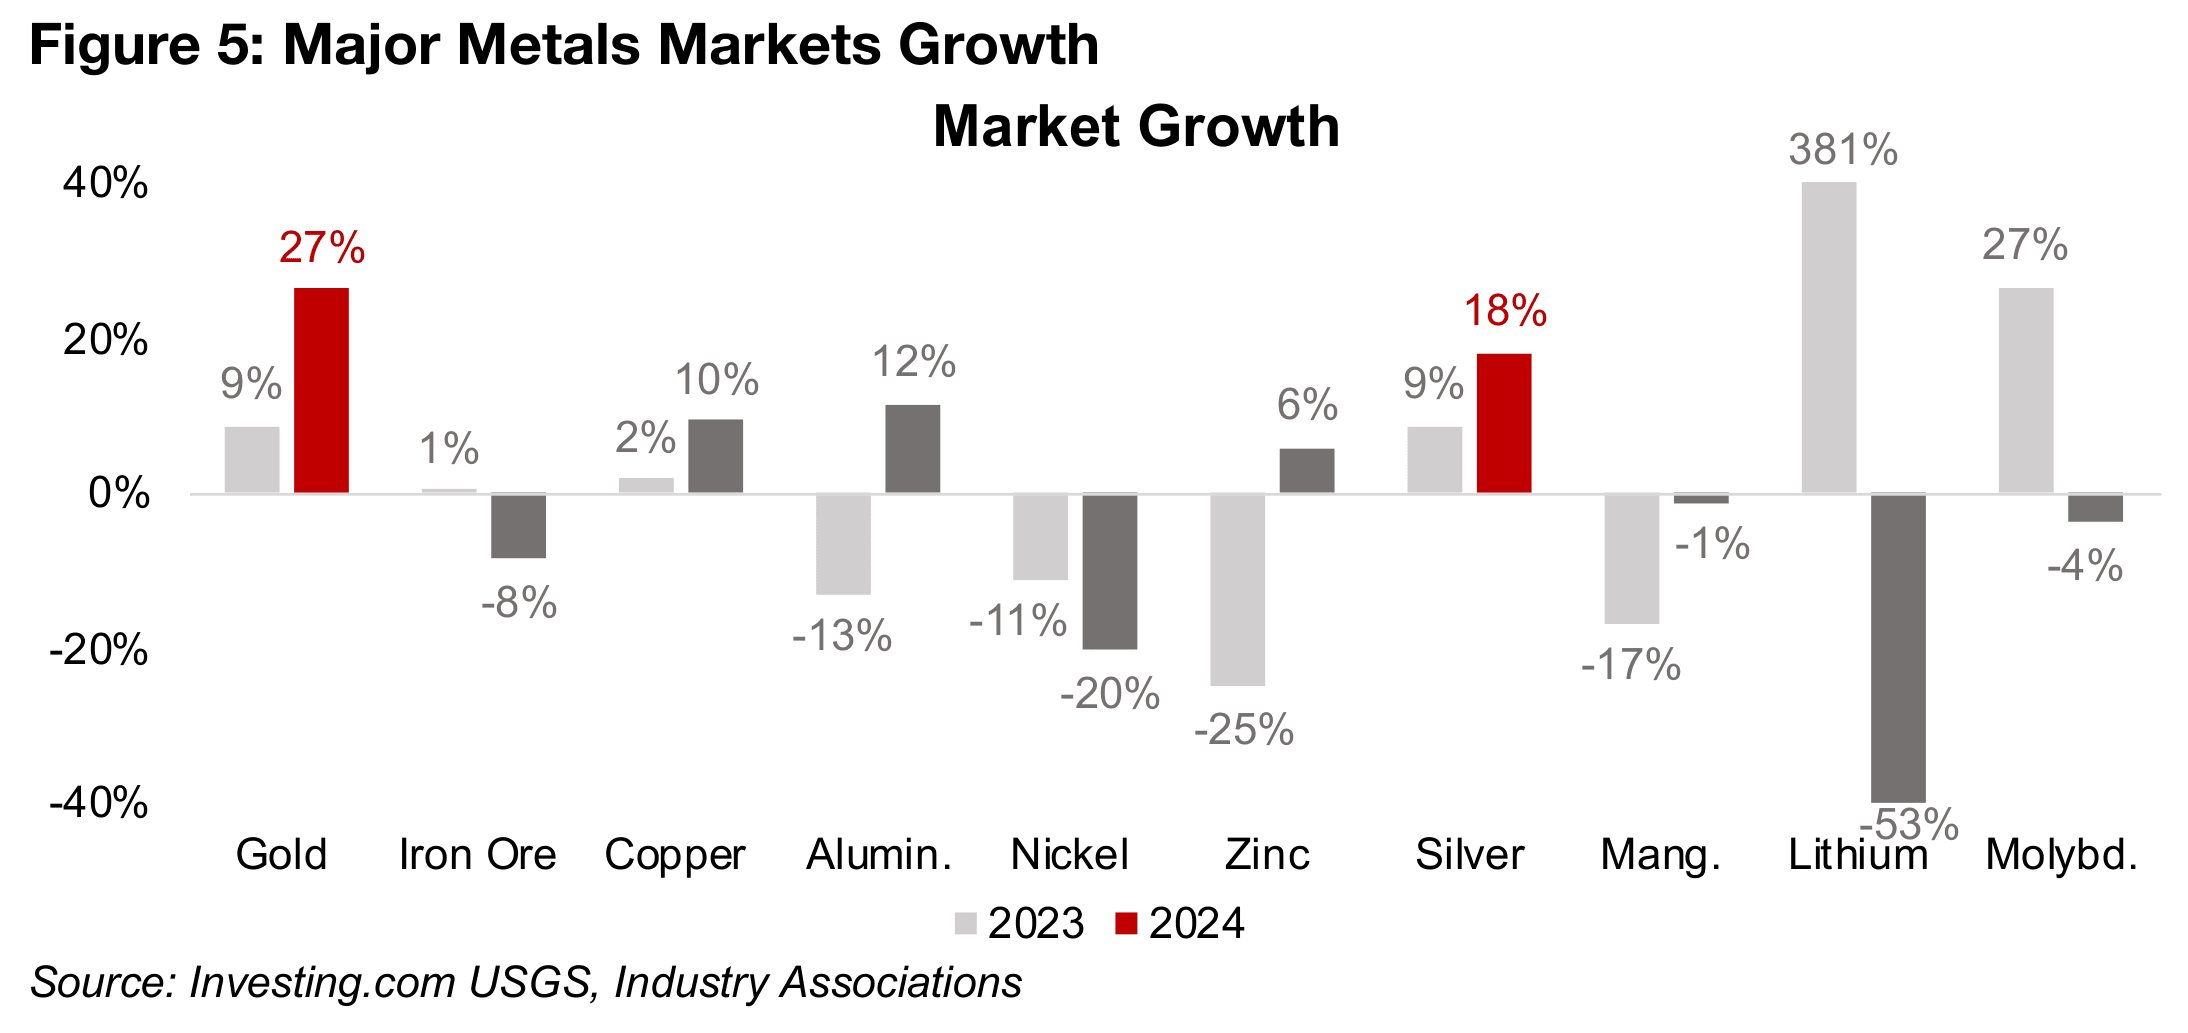
The markets for the two key indicators of global industrial growth, copper and
aluminum, both expanded, as their prices rose last year, but were considerably
behind the increase in the gold market. The copper market, which had been just
behind the gold market in terms of size in 2023, at US$230bn, rose 9.5% to
US$252bn in 2024, and the aluminum market was up 11.7% from US$160bn to
US$179bn, on a moderate global economic expansion.
Of the second-tier markets only nickel saw a decline both in 2023 and 2024, by -11%
-20%, respectively. Significant global oversupply continues, mainly because of the
huge, China-backed capacity expansion in Indonesia over the past decade. However,
last year there were demand side issues, from a slowdown in steel, which accounts
for about 70% of demand, and declining growth rates in electric vehicle sales, with
batteries accounting most of the rest of nickel demand. The zinc market recovered in
2024 up 6%, after a -25% decline in 2023.
The silver market, which is driven by a mix of monetary factors, like gold, but also
industrial factors, similar to copper, seemed to see the former dominate, as it rose
18%, although the price was also supported by a fourth year of major deficit. The
lithium price saw by far the largest swings over the past two years of any major metal,
with the market rising 381% in 2023 as lithium chemical supply, especially in China,
was still catching up with EV-driven demand. However, supply rose substantially last
year while EV demand growth slowed, leading to a -53% collapse in the lithium price.
The manganese market size was near flat, down just -1% in 2024 after a -17% drop
in 2023 and the molybdenum market was down -4% after a 27% rise in 2023.
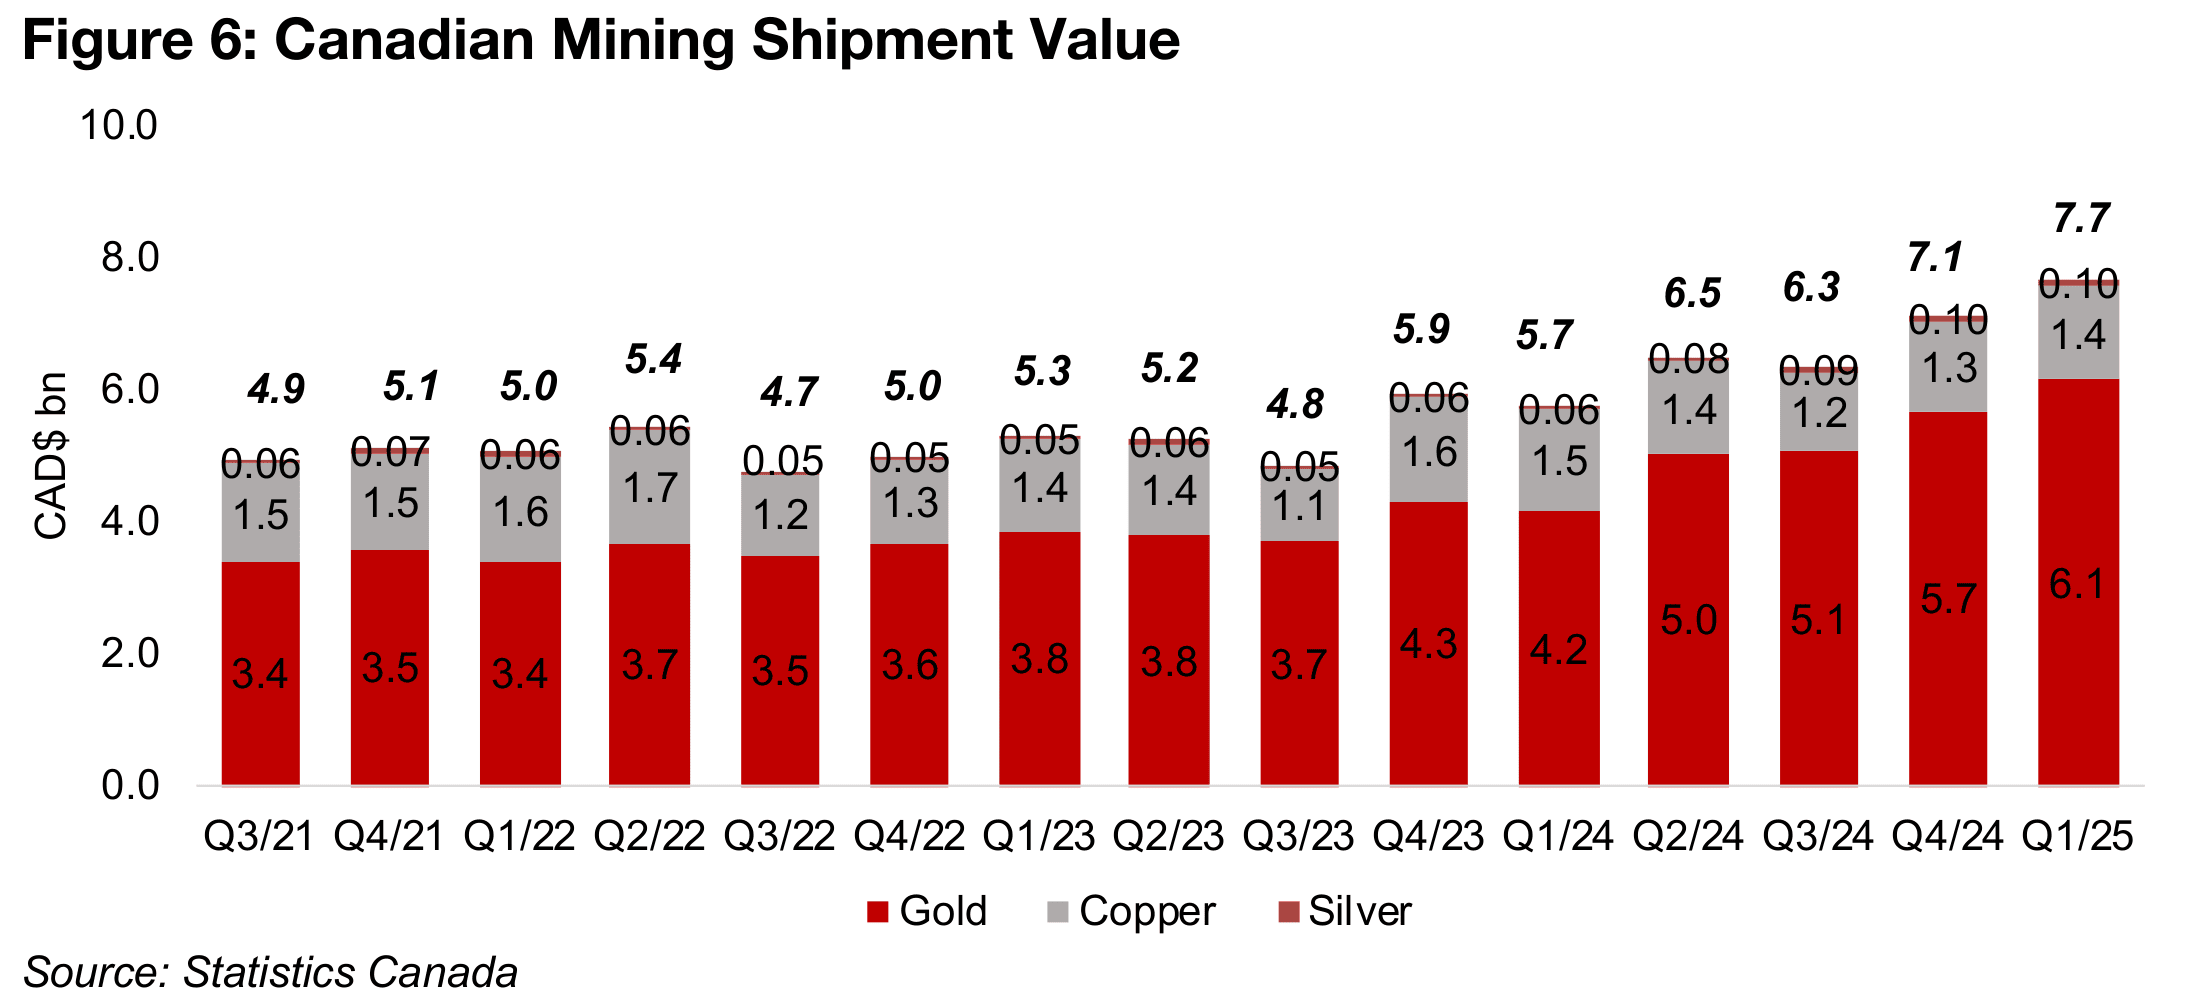
Canadian mineral shipment value has continued an overall strong uptrend over the
past six quarters from US$4.8bn in Q2/23, up 60% to US$7.7bn, after nearly two
years around the US$5.0bn per quarter level (Figure 6). Gold has been the major
driver, in part because it makes up the bulk of the shipment value, at US$6.1bn, or
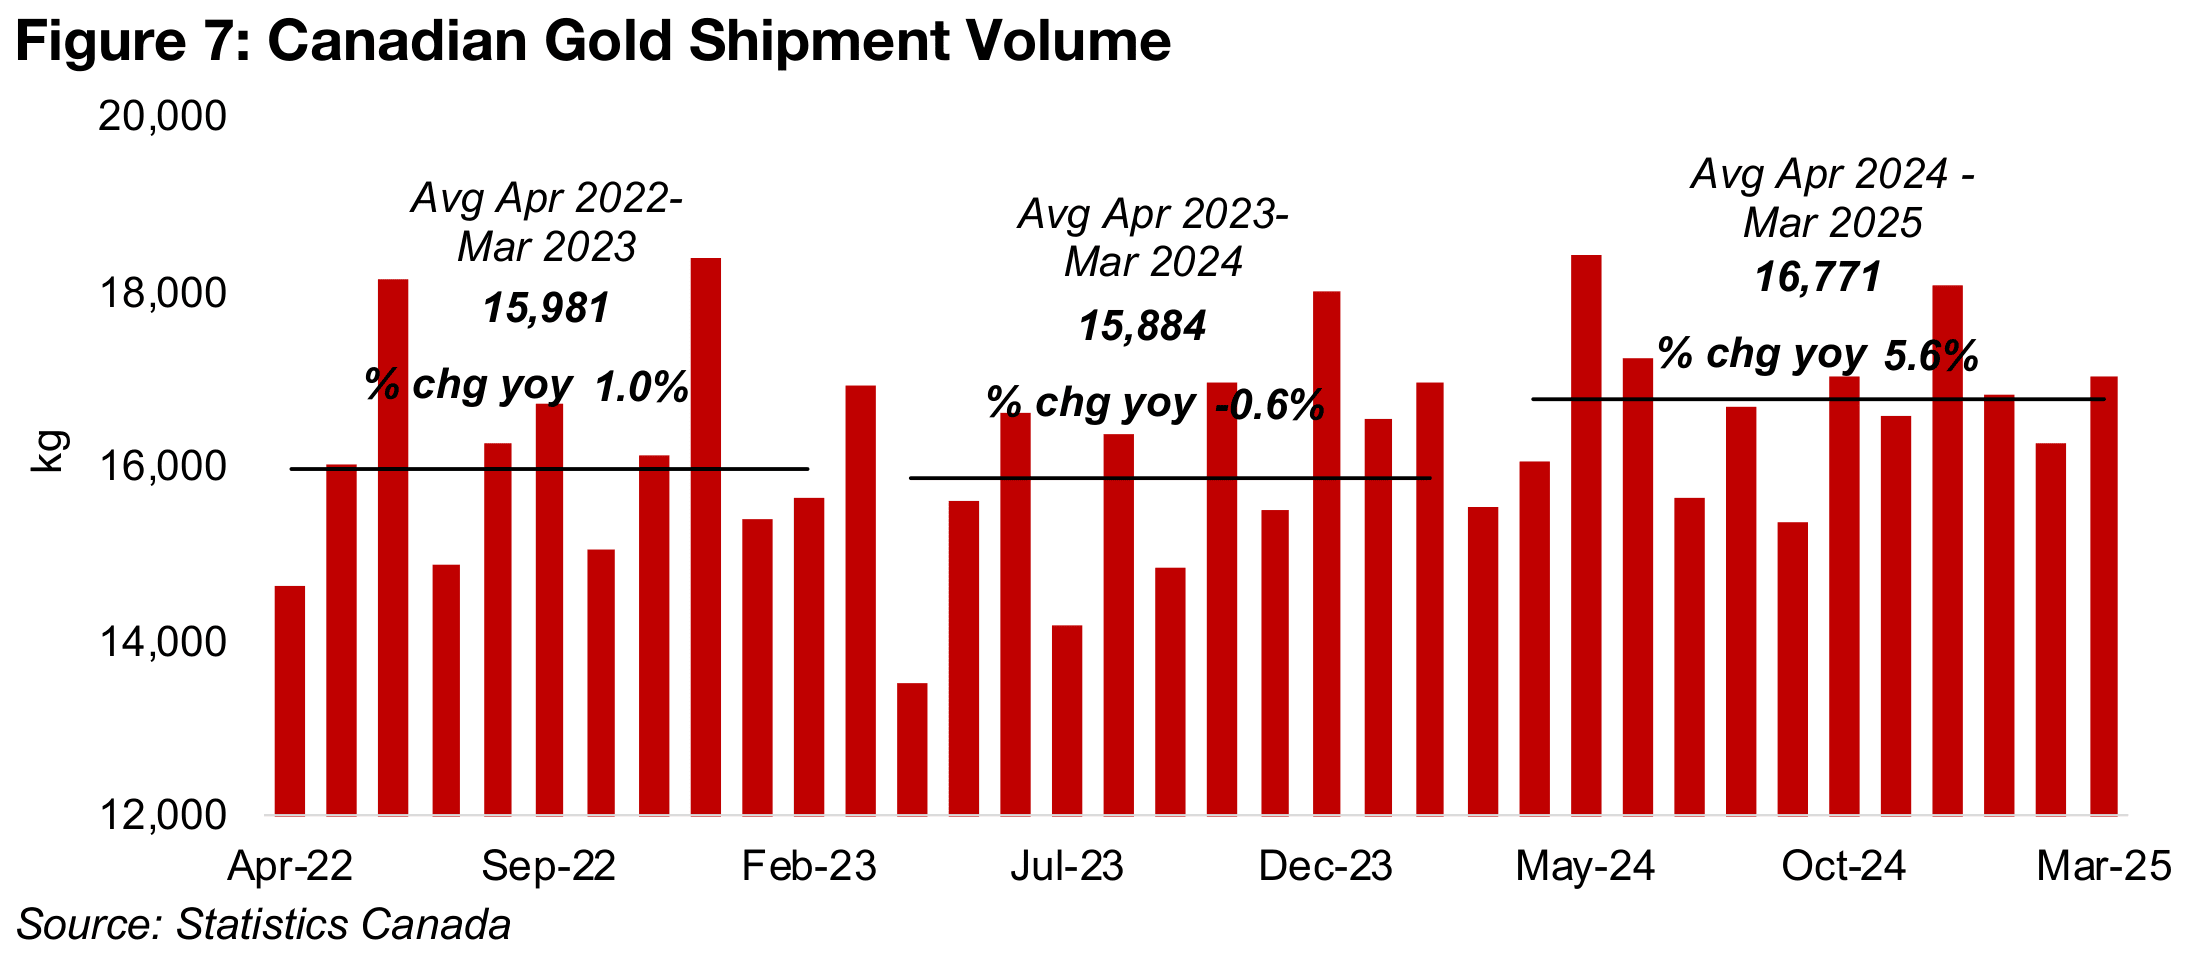
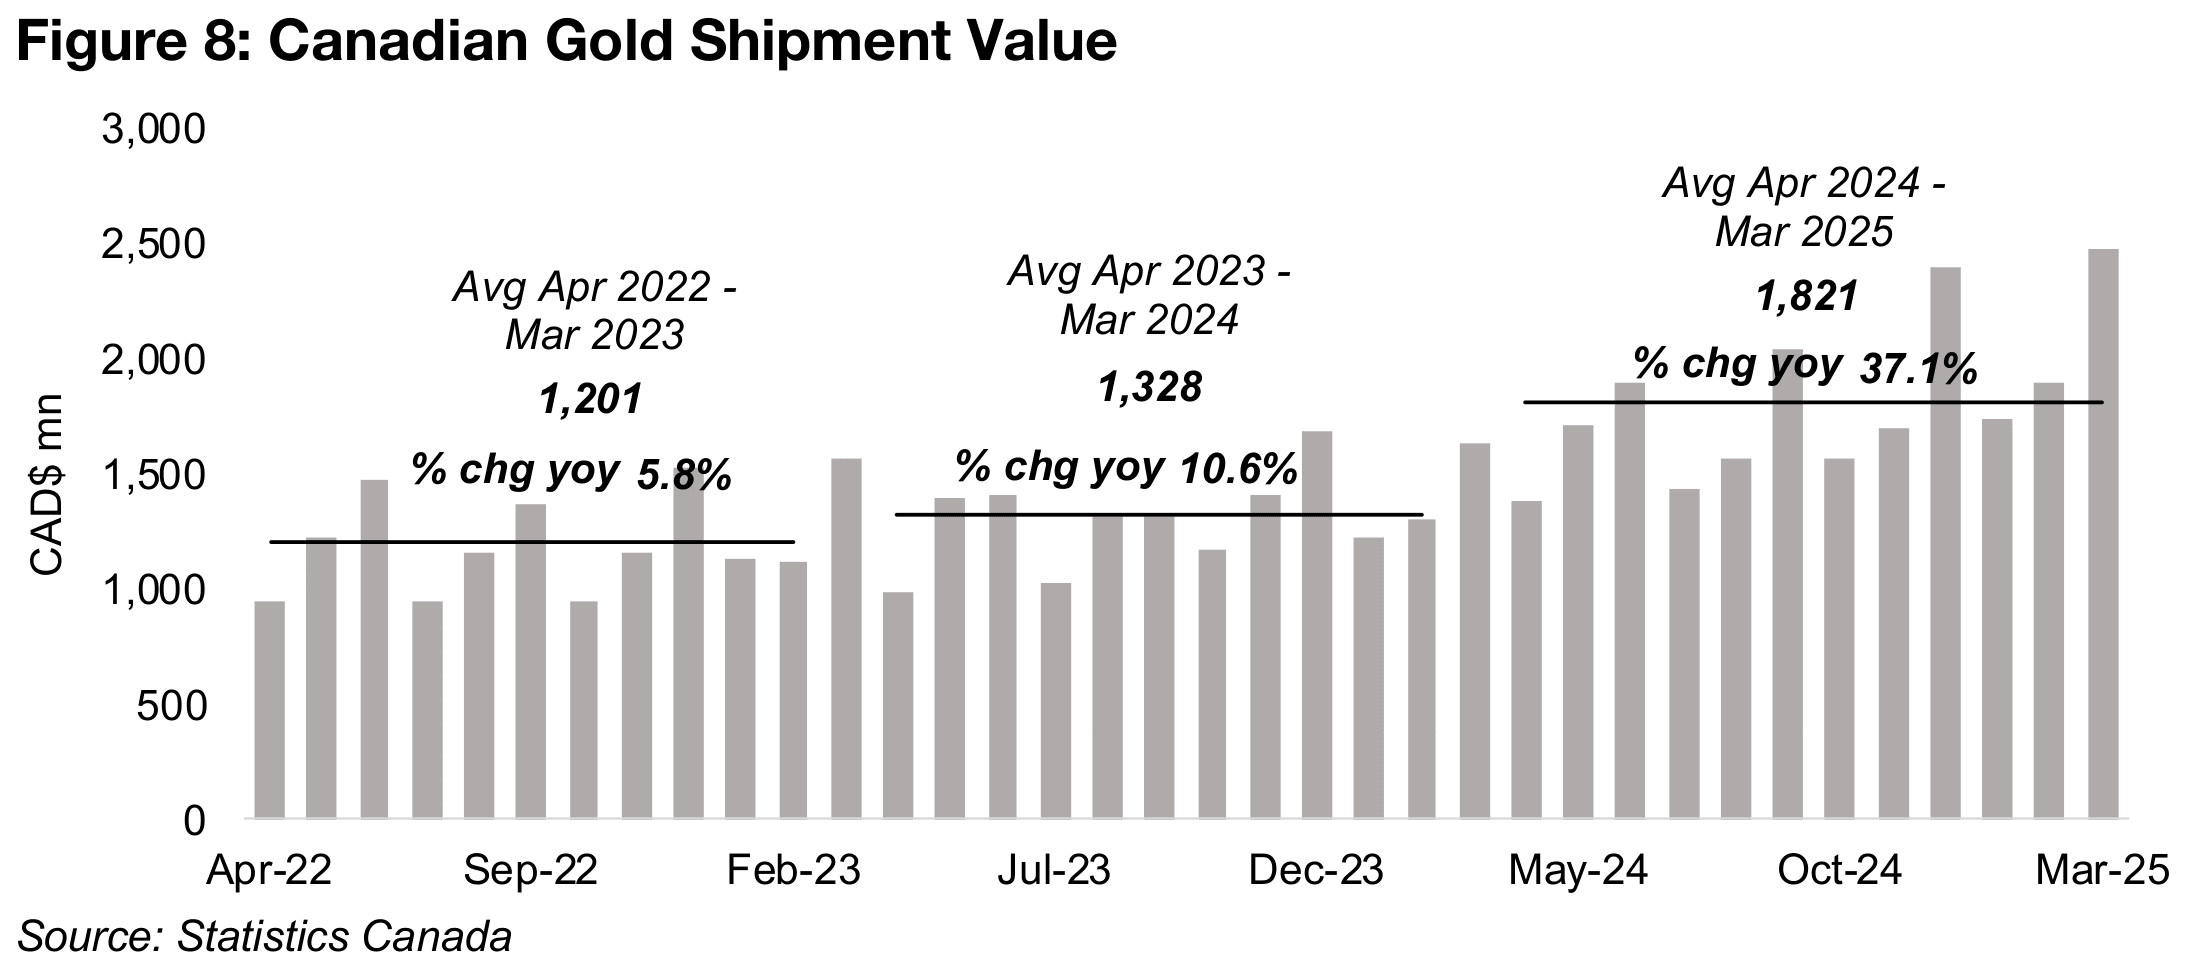
80%, in Q1/25. However, growth in production volume has been strong, up 5.6% in
the year to March 2025, in addition to the boost from the gold price, driving a 37.1%
rise in the shipment value (Figures 7, 8).
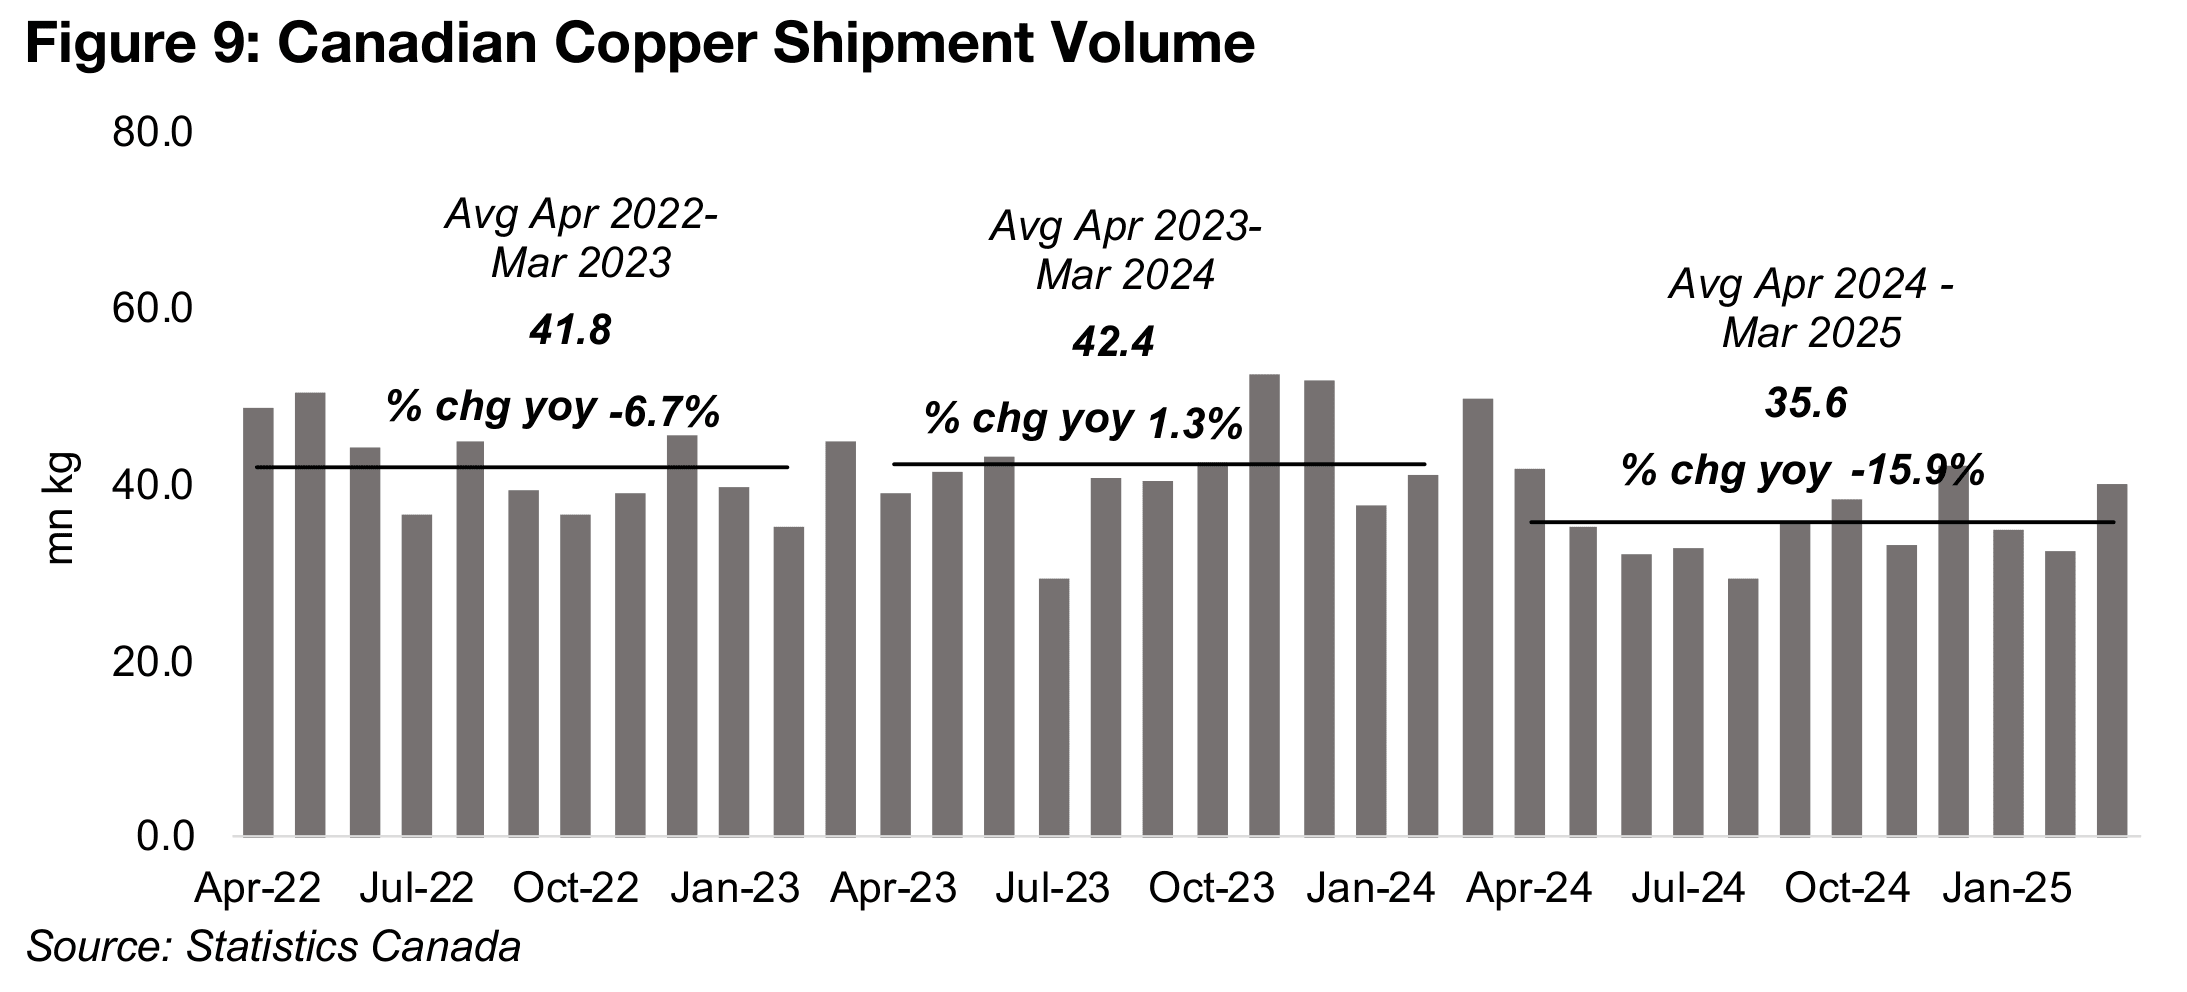
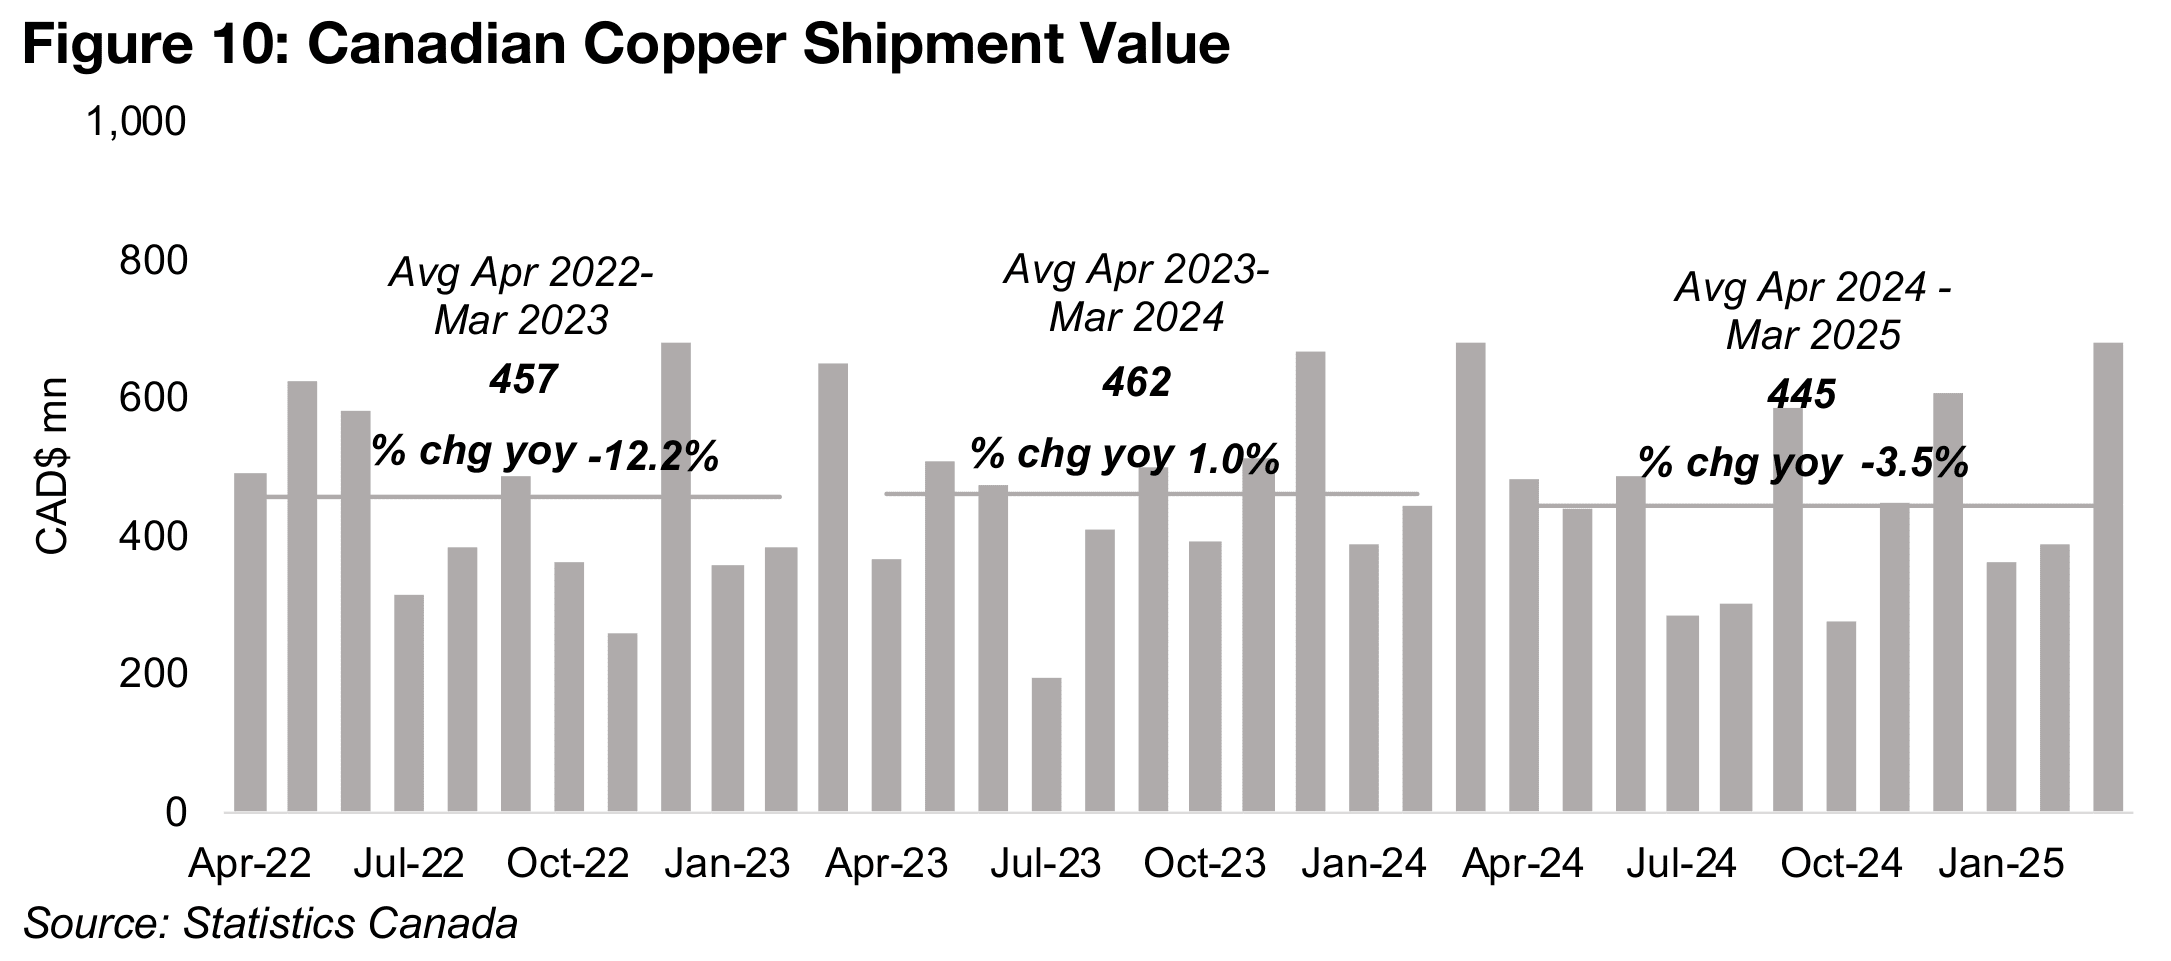
While the copper shipment value has also increased over the past two quarters to
US$1.4bn from US$1.2bn in Q3/24, it is a much smaller proportion of the total, at just
19% in Q1/25. Production volume has also declined significantly in the year to March
2025 yoy, down -15.9%, offsetting the rise in the copper price yoy, for a -3.5%
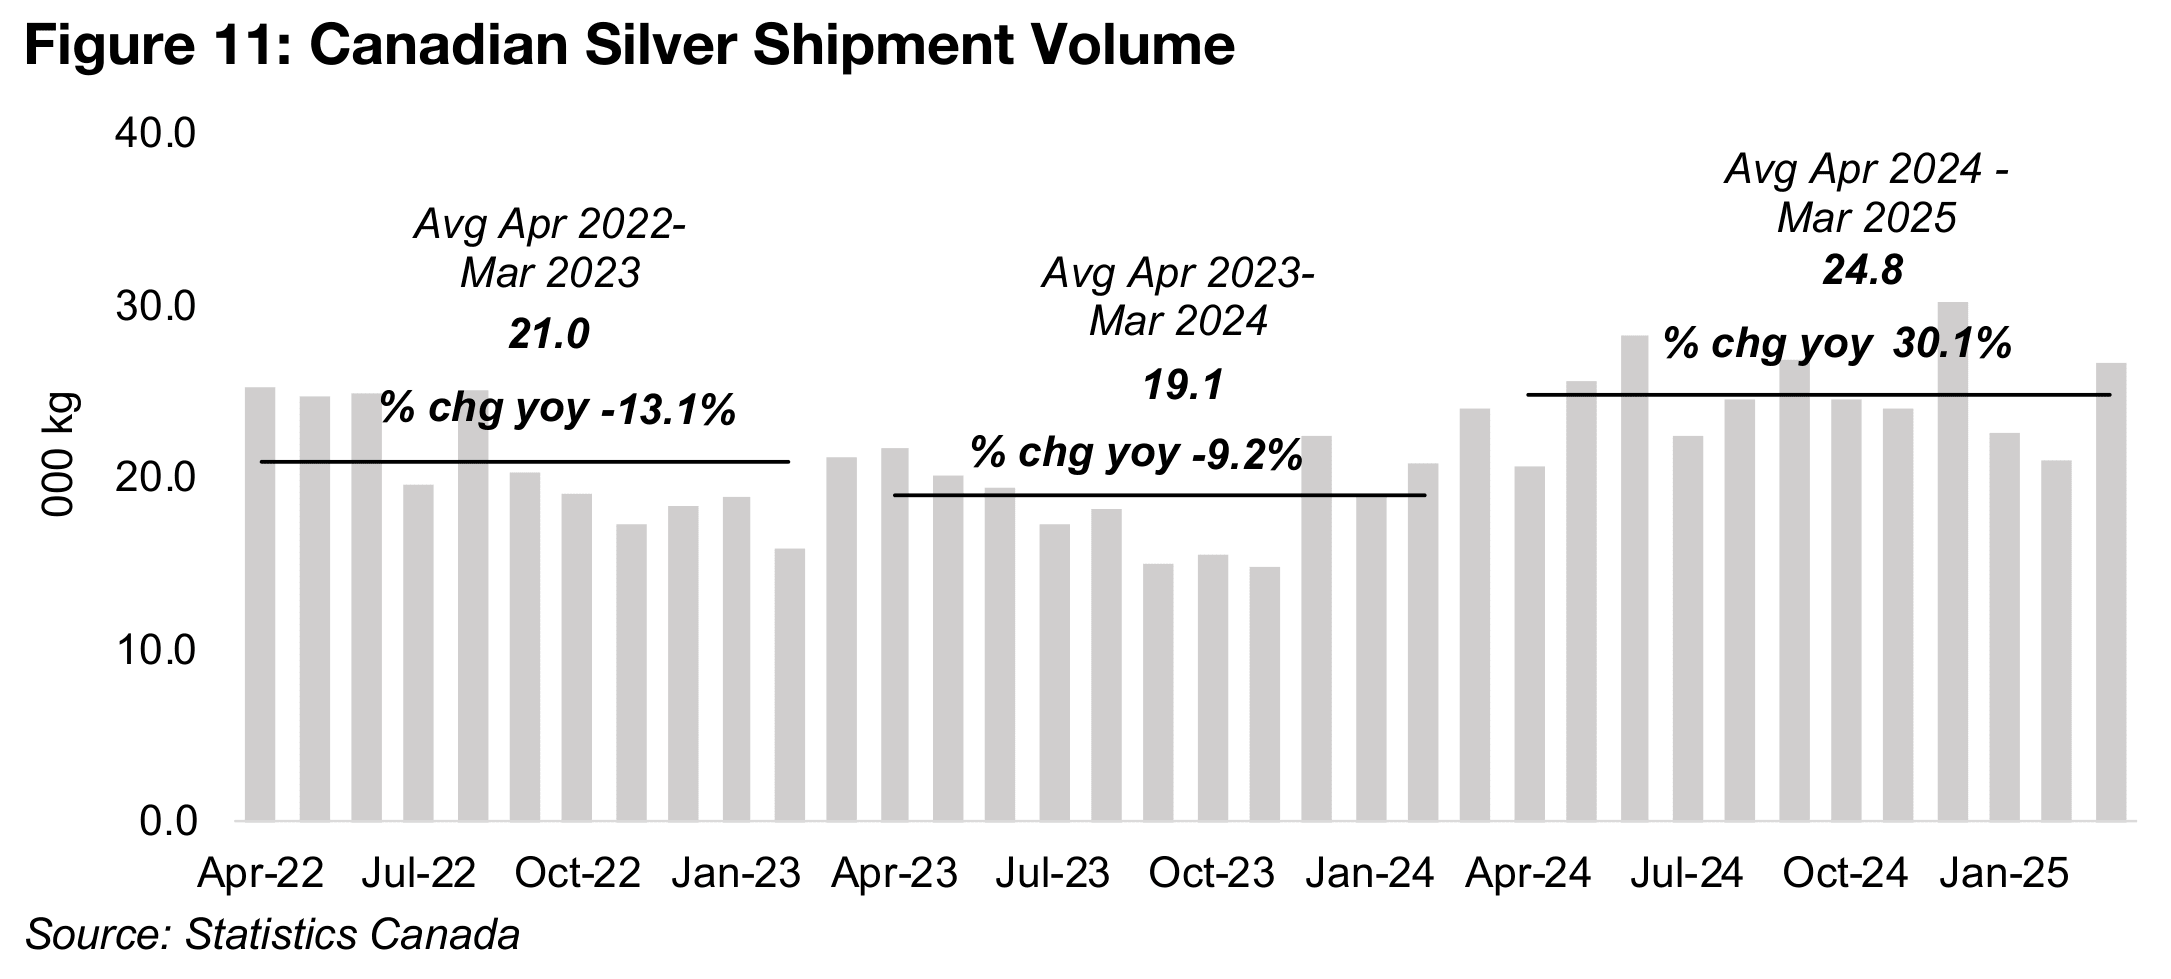
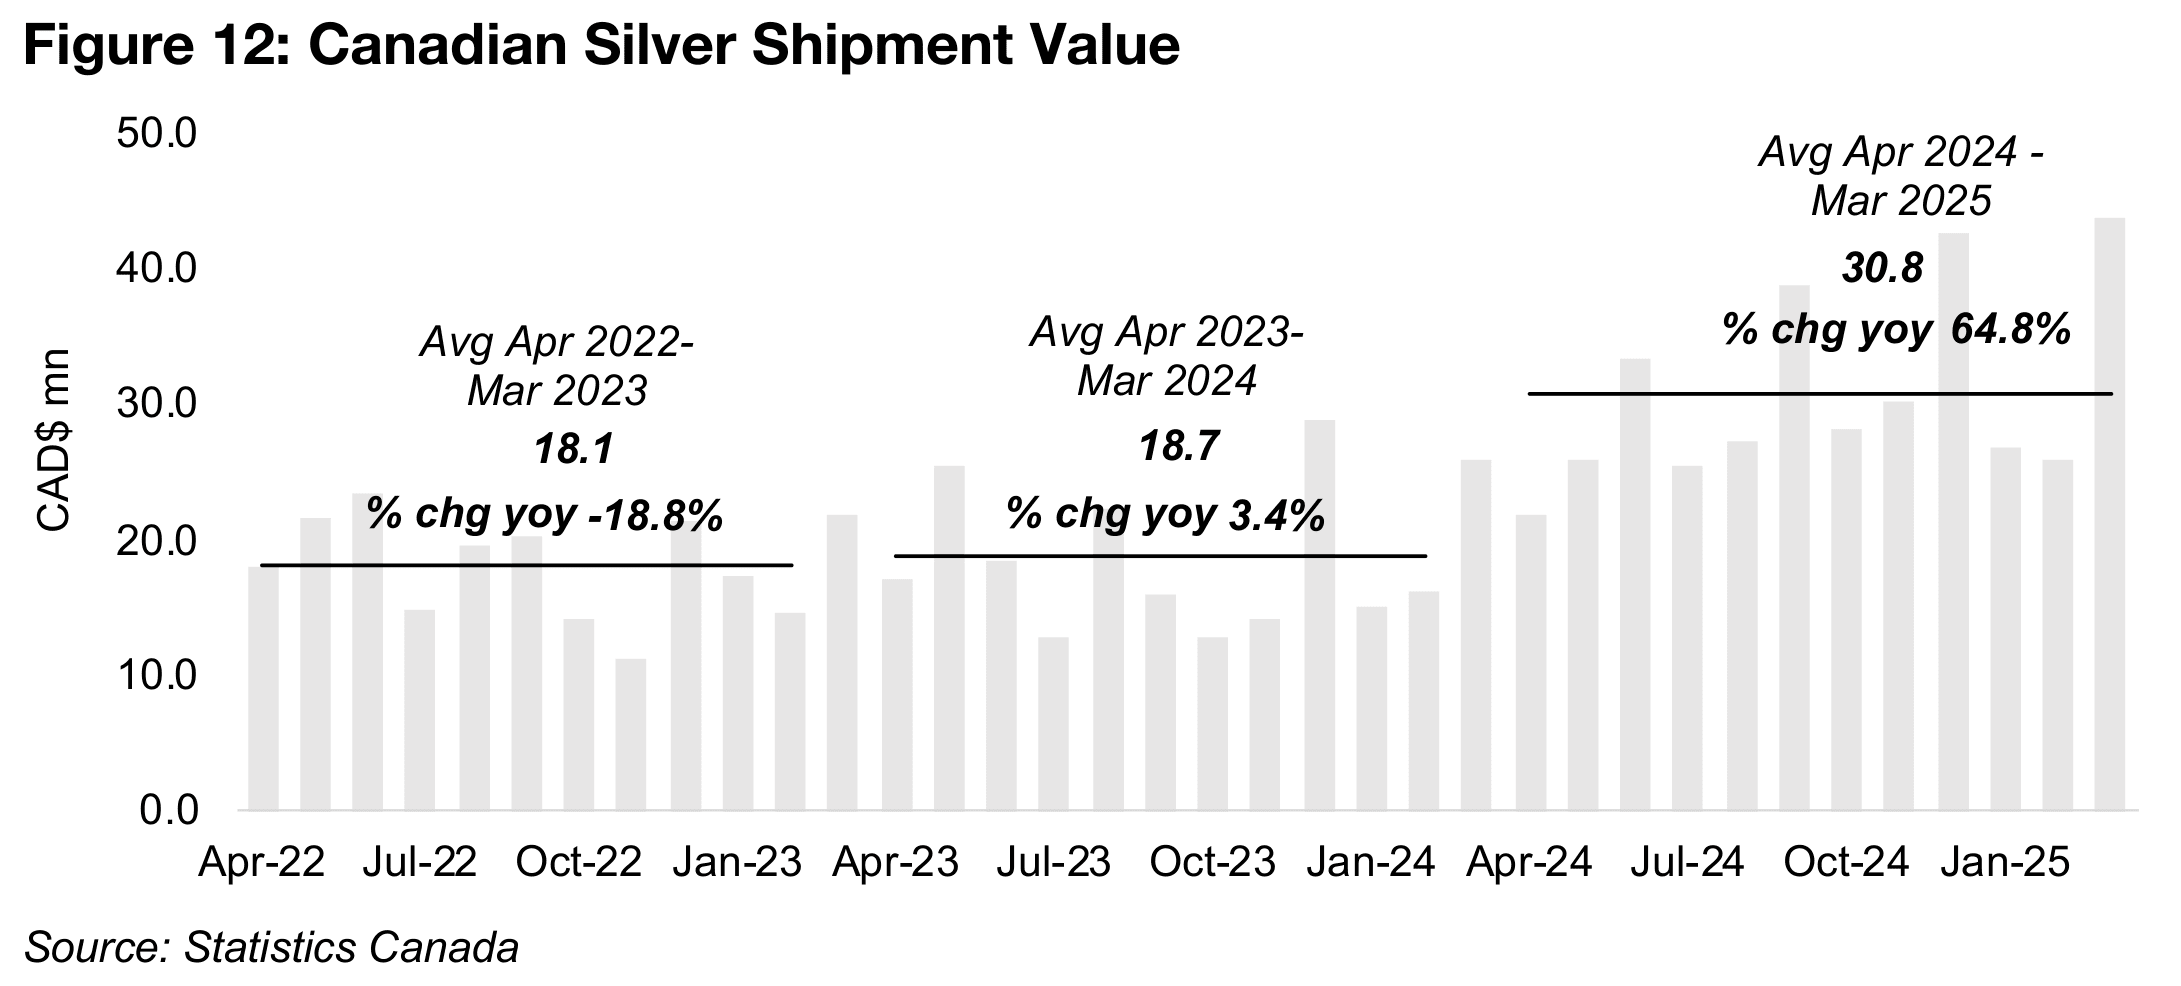
decline in shipment value over the past year (Figures 9, 10). While silver production
volume growth has been strong, up 30.1% over the past year, and the metal price
has also risen, driving up shipment value 64.8% yoy, it is a very small proportion of
the total value, at 1% of Q1/25 (Figures 11, 12).
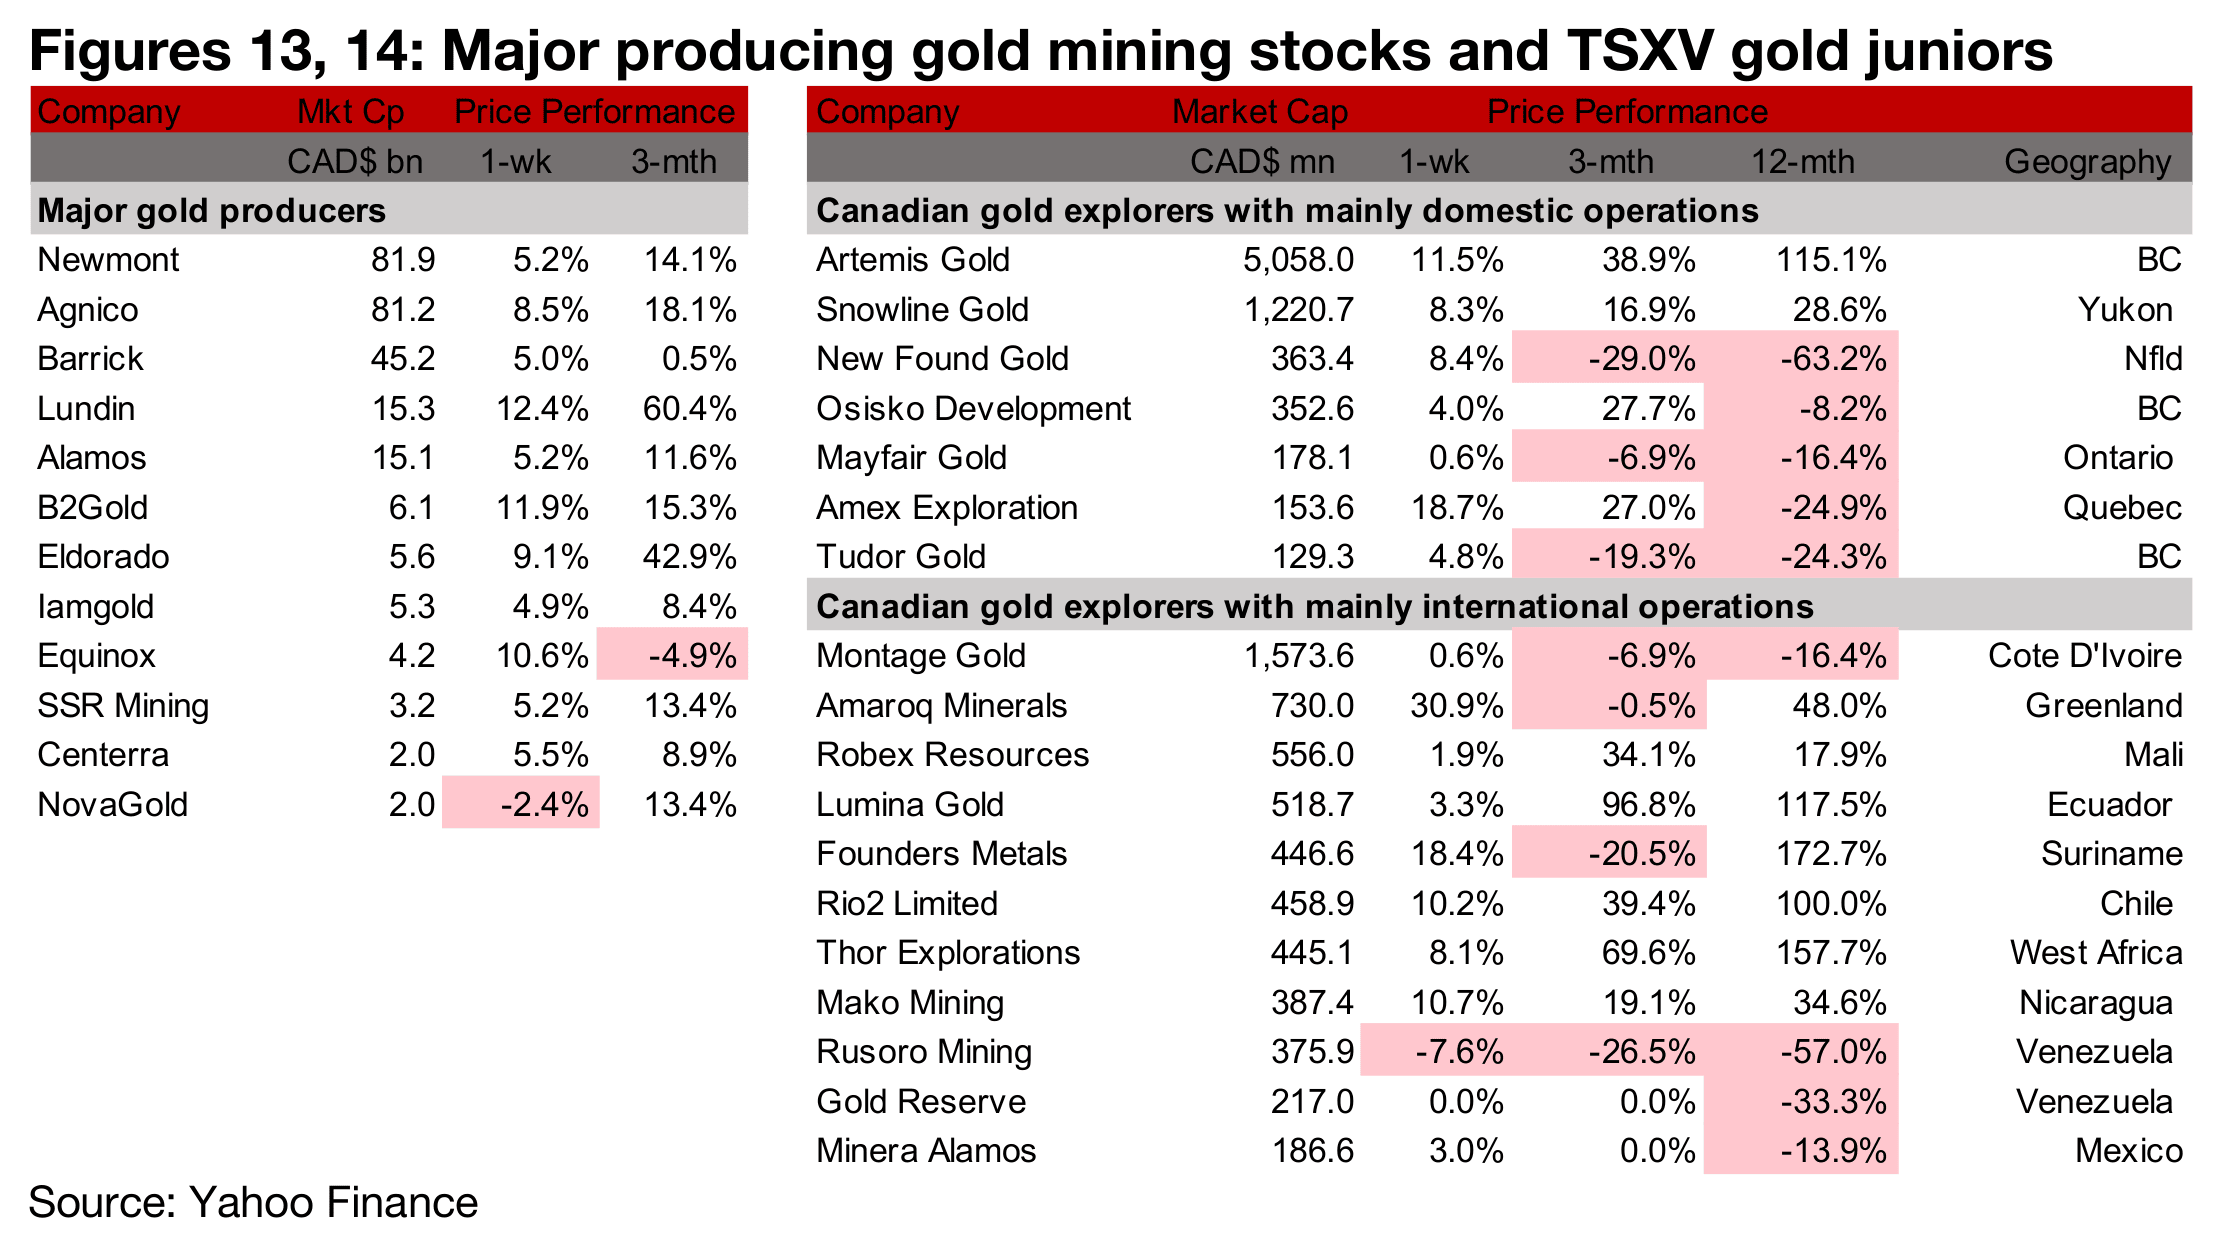
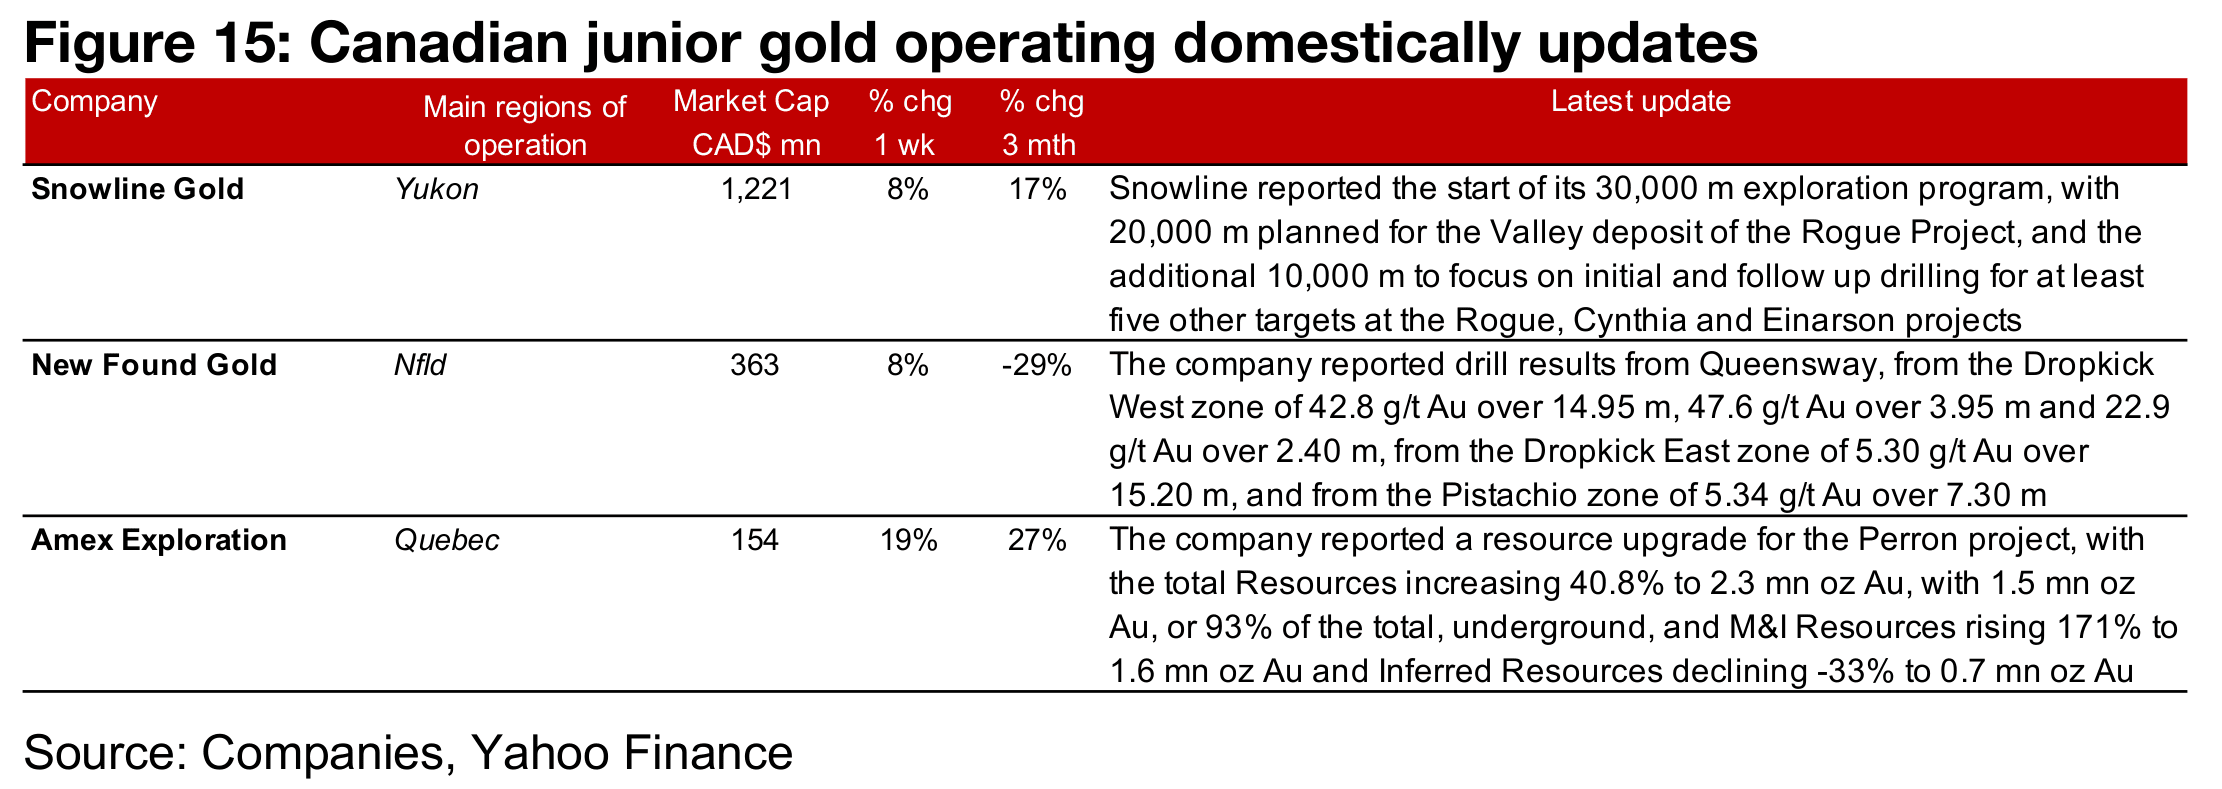
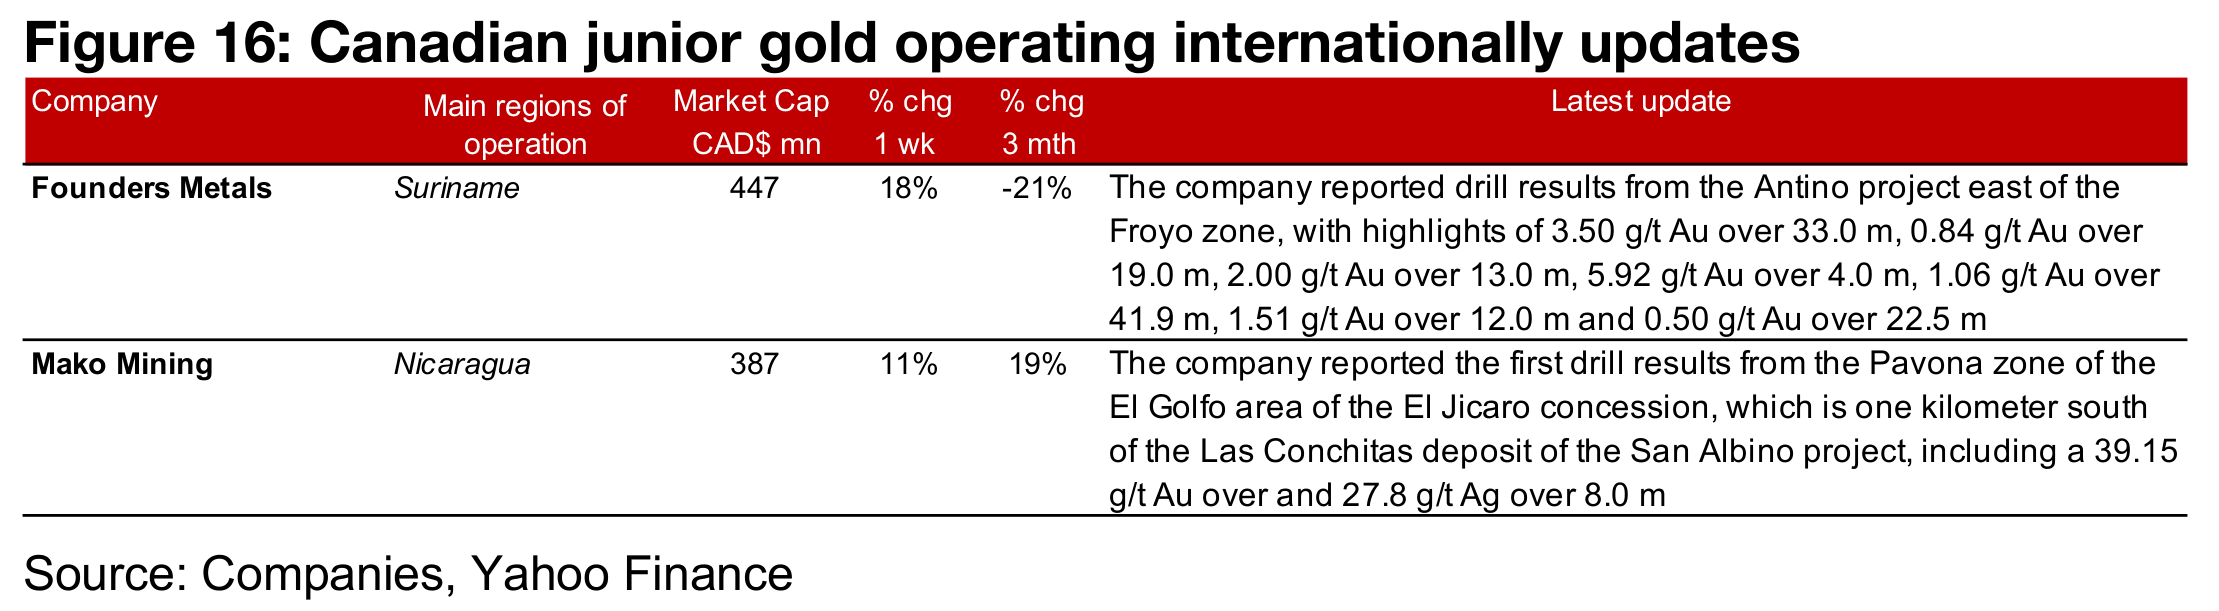
Almost all of the major producers and large TSXV gold increased on the rise in the metal price (Figures 13, 14) For the TSXV gold companies operating mainly domestically, Snowline reported the start of a 30k m exploration program at Rogue and other projects, New Found Gold reported drill results from Queensway and Amex increased its Resource estimate for the Perron project (Figure 15). For the TSXV gold companies operating mainly internationally, Founders Metal reported drill results from the Antino project and Mako Mining announced drill results from the Pavona zone of El Golfo area of the El Jicaro concession (Figure 16).
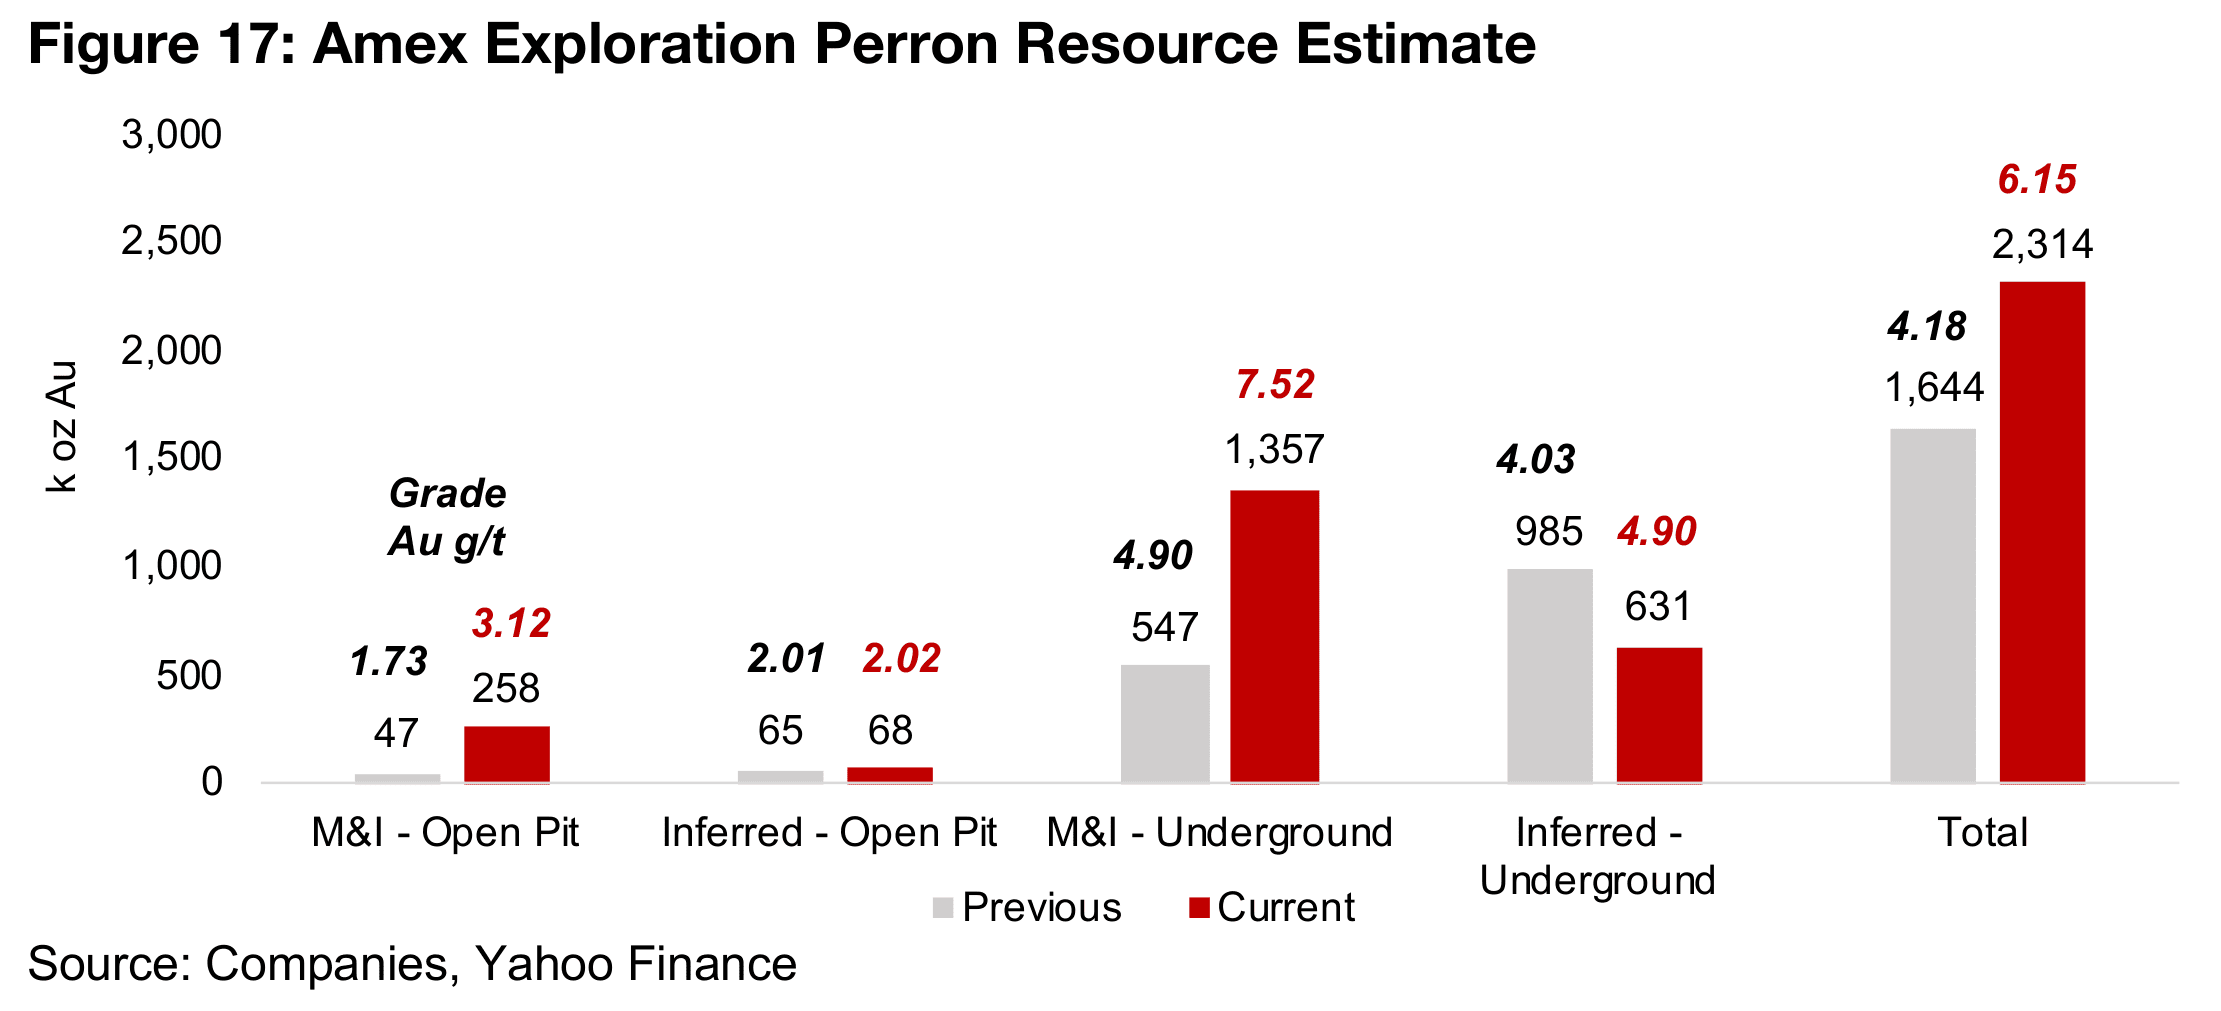
Amex Exploration saw a substantial 40.8% increase in its Resource estimate for its Perron project from the September 2024 initial announcement (Figure 17). The company also subsequently announced a PEA for the project in November 2024, seeing it shift over the past year from a later stage explorer to a developer. While total Resources increased, there was also a significant upgrade of Resources to M&I, which rose 174% to 1.62mn oz Au from 0.59mn oz Au in the previous estimate, while Inferred Resources declined -33% to 0.70 mn oz Au from 1.05 mn oz Au. The Resources are nearly entirely underground, at 93% of the total with the rest open pit.
Disclaimer: This report is for informational use only and should not be used an alternative to the financial and legal advice of a qualified professional in business planning and investment. We do not represent that forecasts in this report will lead to a specific outcome or result, and are not liable in the event of any Icon and logotype combination business action taken in whole or in part as a result of the contents of this report.
Author
Ben McGregor authors the Weekly Roundup at CanadianMiningReport.com, providing sharp analysis of the metals and mining sector. With a talent for spotting trends, Ben distills complex market shifts into clear, engaging insights on TSXV junior miners. His weekly updates cover gold, copper, uranium, and more, blending data-driven perspectives with a knack for identifying opportunities. A vital resource for investors, Ben’s work navigates the dynamic junior mining landscape with precision.