
October 06, 2025
Gold jumped 2.8% to US$3,881/oz, continuing the boom’s second phase this year after an April-August pause, with the metal up well over US$1,000/oz in 2025 and the most recent driver being the US finally joining the ongoing global monetary expansion.
This week we check in again on whether gold has entered bubble territory, and still see support from several fundamental factors, including a rising money supply, heavy central bank buying, a fall in the US$ and real bond yields and high ETF inflows.
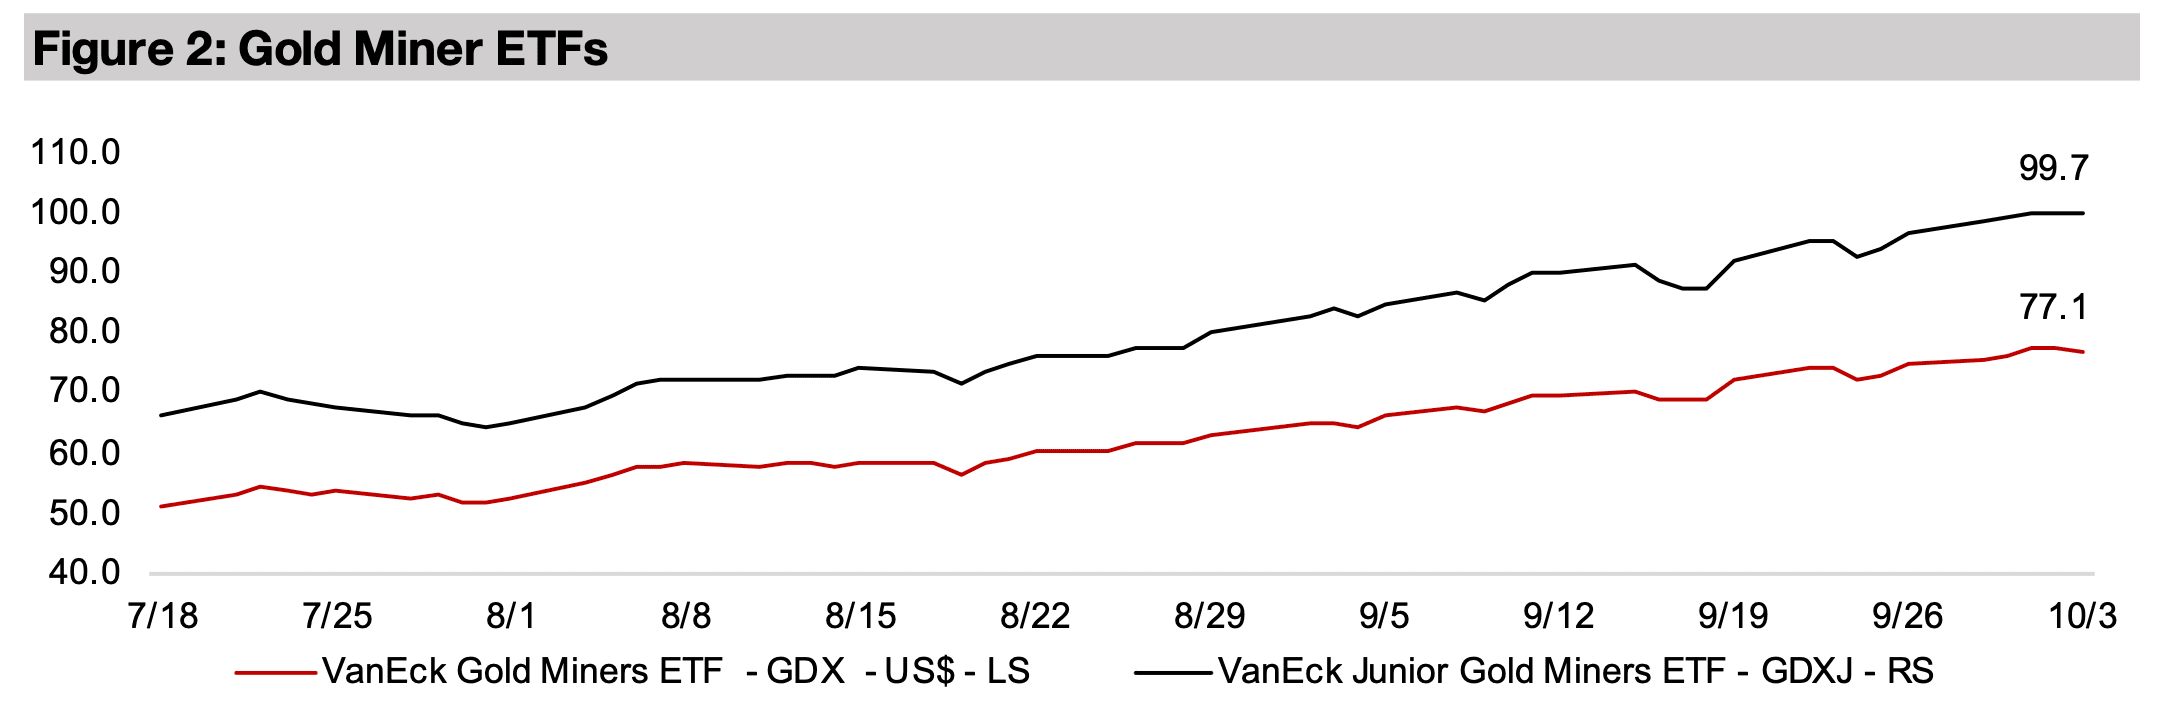
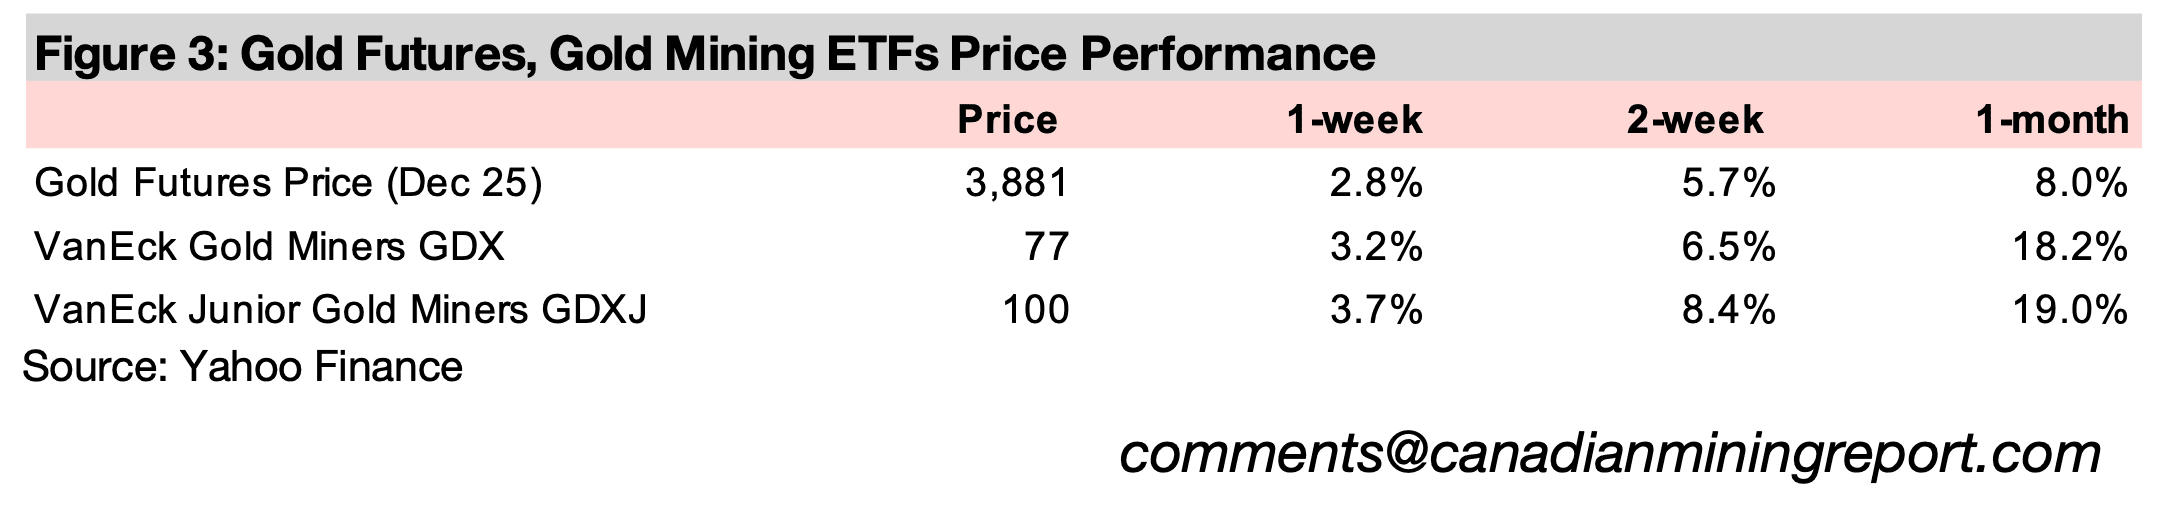
The gold stocks hit a sixth weeks of new highs, with the GDX up 3.2% and GDXJ rising 3.7% on the surge in the metal, outperforming the strong overall gain in equities, with the S&P 500 and Nasdaq up 0.8% and Russell 2000 adding 1.4%.


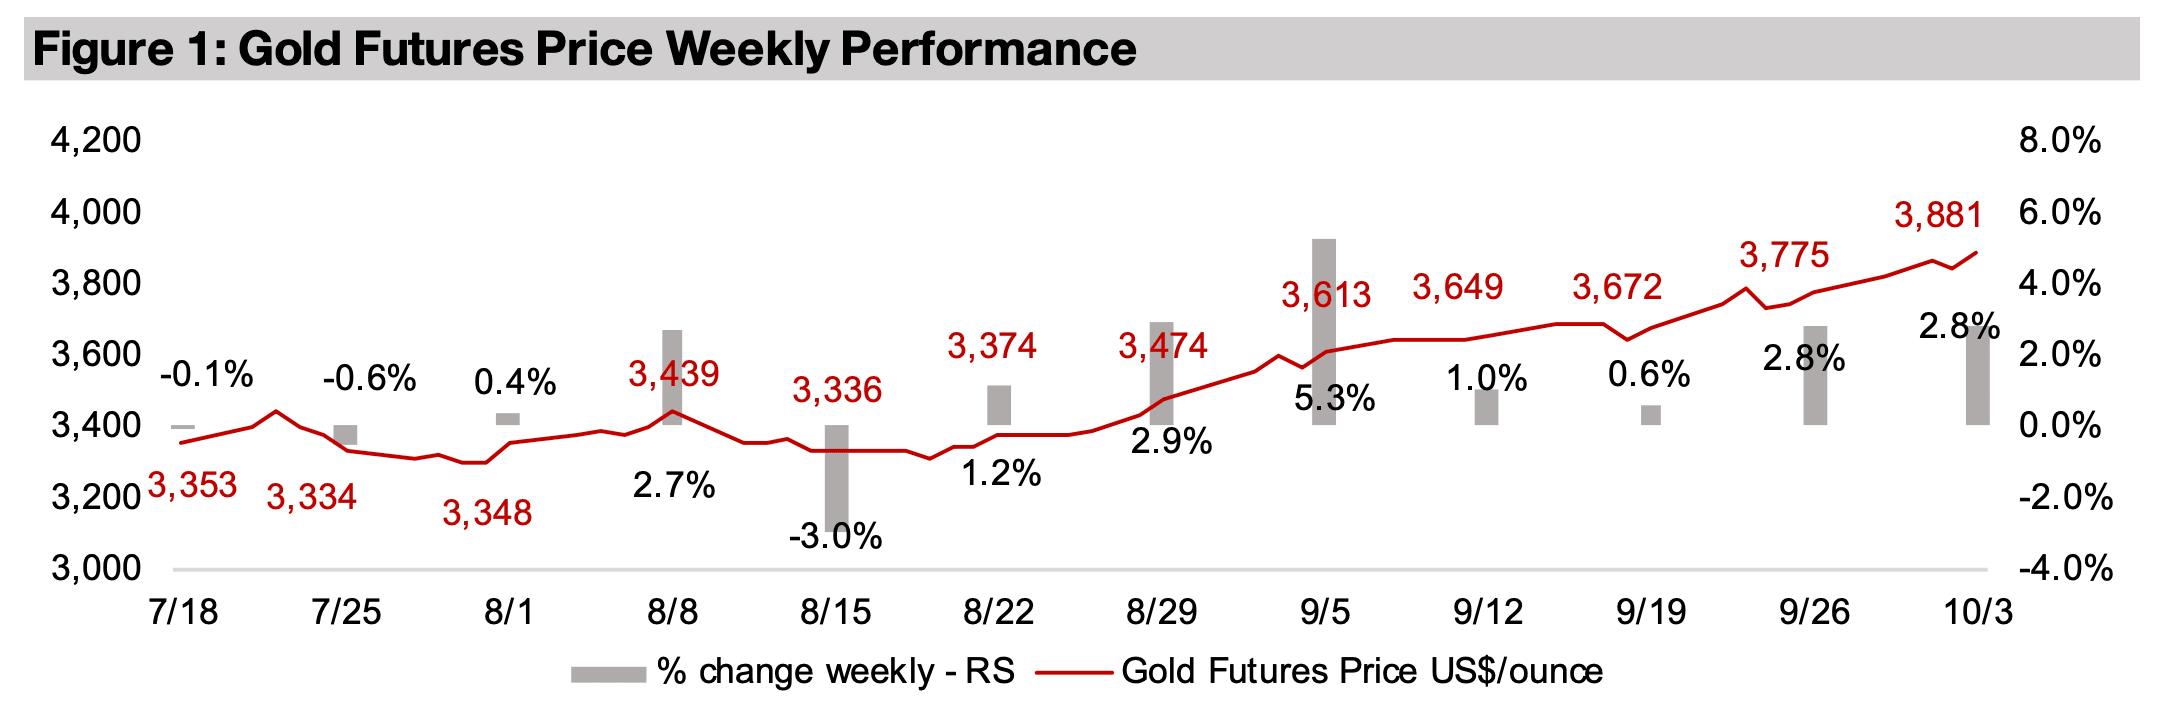
The gold price jumped 2.8% to US$3,881/oz, as the second phase of the gold boom
this year continues, after a pause from April-August 2025. The metal is up over
US$1,200/oz since the start of the year and has gained nearly US$550/oz from the
most recent August lows of US$3,313/oz, with nearly two months with no significant
pullback. This appears to have been driven by the US making its first rate cut of 2025
in September, finally joining the monetary expansion of all the other major central
banks, which had already made substantial reductions this year. The gold price
started rising in the month prior to the cut, paused for two weeks after the September
18, 2025, announcement, and has resumed its surge over the past two weeks.
While gold outpaced platinum this week, which was up just 1.6%, it underperformed
silver, which rose 4.2%, but especially copper, which jumped 7.8%. The copper price
gained on concerns of a major reduction in global supply after Freeport McMoran
invoked force majeure at its Grasberg mine in Indonesia. This came after a mudslide
early last month at the mine initially led to a temporary suspension of operations and
finally drove the company last week to confirm it would not be able to deliver on all
its contracts. While a considerable surplus for copper had previously been expected
for 2025 and 2026, there are now some forecasts for a roughly balanced market
because of this and other supply disruptions. The equity markets were relatively
strong, with the S&P 500 and Nasdaq both gaining 0.8%, but outperformed by the
1.4% rise in the small cap Russell 2000 index, showing a move back towards risk on
after two relatively cautious weeks for equities.
A US$4,000/oz gold price is now clearly in reach for this year, with it only about
US$100/oz away and the metal having gained more than that in both of the past two
weeks. Some investment banks have already boosted targets for next year to this
level, which just a few months ago might have seemed overly bullish, and the market
was even cautious earlier this year on a move above US$3,000/oz being sustainable.
The gold targets of some policy banks and institutions are still lagging, at
US$3,200/oz or lower for 2026, although these are from earlier this year and are likely
to soon be updated.
These institutions tend to forecast a gradual improvement in economic growth and
stable or improving geopolitics in forward years, except during periods of clear crisis.
This can lead them to underestimate gold, as a gain in the metal often implies
economic or geopolitical disruption, and their forecasts have been well below the
realized price every year since the 2019 start of the gold bull market. It could actually
be taken as a warning sign if the gold forecasts of these institutions do actually get
ahead of actual price that the bull market is coming to an end. However, we believe
that the likelihood of the institutions turning heavily bullish on gold is still unlikely.
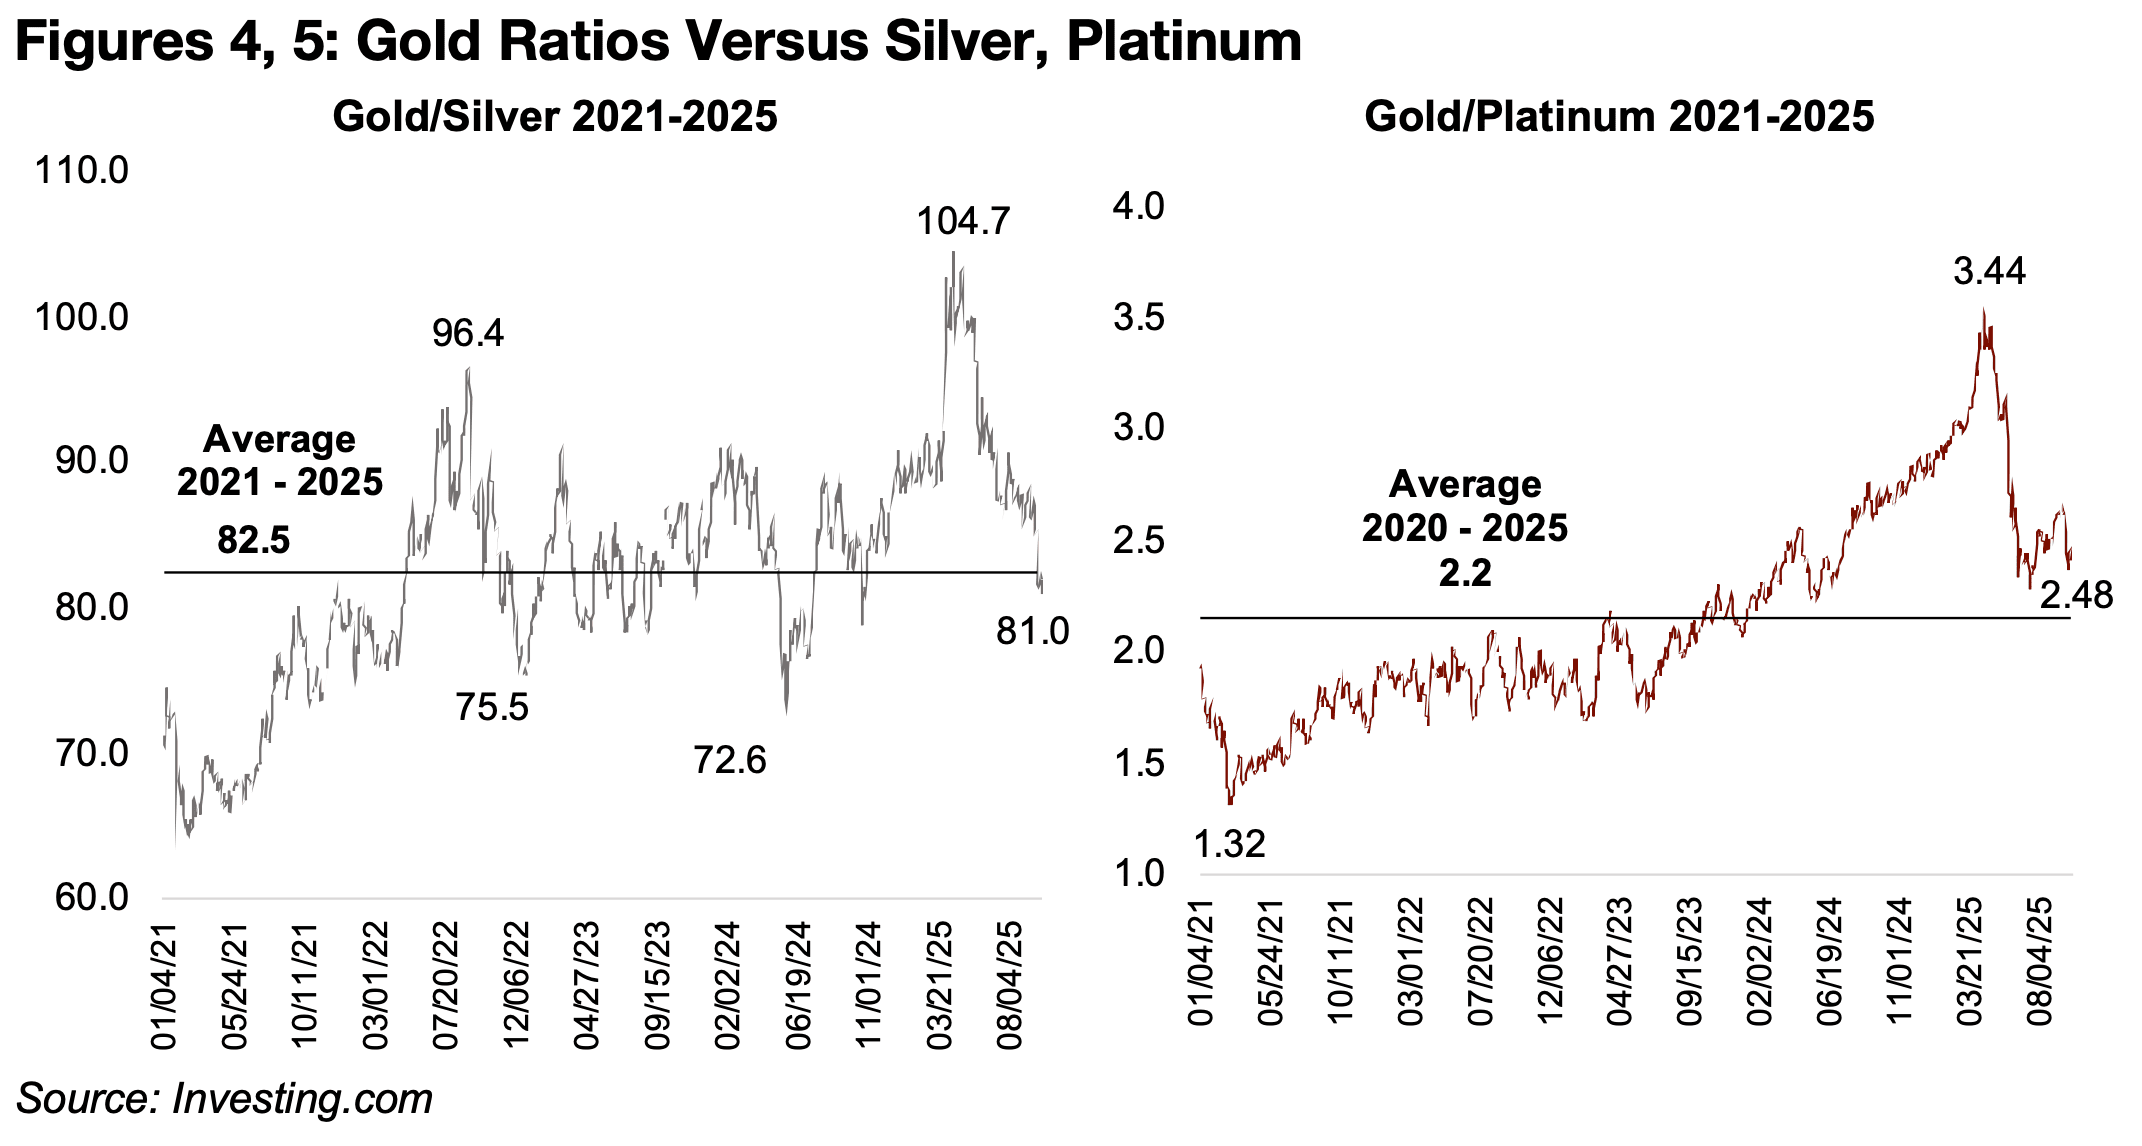
While there is no question about whether there is a gold boom this year, there is still
one over whether it had shifted into a bubble, with the difference between the two
being the degree of fundamental support. Two key indicators of relative over or under
valuation of the metal are its ratios versus its two nearest cousins, silver and platinum.
These ratios surged far above historical averages earlier this year, with gold to silver
peaking at 104.7x and gold to platinum at 3.44x (Figures 4, 5). This implied that either
gold would have to decline or these other metals rise to bring the fundamentals more
into balance. It has clearly been the latter, especially for silver, which has risen so
much that the ratio of 81.0x is now below its 2021-2025 average of 82.5x, but also
for platinum, with its gain driving the ratio to 2.48x, near the 2.20x recent average.
This indicates that if gold is starting to become overvalued, it is doing so along with
the other major precious metals. Silver has nearly matched gold’s performance this
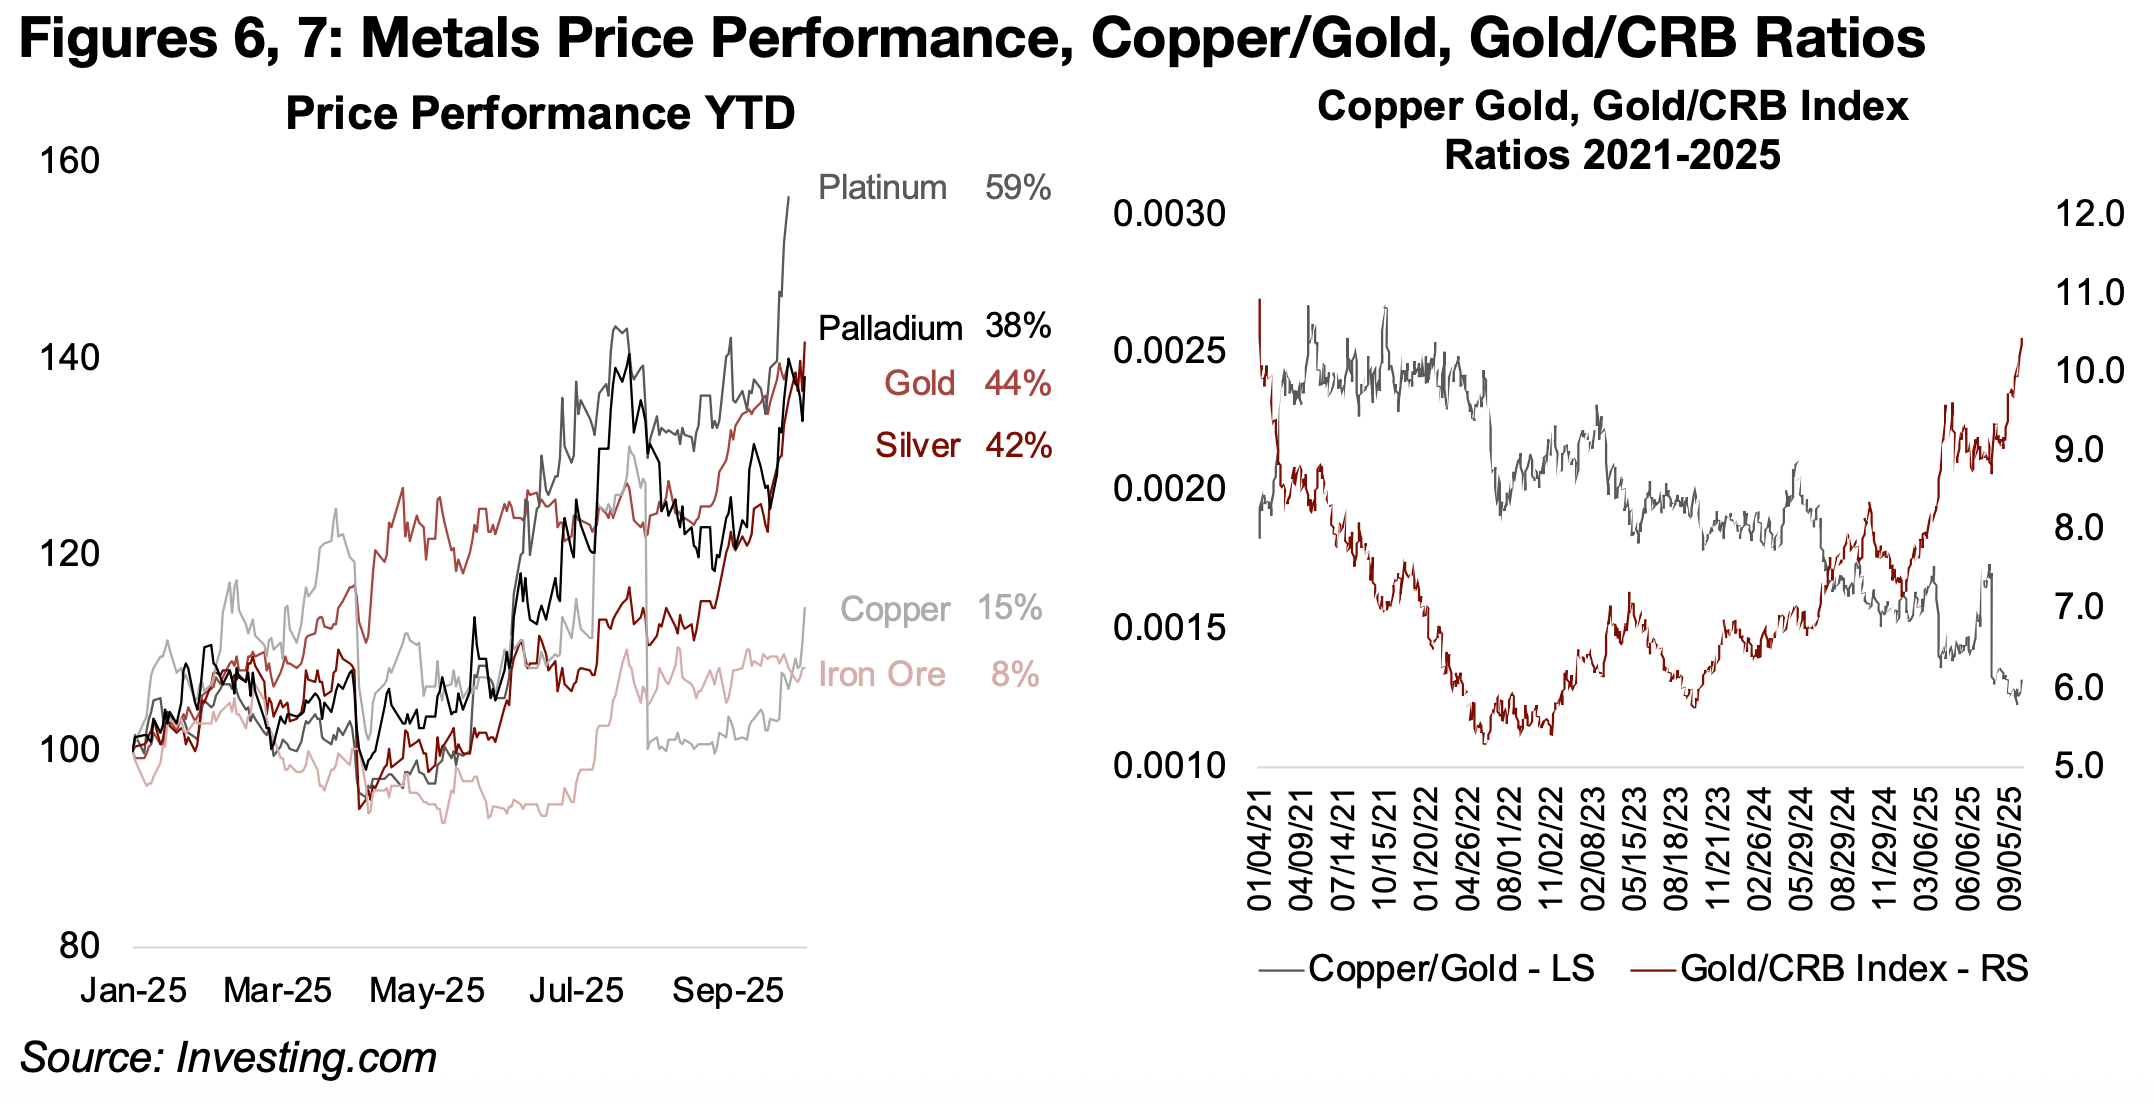
year, rising 42% and platinum has significantly surpassed it, up 59% (Figure 6). The
copper and iron ore prices have underperformed, up 15% and 8%, respectively. This
indicates stagflationary expectations for the market, with monetary driven precious
metals rising and implying inflation, but industrial-cycle driven base metals
underperforming, suggesting muted economic growth.
The ratio of copper to gold also supports this, having declined to its lows of the past
five years (Figure 7). Gold’s ratio to the CRB index is also now near its highs since
2021, and well above the average of recent years, showing relatively weak
expectations for fossil fuels, base metals and agriculture commodities prices versus
the almost entirely monetarily driven metal.
A key fundamental support for an upward move in the gold price is an increase in the
global money supply. The value of the above ground stock of gold tends to rise along
with the money supply over time, with it viewed as a currency in wider sense. While
it is not widely accepted as a means of exchange, it still forms a key component of
the monetary reserves of most countries. The value of the global gold stock to money
supply has ranged from as high as 30% in 1980 to just 4.0% in 2000 and averaged
8.9% from 1979 to 2023.
We estimate that the gold stock value to money supply is 15.4% for 2025, assuming
global money supply growth of 4.9%, which is inline with average weighted growth
rates across the US, Europe, China and Japan this year. While this is up from 9.8%
in 2023 and 11.8% in 2024, and significantly above the long-term average, is it still
only about half the 30% previous peak. Also, the market may be assuming that the
money supply growth next year is considerably higher, which could bring this ratio
back towards the average.
Other major factors driving gold include the US$, which tends to move inversely to
the metal, and has trended down this year, and could continue to fall as US rates cuts
make other currencies relatively attractive. The inflows into gold ETFs also continue
to be high and are on track for a record year, with the recent run in the metal price
likely to support further mainly retail interest in these funds. Another driver that could
be boosting gold is falling real yields, as nominal yields are declining while inflation
for most regions has flattened. This makes the opportunity cost of holding yield-less
gold lower.
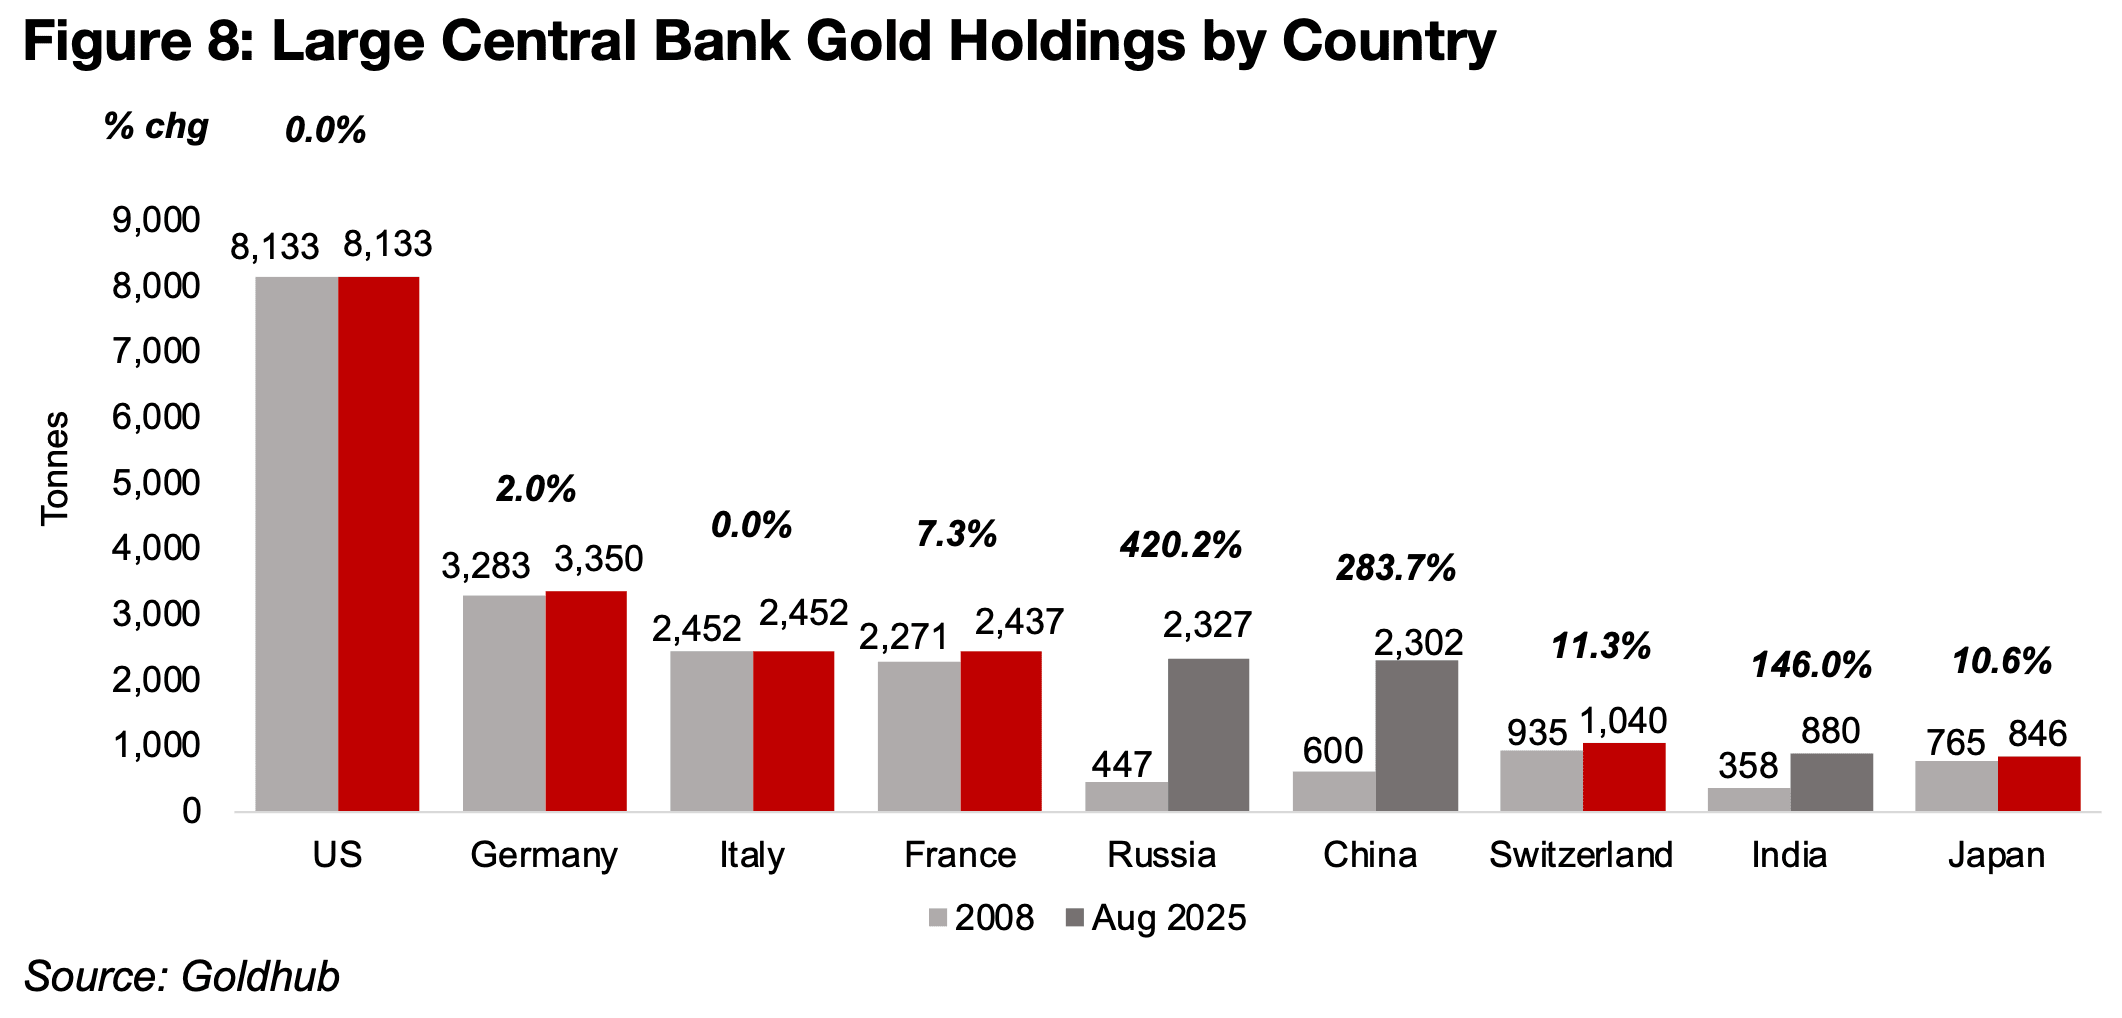
There has also been a large and rising demand for gold from central banks. Net purchases began in 2008 after the global financial crisis, following many years of net selling. This trend seems to have shifted from an initial push to protect against further financial disruption to a hedge against a relative decline of US$ dominance more recently. While the dollar will remain a major currency, its role as the only reserve currency has diminished as other economies become a larger proportion of global production and look to trade directly with each other. The biggest increase in holdings has come from Russia and China, up 420% and 284%, respectively, since 2008, rising to the fifth and sixth largest (Figure 8). While India’s holdings are less that than half of these two countries, growth has also been high at 146%. The holdings for the US, Germany, Italy and France, have been flat, or increased slightly.
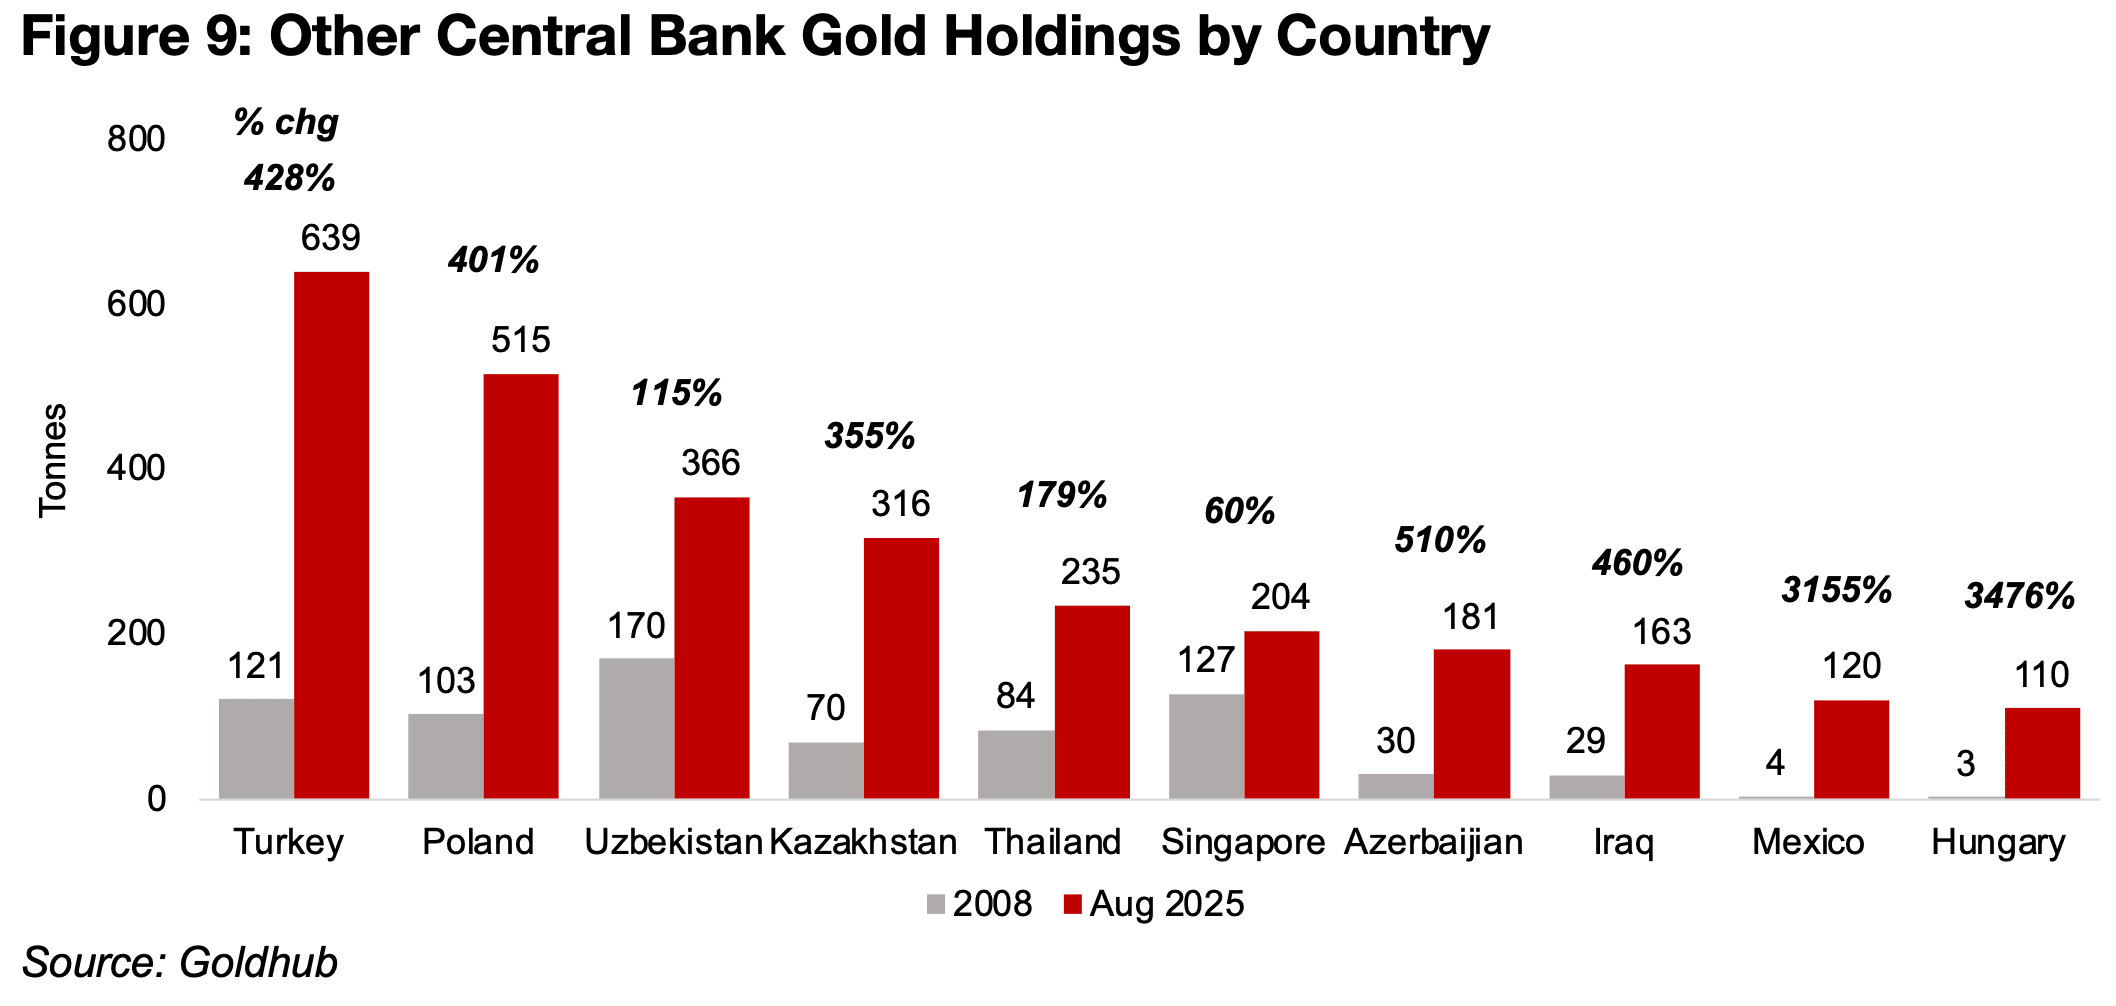
Many mid-sized economies have also seen a huge rise in gold reserves with many
increasing several hundred percent since 2008 (Figure 9). The holdings of some are
even up a few thousand percent, from near zero holdings, showing just how much
the perception of gold has changed by these central banks over the past two decades.
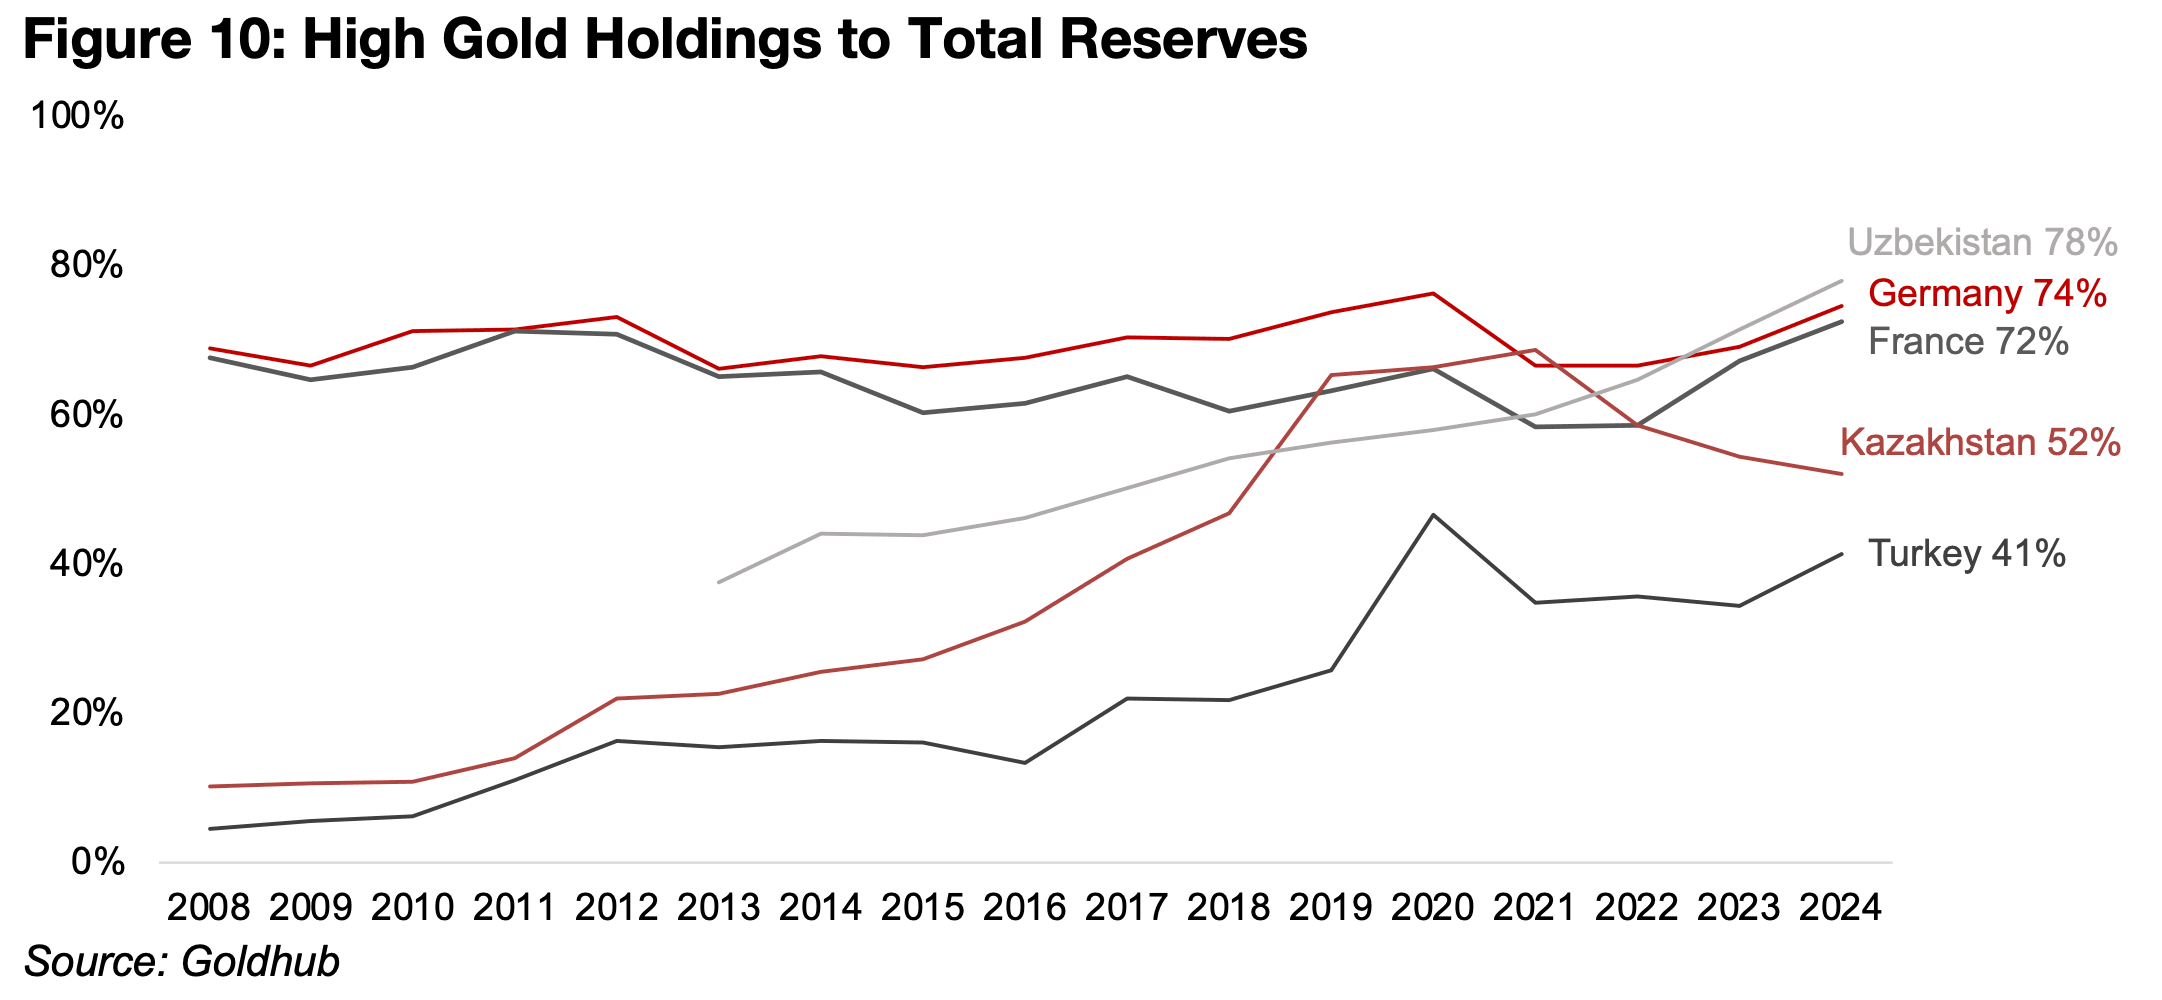
Gold has generally trended up as a percentage of the total reserves of central banks.
Several countries have most of their reserves in gold, with this consistent since 2008
for Germany and France, but more recent for Uzbekistan, Kazakhstan and Turkey
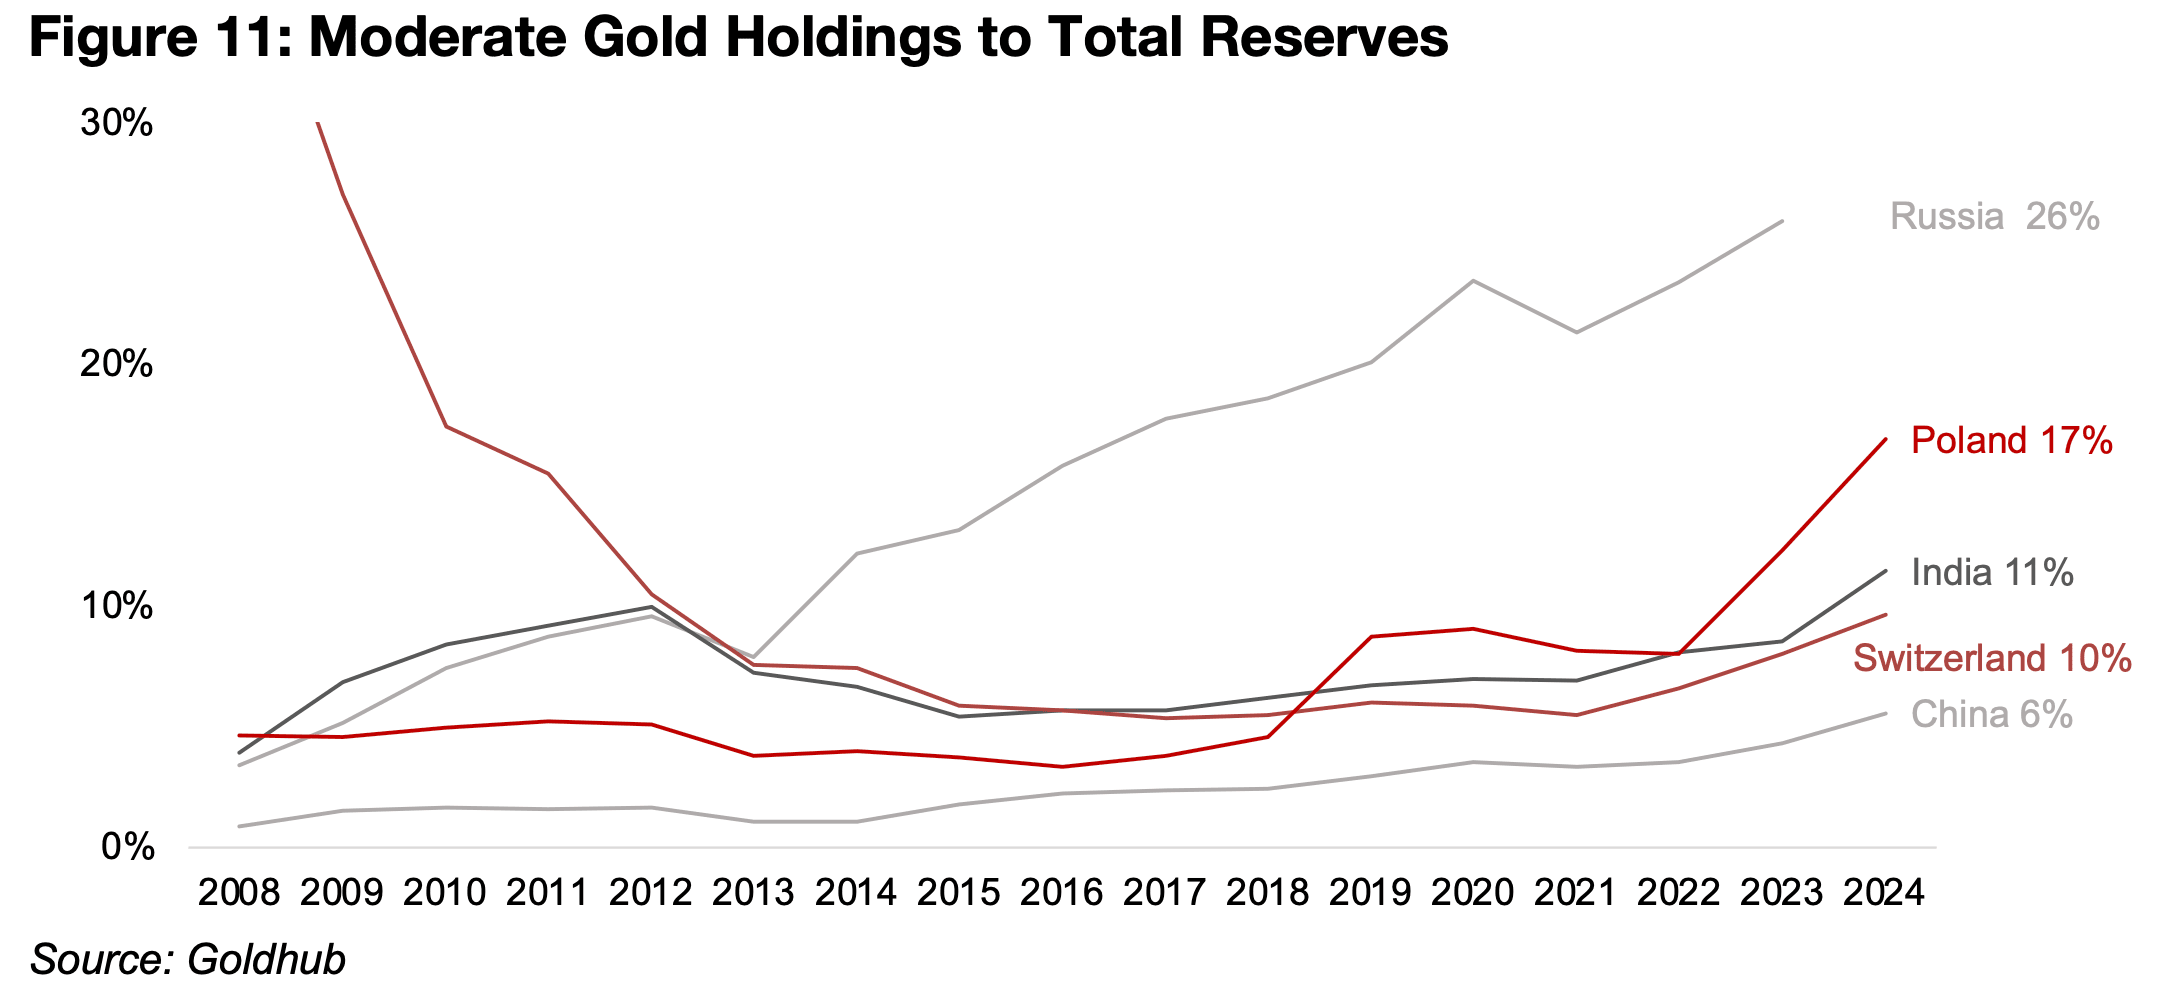
(Figure 10). Several other large countries have moderate gold holdings in their
reserves, but the level has risen substantially since 2008, except for a decline for
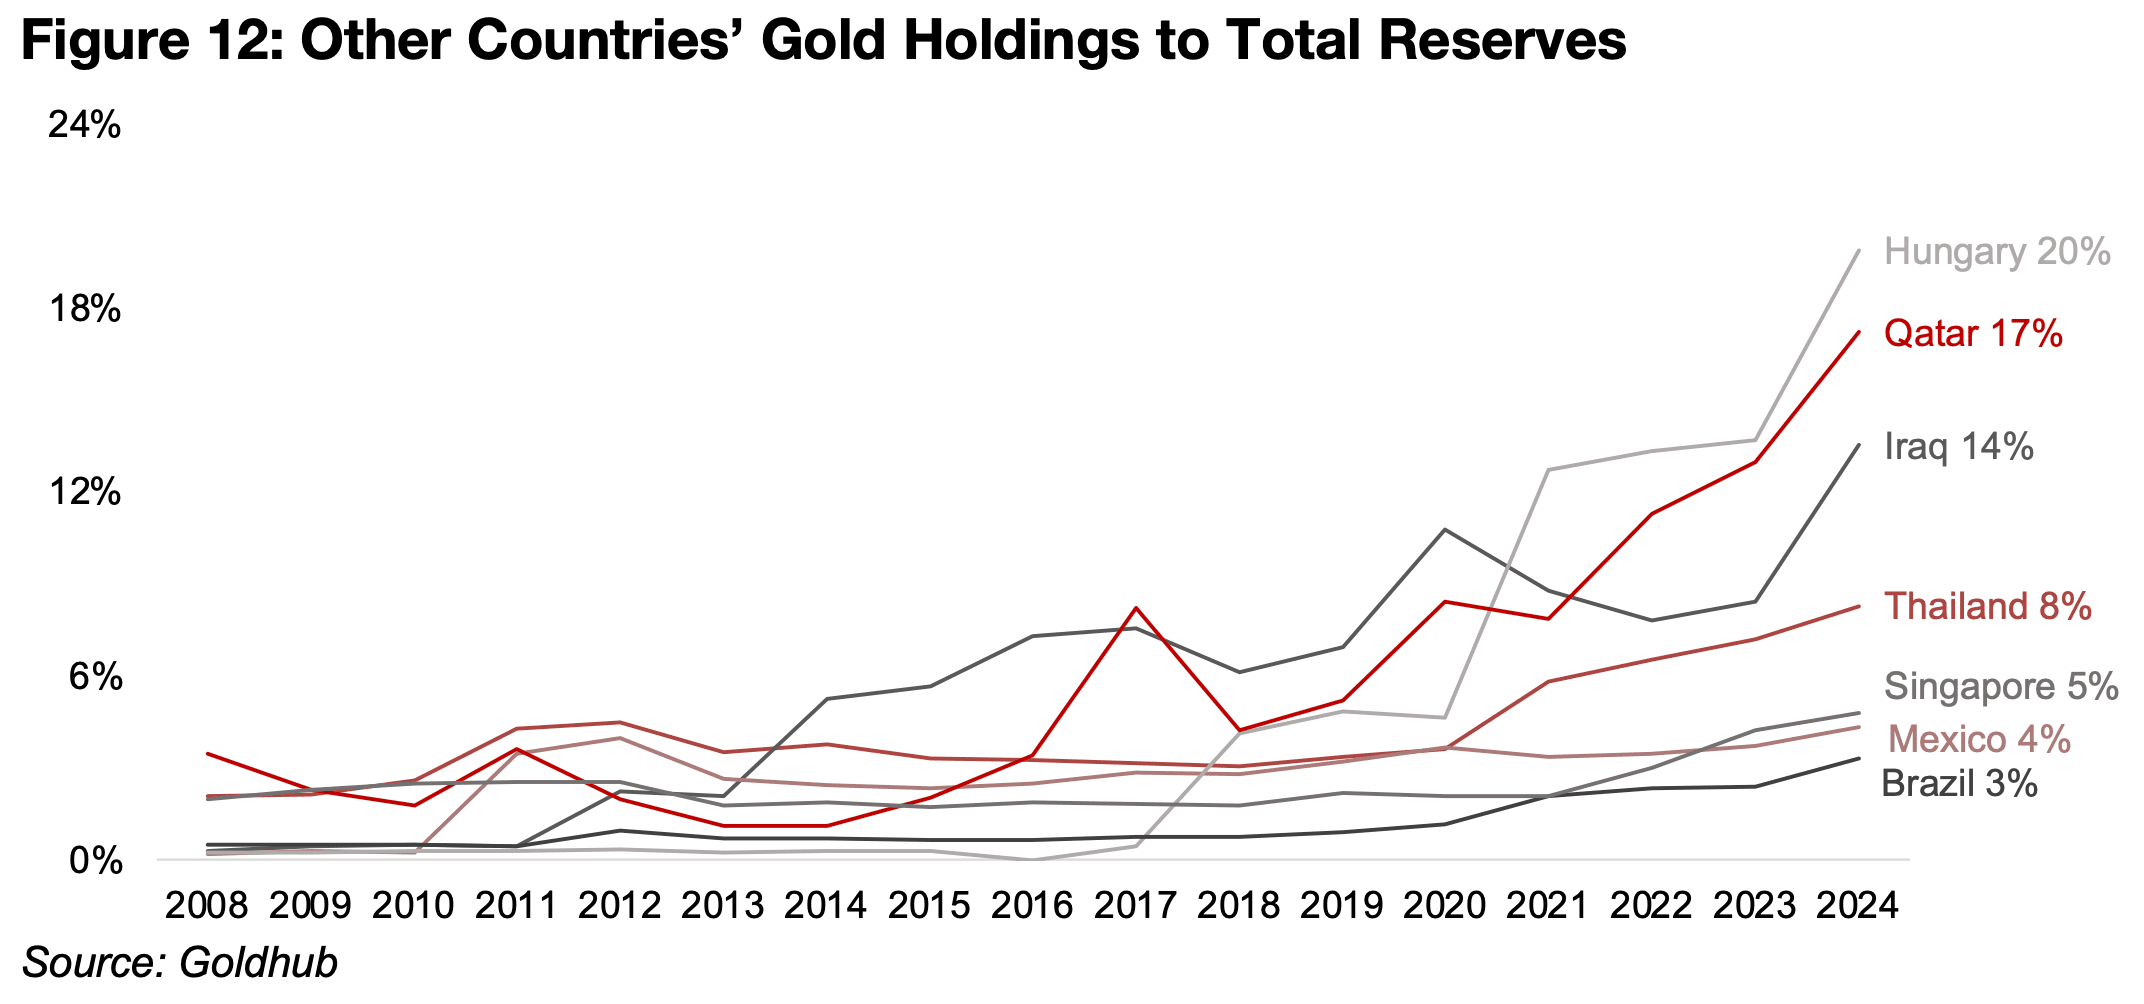
Switzerland (Figure 11). Many mid-sized countries have seen substantial increases in
gold as a percentage of reserves especially over the past five years (Figure 12)
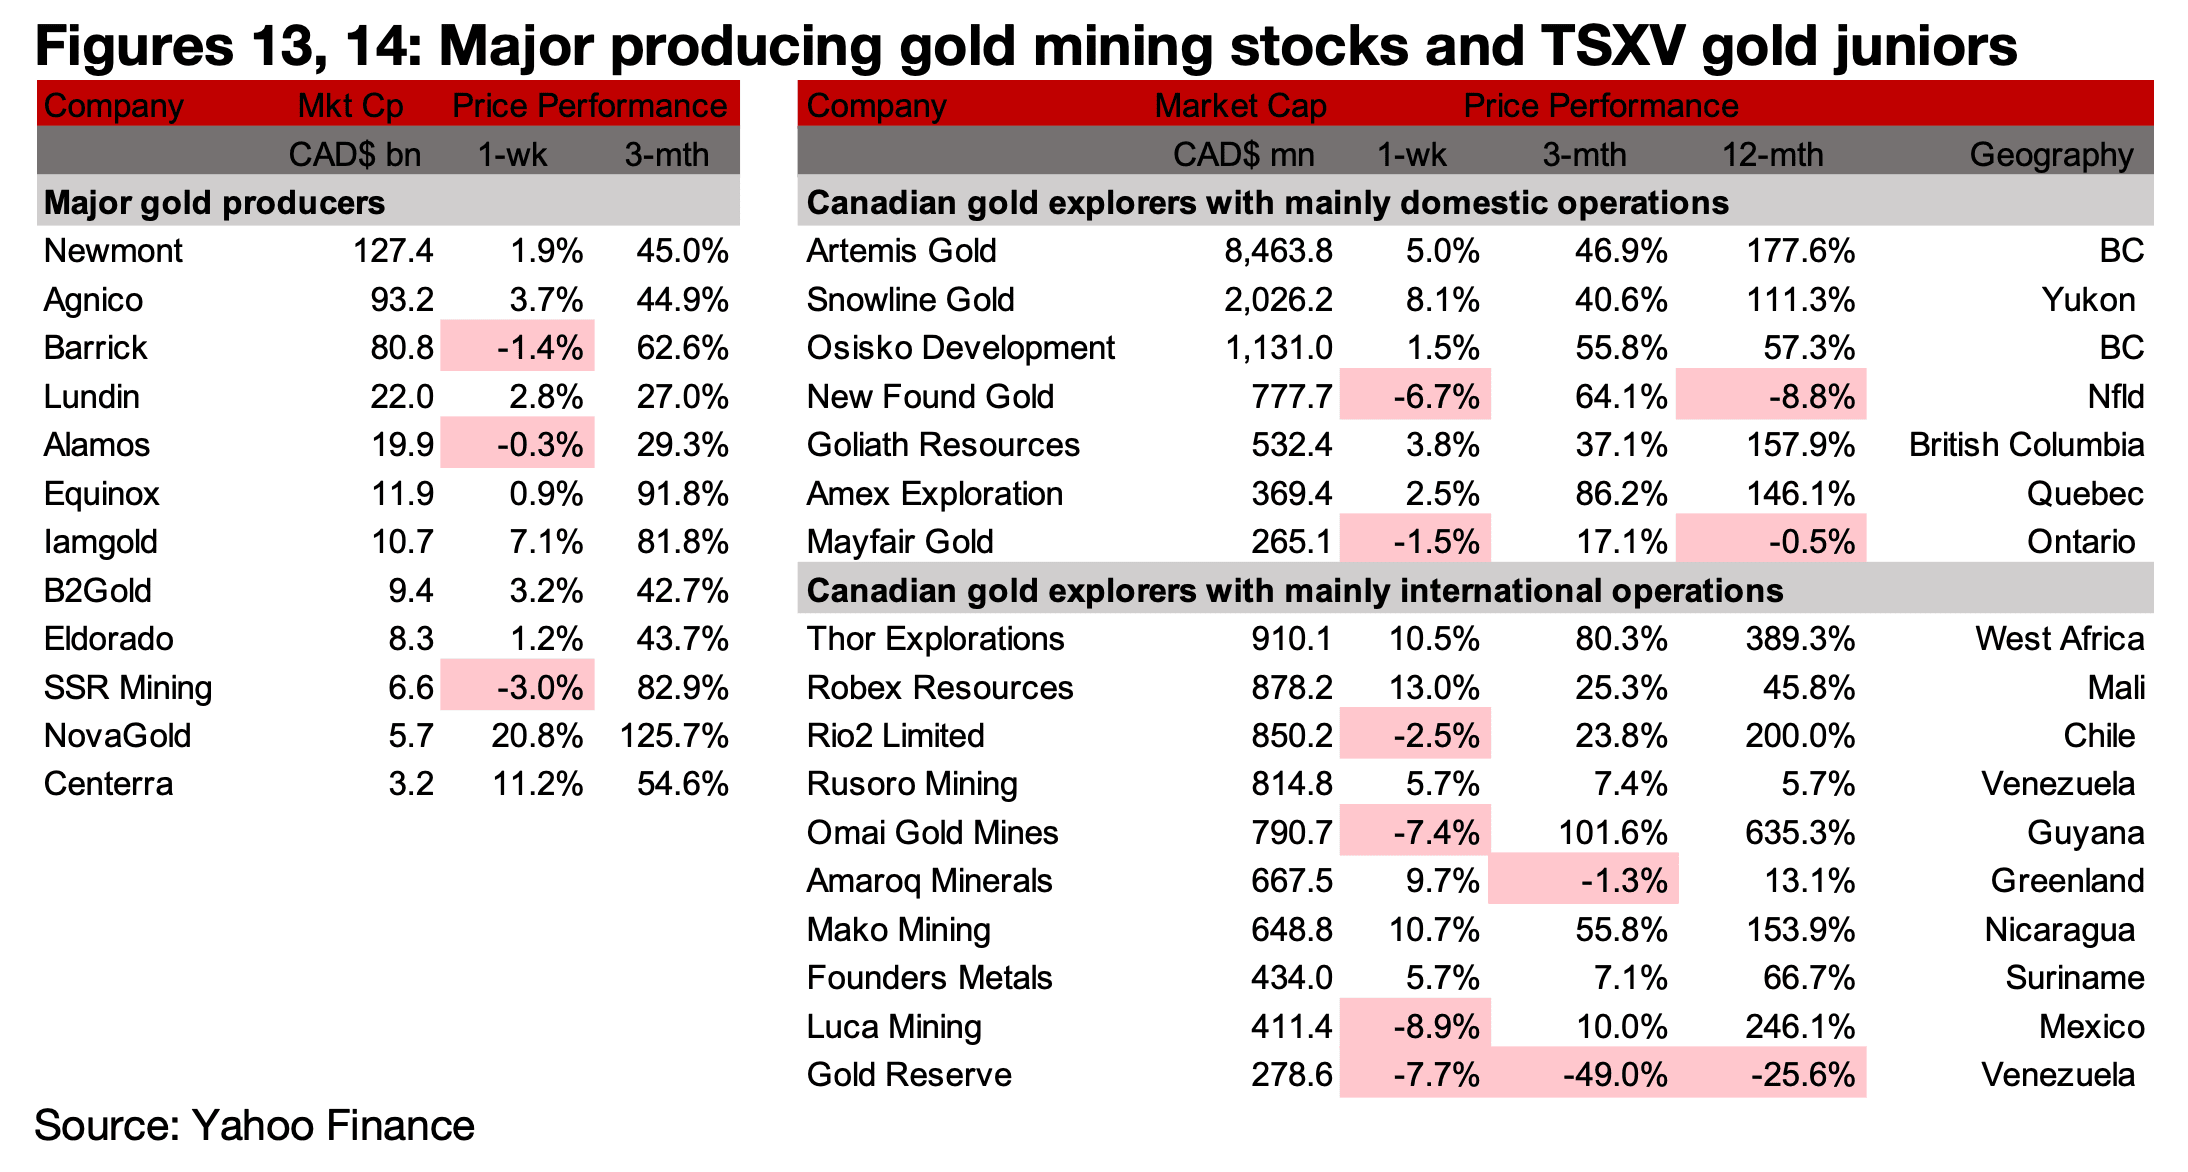
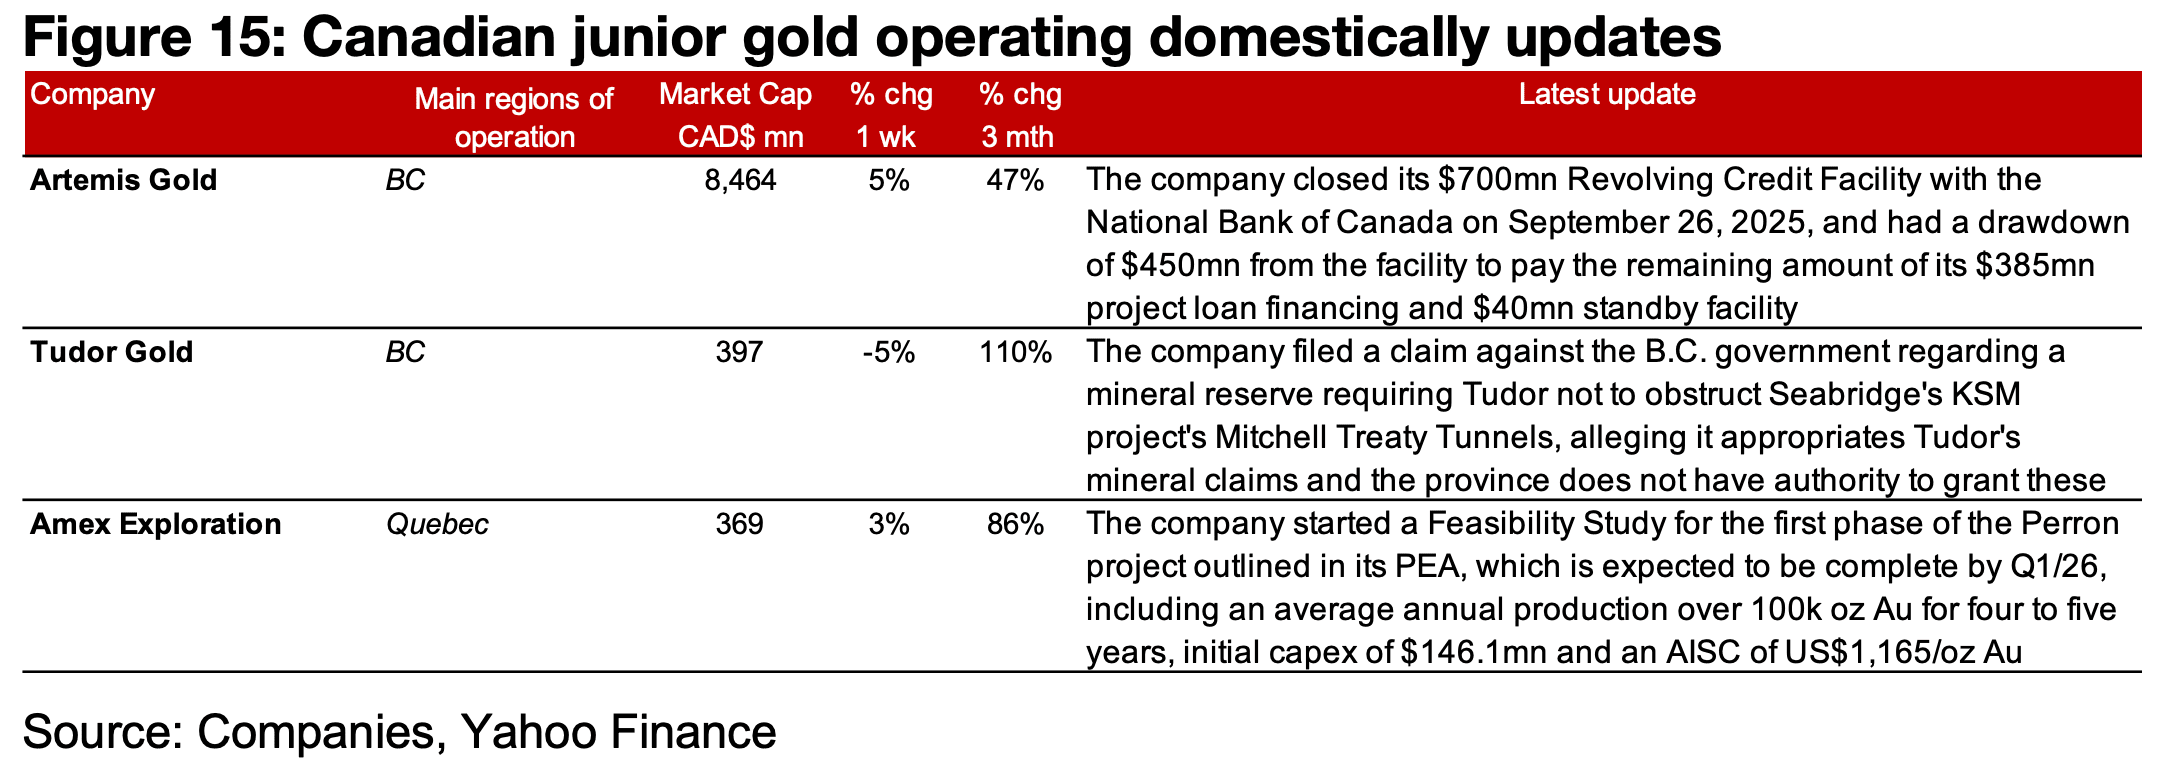
Most of the major producers rose and TSXV gold was mixed (Figures 13, 14). For the
TSXV gold companies operating mainly domestically, Artemis Gold closed its
$700mn credit facility and made a $450mn drawdown to pay the remaining amount
of its project loan financing and standby facility. Tudor Gold filed a claim against the
B.C. government over a mineral reserve including Seabrige’s KSM project’s Mitchell
Treaty Tunnels, alleging that this appropriates Tudor’s mineral claims and that the
province does not have authority to grant these rights and Amex Exploration started
a Feasibility Study for the first phase of the Perron project (Figure 15).
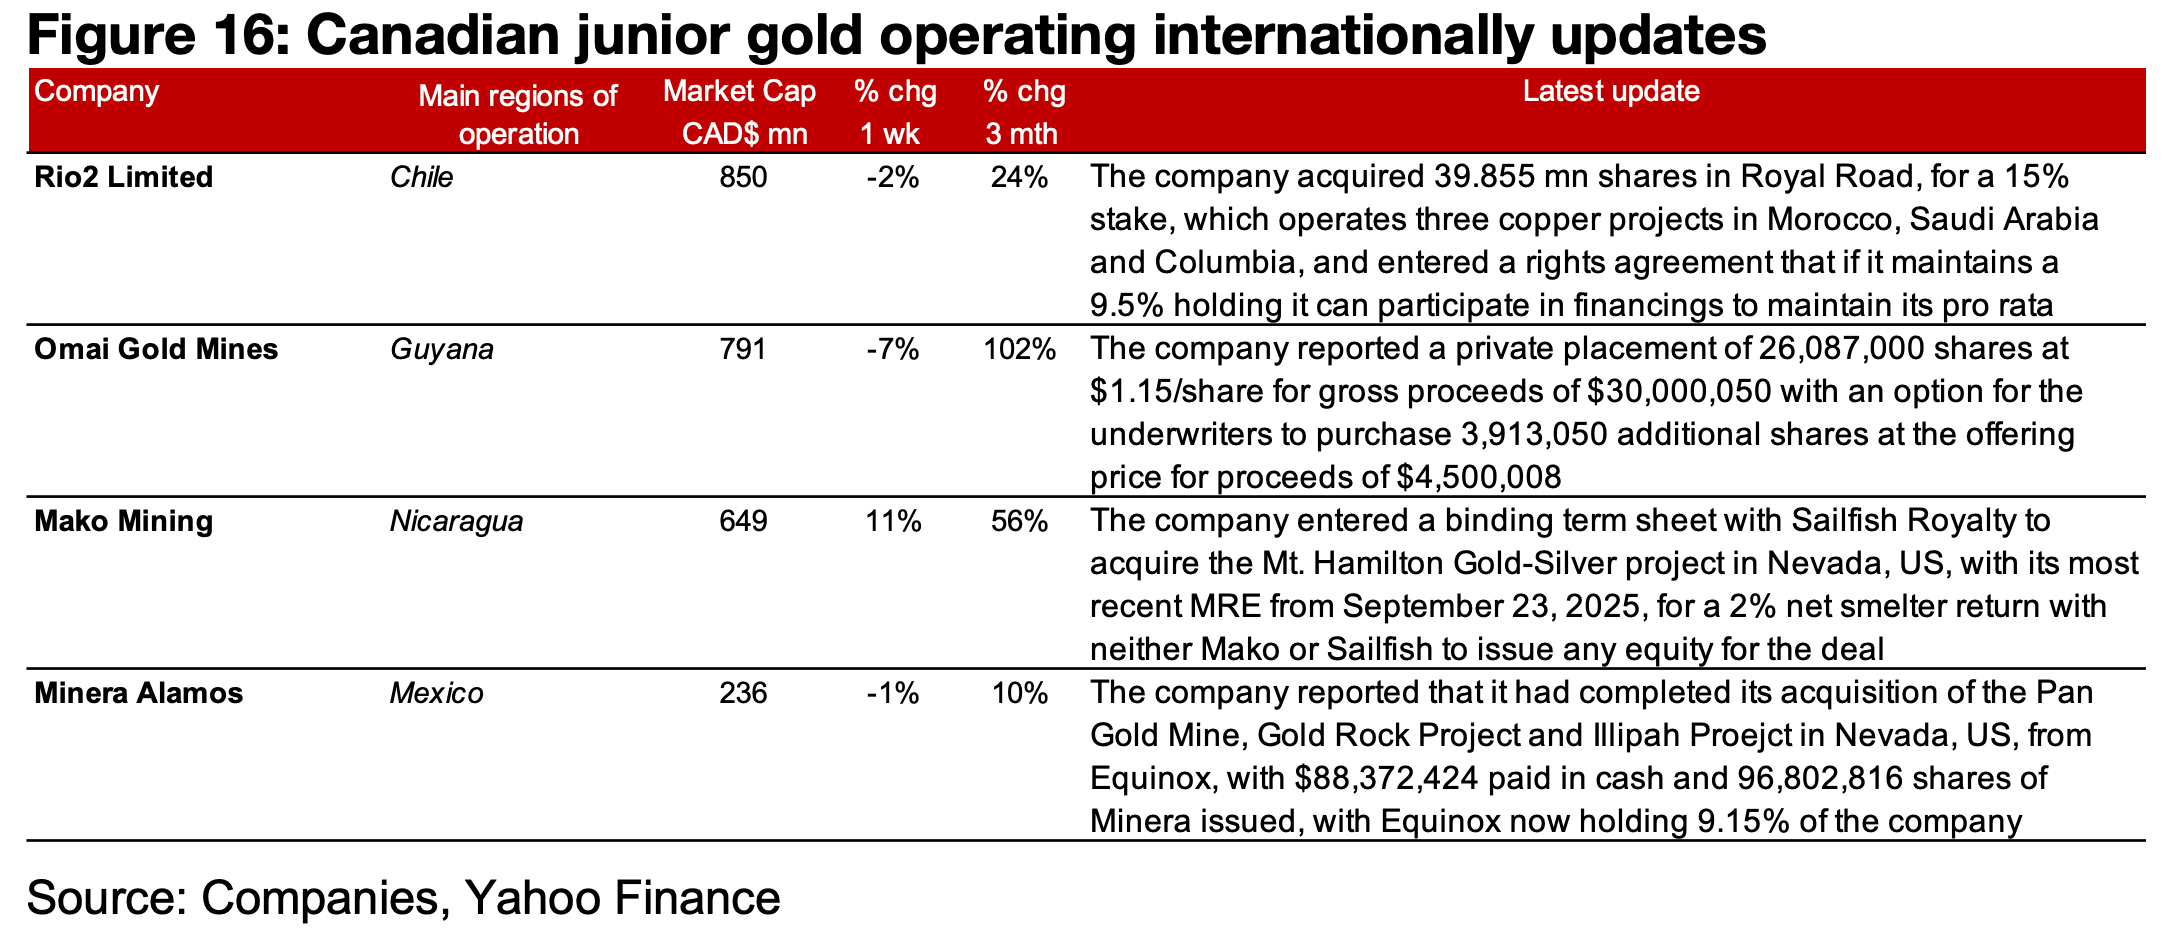
For the TSXV gold companies operating mainly internationally, Rio2 acquired a 15%
stake in Royal Road, Omai reported a $30.0 mn private placement, Mako Mining
plans to acquire to acquire the Mt. Hamilton project from Sailfish Royalty and Minera
Alamos completed its acquisition of the Pan Gold Mine, Gold Rock Project and Illipah
Project (Figure 16).
Disclaimer: This report is for informational use only and should not be used an alternative to the financial and legal advice of a qualified professional in business planning and investment. We do not represent that forecasts in this report will lead to a specific outcome or result, and are not liable in the event of any business action taken in whole or in part as a result of the contents of this report.
Author
Ben McGregor authors the Weekly Roundup at CanadianMiningReport.com, providing sharp analysis of the metals and mining sector. With a talent for spotting trends, Ben distills complex market shifts into clear, engaging insights on TSXV junior miners. His weekly updates cover gold, copper, uranium, and more, blending data-driven perspectives with a knack for identifying opportunities. A vital resource for investors, Ben’s work navigates the dynamic junior mining landscape with precision.