
April 06, 2026
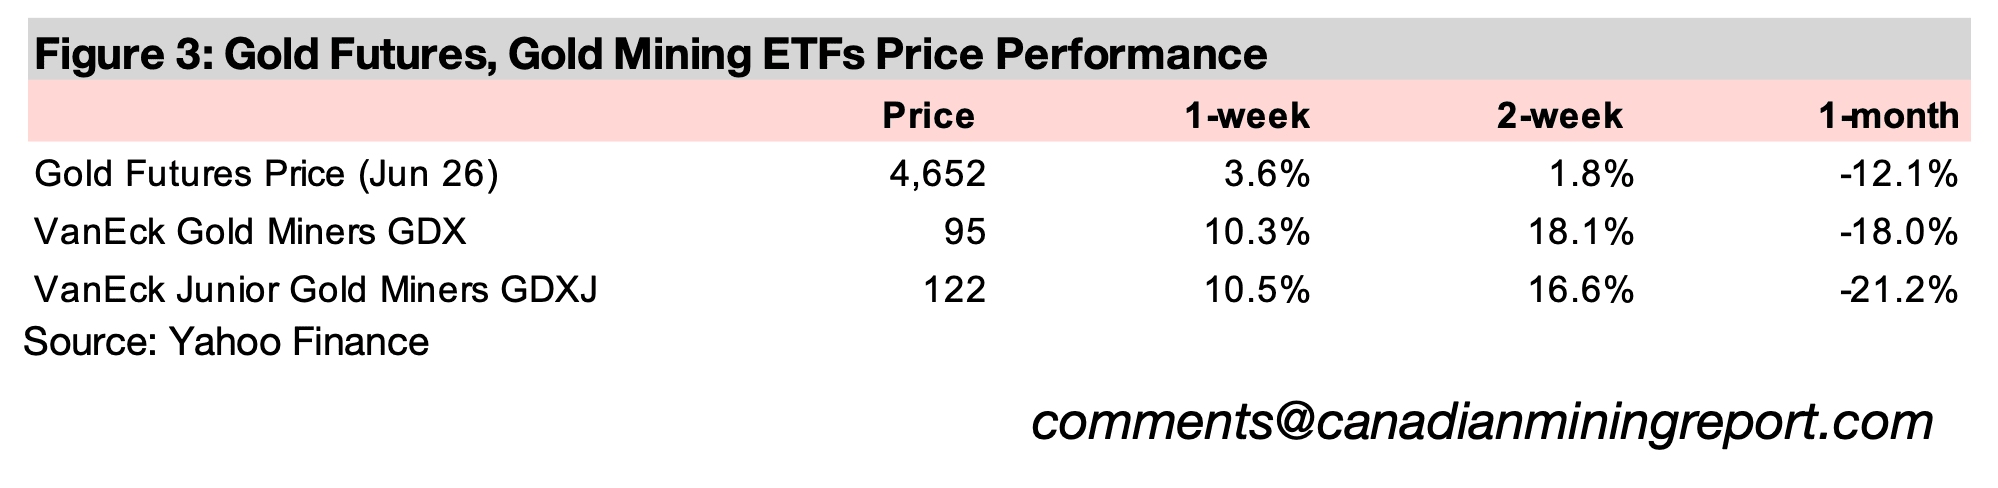
Gold rose 6.3% to US$4,652/oz, rebounding from the worst plunge in twenty years, as markets may be weighting the metal’s long-term safe-haven attributes more heavily than short-term rate hike risks, and a reversal of speculative positions eased.
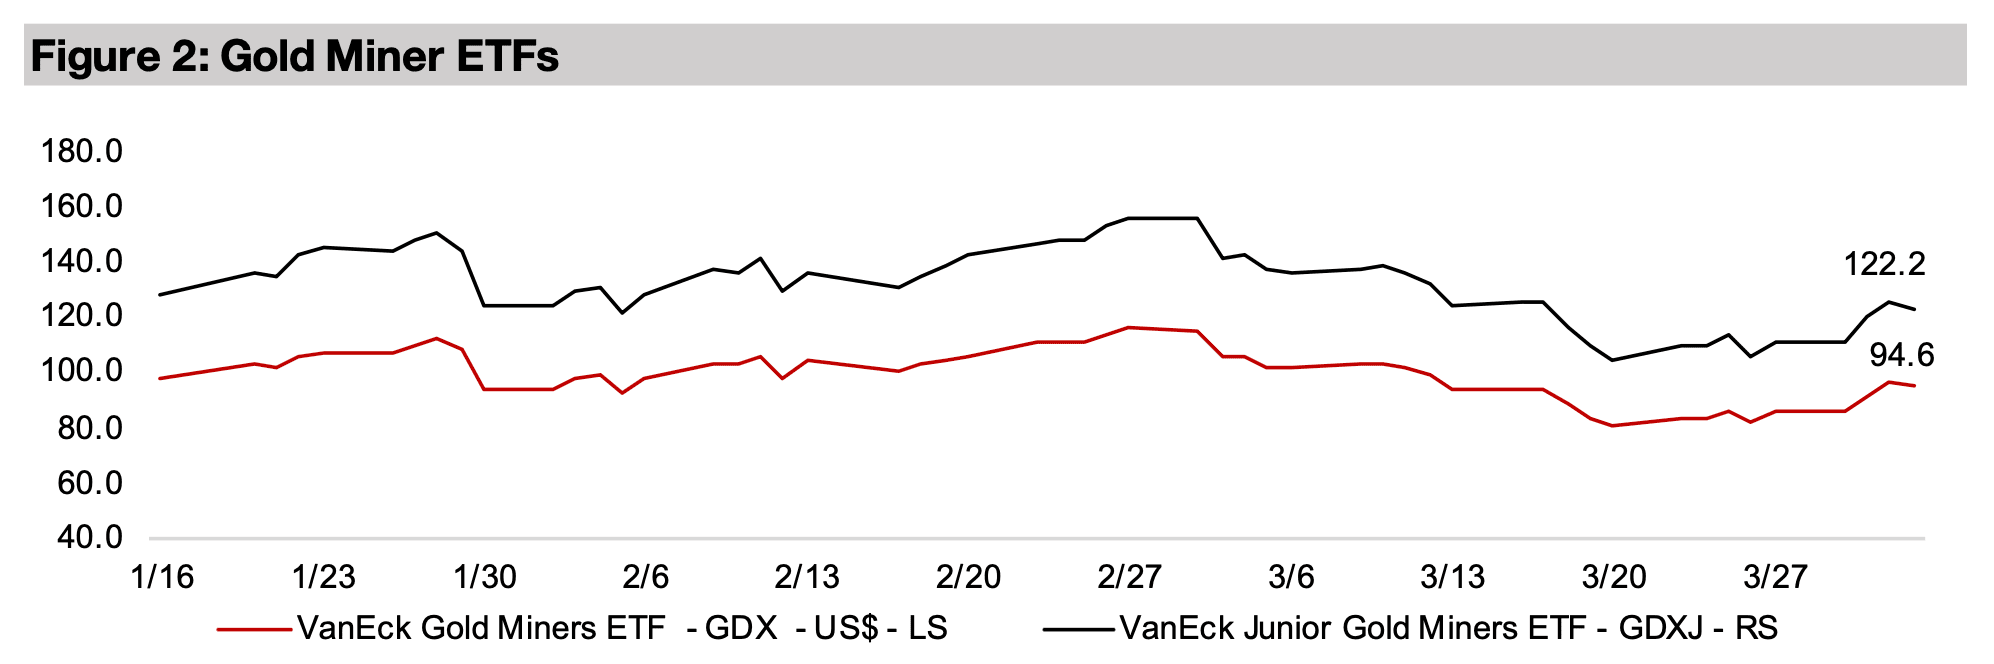
The gold stocks rose for a second week with the GDX up 10.3% and GDXJ gaining 10.5% on the rebound in the metal price, outperforming equities, with the S&P 500 and Russell 2000 up 2.0%, but tech lagging with the Nasdaq near flat, up just 0.2%.


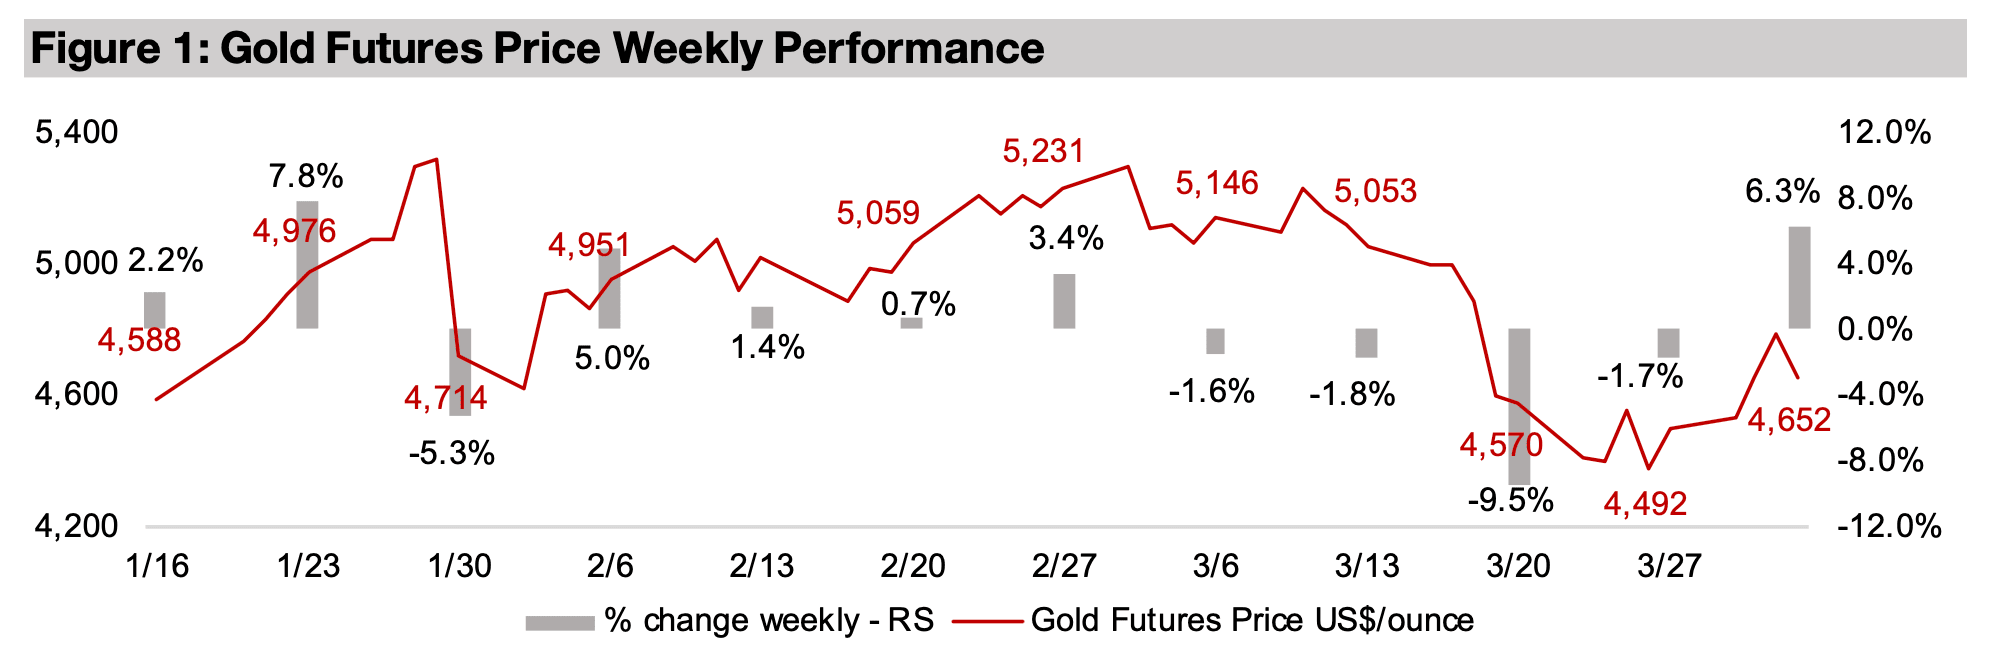
The gold price bounced 6.3% to US$4,652/oz, after edging down last week following
one of its biggest drops in twenty years two weeks ago. This plunge had been
preceded by an increasingly speculative move from December 2025 to January 2026,
which had already started to reverse in February 2026 and was severely exacerbated
by the war in the Middle East. The conflict drove the US Fed to hold rates flat and
even indicate the potential for hikes if the spike in the oil price drove up inflation, in
major contrast to the cuts previously widely expected for this year.
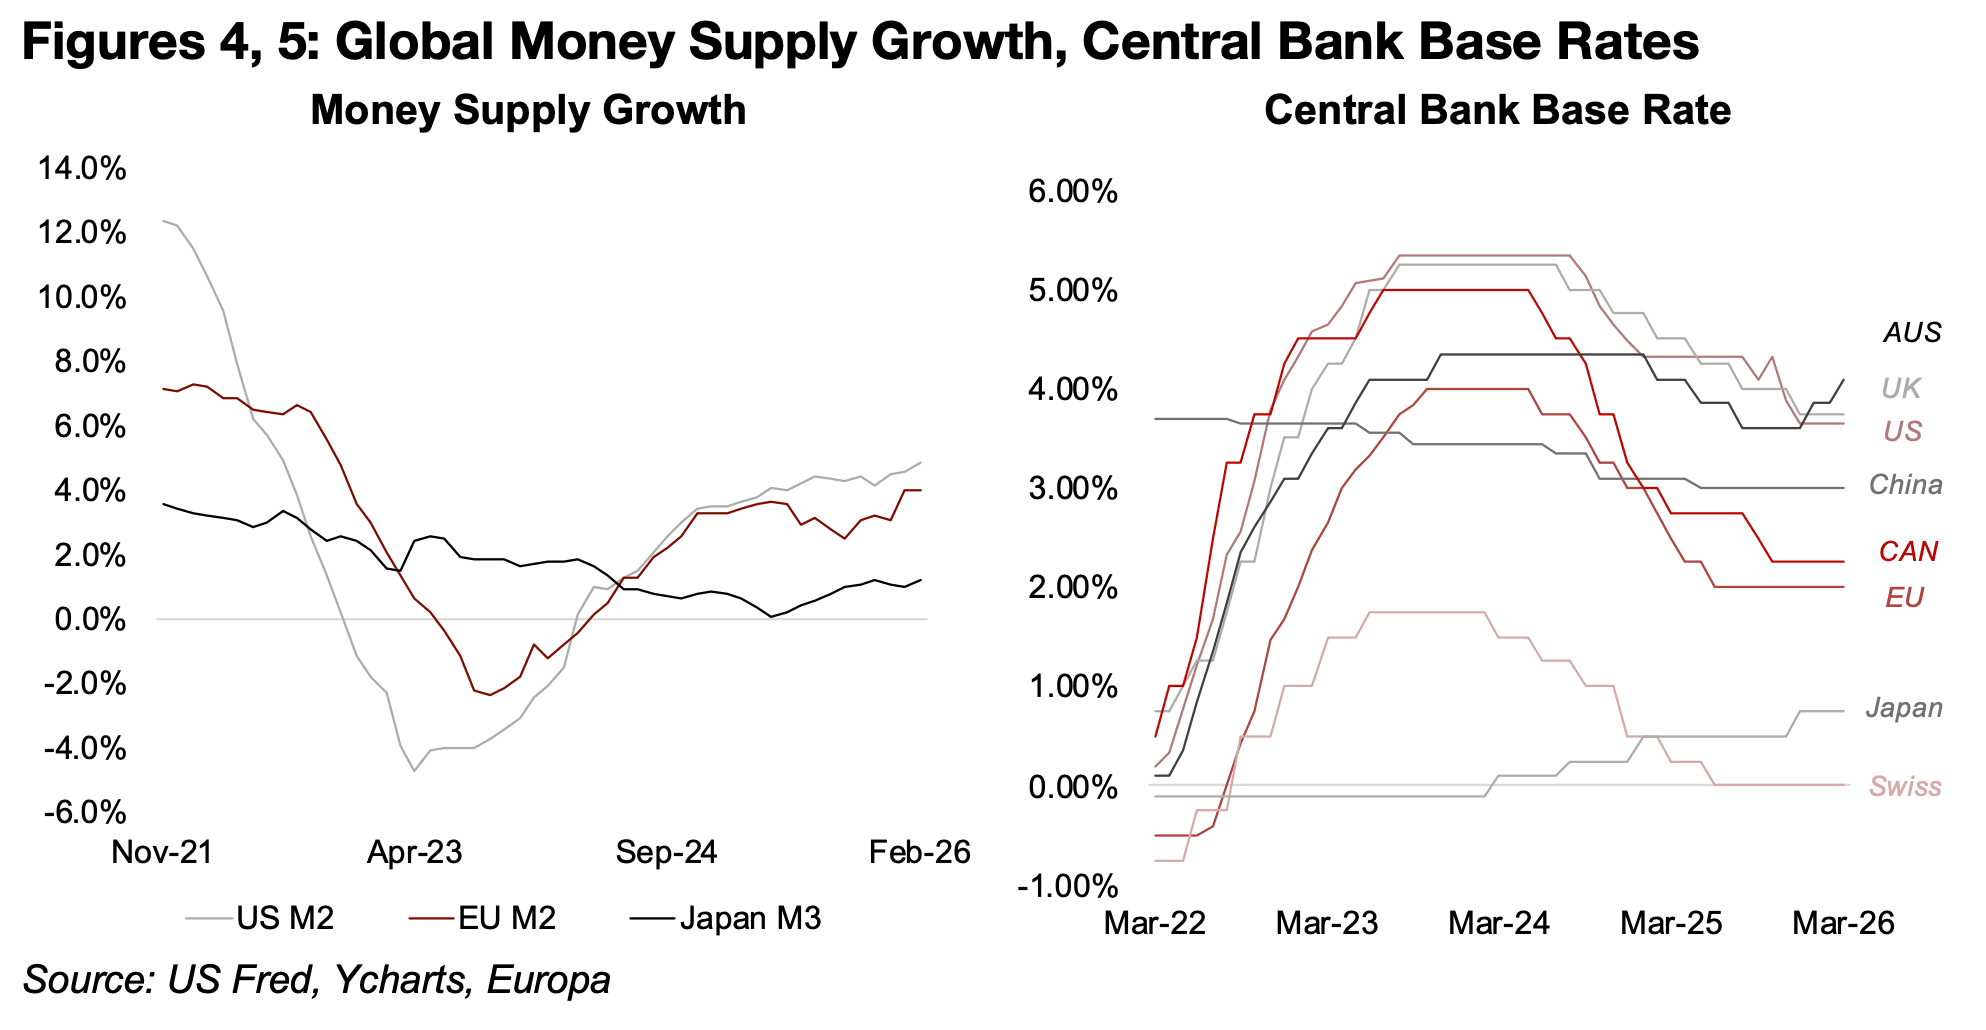
This increased fears that other global central banks could also adopt this new
hawkish stance, and bring a halt to gold’s most key fundamental driver, global money
supply growth. The M2 money supply growth in the US and Europe has been trending
up over the past year, to 4.9% and 4.0% respectively, and even Japan, which has
had historically low growth for this metric, has increased to 1.3% (Figure 4). There
have also already been some signs of rising hawkishness, with most major central
banks pausing cuts recently, and Australia and Japan actually hiking rates (Figure 5).
However, the rebound this week seems to indicate that the market is viewing the
recent slump as overdone. While the Fed decision did warrant a degree of decline in
gold, a second major cause of the drop was likely the continued unwinding of
speculative positions in the metal. These can often be leveraged, and if markets move
against these positions, there can be forced selling, driving asset values substantially
below fundamental values for a time. Equities were also declining at the same and
losses may have been covered by selling assets with substantial gains, and both the
metal and the gold stocks are still up substantially over six months.
The market may also be reconsidering its initial reaction to the Fed’s new stance,
which seemed to focus on the short-term negatives of a potential slowdown in the
global monetary expansion and a rise in the dollar and real yields, which tend to move
inversely to gold. It may now be putting a higher weighting on the medium to longterm effects of an extended period of high oil prices, inflation and rates, which would
eventually put major downward pressure on global economic growth. This could drive
central banks back into monetary easing to curb this, or cause stagflation, with high
inflation and low growth, with either of these scenarios tending to support gold.
There is also the issue of the huge rise in geopolitical risk, which usually would have
been expected to support the gold price. However, in the recent slump, the market
was clearly weighting the downward pressure from a sudden surge in rates far higher
than any potential gains to gold from the war. While this may have been because
markets were expecting a short conflict, that would have implied a reversal in the oil
price, lower inflation expectations, and no plunge in gold. This apparent mismatch
again points to a reversal of speculative positions causing a downward spiral. We
now may now be seeing the market starting to price in a longer potential conflict.
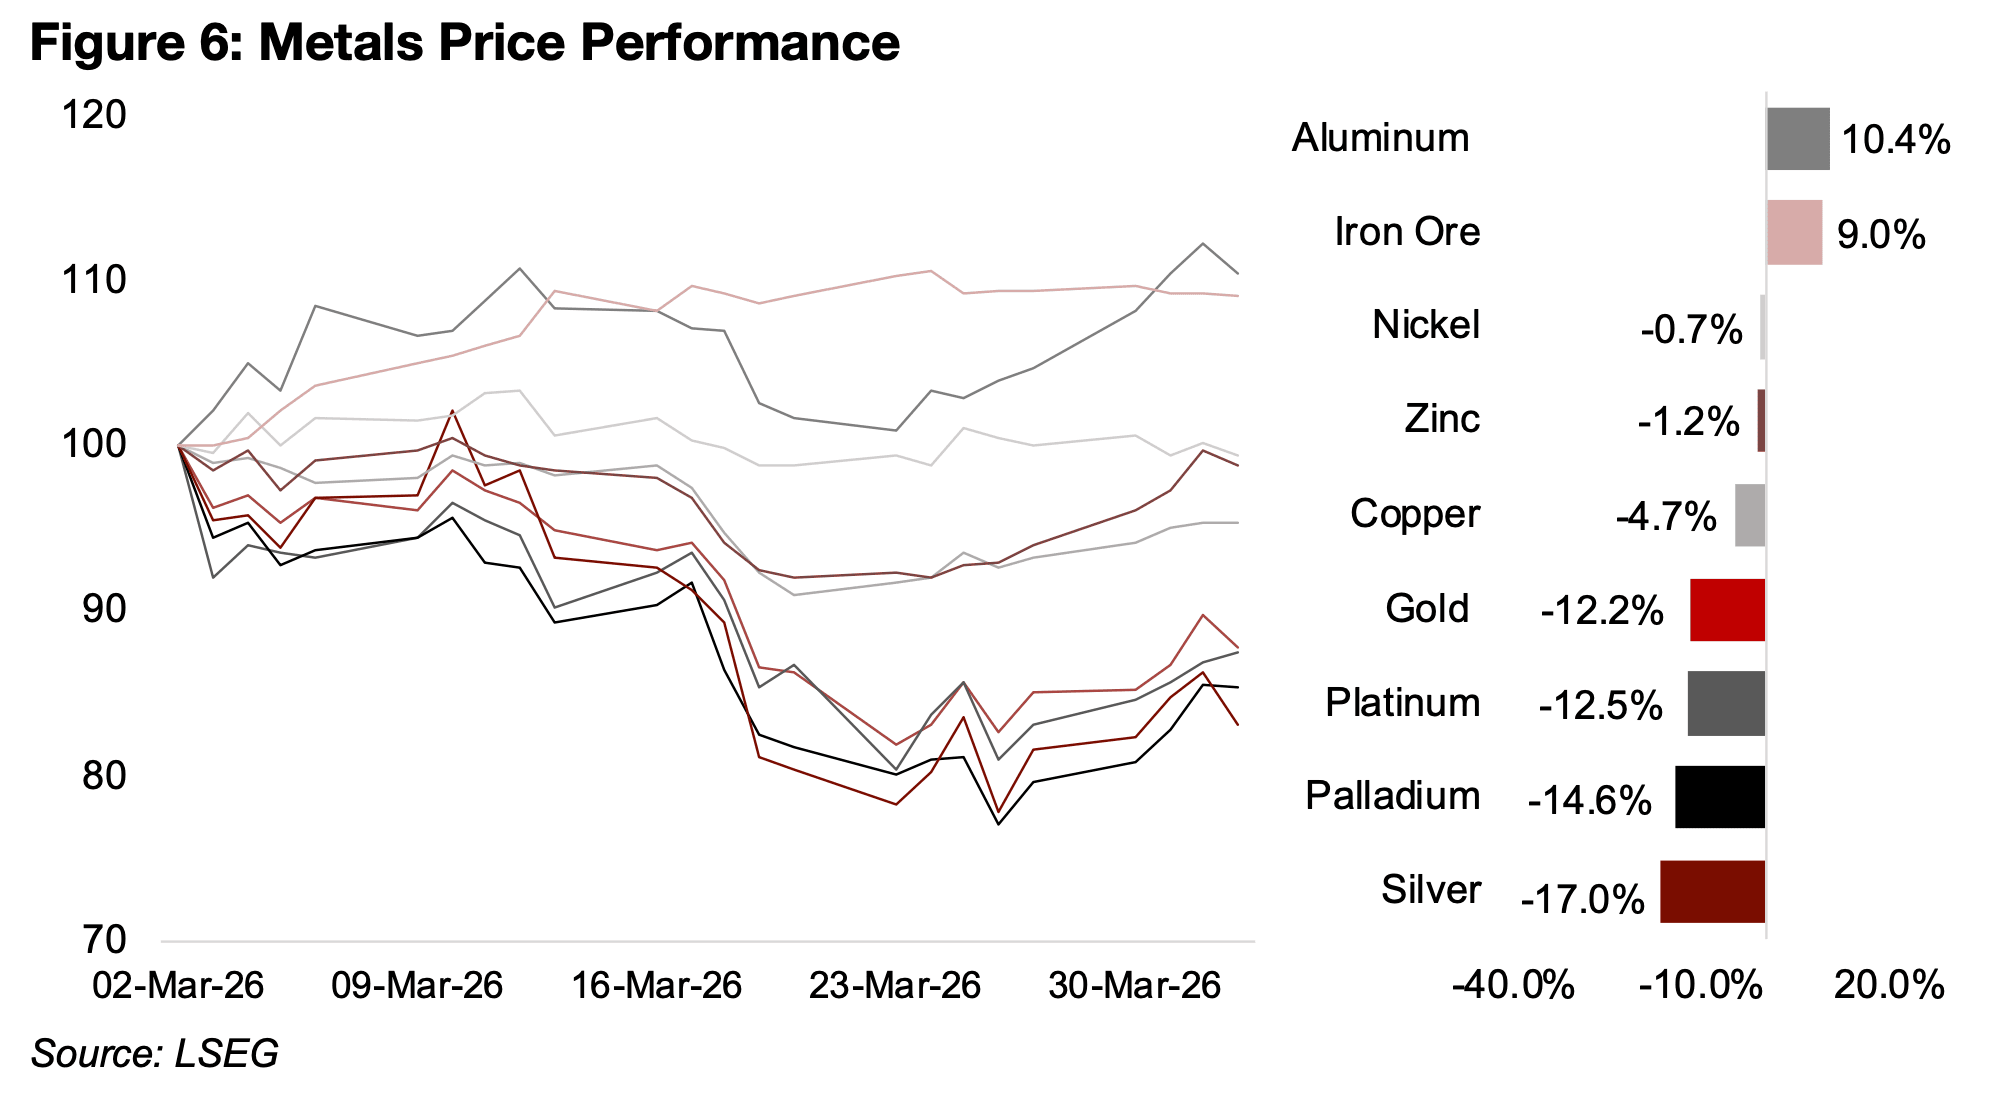
While the other precious metals have also rebounded over the past week, the sector remains down substantially since March 2026. Silver, palladium, platinum and gold are down -17.0%, -14.6%, -12.5% and -12.2%, respectively, with these losses in the same order as the highs of their earlier booms (Figure 4). The base metals have outperformed, especially aluminum and iron ore, up 10.4% and 9.0% respectively, with nickel and zinc near flat, down of -0.7% and -1.2%, and copper off -4.7%.
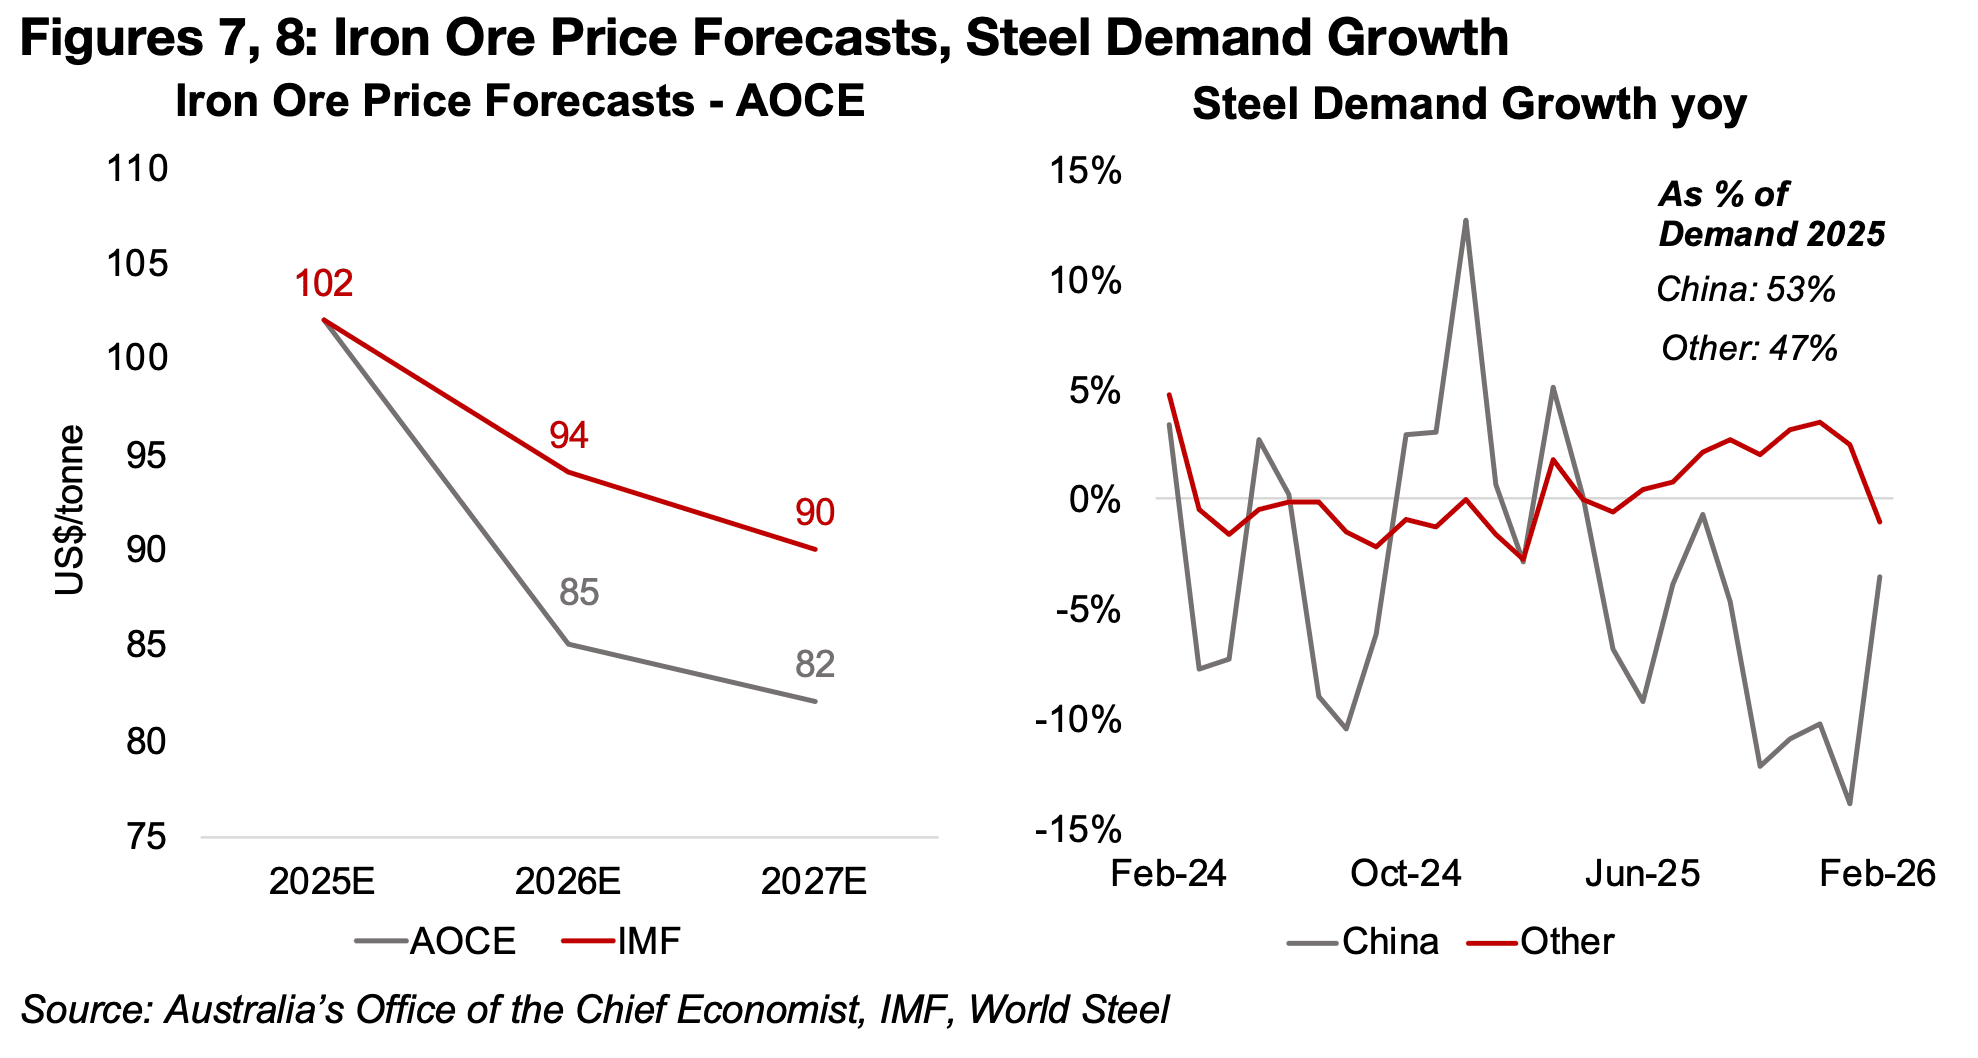
The iron price has been supported especially by a major rebuild of portside
inventories of iron ore in China, to their highest levels ever. However, it seems unlikely
that these short-term gains in the metal can be sustained with both Australia’s Office
of the Chief Economist (AOCE) and IMF forecasting severe declines over the next two
years, by 12% for the latter and 20% for the former (Figure 7). This is based partly on
an increase in supply from the huge new Simandou mine in Guinea which could
account for 5% of global iron ore exports by 2027 based on conservative estimates.
However, there is also expected to be weakness on the demand side from a sluggish
steel industry, which accounts for almost all of iron ore consumption. This is
especially from China, which accounted for 53% of global steel production in 2025,
with demand low from its still relatively weak property and infrastructure sectors
(Figure 8). Steel production growth in China was still negative in February 2026 at -
3.6%, although this is a substantial rebound from -13.8% in January 2026, which was
at several-year lows. As the country has been rebuilding steel inventories also, this
trend may also start to diminish and underlying real demand will need to recover to
keep supporting demand for the product, and in turn iron ore.
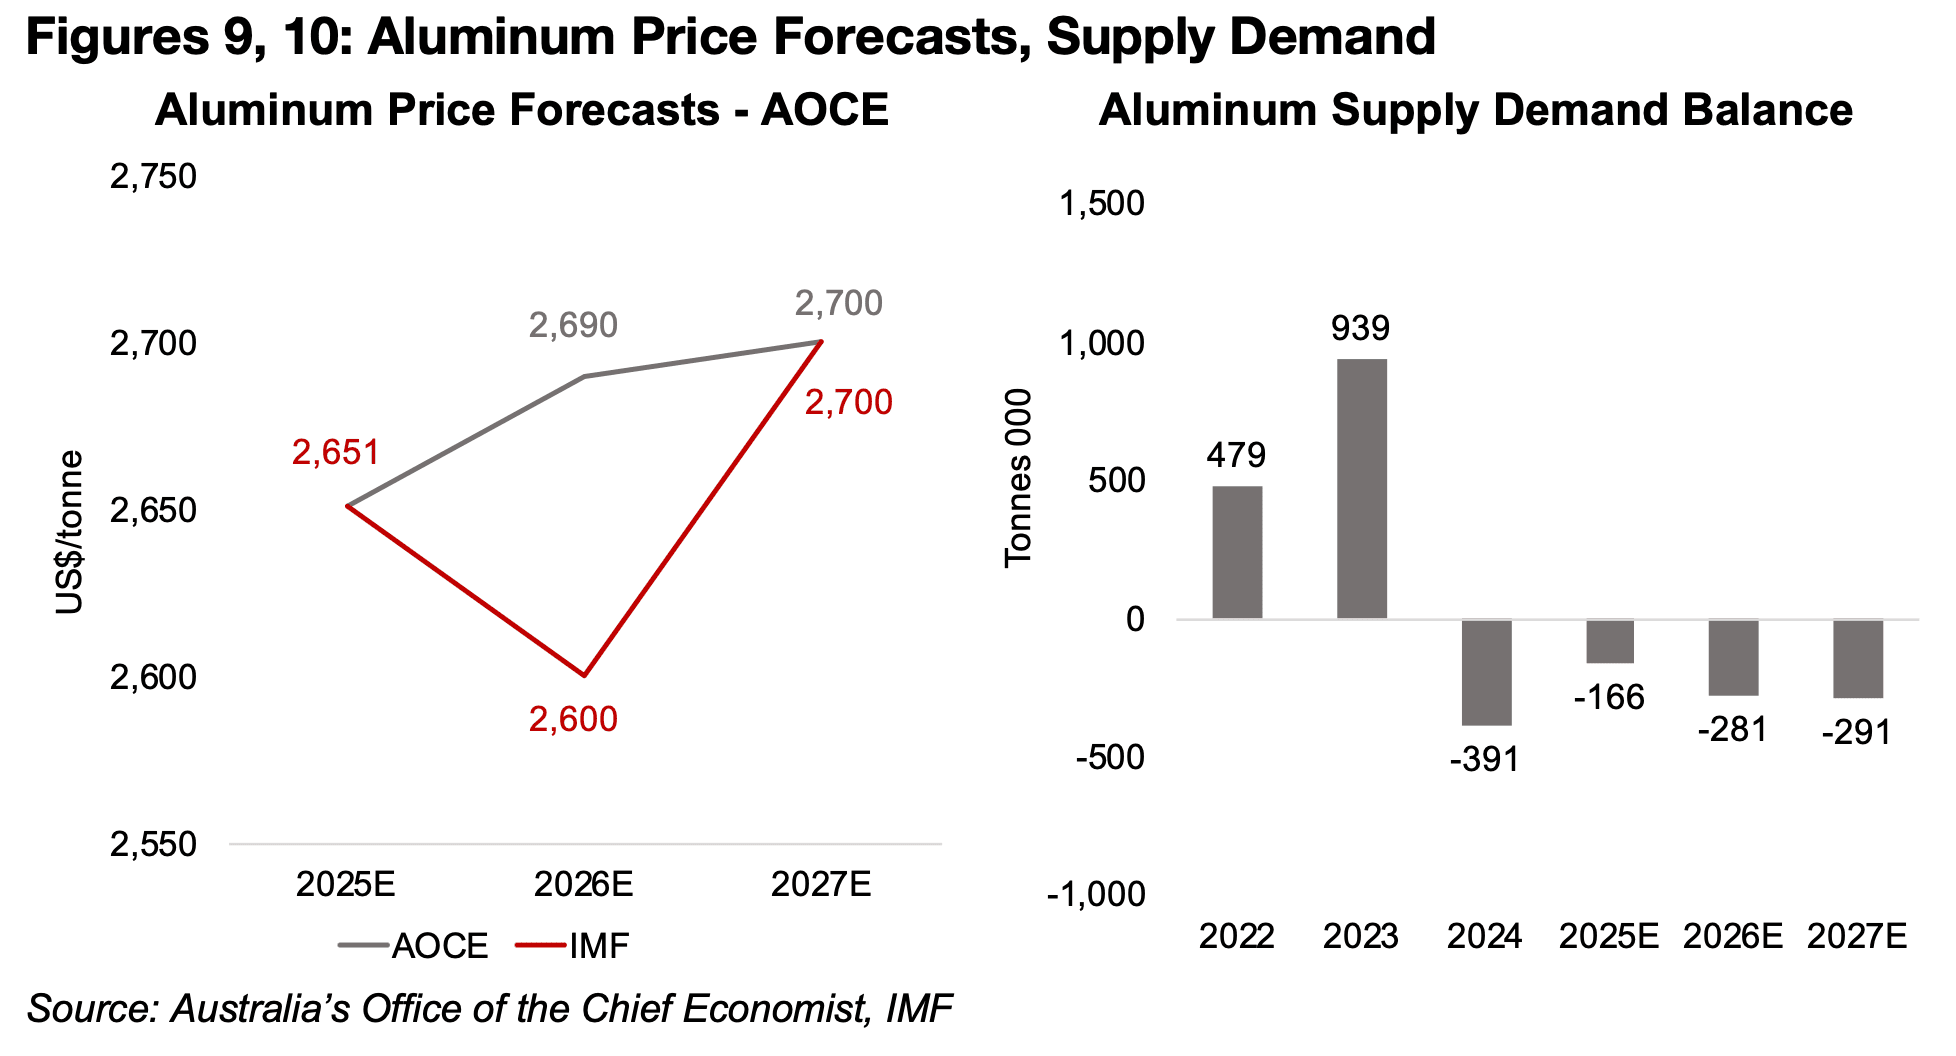
The aluminum price has been driven by the large proportion of smelting capacity for
the metal in the Middle East, at over 5%, including UAE and Bahrain, which have
been directly attacked in the war. The AOCE forecasts an increase in the price this
year, the IMF a decline, with both converging to the same price in 2027E, indicating
gains over the next two years (Figure 9). With the strong gains already this year, the
IMF estimate for a decline in 2026 may be revised up, and the AOCE’s forecast deficit
from 2026E to 2027E, which were released in December 2025, could widen when
these forecasts are updated to account for the effects of the war (Figure 10).
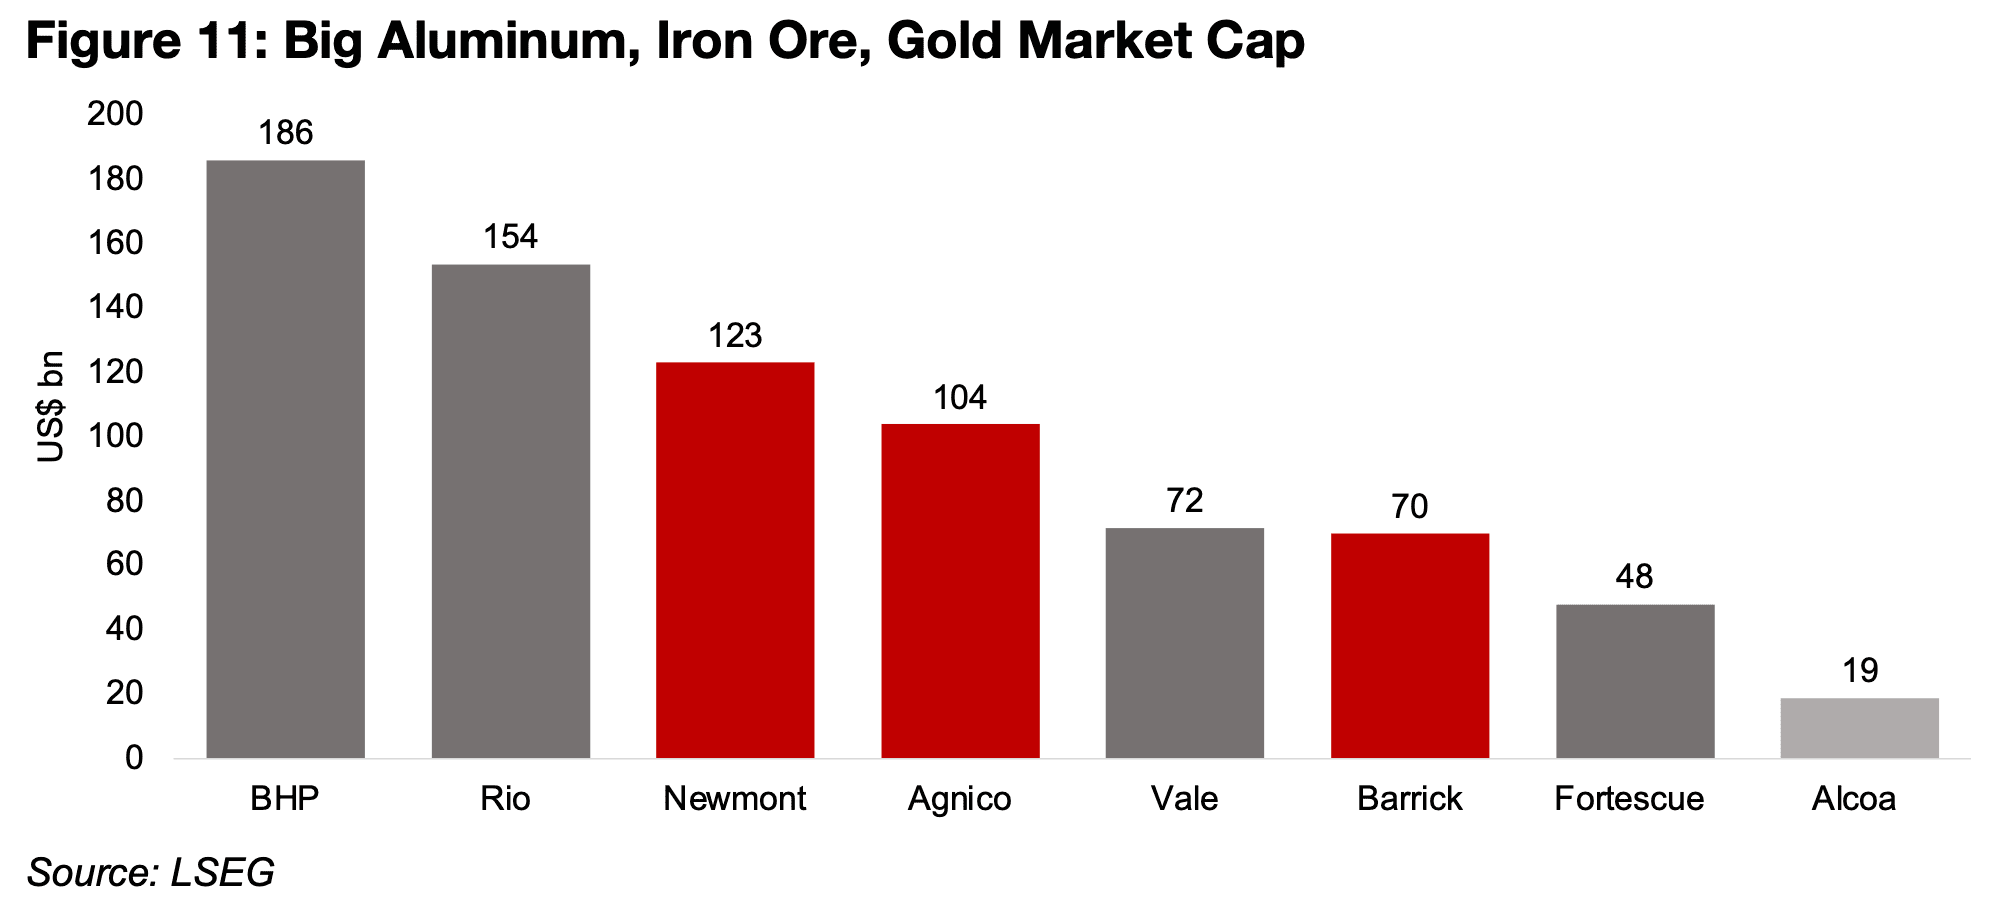
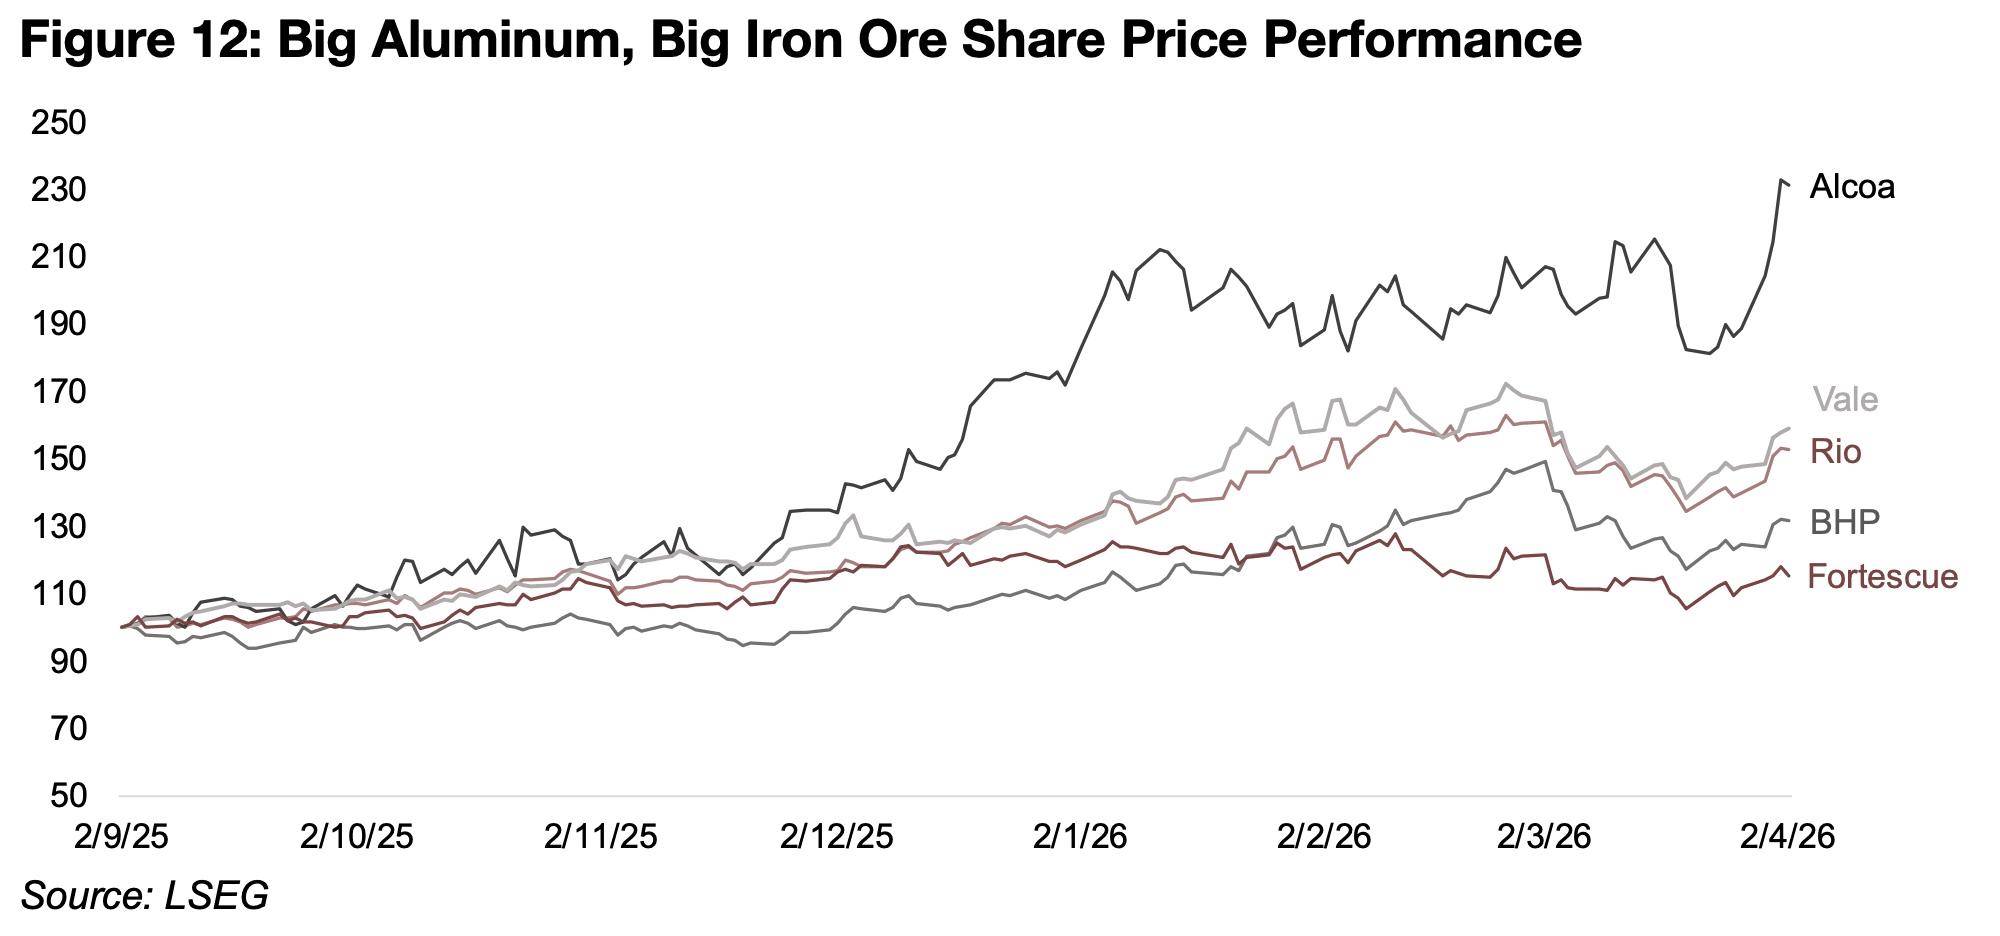
There is only one large cap pure play on aluminum, Alcoa, and it has a much smaller market cap than the big iron ore, copper and gold miners, at only US$19bn, with the rest of the group ranging from US$48bn to US$186bn (Figure 11). Rio Tinto has a large aluminum division, but it also produces aluminum and bauxite, and there is not necessarily a strong correlation in the movements of these metals, especially shortterm, and most of its revenue and operating profit is from iron ore and copper. Alcoa has far outperformed the other major base metals plays since September 2025, and a continued conflict in the Middle East which limits supply of the metal, which is as critical as copper for the global market, could continue to be a driver (Figure 12).
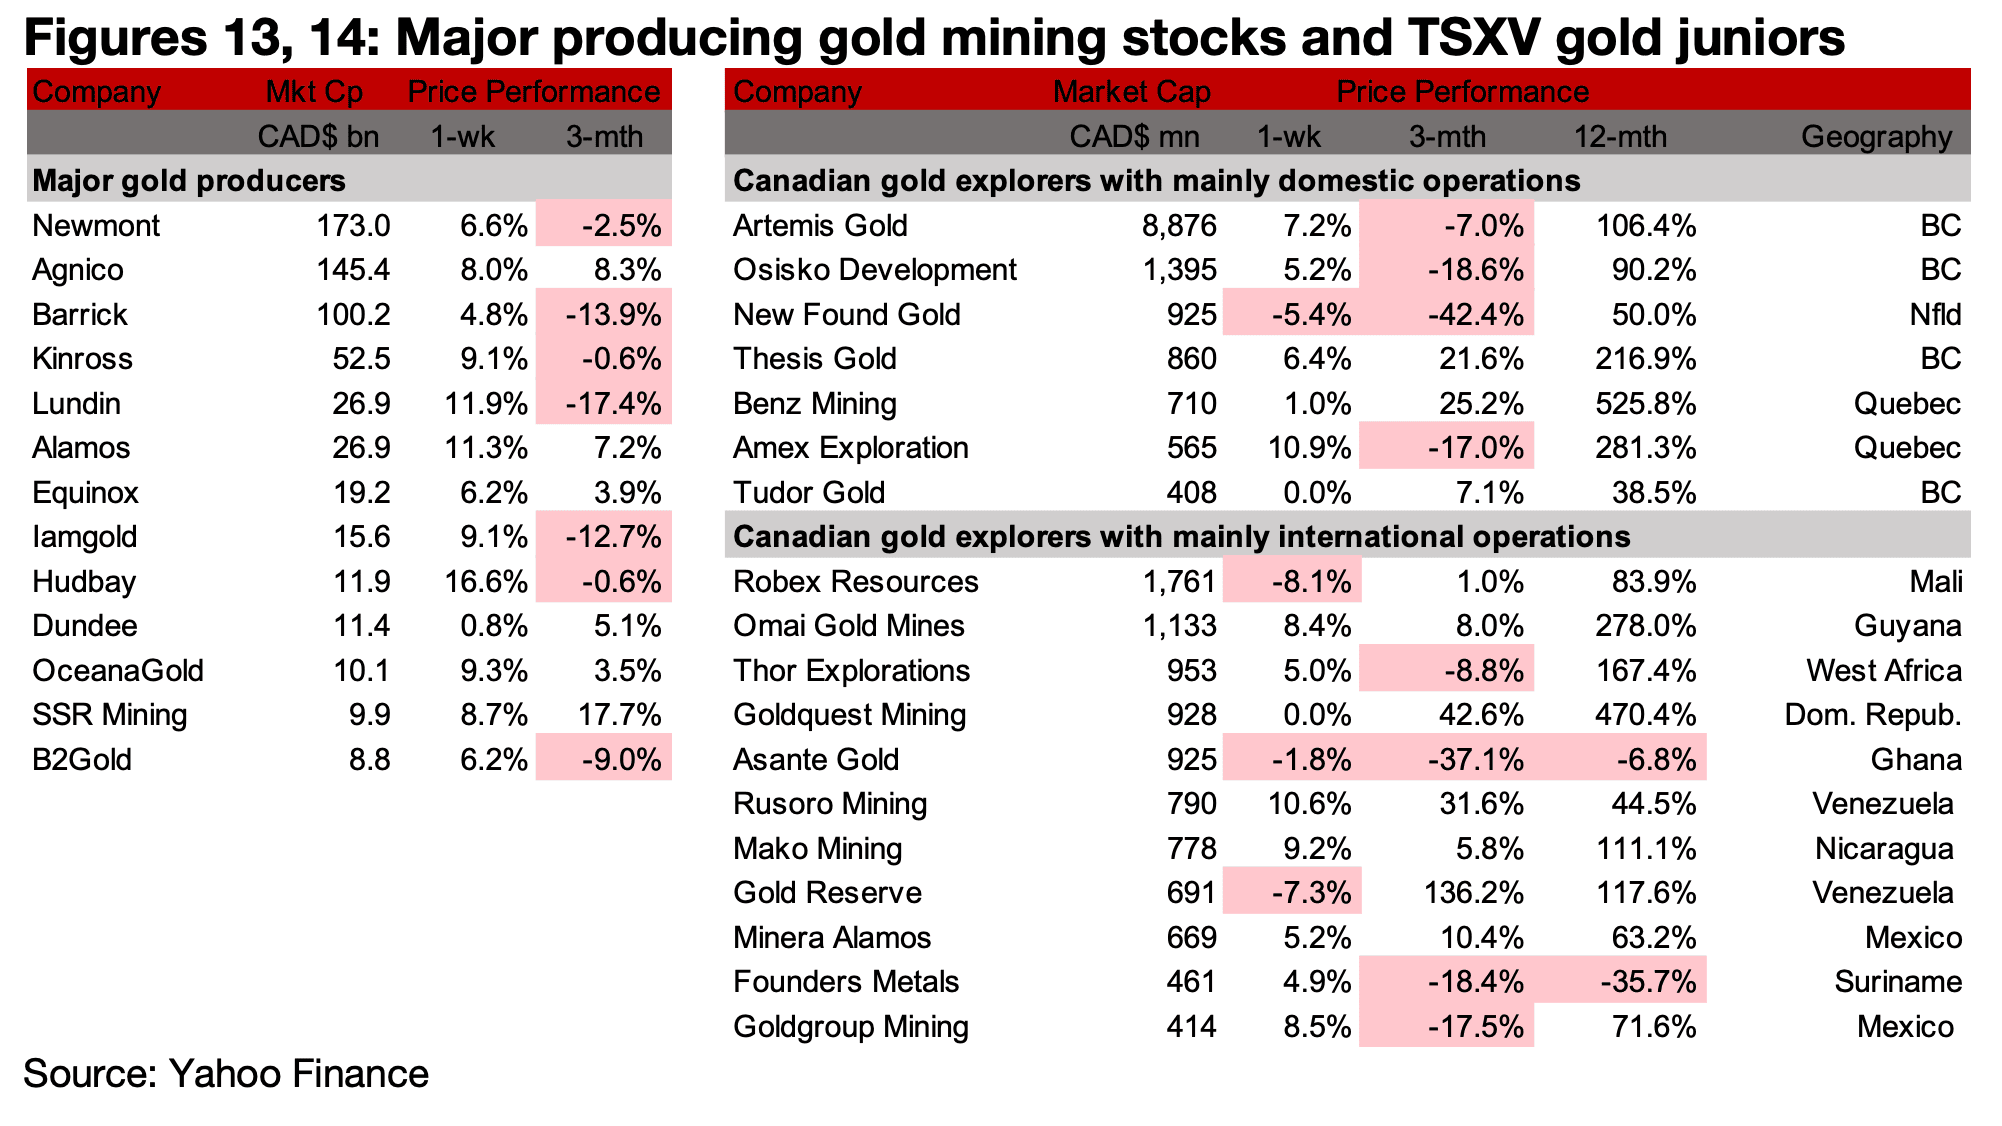
The major producers and most of TSXV gold rebounded on the rise in the gold price
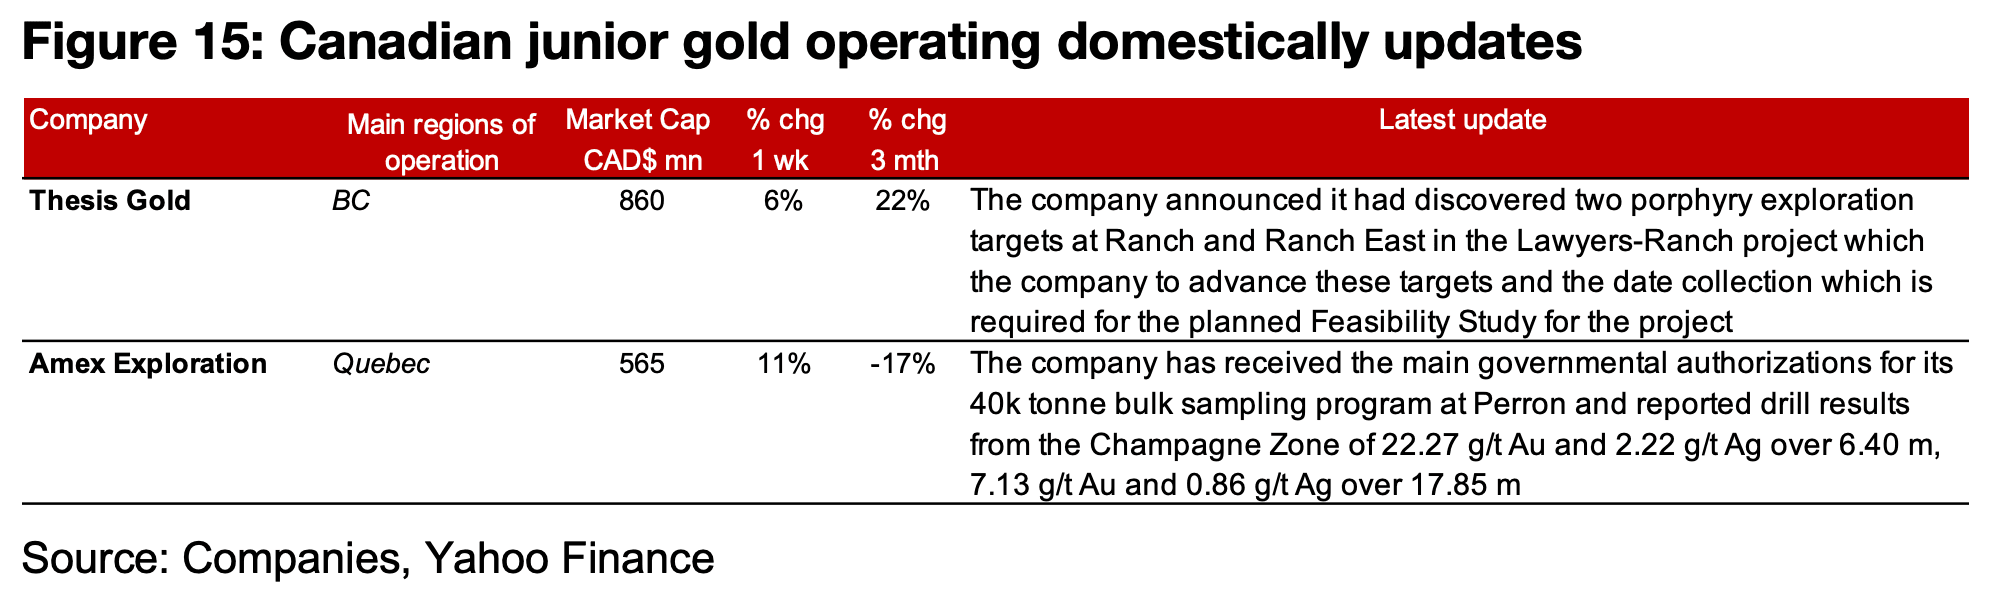
(Figures 13, 14). For the TSXV gold companies operating mainly domestically, Thesis
discovered two porphyry exploration targets at Ranch and Ranch East of LawyersRanch and Amex reported that it has received the main governmental authorizations
for the bulk sampling at Perron and drill results from the Champagne Zone of the
project (Figure 15).
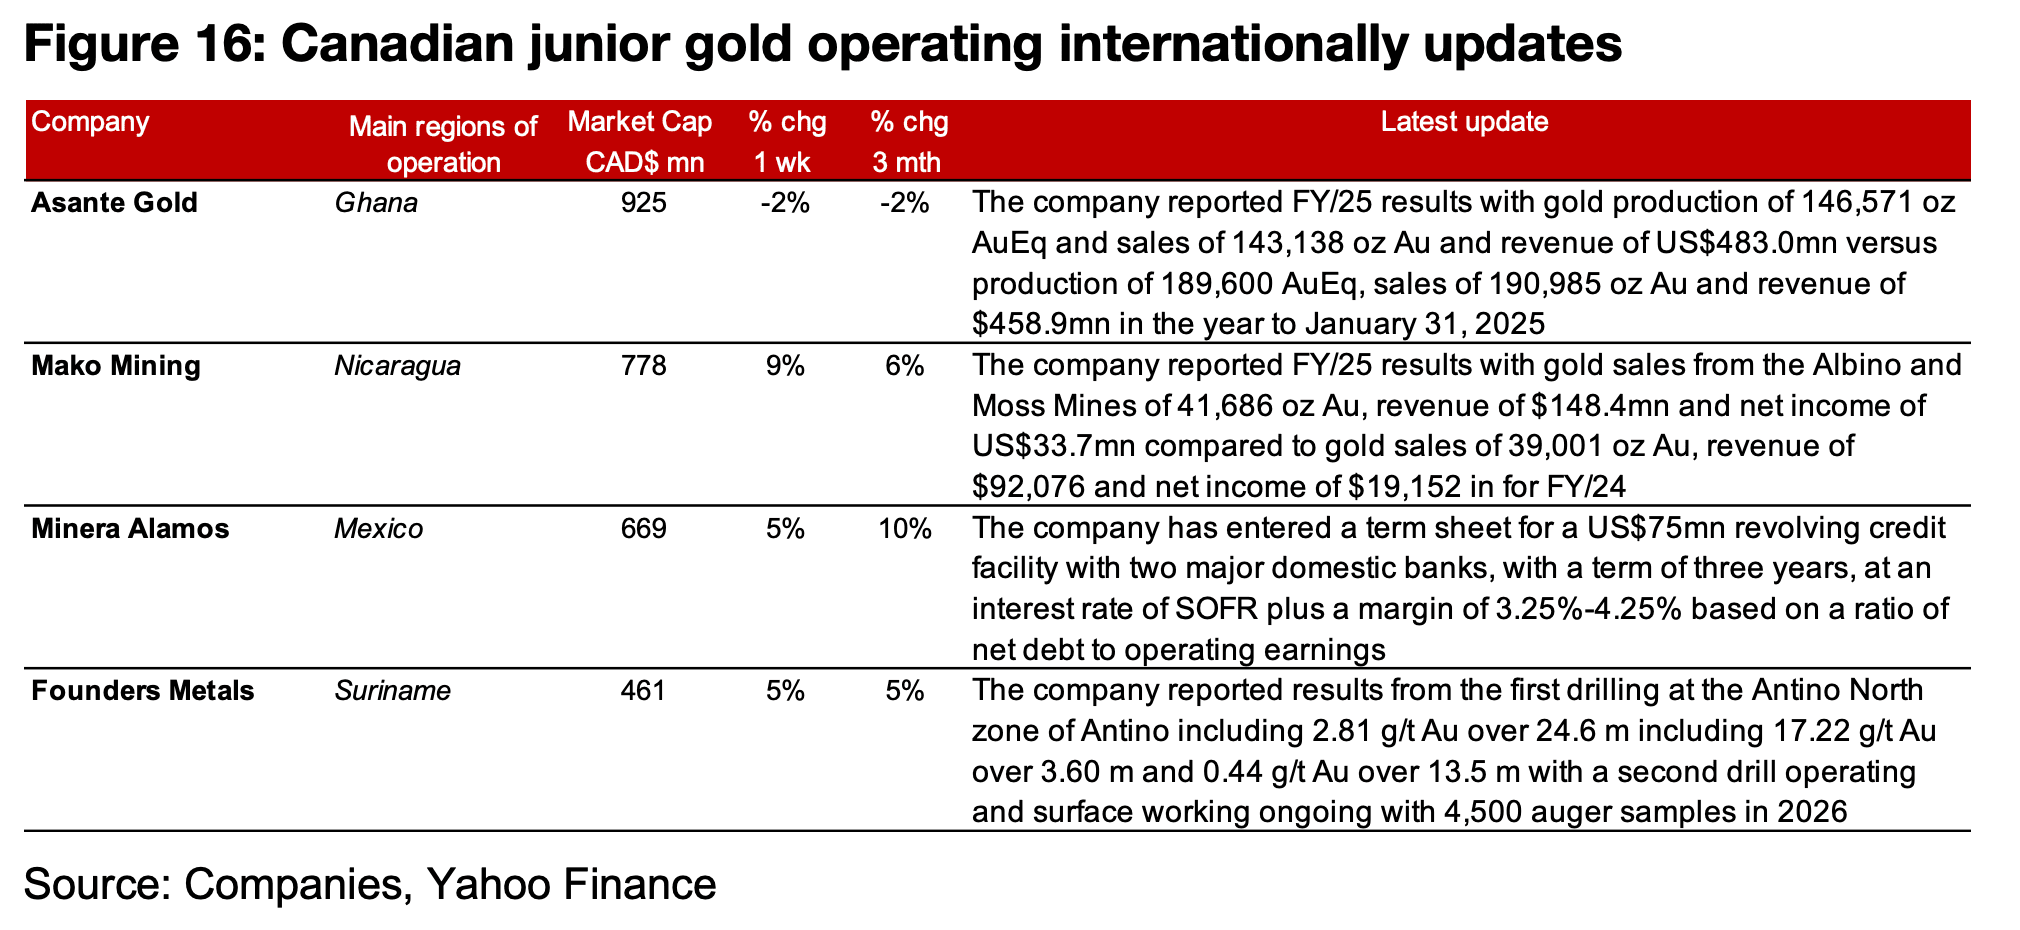
For the TSXV gold companies operating mainly internationally, Asante Gold reported
FY/25 results with a significant decline in gold production year on year although
revenue still rose on the higher gold price. Mako Mining released FY/25 results with
combined production from the Albino and Moss Mines up moderately but revenue
and net income jumping especially on an increase in the realized gold price. Minera
Alamos entered a term sheet for a US$75mn revolving credit facility with two major
banks and Founders reported the first drill results from the Antino North zone of
Antino (Figure 16).
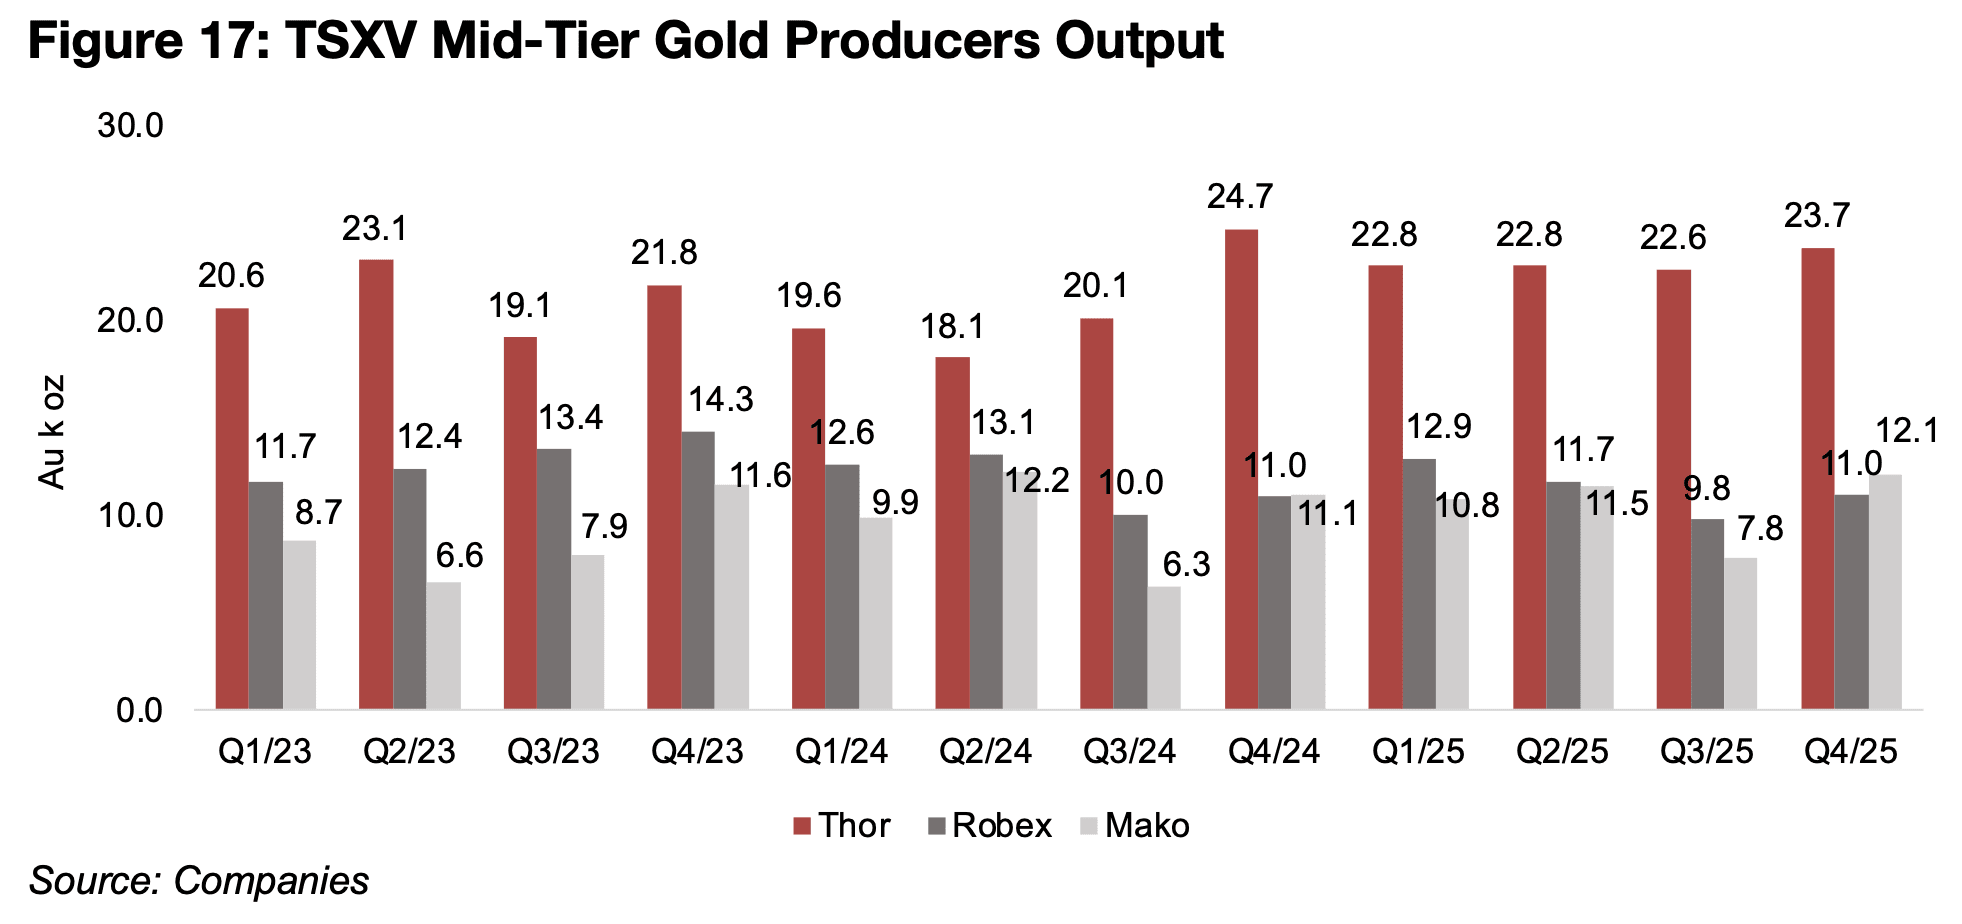
The TSXV mid-tier gold producers continued to have strong output in Q4/25, with
Thor Explorations leading with 23.7k oz Au in production from its Segilola mine in
Nigeria, up from 22.6k oz in Q3/25, Robex with 11.0k oz Au in production from
Nampala in Mali, up from 9.8k oz and Mako at 12.1k oz Au, from both the Albino and
Moss Mines, up from 12.1k. oz Au (Figure 17).
Robex’s results will not be comparable to previous quarters starting from Q1/26 as it
is expected to complete its merger with Predictive Discovery. Both Thor and Robex
have substantial new projects at advanced stages, with Douta in Senegal with
production expected by 2028 for the former and the latter already entering
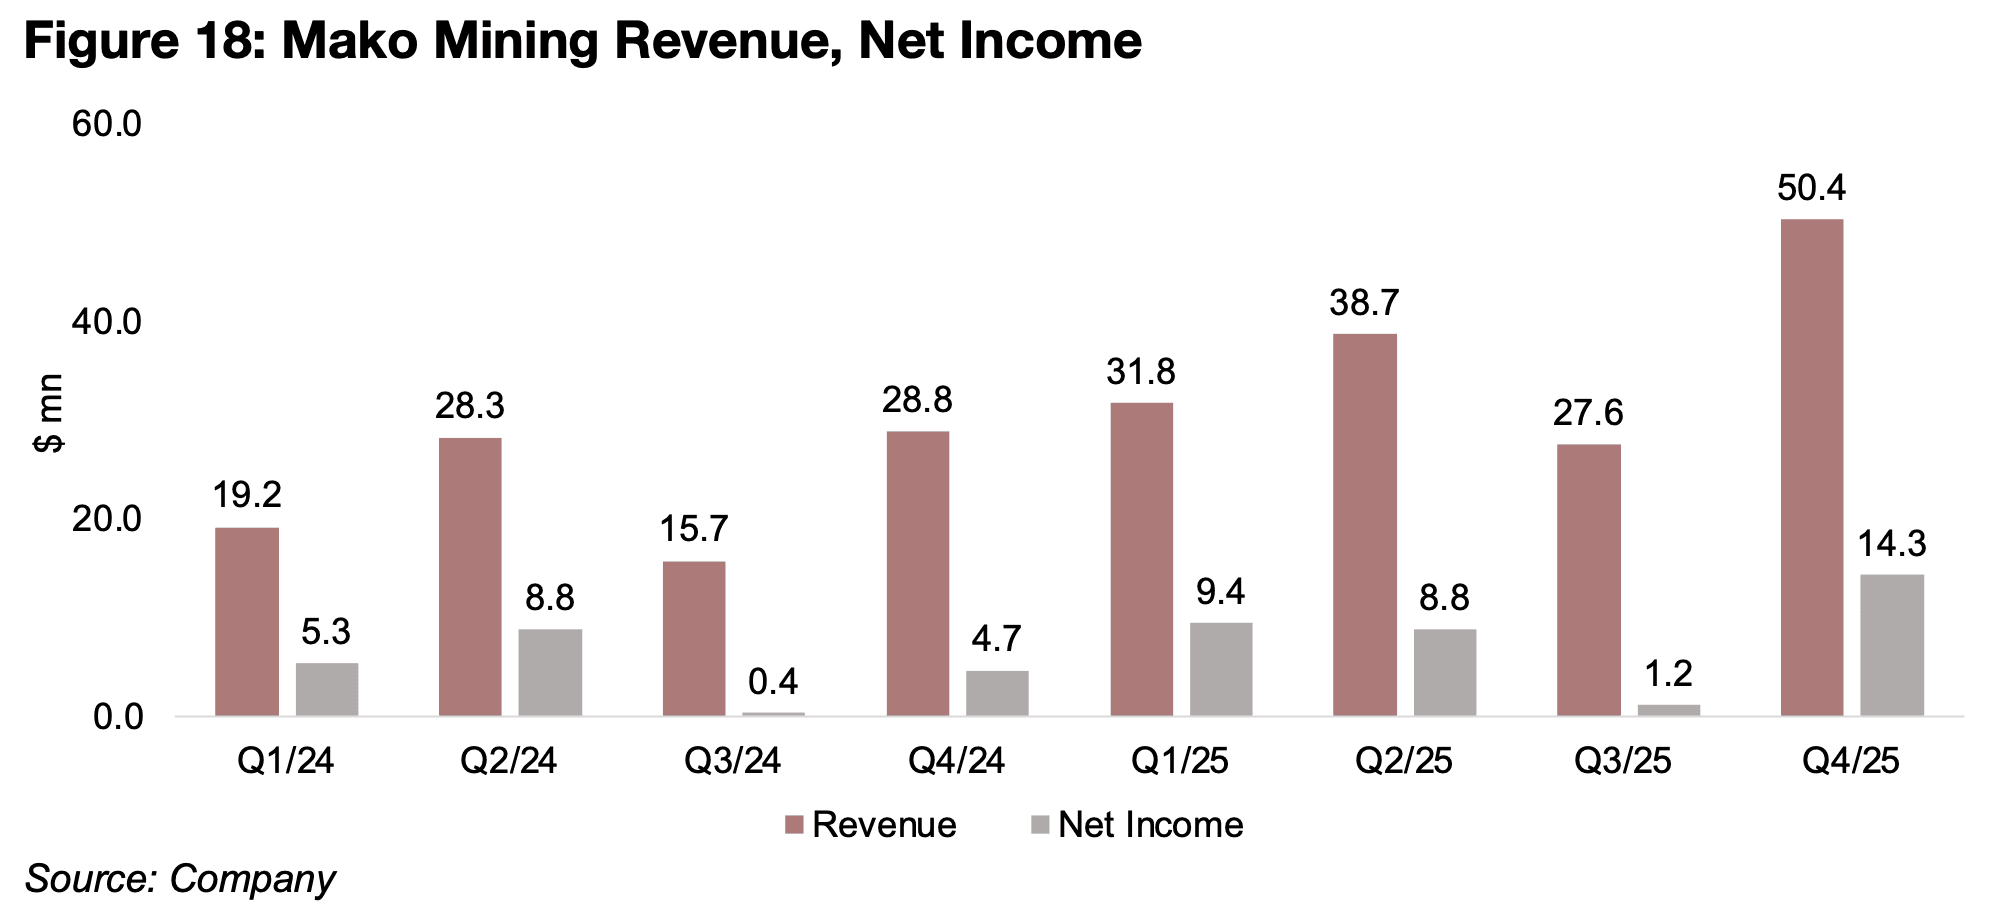
commercial production at Kiniero in Guinea in Q1/26. Mako’s production had been
below Robex from 2023 to Q3/24, but output was nearly the same by Q4/24, and
now the former has moved substantially ahead of the latter for the first time in Q4/25.
The company’s revenue and net income have trended up substantially on the rising
gold price to highs in Q4/25 (Figure 18).
Disclaimer: This report is for informational use only and should not be used an alternative to the financial and legal advice of a qualified professional in business planning and investment. We do not represent that forecasts in this report will lead to a specific outcome or result, and are not liable in the event of any business action taken in whole or in part as a result of the contents of this report.
Author
Ben McGregor authors the Weekly Roundup at CanadianMiningReport.com, providing sharp analysis of the metals and mining sector. With a talent for spotting trends, Ben distills complex market shifts into clear, engaging insights on TSXV junior miners. His weekly updates cover gold, copper, uranium, and more, blending data-driven perspectives with a knack for identifying opportunities. A vital resource for investors, Ben’s work navigates the dynamic junior mining landscape with precision.