
October 30, 2023
Gold rose 1.2% to US$2,016/oz, breaking through the key US$2,000/oz level for the first time since May 2023 on surging international political tensions, with the Geopolitical Risk Index reaching its highest level since the Russian invasion in 2022.
This week we look at two data series showing high demand for physical gold, with Comex deliveries of the metal and silver still elevated, while central banks continue a trend of net gold additions persisting since the 2008 global financial crisis.
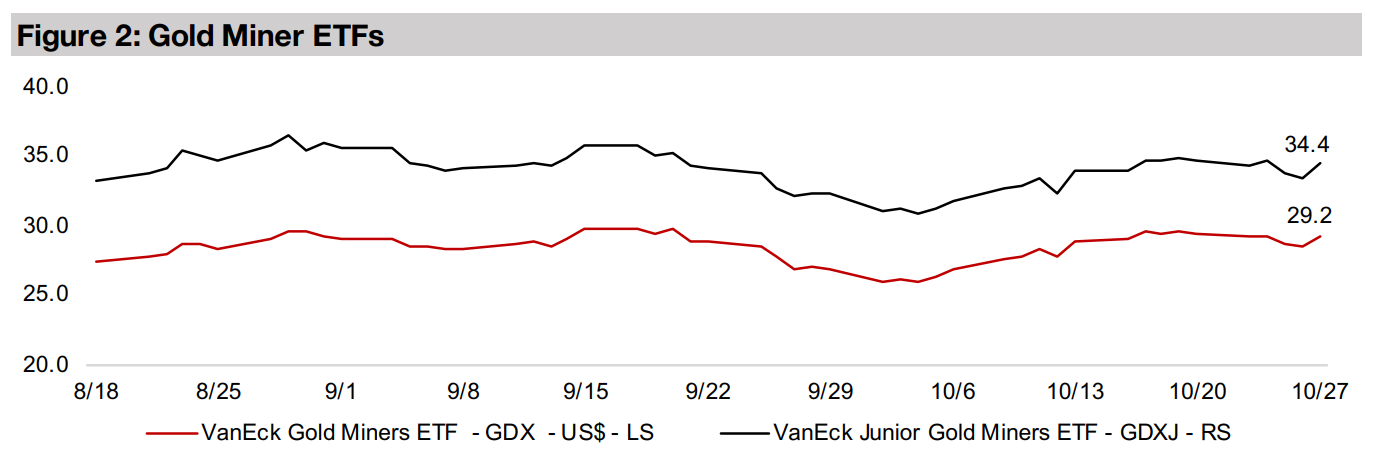
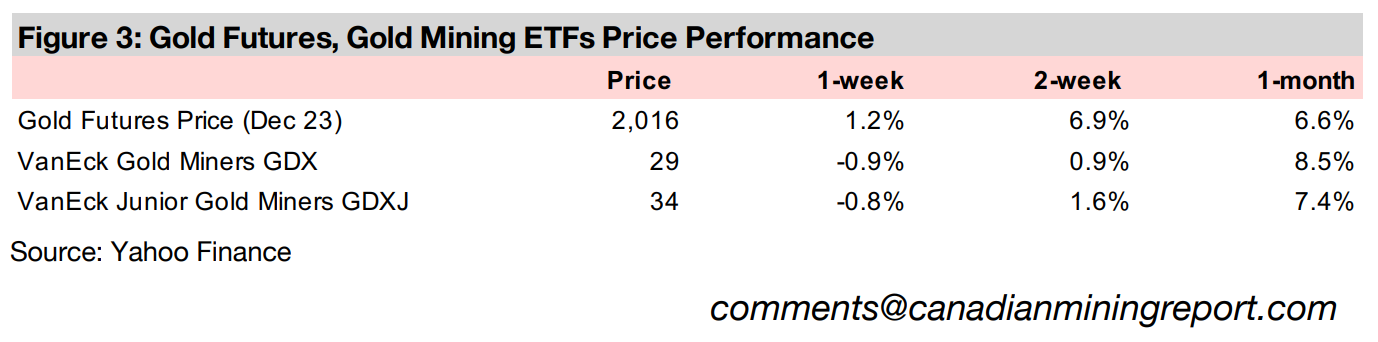
Gold stocks declined with the GDX down -0.9% and GDXJ dropping -0.8%, as falling equities offset the gain in the metal, with the S&P 500 and Russell 2000 losing -2.2% and -2.3%, respectively, while the large TSXV gold stocks were mixed.


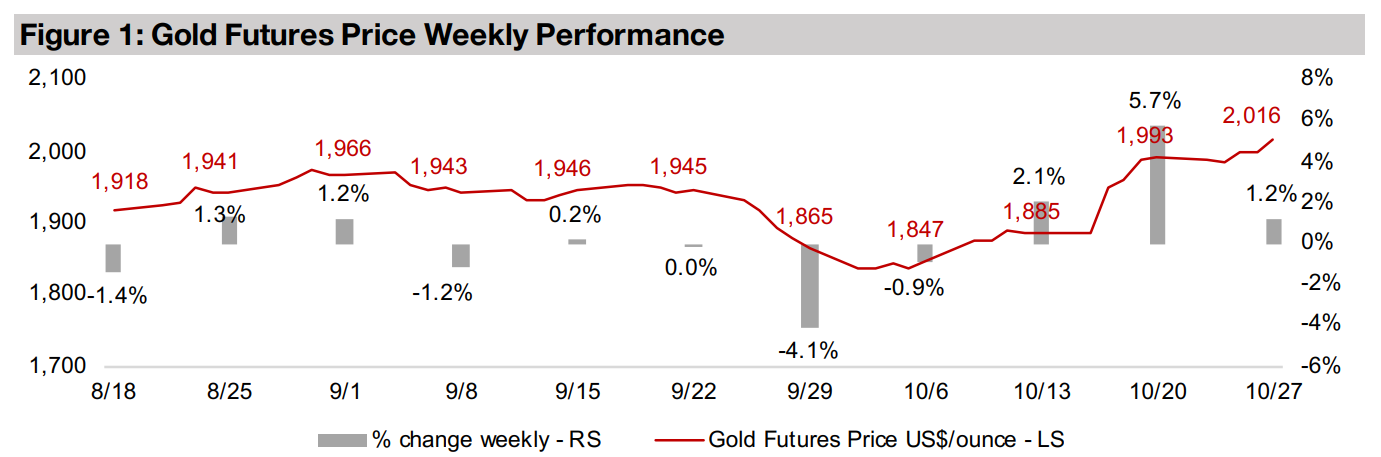
The gold futures price rose 1.2% to US$2,016/oz, breaking through the key
US$2,000/oz level for the first time May 2023, and has gained over US$150/oz in a
month. This has mainly been driven by the spike in geopolitical risk over the conflict
centered around the Middle East with concerns that it could escalate into a broader
regional, or even global, conflict. This repeats a pattern we have seen with gold over
the past four years, with major moves above US$2,000/oz tending to have been
driven by major crises, including the global health crisis in early 2020, the Russian
invasion in early 2022 and the banking crisis in early 2023.
However, gold has consistently reverted to its average over the past four years of just
over US$1,800/oz after these crises were offset by other factors. In 2021 this took
the form of a major economic rebound, reducing demand for safe haven assets. Since
2022, it has been underlying fundamentals that tend to pressure gold to the downside,
including rising real bond yields, a surge in the US$ and a decline in the US money
supply. It remains unclear whether the current crisis will be enough to see the gold
price finally hold the US$2,000/oz for an extended period, with the longest so far
above this level in recent years at six days in August 2020 and ten days in May 2023.
To the upside for gold, the potential for geopolitical risk to spill over into a wider
regional and even global contagion seems at its highest in a couple of decades. Even
the rise in tensions between major powers following the Russia-Ukraine conflict
seemed subdued and regionally constrained compared to this second conflict in the
Middle East. It already appears to have much wider global ramifications, with rising
tensions between several major powers, exacerbating international relations that
were already on edge. We therefore see the probability weighted towards continued
elevated geopolitical risk, which could support the gold price.
Offsetting this, however, could be the fundamental economic drivers that continue to
move against gold, with inflation still excessive and the US Fed clear that to combat
this it will maintain high rates, and could even hike them further. This could drive up
US real yields and the US$ and contract the money supply further and potentially
drive down gold. These factors could be tempered by a recession that drove up
unemployment, reduced inflation and prompted a return to easier monetary policy by
central banks in response, thus driving up gold on a flight to safety and lower real
yields. However, even with concerns over a potential recession high, there is still little
evidence one is developing, with global unemployment extremely low. This would
suggest any easing of monetary policy is a long way off, and that gold could continue
to pressured by these fundamental factors well into near year.
Overall, we expect that rising geopolitical risk might be enough to gradually drive up
the gold price, but with the fundamental economic factors continuing to attenuate the
rise and preventing a huge breakout to the upside. The biggest risk to this view is that
international relations improve and the global economy remain stable, which could
drive yet another of the reversions towards an US$1,800/oz average that have
repeated since 2019. The longer-term bull case for gold is one where geopolitical risk
continues to spike, a global recession ensues, and there is a resumption of monetary
expansion, which combined could see a dramatic surge in the metal.
While so far we have assumed that an economic downturn would lower inflation and
allow for a return to monetary expansion, there is a third scenario, where a recession
develops, but inflation still persists, referred to as stagflation. In this case it would be
difficult for the Fed to respond with further monetary expansion, as it could drive even
worse inflation. Stagflation has tended to be good for the gold price, with the most
recent bout occurring in the mid-1970s to early 1980s, accompanied by reasonably
low, but rising, geopolitical risk over the period.
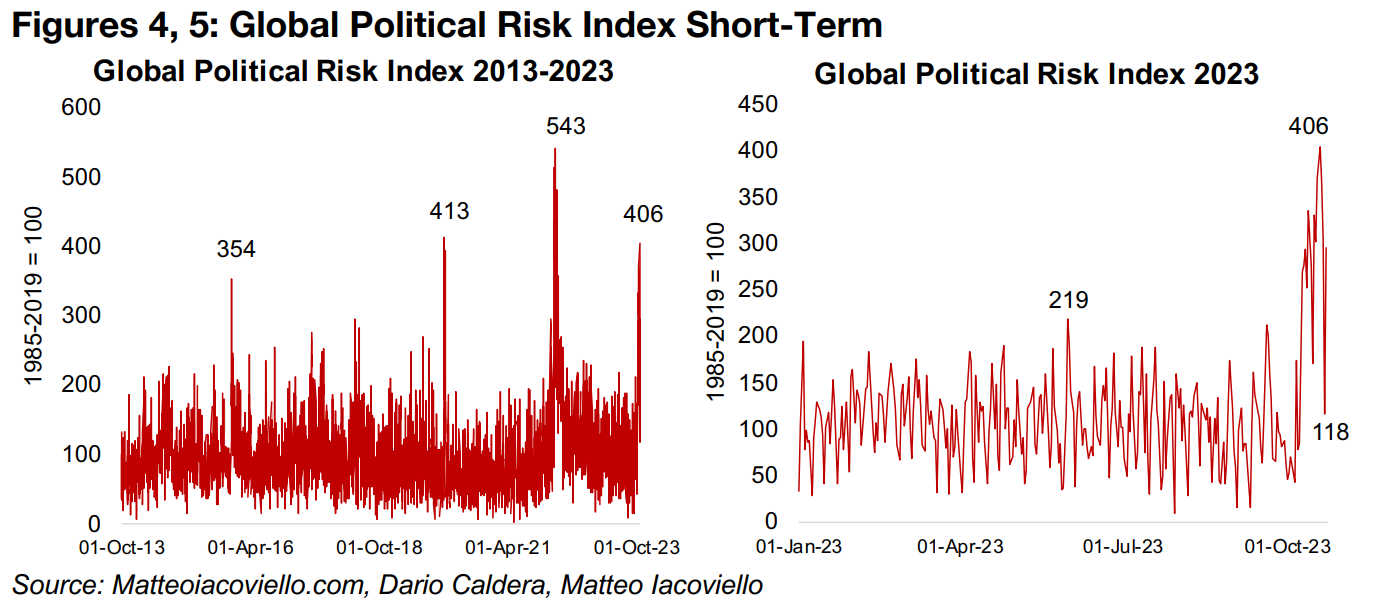
While international political risk is nebulous, the Geopolitical Risk Index (GPRI) provides a quantification, based on the number newspaper articles covering geopolitical tensions. The researchers find that a higher GPRI tends to be correlated with a ‘higher probability of economic disasters and larger downside risks to the global economy’. The recent conflict saw the daily version of the index reach its third highest level of the past decade, peaking at 406, below only the 543 reached after the Russian invasion in 2022 and 413 in 2020 during the global health crisis (Figure 4). Looking at just the past year, while the index has declined significantly off this peak to 118, it is still toward the high end of the typical 50 to 150 range (Figure 5).
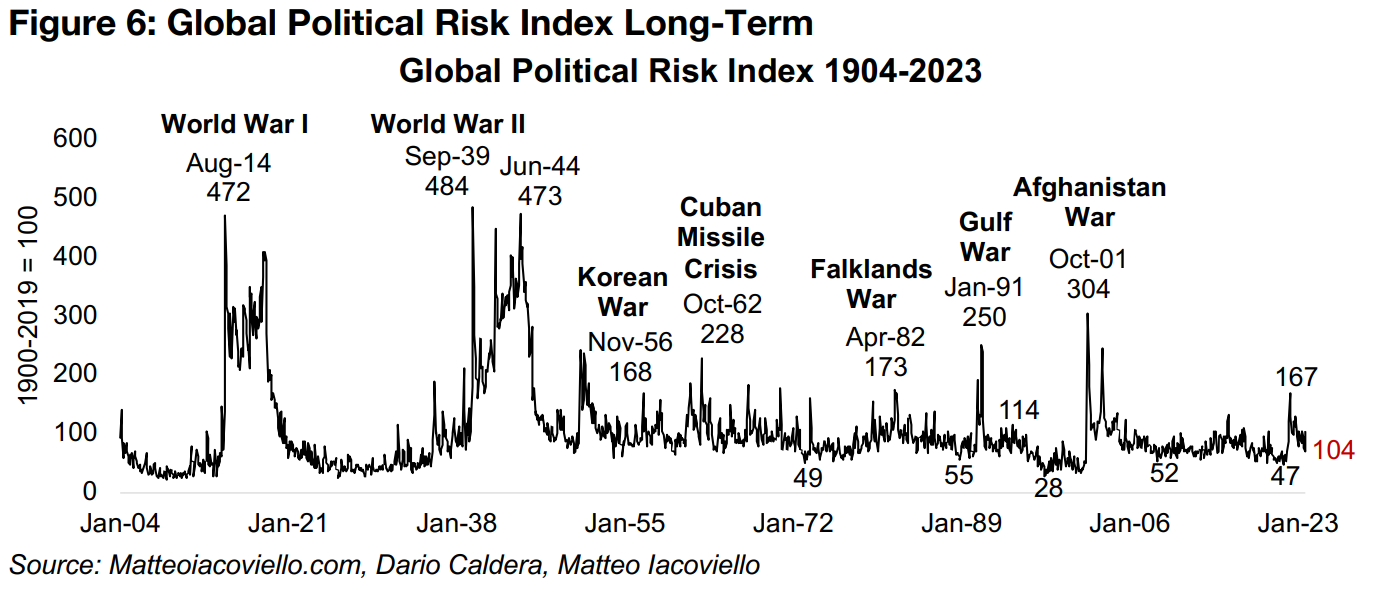
The Geopolitical Risk Index is also calculated longer-term on a monthly basis back
to the 1900s. However, this is reported only to September 2023, so it does not include
the spike in October 2023 (Figure 6). However, with the daily series showing October
2023 and January 2020 at similar levels, we have assumed this also holds for the
longer-term series and estimate the October 2023 figure at around 104. This puts the
index towards the top of a range mainly holding between 50 to 125 since the 1950s,
with only brief jumps significantly above this level. This suggests that the recent crisis
so far has actually not been that severe in historical terms.
The highest and most extended spikes in the geopolitical index were during the two
World Wars, with a World War I peak of 472 in August 2014 and the index remaining
over 200 for four years from 1914-1918. The World War II peak was 484 in September
1939, and the index remained above 250 for four years from 1942 to 1945. The data
also shows that the period from 2006 to 2019 was particularly uneventful from a
geopolitical conflict standpoint, with only two spikes above 100. If we assume that
the fifteen years of geopolitical tranquility prior to the global health crisis was a
historical anomaly, it would suggest a rising probability of more spikes to come for
geopolitical risk, which will likely be an upside driver for gold.
The rising risk over the past four years has seen the markets increasingly interested
in holding physical gold relative to ‘paper gold’ either in the form of futures contracts,
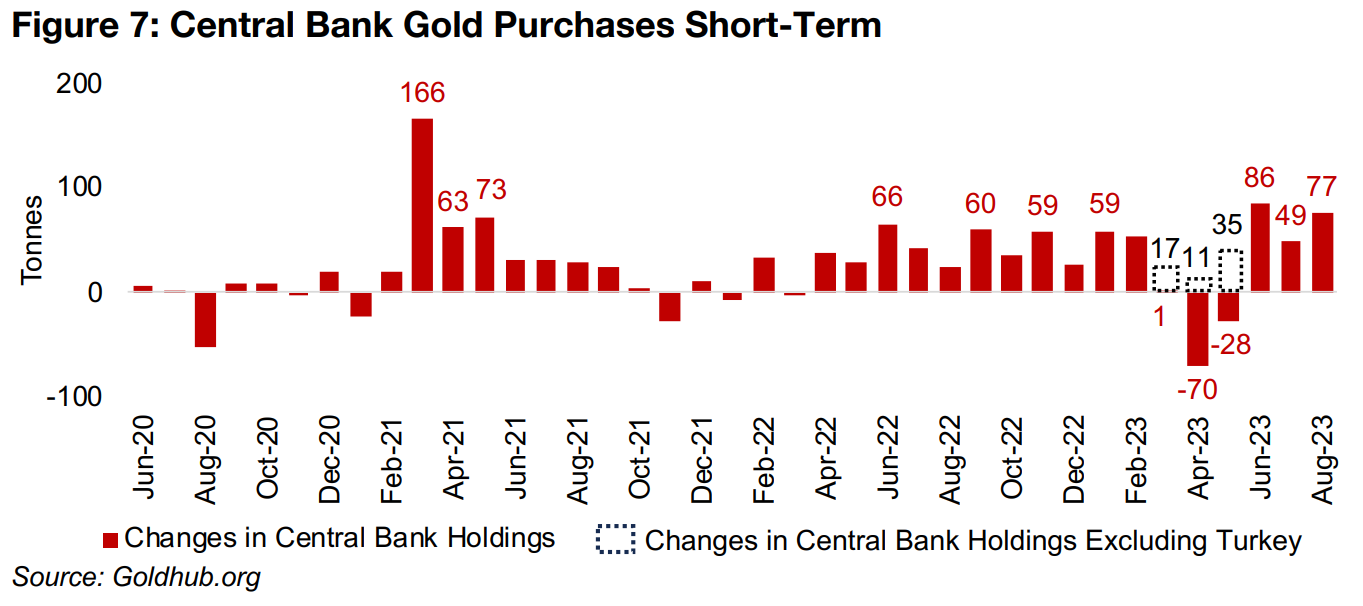
ETFs, or other investment vehicles. Central banks continue to build up gold reserves,
adding 86 tonnes of gold to their holdings in June 2023 and 77 tonnes in August 2023,
the highest monthly additions since early 2021 (Figure 7). The trend of significant
additions since April 2022 was only broken from January 2023 to March 2023, mainly
because of sales by the central bank of Turkey.
However, this was not because Turkey had become bearish on gold, but rather
because of large gold sales directly into the domestic market to assist in stabilizing
its financial system. Excluding Turkey, central banks still made net gold purchases
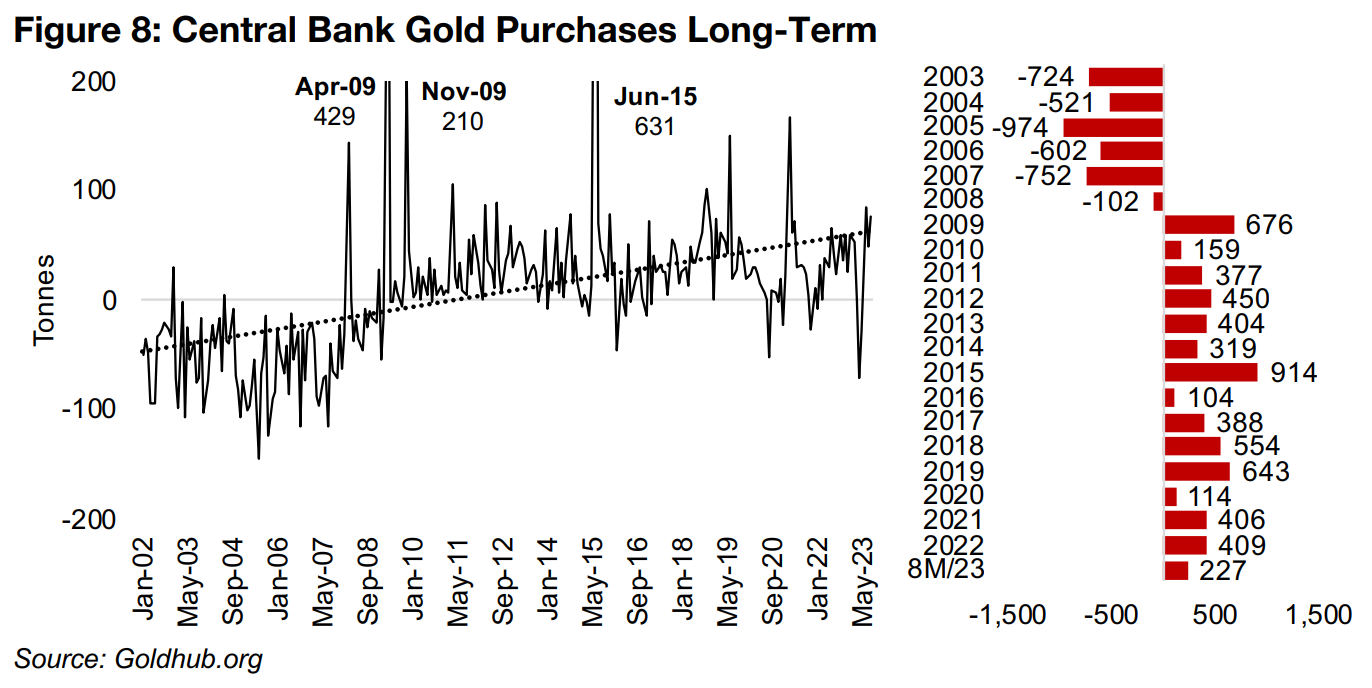
over this period. This trend towards central banks increasing gold holdings goes back
to the 2008 financial crisis, with a shift from average net selling of 714 tonnes per year
from 2003 to 2007 to net buying of 423 tonnes from 2009 to 2022, with purchases
trending up over the past decade (Figure 8). Central banks bought 227 tonnes over
8M/2023, and assuming this trend continues, well over 300 tonnes could be added
by the year-end. Given the spike in geopolitical risk, as well as rising economic risk,
we expect that major gold buying by central banks is likely to continue.
Another sign of rising risk aversion in markets is the rise in Comex physical gold and silver deliveries. Comex trades futures contracts, which when nearing expiration are generally rolled over into new contracts, and no physical delivery of the commodity takes place. However, in limited cases the owners of the futures contracts do take physical delivery, and for gold and silver this started to rise as early as 2018 and spiked during the global health crisis. This occurred as more investors became wary of counterparties’ ability to deliver on the paper contracts and they started to prefer holding the physical commodities instead.
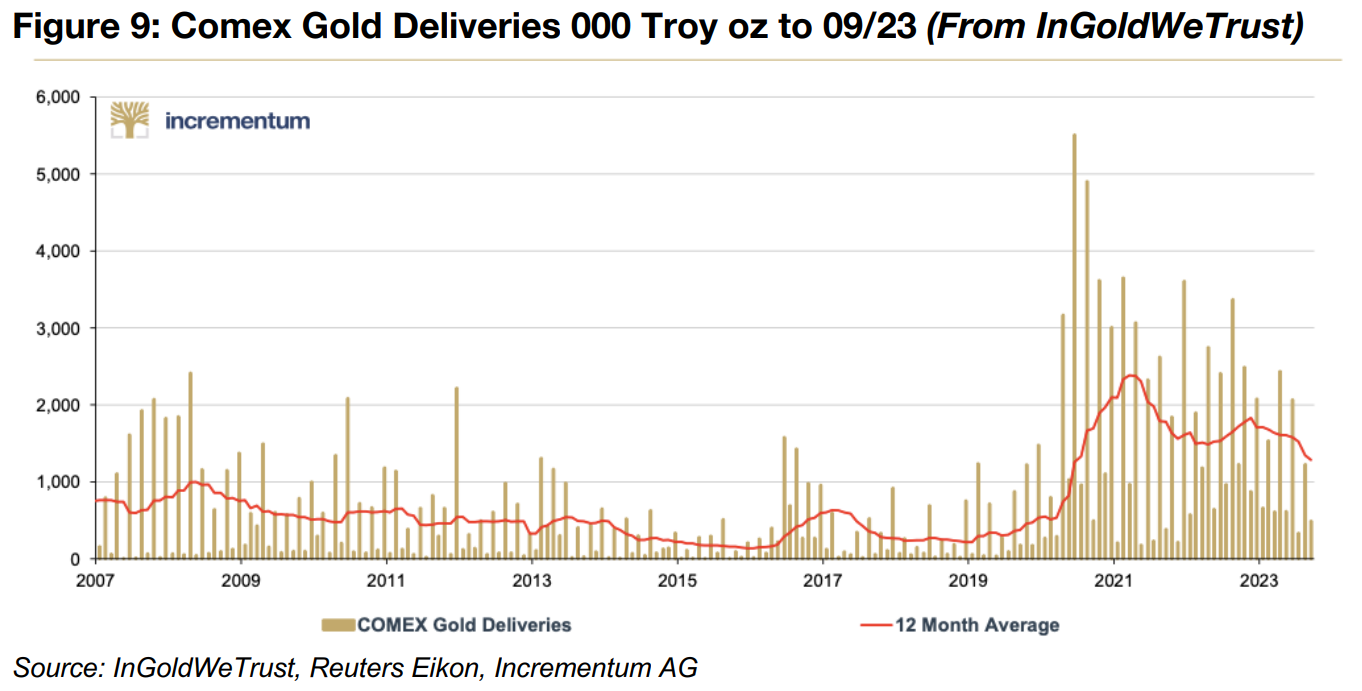
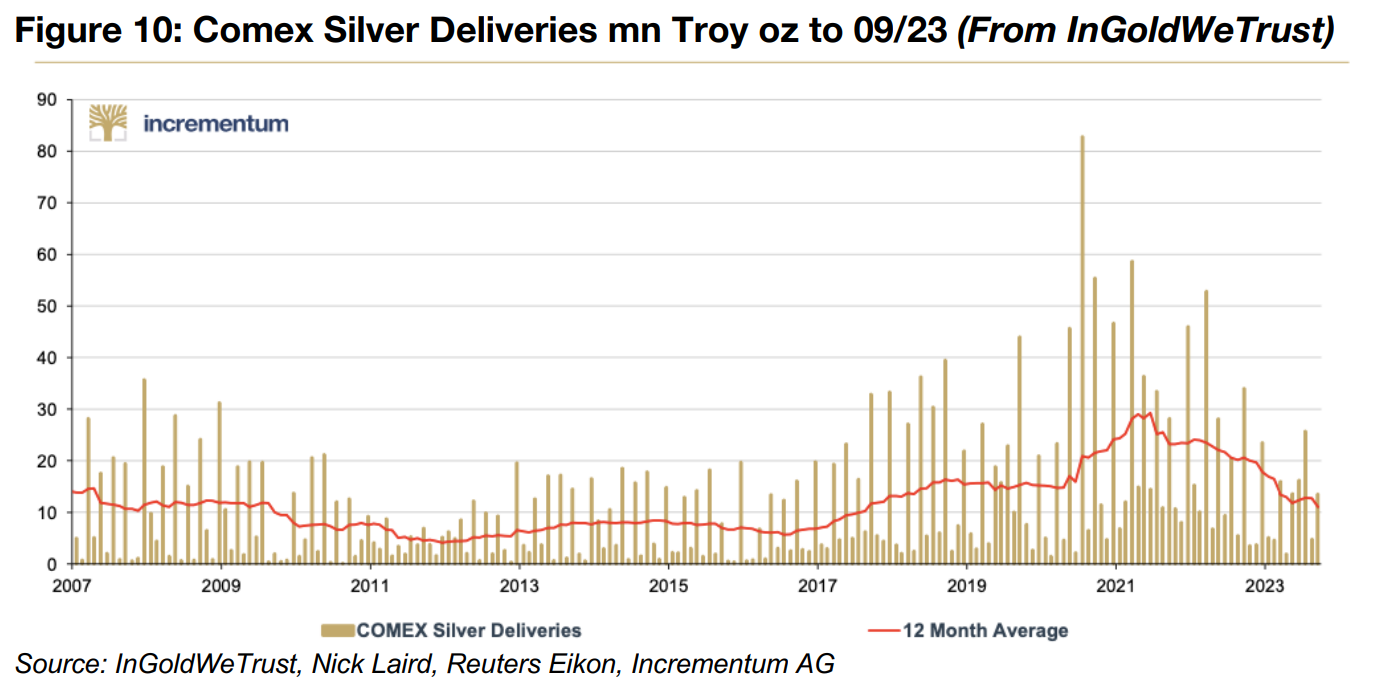
InGoldWeTrust show that monthly Comex deliveries peaked for gold at over 5.5mn troy oz, and for silver at 80mn troy oz, in late 2020, with the 12-month averages for both hitting highs in early 2021 (Figures 9, 10). While the 12-month average monthly delivery has declined for both since, it remains still over 1.0mn oz per month for gold, and over 10mn oz for silver. This is will well above the 0.5 mn oz average for gold from 2011 to 2019 and an average around 6.0-7.0 mn oz for silver from 2011-2017. We expect that this demand for physical delivery for both gold and silver could remain elevated in light of continued high geopolitical and economic risks.
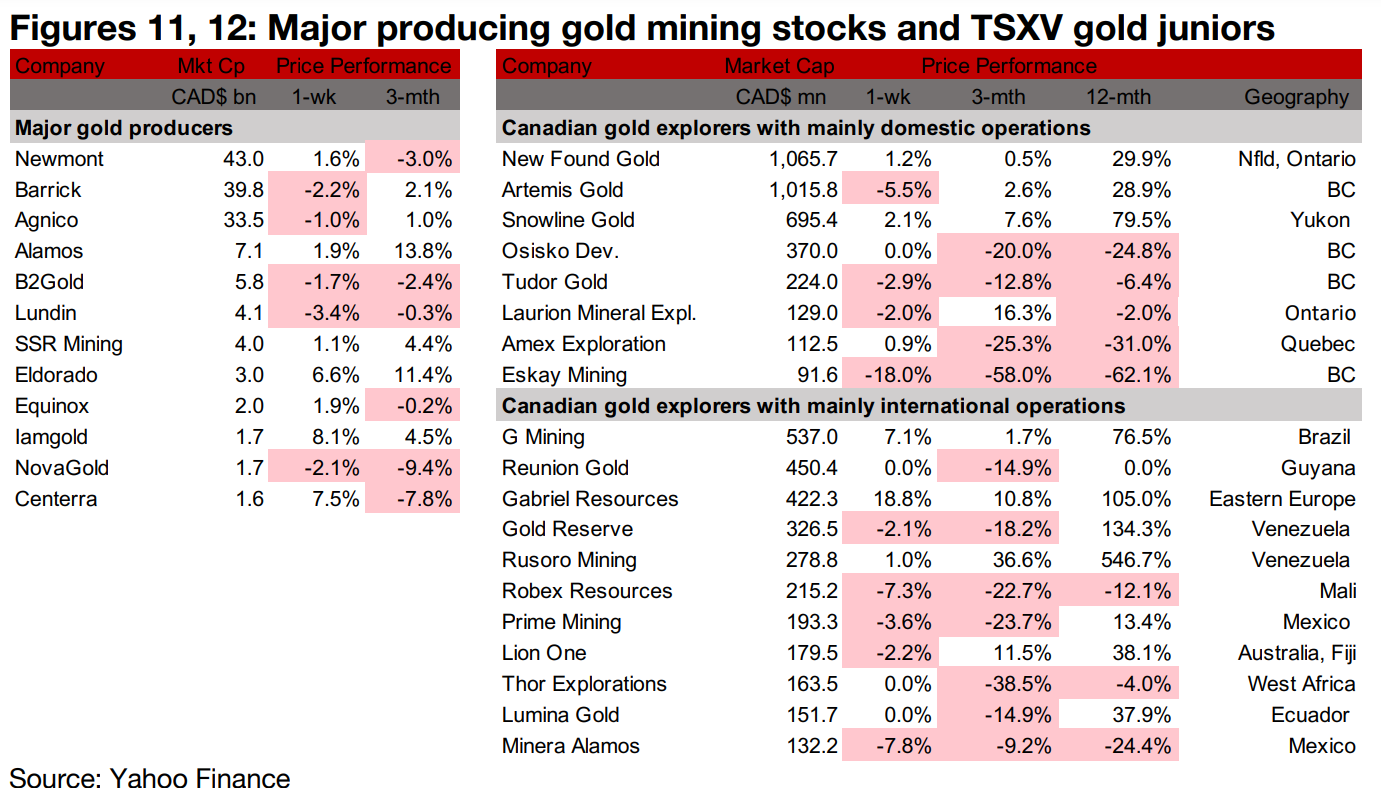
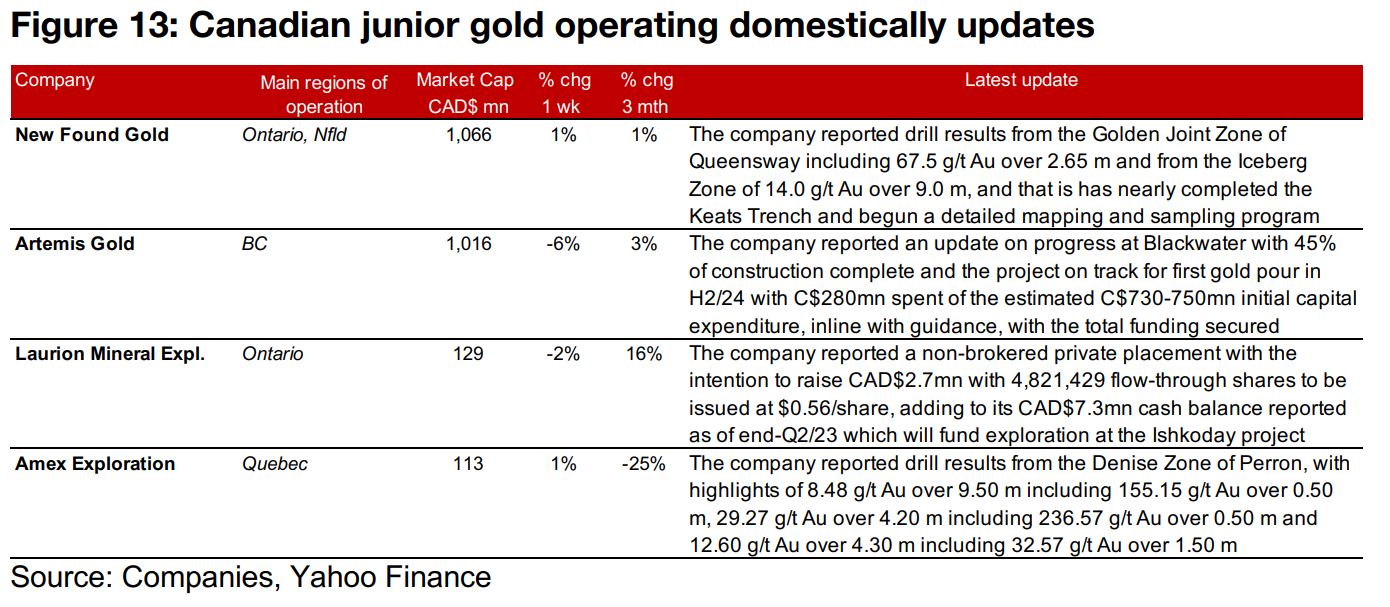
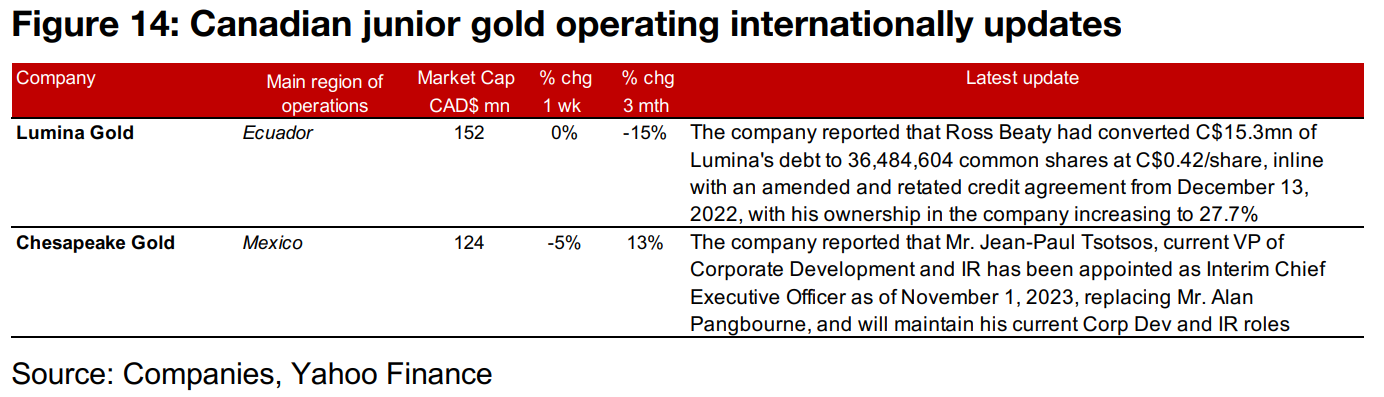
The gold producers and large TSXV gold stocks were mixed as the gold price continued to rise but equities declined (Figures 11, 12). For the TSXV gold companies operating domestically, New Found Gold announced drill results from the Golden Joint and Iceberg Zones of the Queensway project, Artemis reported progress on construction at Blackwater, Laurion Mineral Exploration announced a private placement and Amex Exploration reported drill results from the Denise Zone of the Perron project (Figure 13). For the TSXV gold companies operating internationally, Lumina Gold reported that Ross Beaty converted C$15.3mn of its debt to equity and Chesapeake gold announced the appointment of an interim Chief Executive Officer (Figure 14).
Disclaimer: This report is for informational use only and should not be used an alternative to the financial and legal advice of a qualified professional in business planning and investment. We do not represent that forecasts in this report will lead to a specific outcome or result, and are not liable in the event of any business action taken in whole or in part as a result of the contents of this report.
Author
Ben McGregor authors the Weekly Roundup at CanadianMiningReport.com, providing sharp analysis of the metals and mining sector. With a talent for spotting trends, Ben distills complex market shifts into clear, engaging insights on TSXV junior miners. His weekly updates cover gold, copper, uranium, and more, blending data-driven perspectives with a knack for identifying opportunities. A vital resource for investors, Ben’s work navigates the dynamic junior mining landscape with precision.