
July 28, 2025
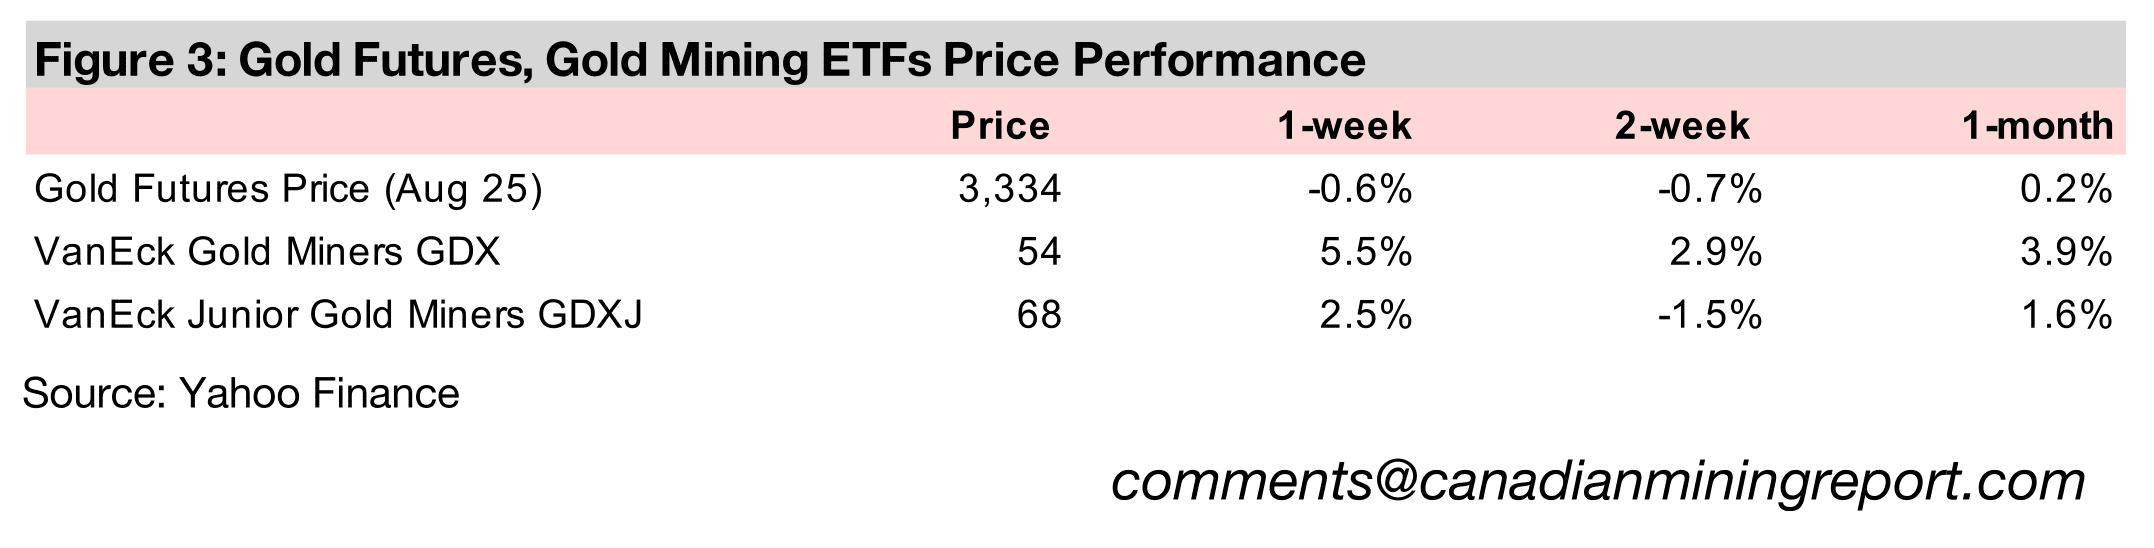
While gold edged down -0.6% to US$3,334/oz, it hit a new all-time high earlier in the week with the futures reaching US$3,439/oz before dropping back towards the middle of the US$3,200/oz-US$3,400/oz range that has held for three months.
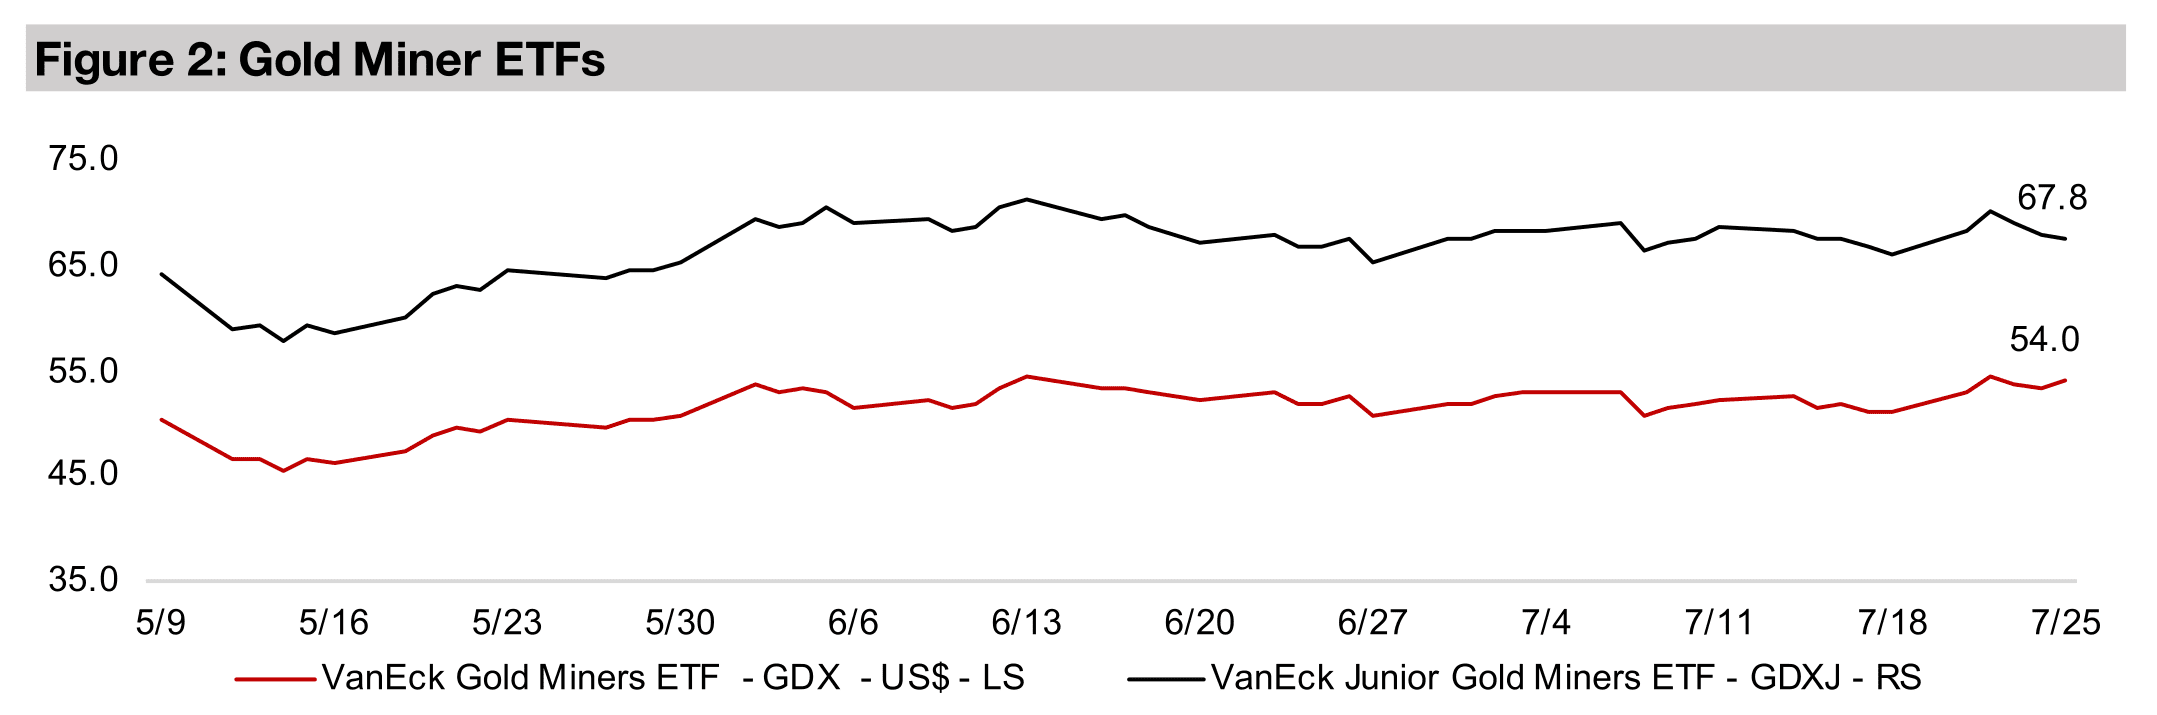
The gold stocks gained even as the metal declined, which is relatively rare, with the GDX up 5.5% and GDXJ gaining 2.5%, suggesting that the market is starting to price in a gold price that will be higher for longer, while equity markets reached new highs.


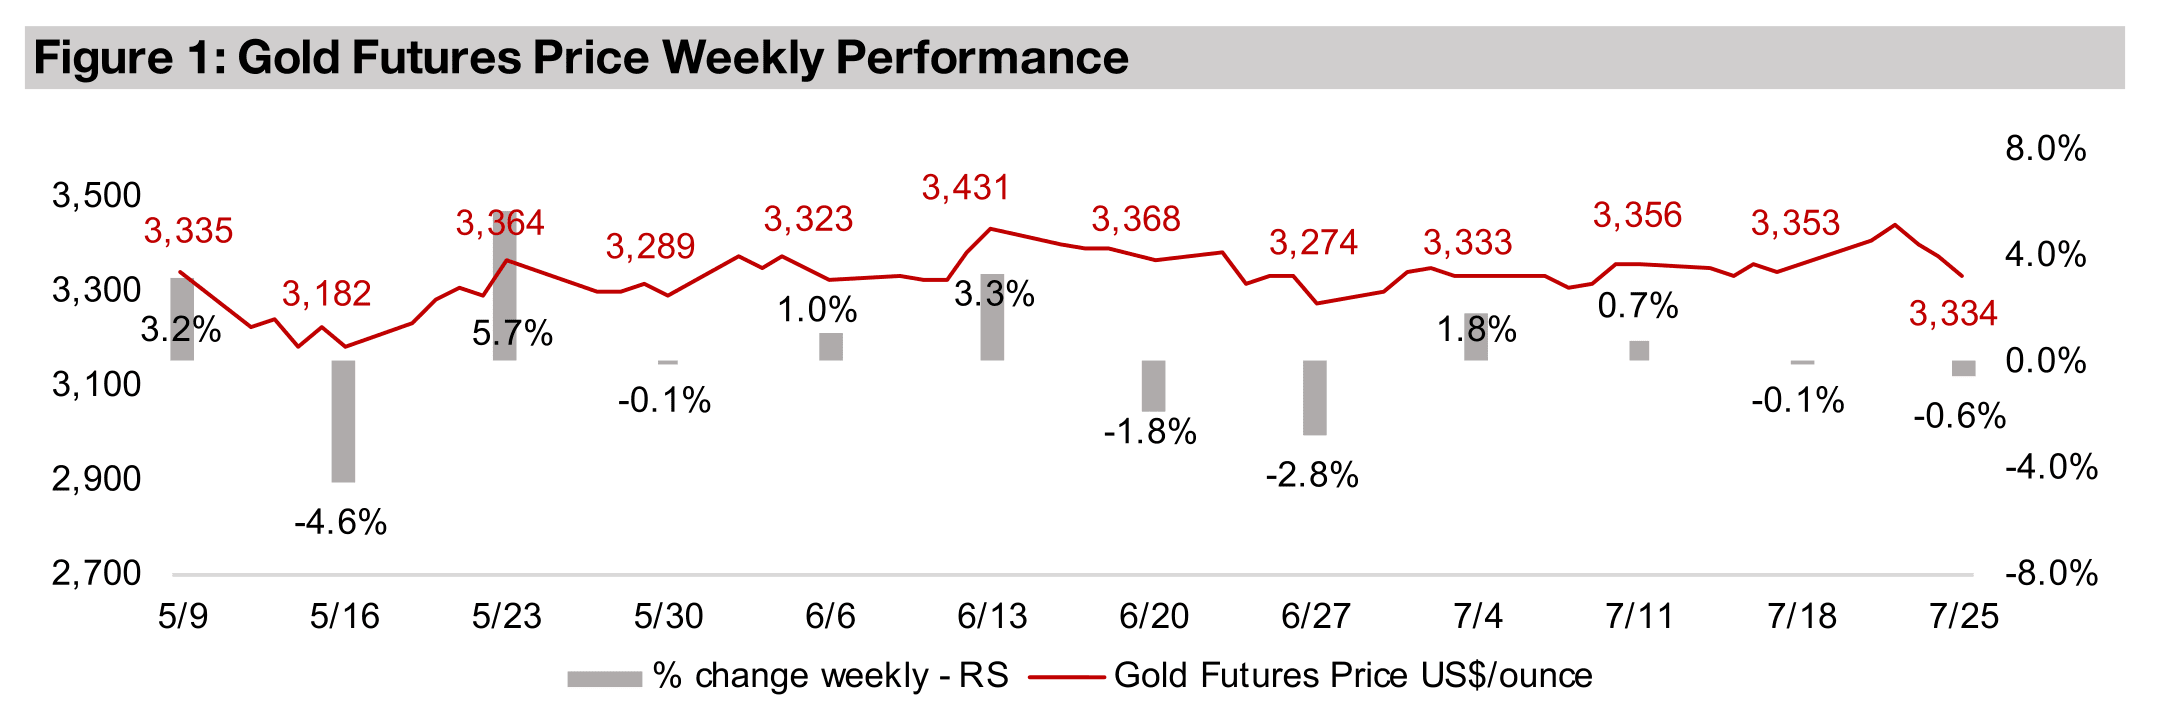
The gold price declined -0.6% to US$3,334/oz, although it touched new highs at
US$3,439/oz earlier in the week before pulling back towards the middle of the
remarkably persistent US$3,200/oz-US$3,400/oz range of the past three months.
The major run ups in platinum and palladium over the past two months lost some
momentum this week, with the metals down -3.8% and -4.7% respectively. However,
this still left them up 37.9% and 32.5% for the year, leading the precious metals this
year by far, with gold and silver up 23.5% and 13.0%, respectively.
Key economic data included the European Central Bank holding rates flat at 2.0%.
The ECB has already cut rates 2.0% from the 4.0% highs of mid-2024, while the US
has cut only one percent to 4.33% from a peak of 5.33%. This leaves US rates now
2.0% above Europe, and most other major global central banks have cut rates this
year. These relatively high rates have been a focus of the current US President, who
last week met with the head of the Federal Reserve. While he commented after the
meeting that he expected the Central Bank would start to lower rates soon, it is still
not clear that this will be the case. US economic data still relatively strong, and the
Fed is still concerned about the inflationary effects of the new US tariffs this year.
The gold stocks rose even as the metal declined, which is rare, with the GDX up 5.5%
and GDXJ gaining 2.5%, with the former nearing its peak and the latter hitting new
highs mid-week before pulling back. This implies the market may be starting to price
in the gold price holding higher for longer, as the persistence at this new range
indicates the move this year has not been only a short-term speculative surge. There
was also likely some support from the strength in equities, with the S&P up 1.3% and
Nasdaq gaining 0.7% and both reaching new highs. A rise in gold stocks is rare during
a major risk-on move, and they would usually be expected to underperform.
A new development over the past month has been the outperformance of some base
metals. The copper price in the US continued to rise this week, up 3.1%, and it has
gained 18.2% over the past month, by far the highest increase of any of the major
metals. Some other major base metals have also had a strong month overall, with
iron ore also jumping 13.3%, zinc gaining 4.9% and even the heavily oversupplied
nickel market gaining 0.9%. This compares to a 6.2%, 14.9% and 5.2% rise in
platinum, palladium and silver over the past month.
The global copper market has experienced some substantial distortion this year,
mainly driven by new US tariff policies. The shift started when the new US
administration announced in February 2025 that it would consider major tariffs on
copper. This led to US copper buyers increasing their purchases of the metal far
above previous levels to build up inventory before any major potential price hikes,
pulling supply away from other regions and boosting the price in the US.
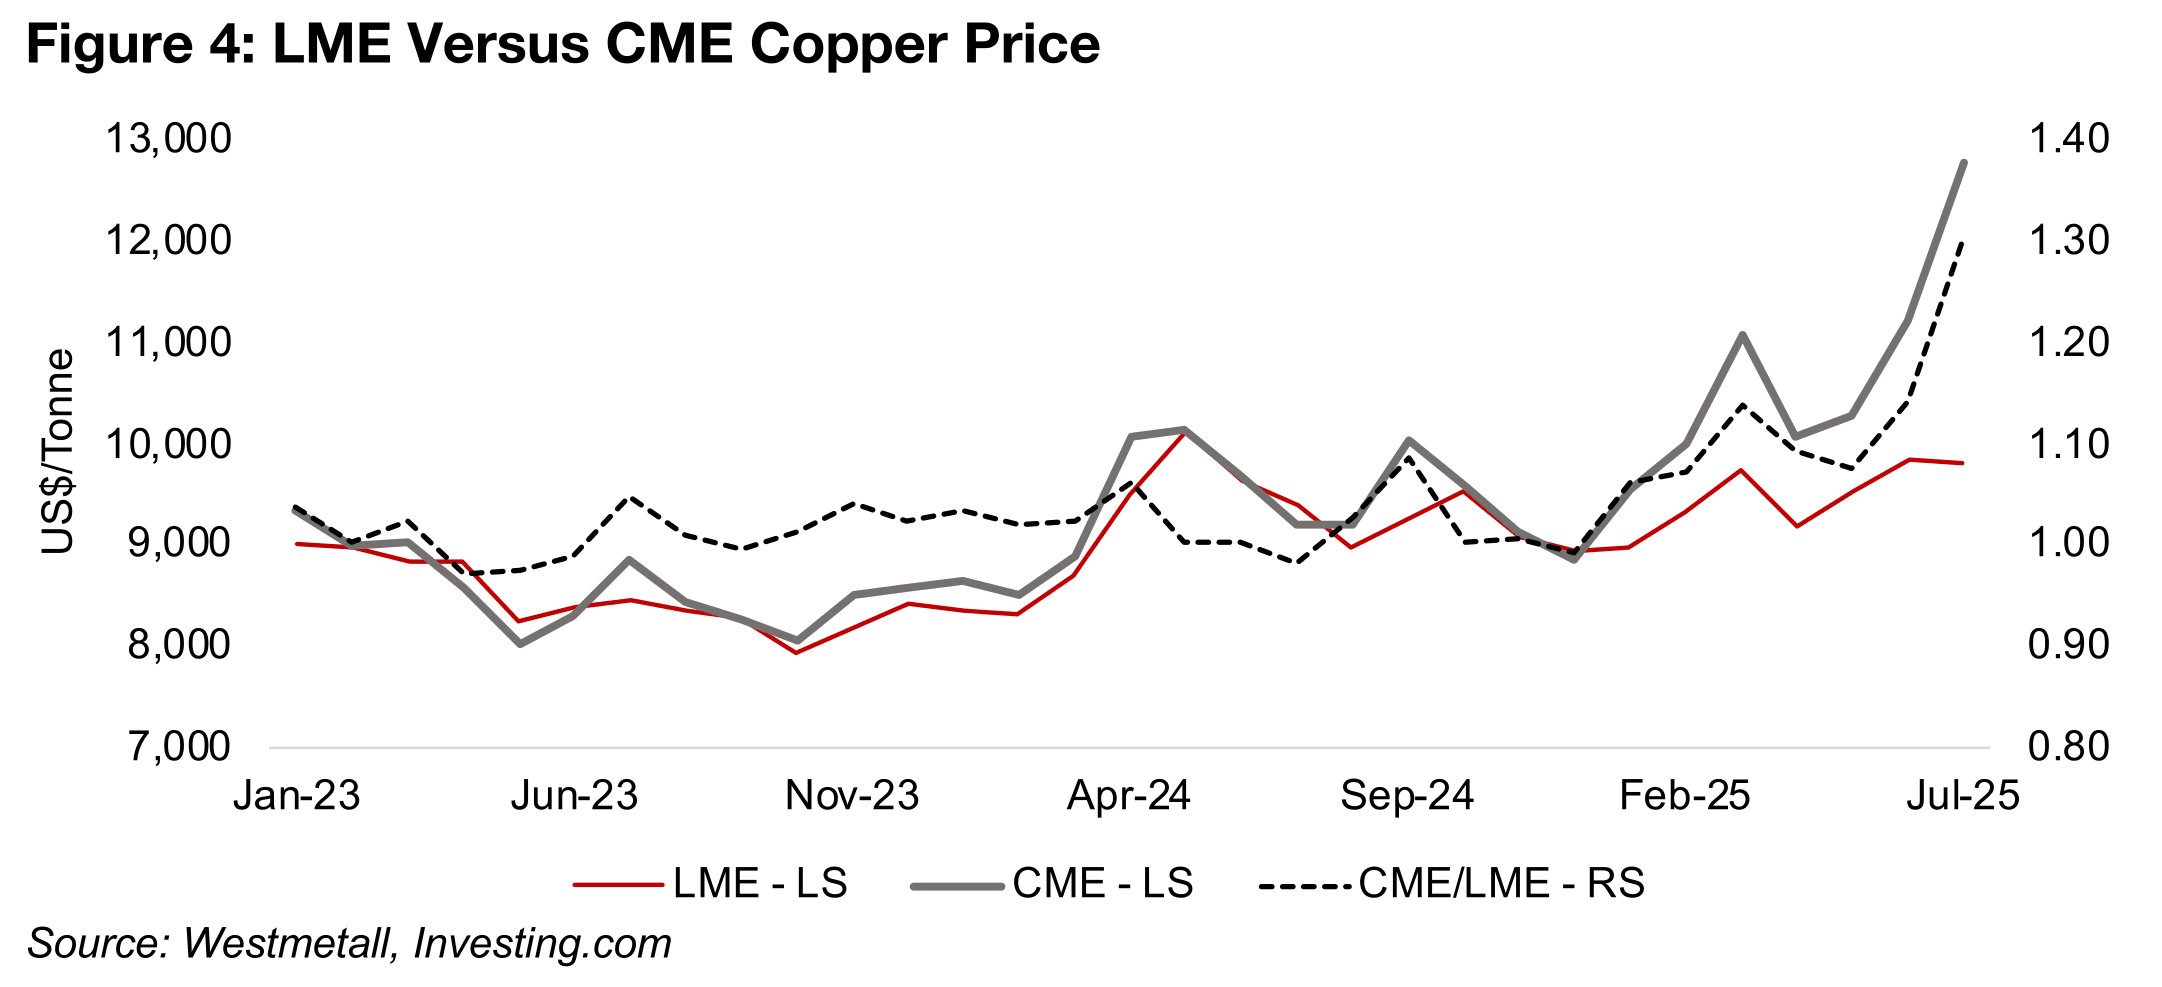
The copper prices on the London Metal Exchange (LME) in the UK and Chicago
Mercantile Exchange (CME) in the US are shown in Figure 4, with the spread between
them from 2023 to 2024 averaging only about 2.0%. However, the spread began to
widen significantly after the announcement of copper tariffs and it had spiked to 20%
by March 2025. While it pulled back to 10% in April 2025, it has continued to rise
since, with a major jump this month after the US administration’s announcement of a
50% tariff on copper to be implemented from August 1, 2025. The US price is now
US$12,743/tonne, at a 30% premium to the UK price of US$9,770/tonne.
The copper warehouse stocks of the three largest players, the US, the UK and China is shown in Figure 5. The CME stocks have seen a huge increase to 248k tonnes in July 2025, up from just 15k tonnes in July 2024, while the LME stock has dropped by nearly half to 128k tonnes from 239 tonnes. The Shanghai Futures Exchange (SHFE) stock dropped to 73k tonnes, a quarter of its July 2024 levels of 301k tonnes.
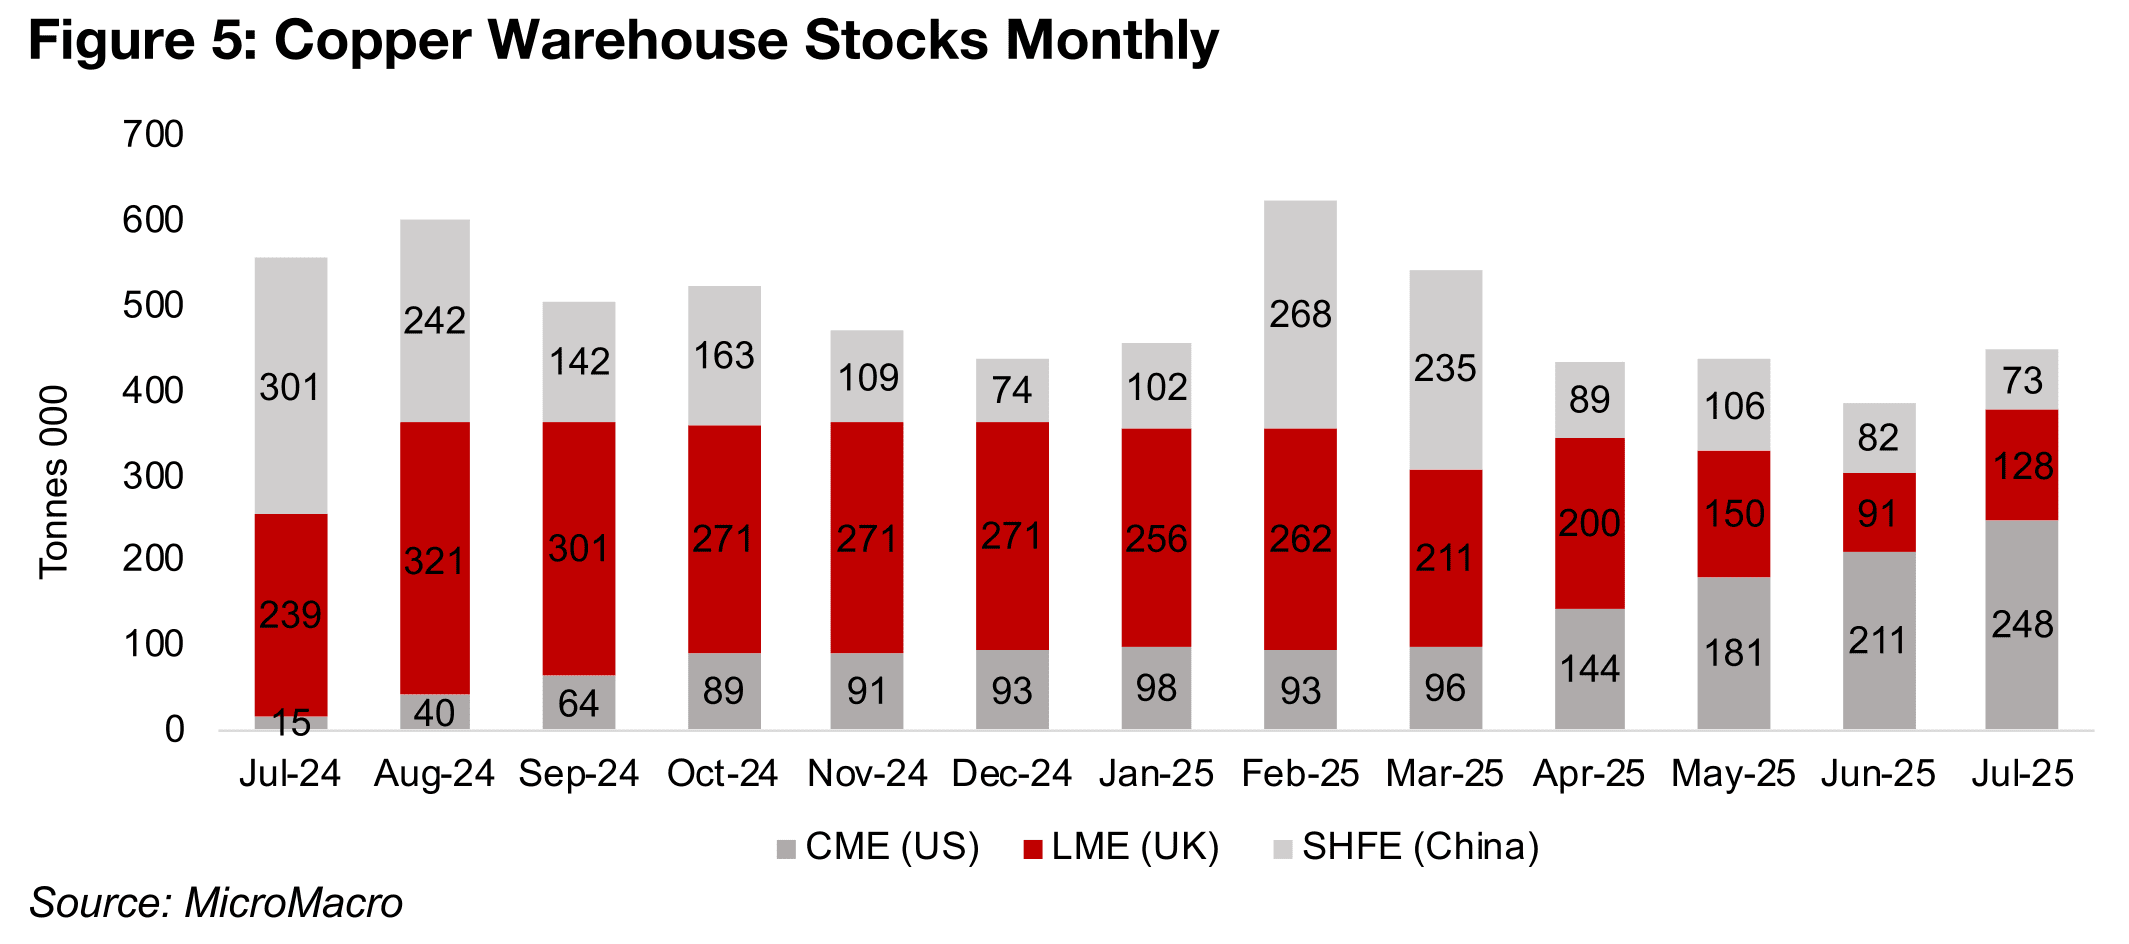
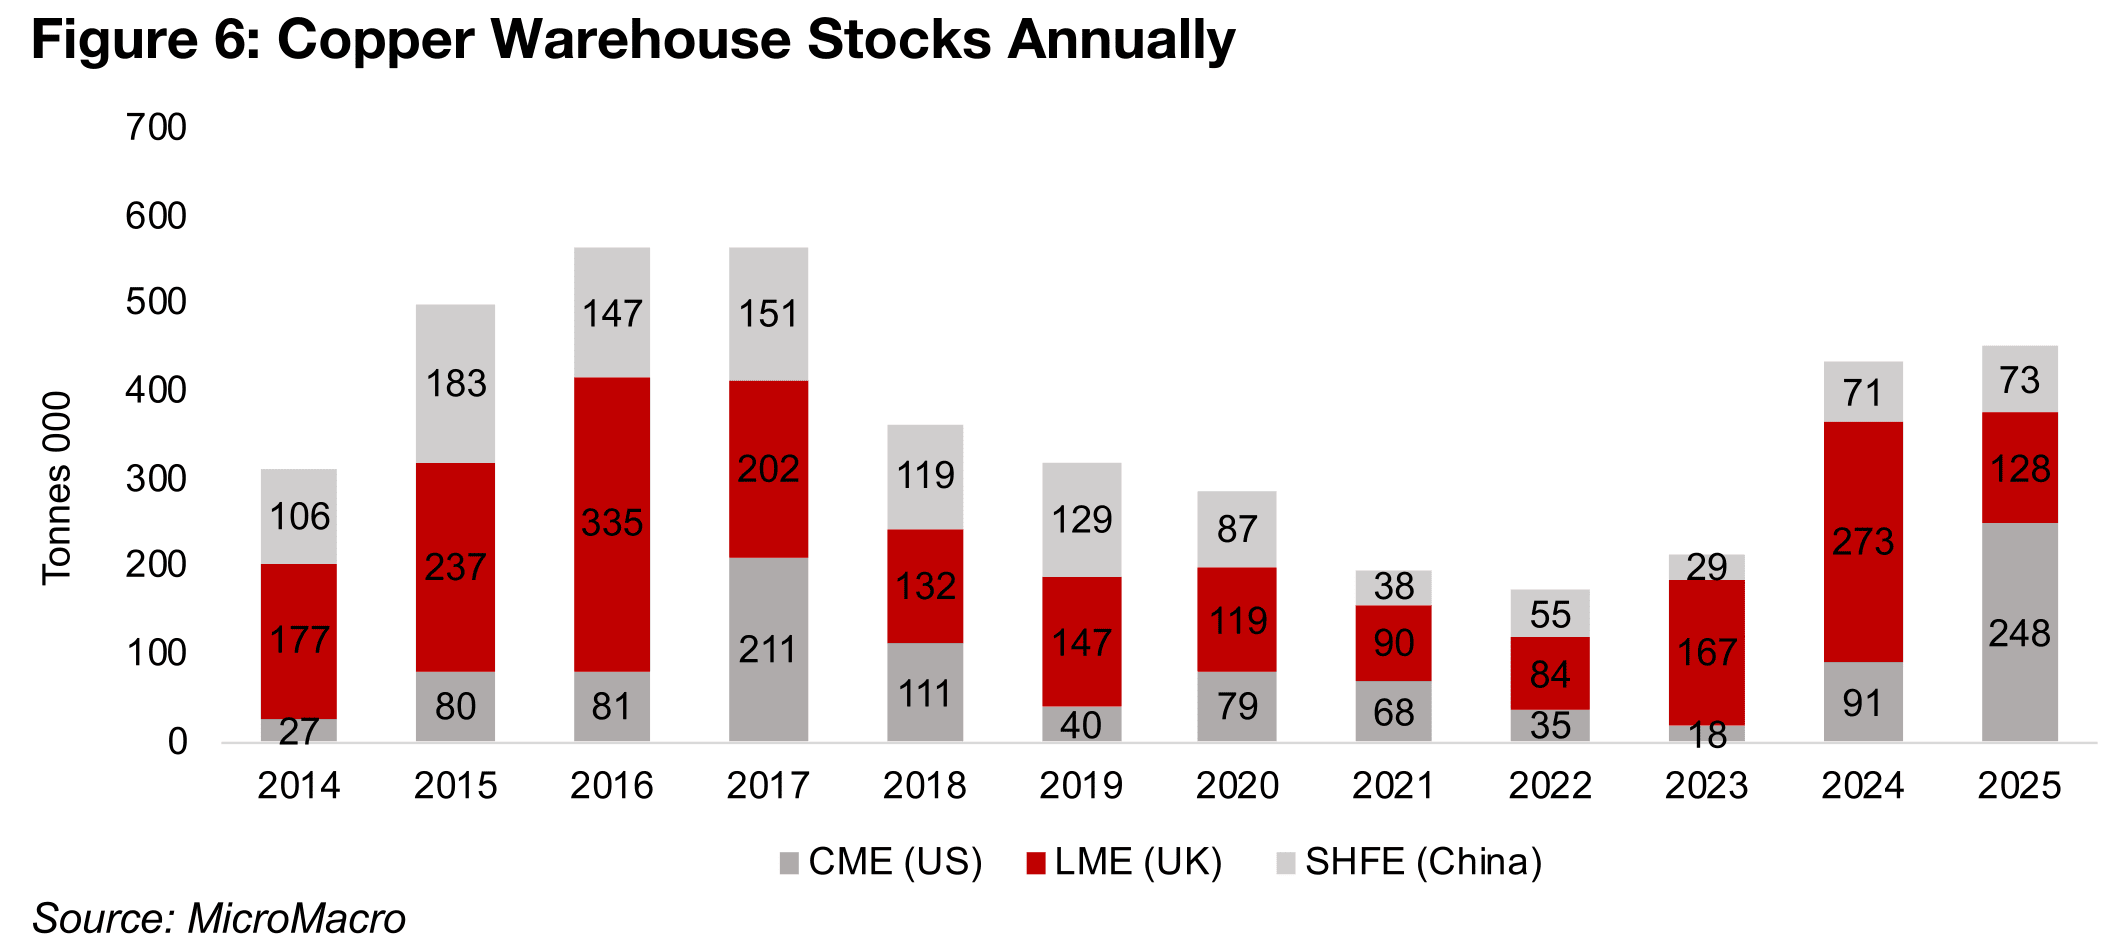
This puts the shares of the copper stock for the US, UK and China, at 55%, 29% and 16% as of July 2025. While there have been shifts in the shares between the countries over the past ten years, the LME on average has held the largest proportion of global copper stocks at 49%, Shanghai second at 27% and the US third at 24% (Figure 6). The current situation with the US having the largest copper stocks is therefore rare, with it usually having the smallest inventories of the top three.
If the US administration does come through with its August 1, 2025 copper tariffs, it
seems likely that this distortion will start to unwind. The copper price will suddenly be
far more expensive in the US and discourage buying in the country, especially with
stocks built up to so high a level. It will then take time for the currently high US stock
to be drawn down by industrial use, and it can be assumed that the flow of the metal
into the US will slow considerably for the rest of 2025. A build of inventories in the UK
and China back towards historical averages is likely to follow. However, this is of
course assuming no last minute reversal of US policy on the copper tariff, with such
abrupt changes typical of the current administration.
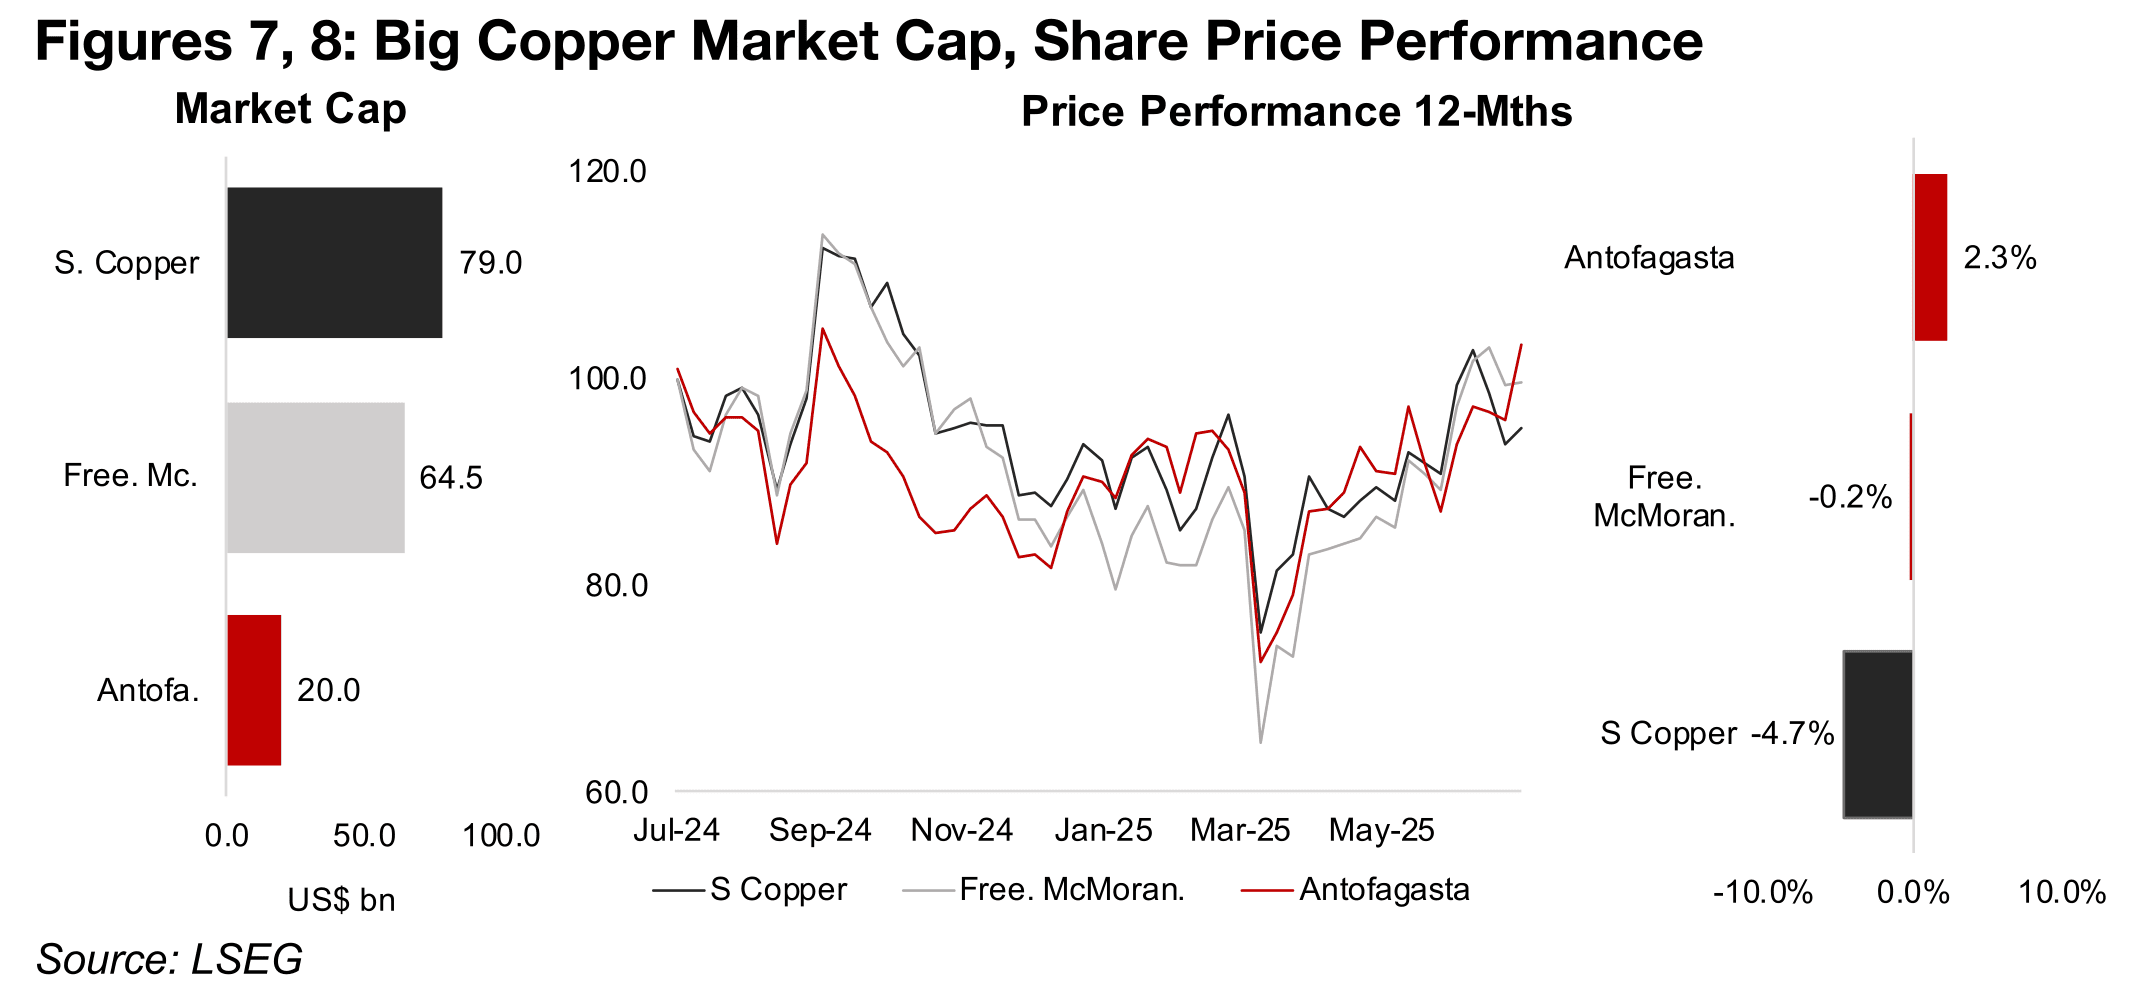
While the big copper stocks have gained in recent months, much of this has been
similar to the rebound from the early April 2025 broader crash for many assets. There
has not been a major outperformance of the US based stocks Southern Copper and
Freeport McMoran even with the high US copper price, while Antofagasta is listed in
the UK and is likely more driven by the lower copper price in that country. This
suggests that the market is pricing in expectations that this distortion may reverse,
even with a move to the downside that could offset the recent spike in terms of
average prices for this year. Southern Copper is still down -4.7% over the past year,
Freeport McMoran is near flat with a -0.2% decline, and Antofagasta has gained just
2.3%, and these stocks have only recently moved above their lows in the April 2025
crash (Figures 7, 8).
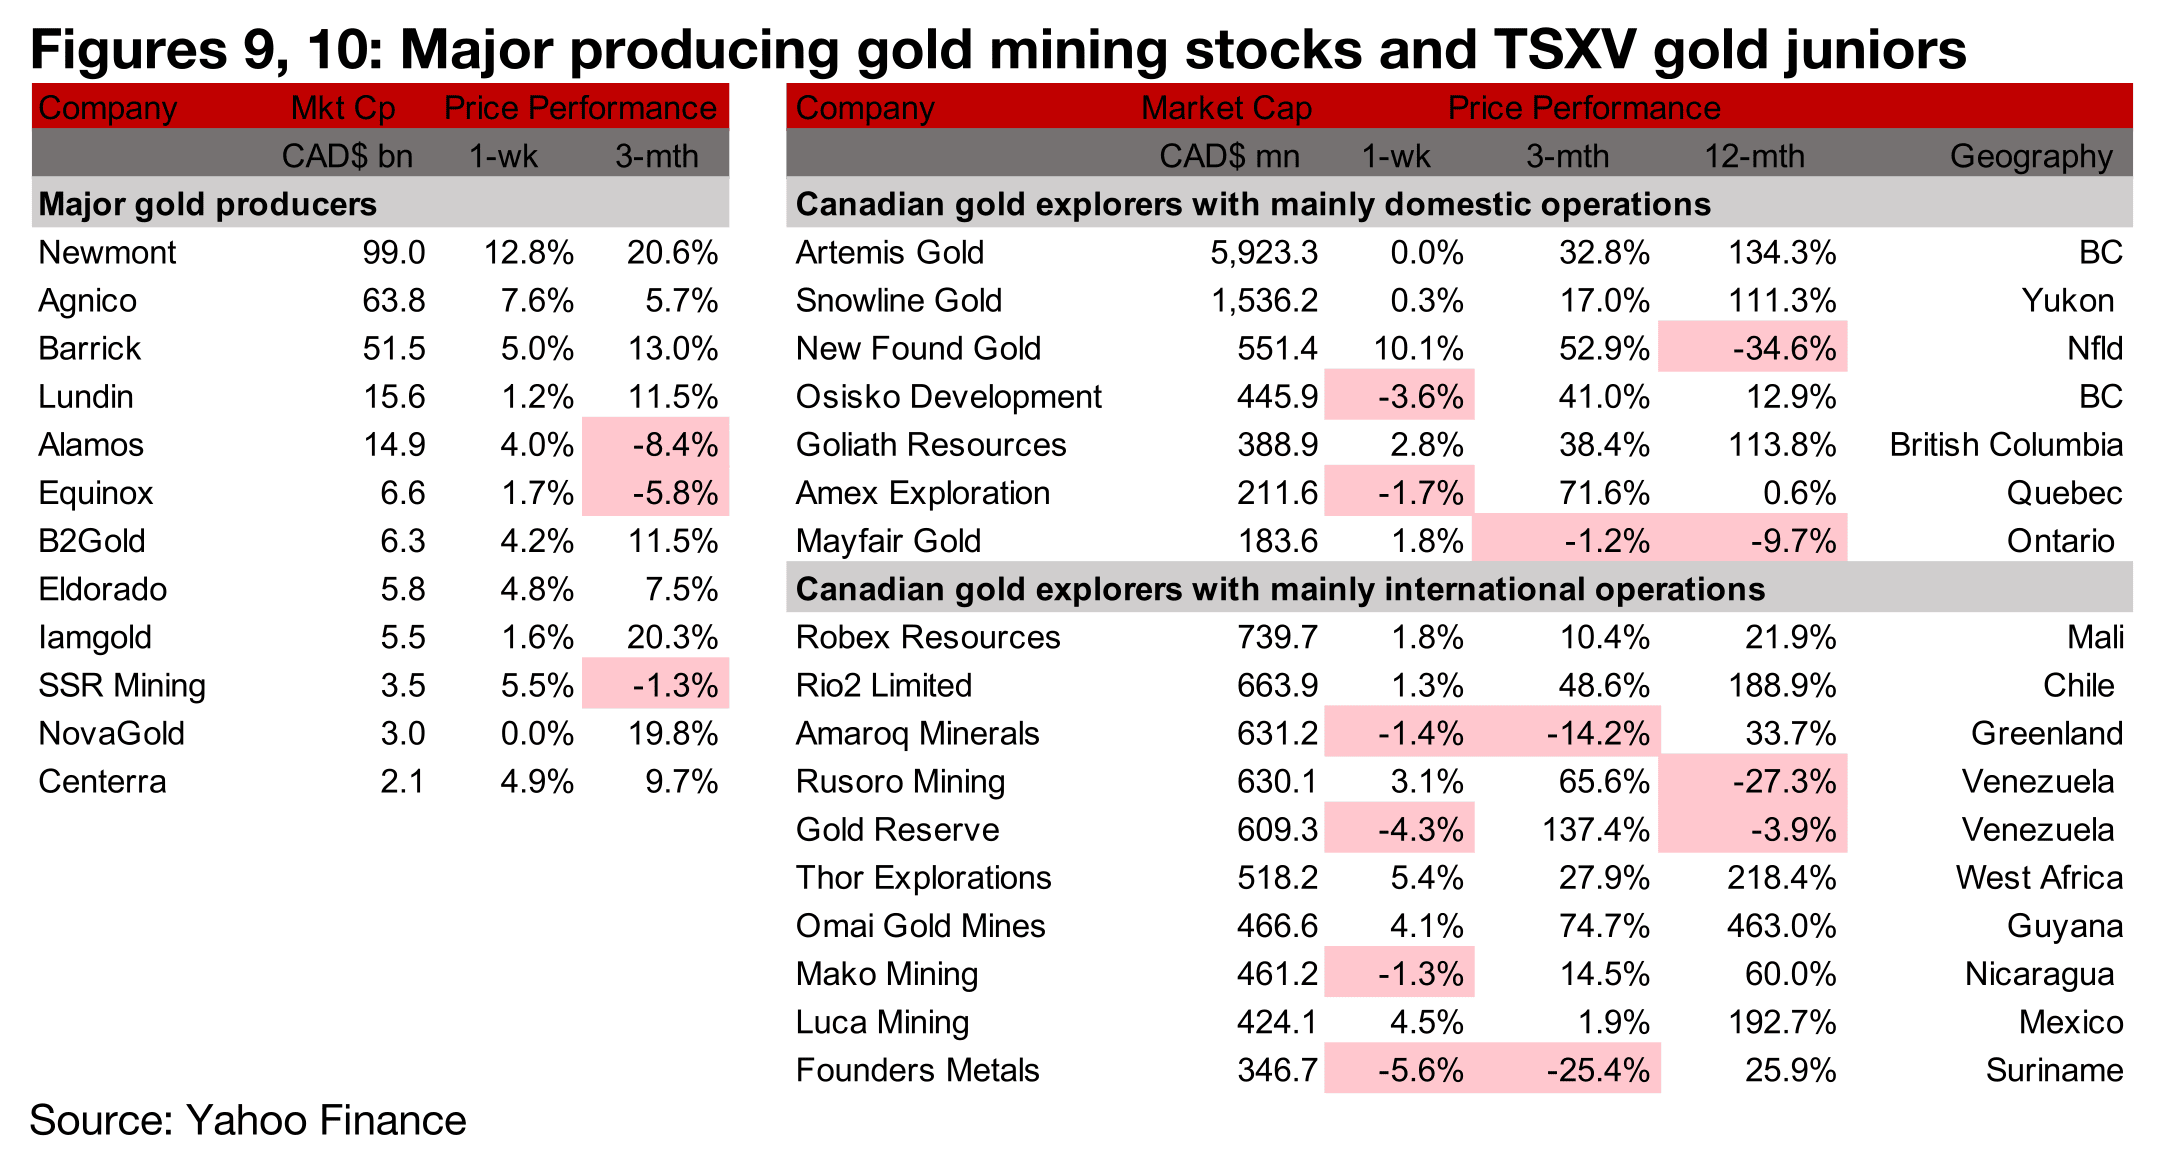
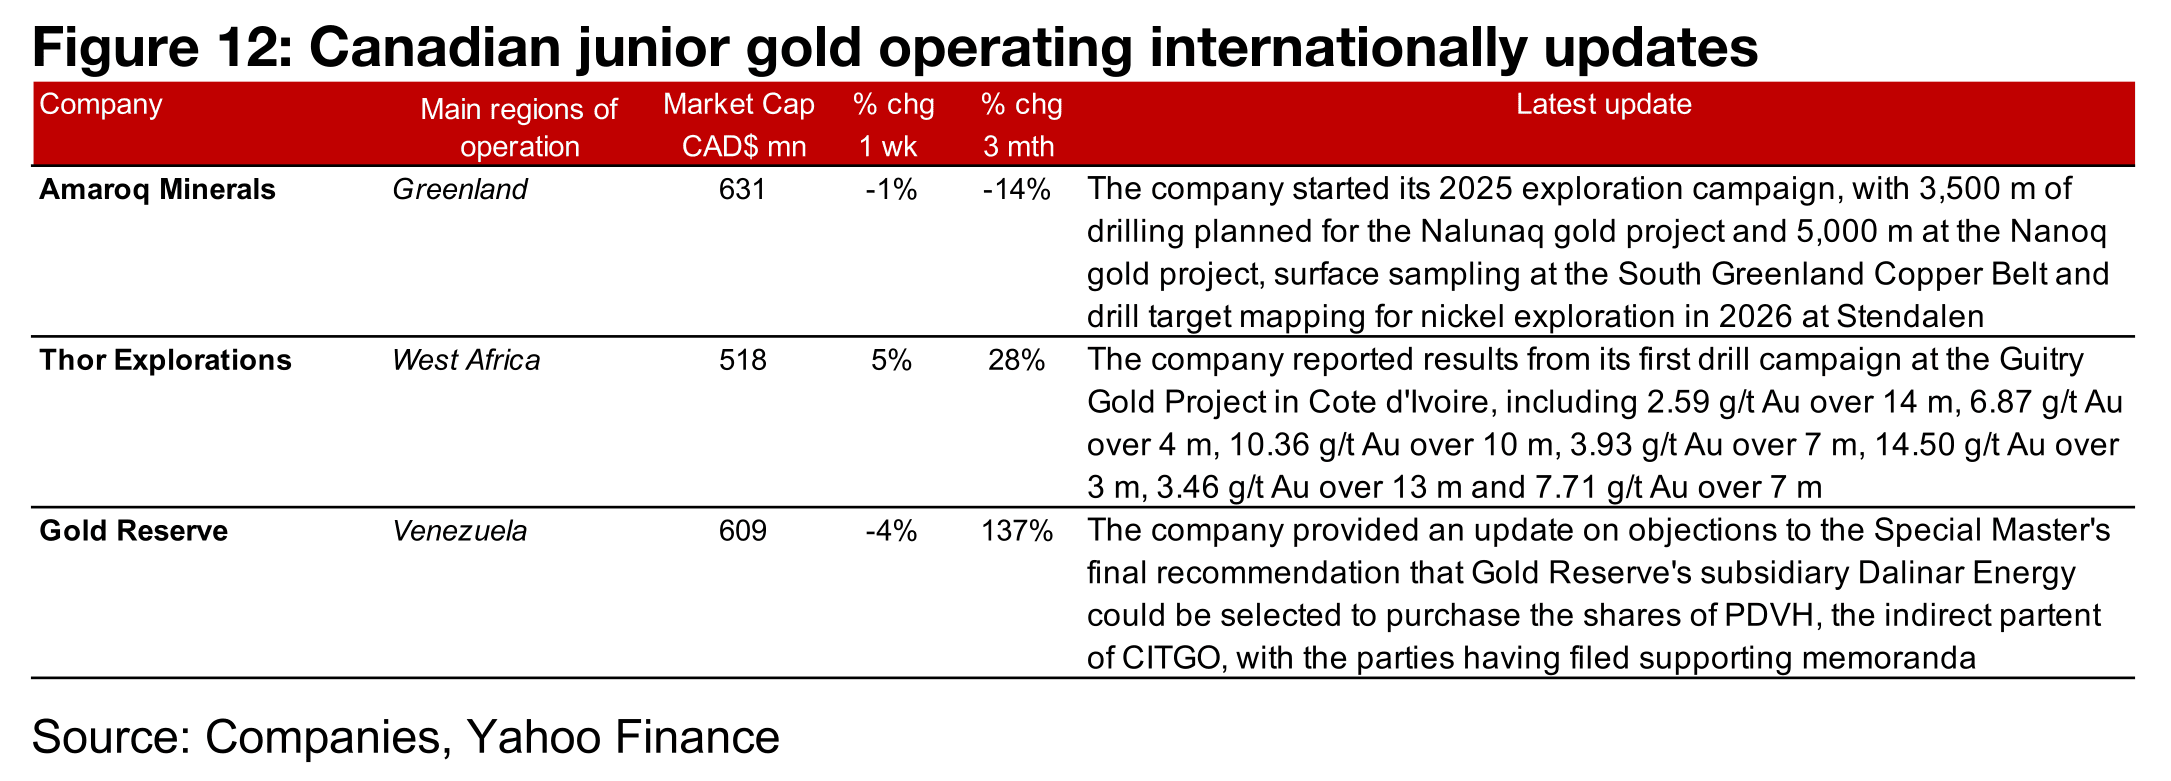
The major gold producers all rose even though the metal price declined and large TSXV gold was mixed (Figures 9, 10) For the TSXV gold companies operating mainly domestically, New Found Gold released its PEA for Queensway and Osisko Development reported a US$450mn financing for Cariboo (Figure 11). For the TSXV gold companies operating mainly internationally, Amaroq started its 2025 exploration campaign, Gold Reserve provided an update on the objections to the Special Master’s decisions that its subsidiary Dalinar should purchase the share of PDVH, the indirect parent of CITGO, and Thor Explorations reported the first drill results from the Guitry gold project (Figure 12).
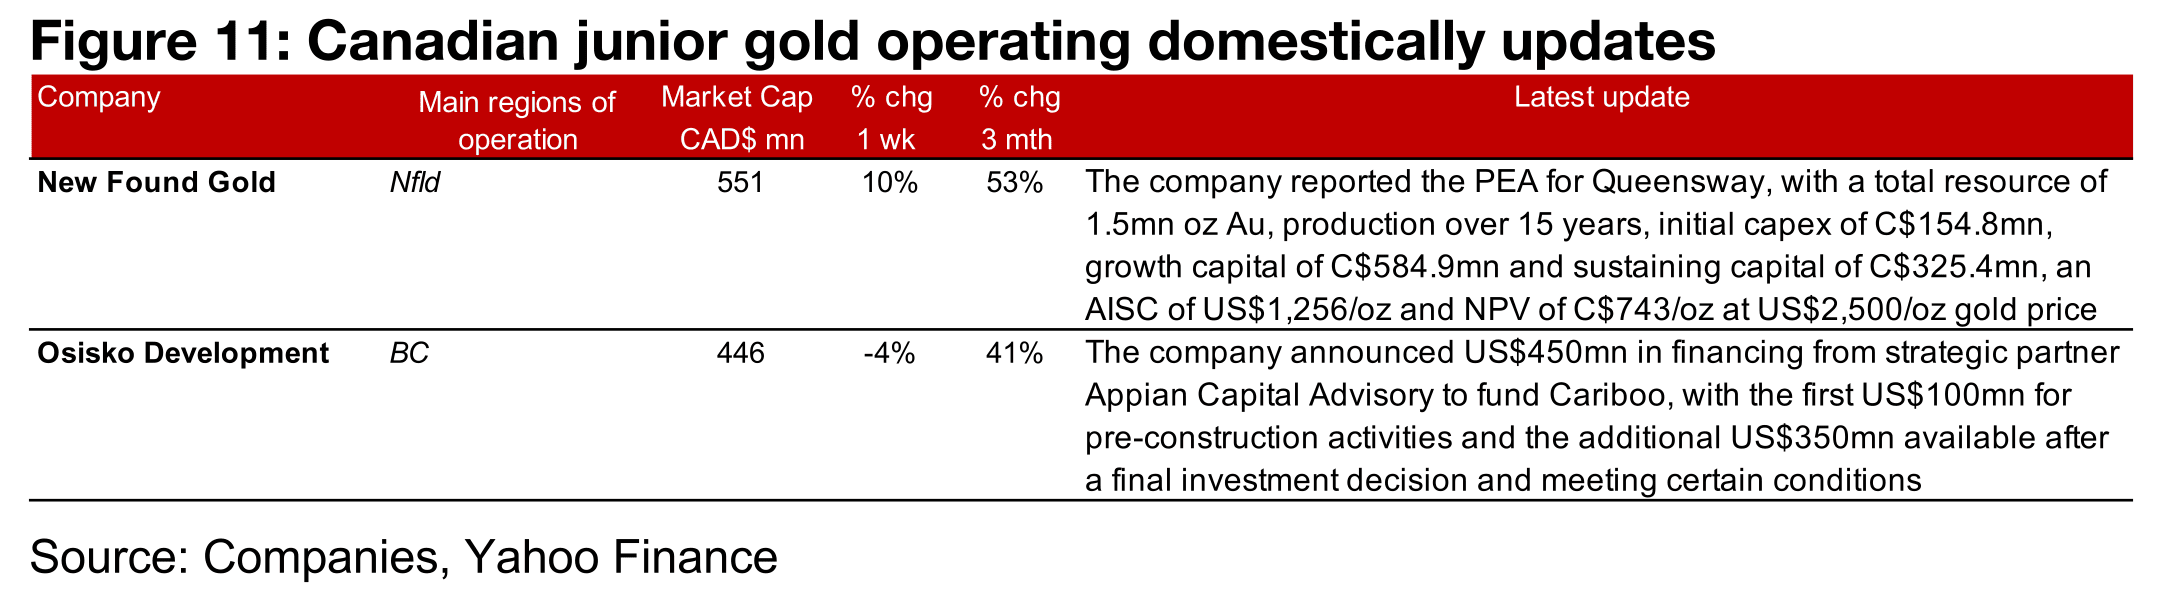
New Found Gold’s long awaited PEA for Queensway was received well by the market,
with the stock rising 10% for the week. The company outlines a project with 1.5mn
oz Au in total resources with production over fifteen years for an average 100k oz Au
per year. This will be weighted towards the later years, with output of 69.3k oz Au
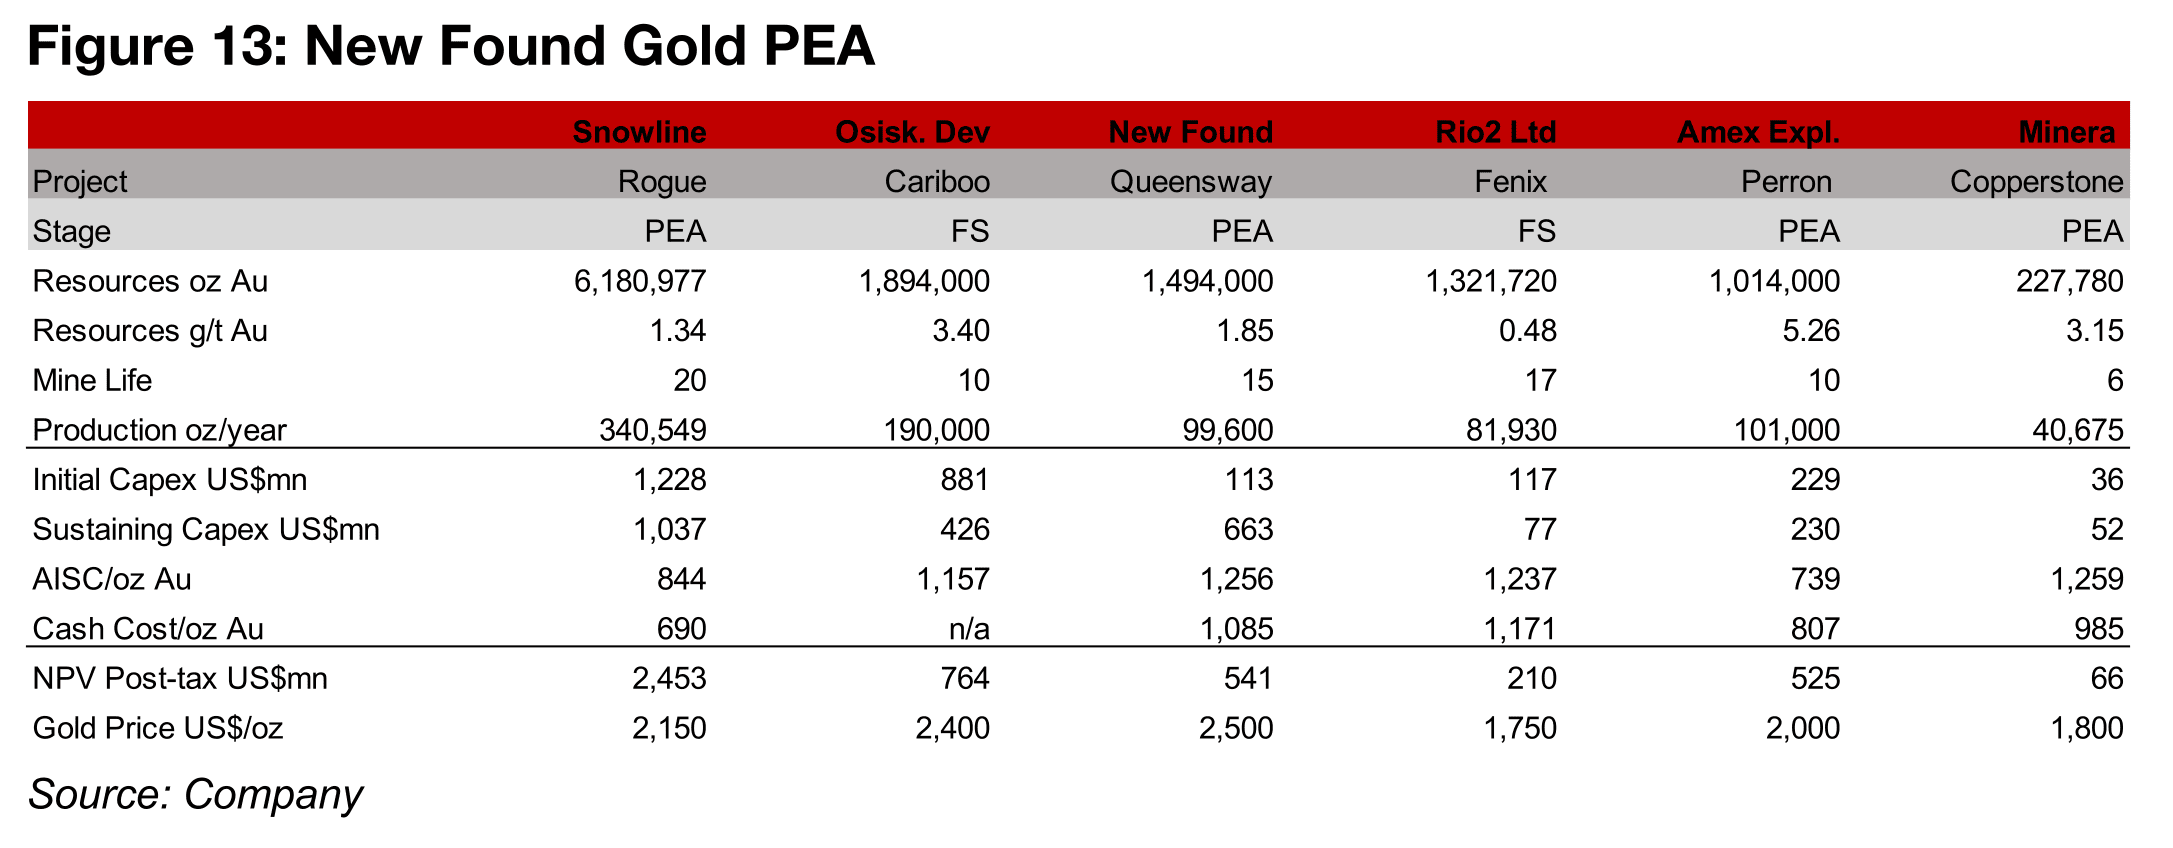
expected for the first four years and 91.9k oz Au from years five to nine (Figure 13).
This puts it around the middle in terms of resource size of the main projects of the
large TSXV gold developers, with Snowline’s Rogue project the highest with 6.2mn
oz Au Resources and Minera Alamos’s Copperstone the smallest at 0.2mn oz Au.
While the project is expected to have a relatively low initial capex of US$113mn, the
combined growth capital and sustaining capex is estimated to be relatively high at
US$663. The AISC for the project is also high versus the other TSXV developers at
US$1,256/oz Au. The post-tax NPV of US$541mn is actually closest to Osisko
Development’s Cariboo project of US$764mn, given that the two companies use
similar gold prices of US$2,500/oz Au and US$2,400/oz Au, respectively. While Amex
Exploration’s PEA for Perron has an NPV of US$525mn, it uses a much lower
US$2,000/oz gold price and is therefore not entirely comparable with New Found
Gold’s estimate for Queensway.
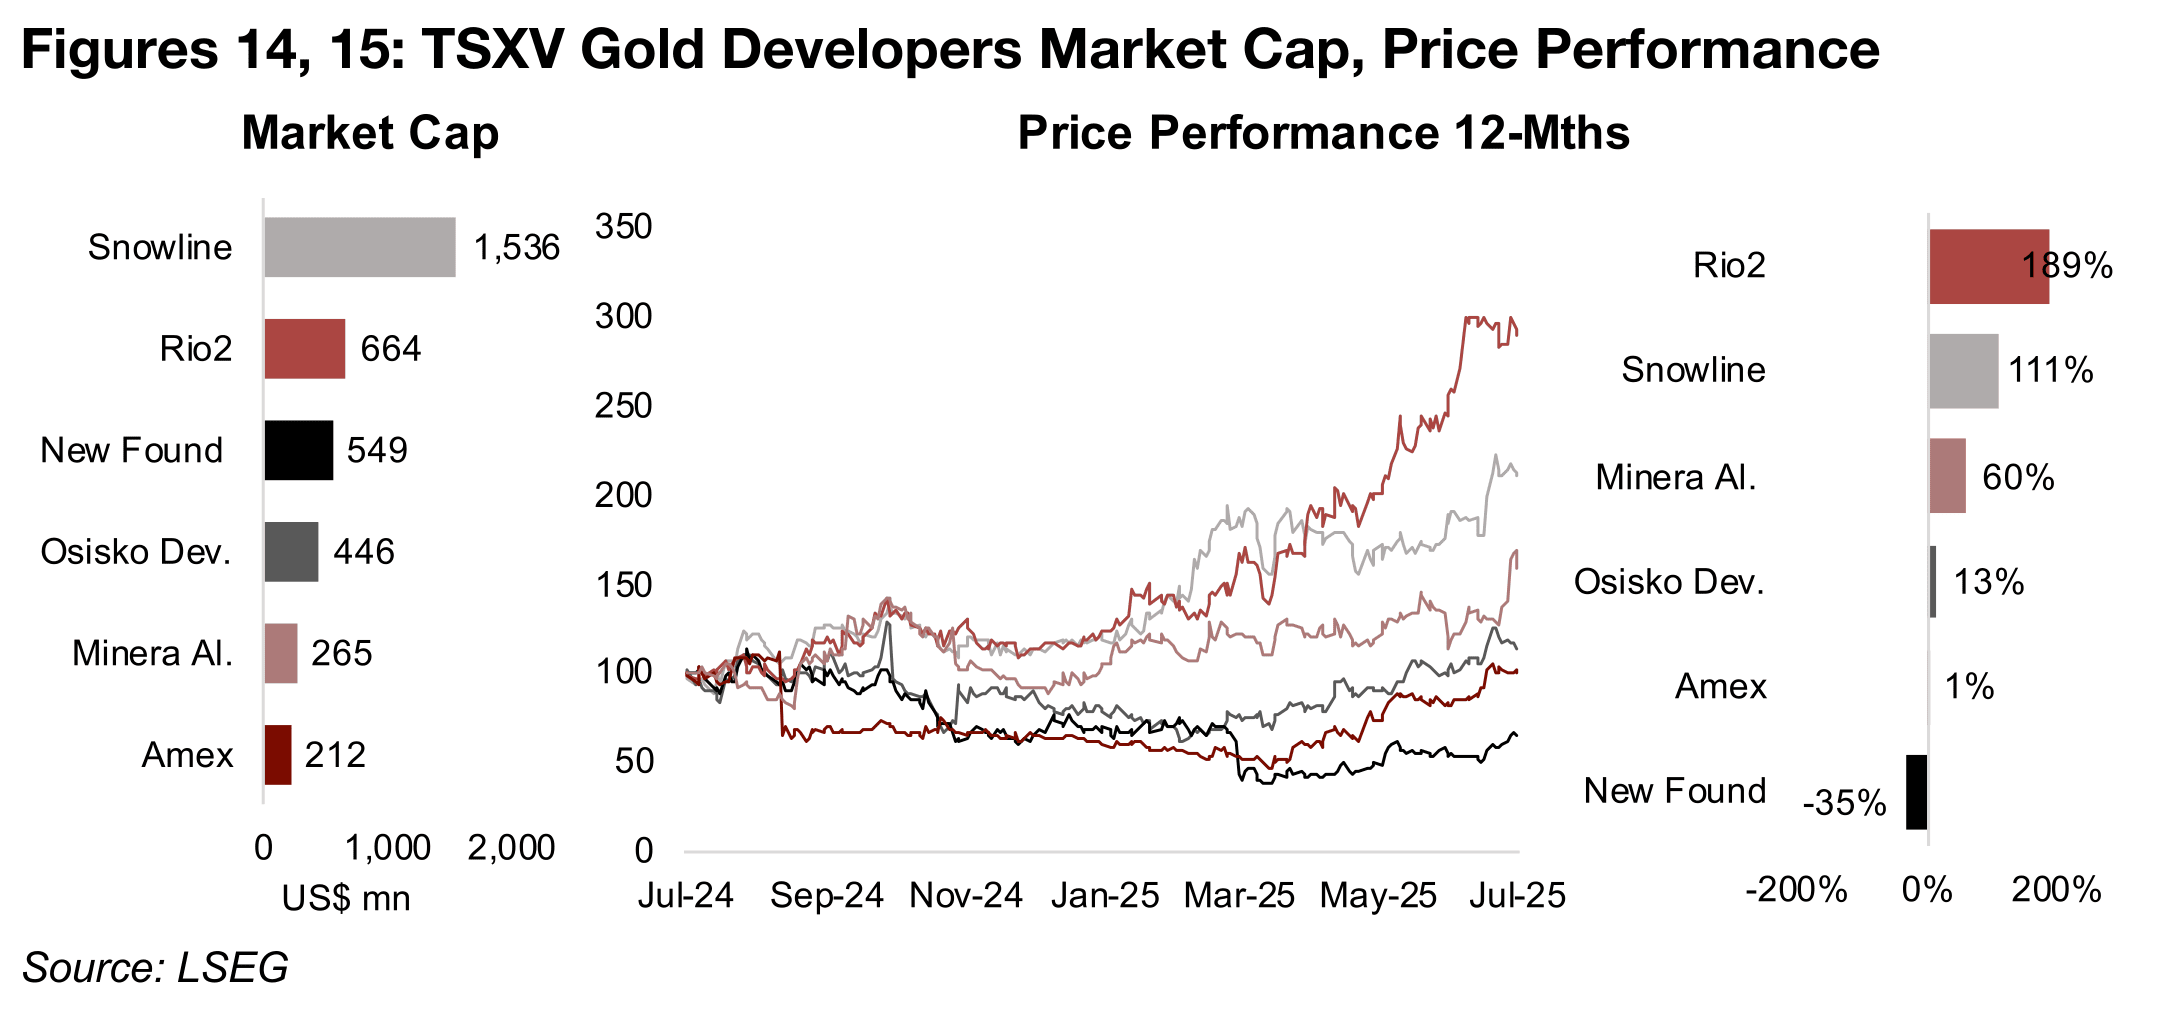
New Found Gold has substantially underperformed the larger TSXV gold developers over the past year, down -35%, with the next lowest performance, from Amex, still nearly flat with a one percent gain (Figures 14, 15). The rest of the group has made between moderate and substantial gains, with Snowline and Rio2 Limited more than doubling. Market sentiment on New Found Gold had turned relatively negative after the March 2025 release of the Initial Resource Estimate for Queensway which strongly disappointed the market. The shares dropped 50% on the announcement, indicating expectations for a resource twice the size of what was actually reported. However, while the share price trended down from July 2024 through to March 2025, there has been a pickup recently, with the shares up 53% over the past three months.
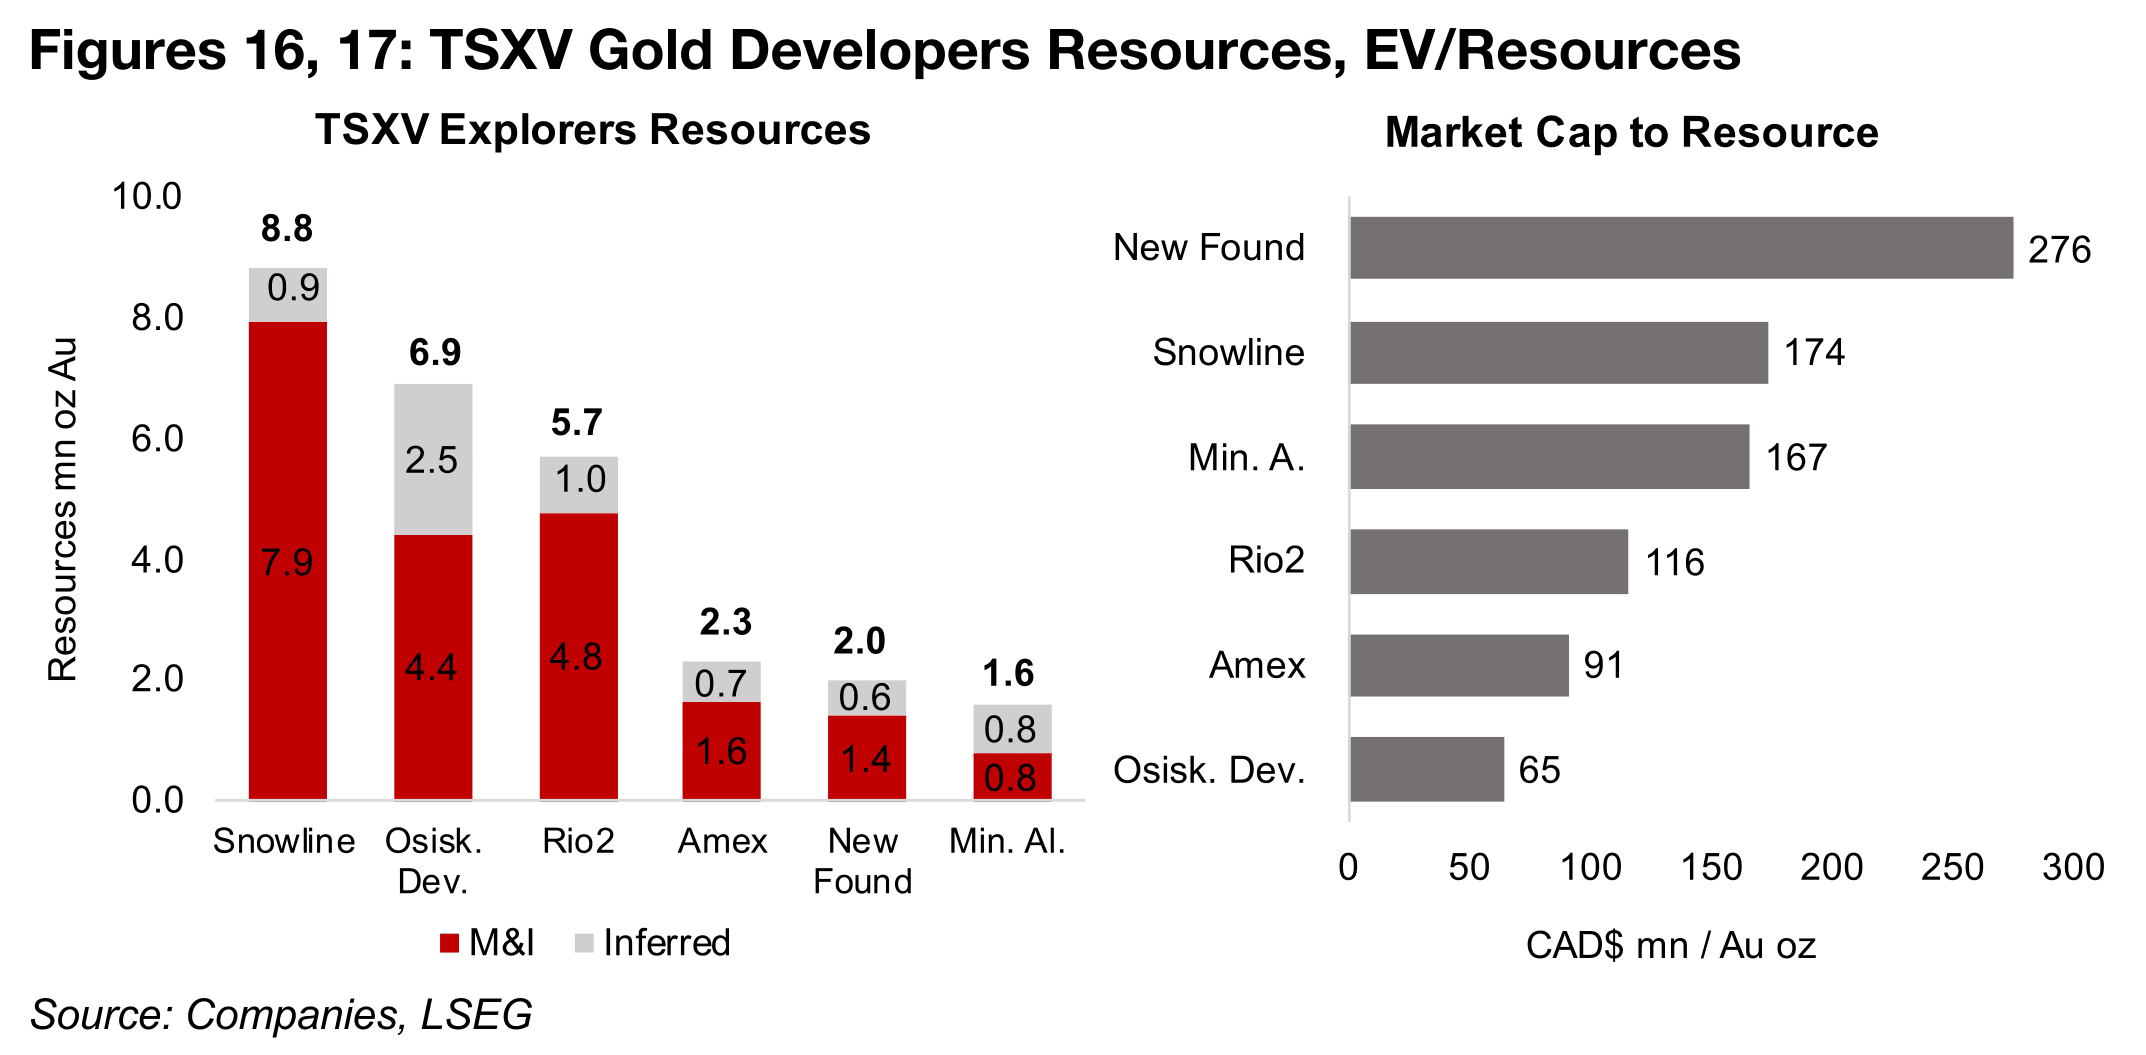
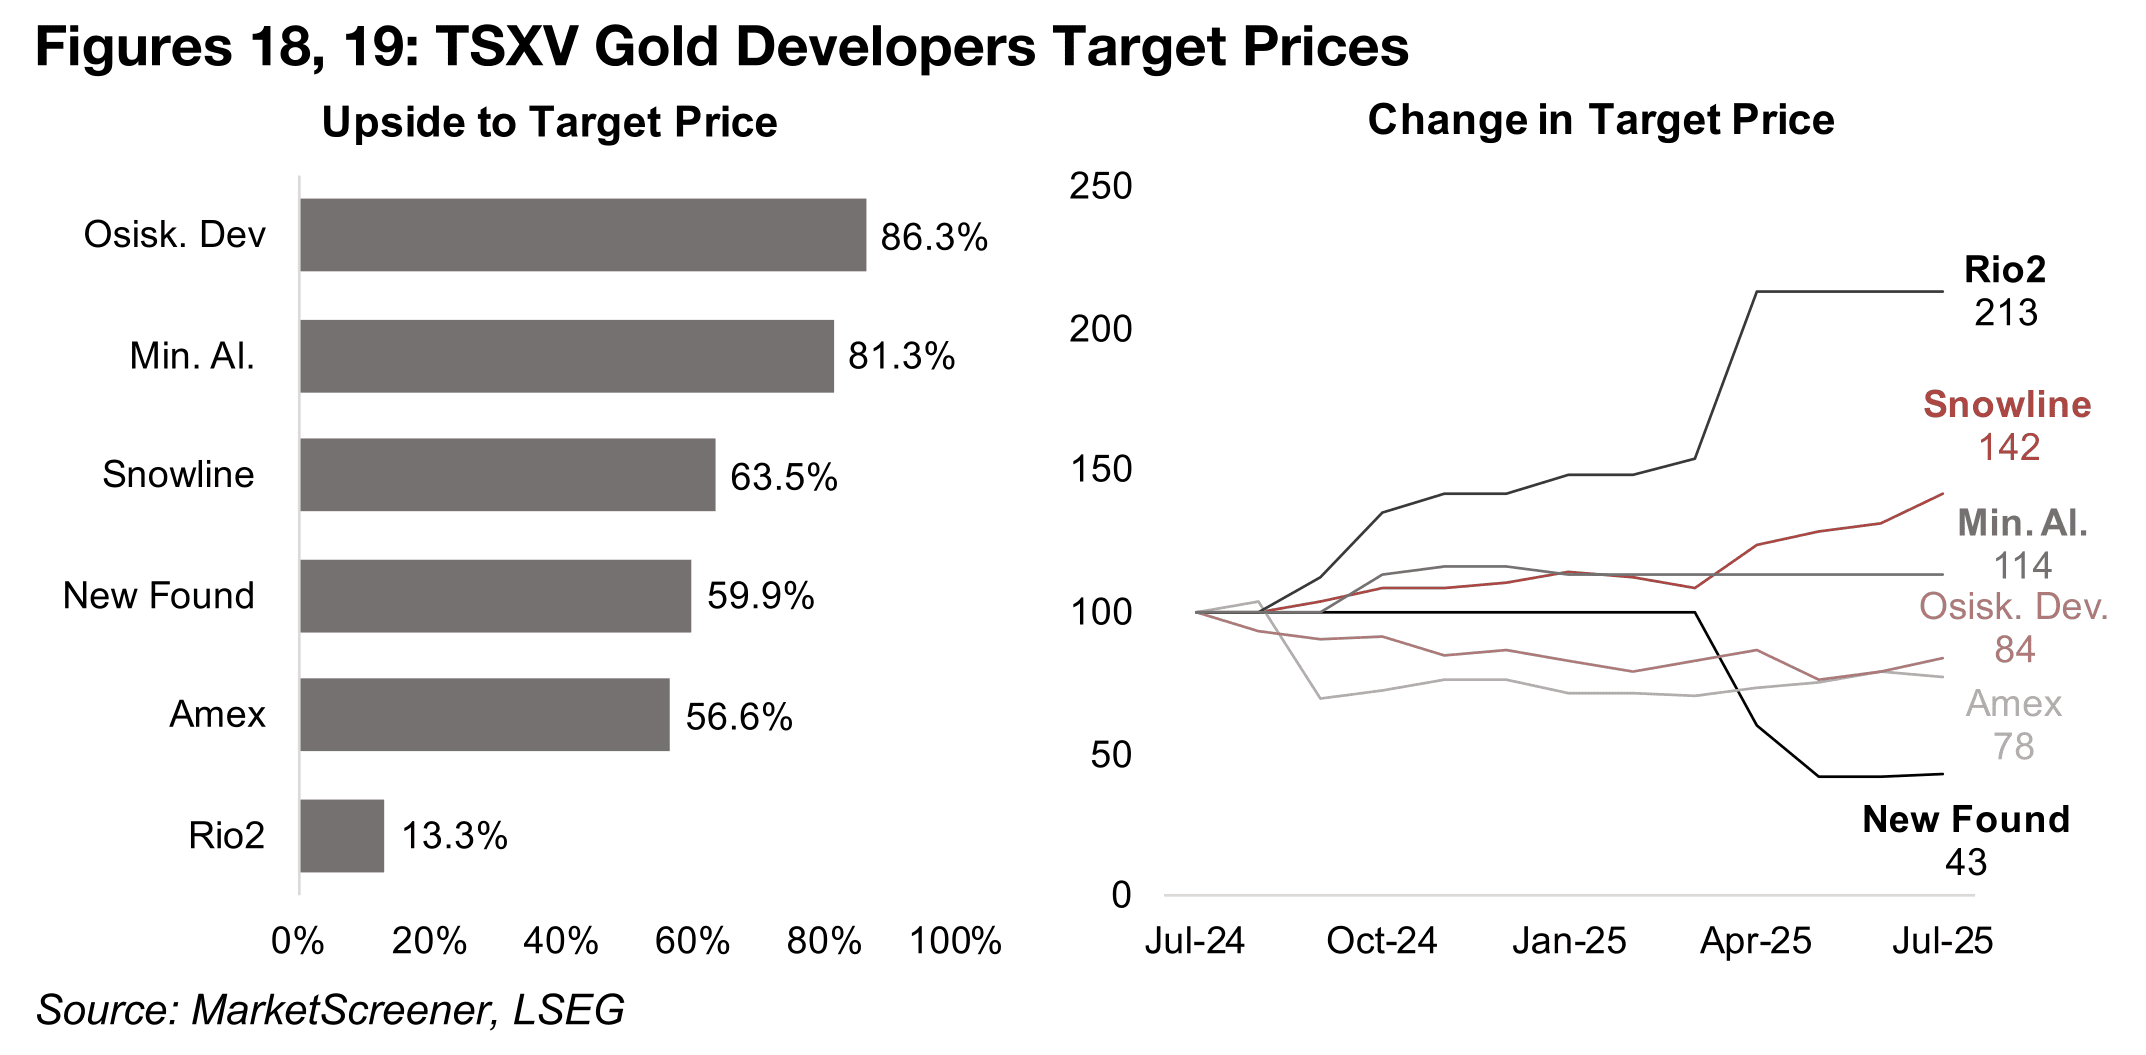
New Found Gold’s total resources, including those beyond that covered by the PEA, are 2.0 mn, towards the low end of the large TSXV gold developers (Figure 16). However, the market is paying a significant premium for New Found Gold on a market cap to resource valuation, with the company at CAD$276/oz Au. This is far head of Snowline, at CAD$174/oz Au and Minera Alamos at CAD$167/oz Au, with the other companies substantially below these levels (Figure 17). The market remains reasonably bullish on the stock based on the 59% upside to its target, with large gains also expected for most of the rest of group. The only stock with a relatively low upside of just 13% is Rio2 Limited, which is after a nearly 200% gain in its share price over the past year, and a doubling of its target price (Figures 18, 19). New Found Gold’s target price has been downgraded more than 50% over the past year.
Disclaimer: This report is for informational use only and should not be used an alternative to the financial and legal advice of a qualified professional in business planning and investment. We do not represent that forecasts in this report will lead to a specific outcome or result, and are not liable in the event of any business action taken in whole or in part as a result of the contents of this report.
Author
Ben McGregor authors the Weekly Roundup at CanadianMiningReport.com, providing sharp analysis of the metals and mining sector. With a talent for spotting trends, Ben distills complex market shifts into clear, engaging insights on TSXV junior miners. His weekly updates cover gold, copper, uranium, and more, blending data-driven perspectives with a knack for identifying opportunities. A vital resource for investors, Ben’s work navigates the dynamic junior mining landscape with precision.