
February 20, 2023
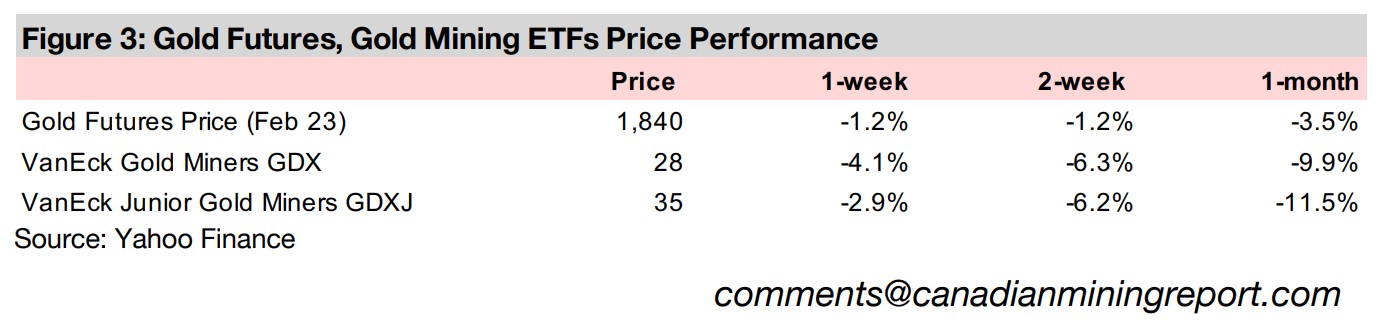
Gold declined -1.2% this week to US$1,840/oz, its lowest level in a month-long downtrend with a flat US CPI inflation print continuing to see the market reconsidering its assumption from last month that global monetary policy might soon be easing.
This we look at gold statistics reported by the World Gold Council which show gold demand in 2022 surging well ahead of supply and consider other major drivers for gold including its relationship to the global money supply and risk indices.
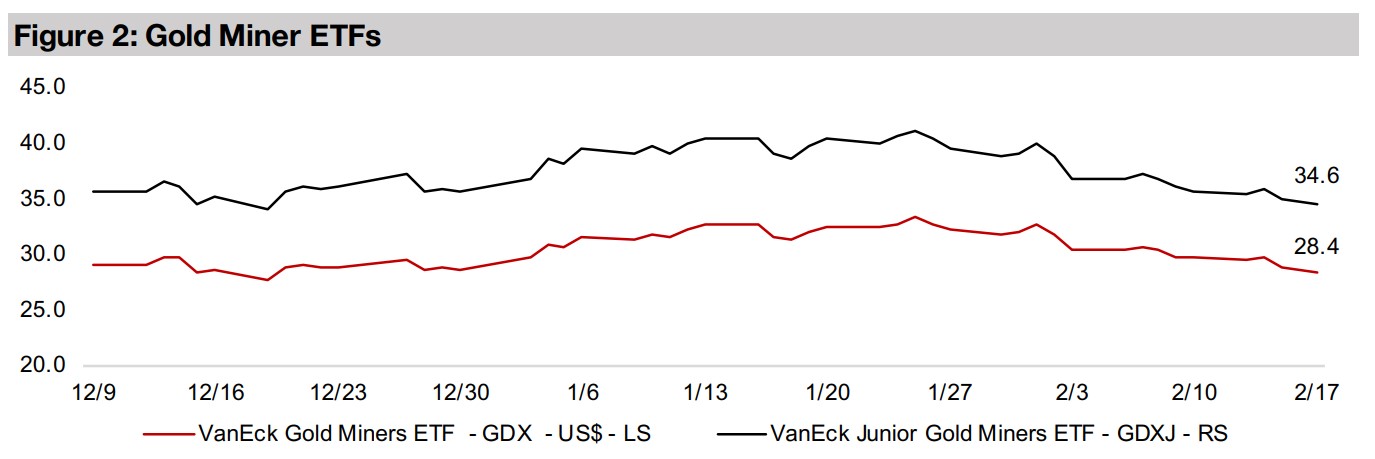
The producing and junior gold miners declined for a third week, with the GDX dropping -4.1%, GDXJ falling -2.9% and the TSXV gold juniors quite flat as gold continued to slide and equity markets range traded with apparently no solid direction.


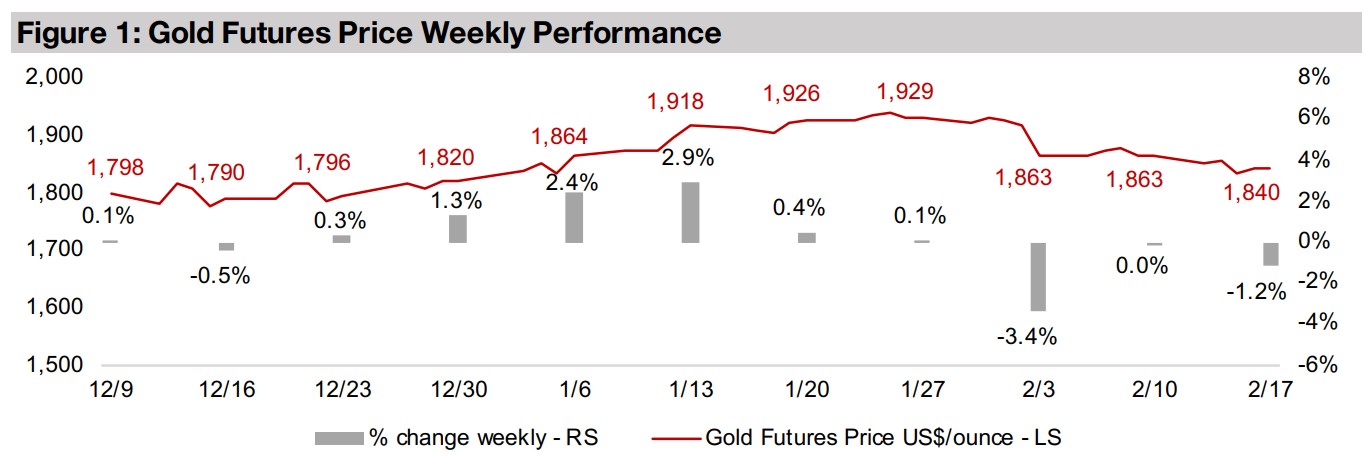
Gold eased -1.2% to US$1,840/oz, continuing to trend down to its lowest level in a
month, with highs of over U$1,900/oz having been reached in late January 2023. The
market has apparently been reconsidering the assumption that seems to have held
through last month that global monetary policy would soon be easing. Adding to the
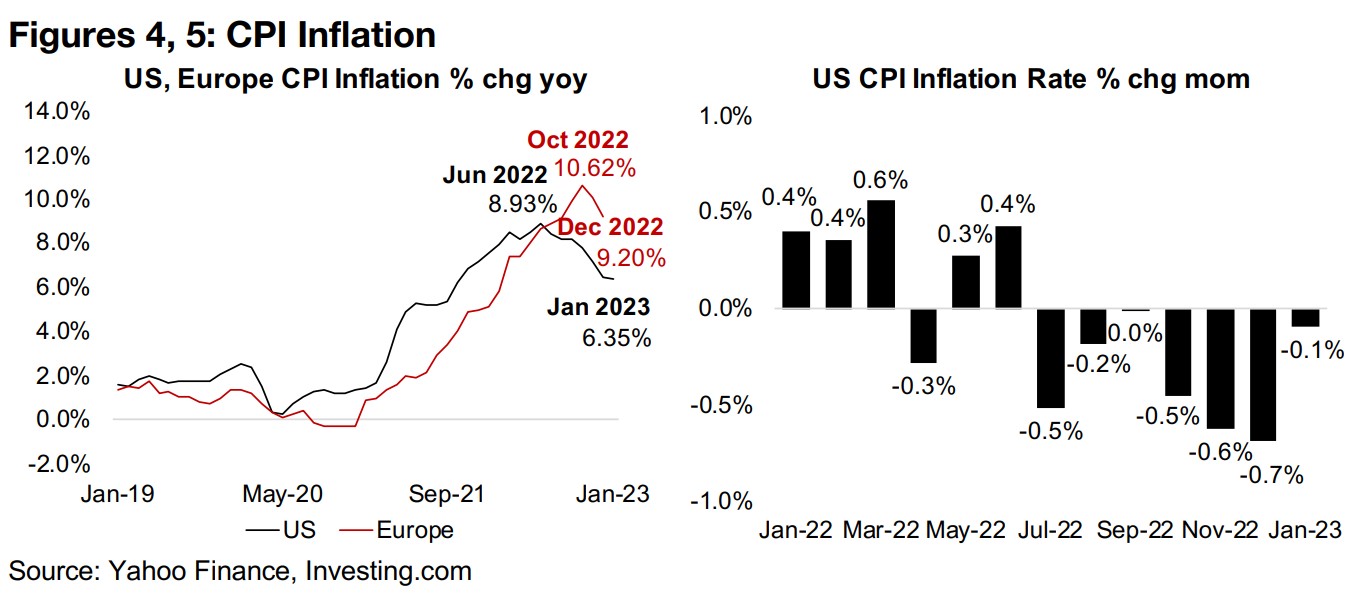
market's uncertainty this week was January 2023 US CPI inflation data, which put a
hold on a very strong trend of declines in the previous three months. US CPI inflation
was 6.35% for January 2023, down from a peak of 8.93% in June 2022, with the data
having been revised, extending back several years (Figure 4). Based on the previous
data, the US inflation rate had peaked at 9.00% in June 2022, with the revisions not
severe and the overall trend in the data still the same.
The market had previously been encouraged by some quite impressive inflation
declines month on month in October, November and December 2022, with the CPI
falling -0.5%, -0.6% and -0.7%, respectively (Figure 5). However, this trend was at
least put on pause in January 2023, which lead to both a slide in gold and
directionless equity markets, as a big driver of the past three months did not deliver.
The question now becomes whether the big reductions in the inflation rate are already
behind us, and there is a much more gradual downtrend, or even a flattening, for the
next few months. While the January 2023 CPI inflation data was inline with estimates
and not a shock, we suspect that without this trend to propel the 'Fed-will-soon-become-more-dovish' story, that the markets might start to get a bit nervous.
Inflation still remains quite high globally, with European inflation having declined to
just 9.2% of the most recently reported December data from its 10.6% at its peak in
October 2022, even though rate hikes in this region were severe over 2022. With rate
hikes in Europe continuing in recent months, it suggests that the a broader dovish
global monetary policy is still a long way off, and unlikely through H1/23.
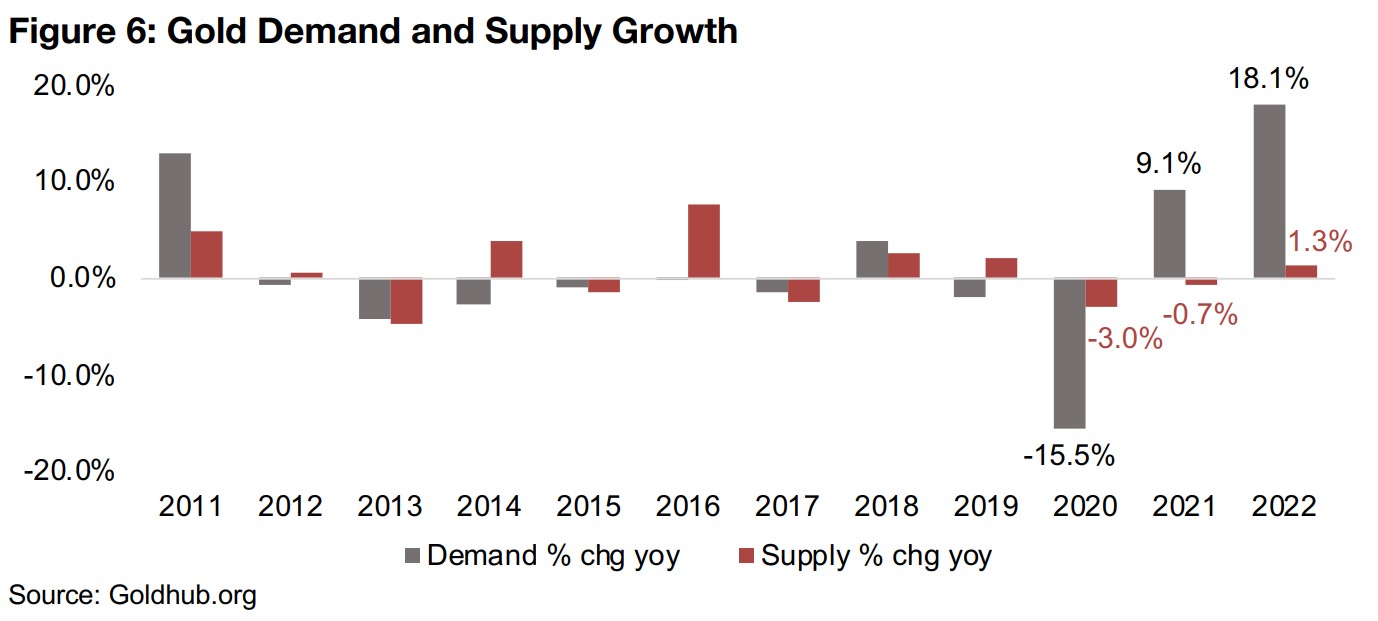
This week we look at data from the World Gold Council showing that underlying gold demand, up 18.1%, strongly outpaced supply in 2022, which rose just 1.3% (Figure 6). This continues a trend that started in 2021, with gold demand rising 9.1% while supply declined -0.7%, as the global health crisis curbed mine production, following the -15.5% collapse in demand in 2020 caused by peak fears during the early stage of the crisis, with supply down -3.0%. Prior to these swings driven by severe exogenous events, gold demand and supply growth had been much less volatile and more inline with each other from 2012 to 2019, with 2011 the last time a big swing and gap in the numbers occurred as the global economy was still recovering from the effects of the global financial crisis from 2008-2009.
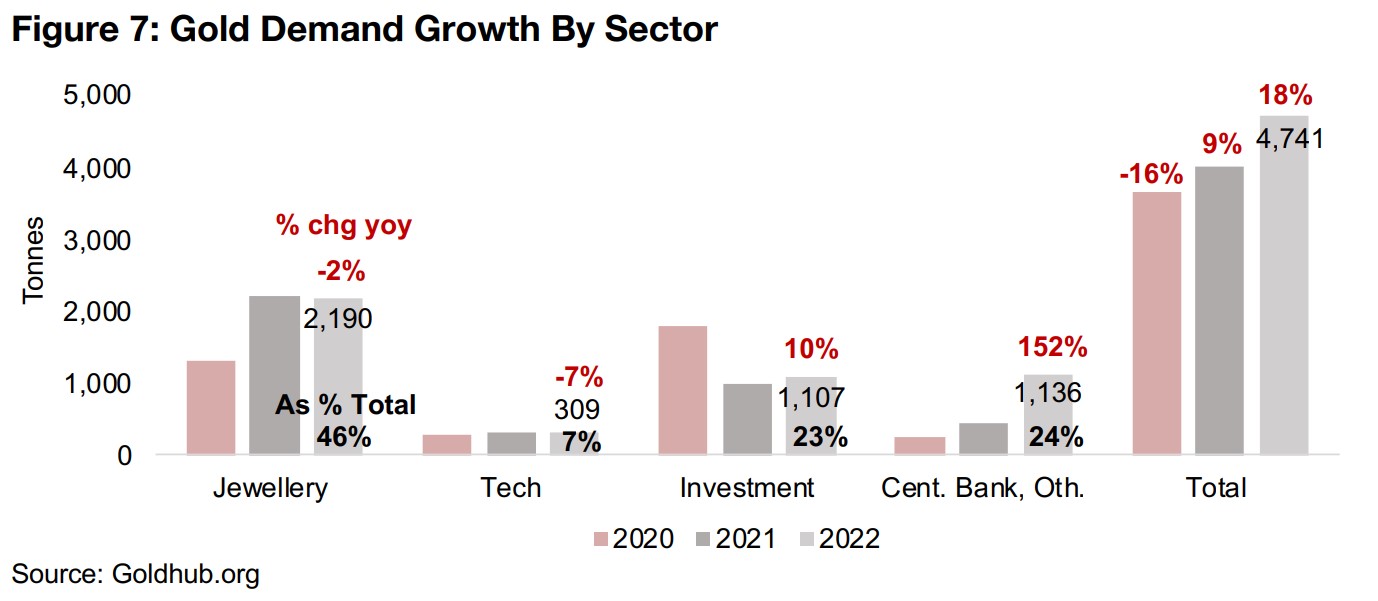
The biggest shift in demand has come from central banks, which comprised a
substantial 24% of the total in 2022, well up from the past two years, and rose 152%
to 1,136 tonnes (Figure 7). The demand change for the largest component, jewellery,
at 46% of the total, was small, declining -2% to 2,190 tonnes, while investment
demand, the third largest component, just behind central banks at 23% of the total,
rose 10%. Technology, the smallest contributor to gold demand, at 7% of the total,
fell -7% to 309 tonnes. Overall this lead to an 18% gain rise in gold demand, up from
9% in 2021 and rebounding strongly compared to a -16% decline in 2020.
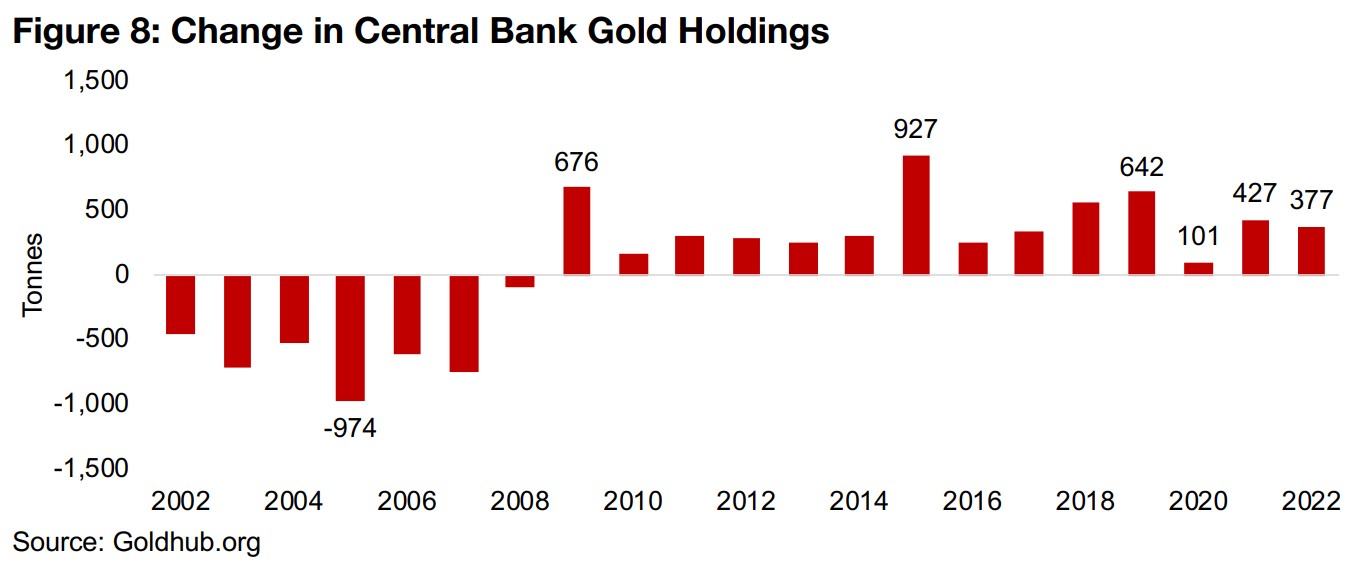
Global central banks have been on a gold buying spree over the past five years, only
briefly interrupted by the global health crisis in 2020, and have overall had been net
gold purchasers since the global financial crisis in 2008 (Figure 8). Central banks
added a net 377 tonnes to their holdings in 2022, and while down from 427 tonnes in
2021 and 642 tonnes in 2019, was still the fifth highest increase in twenty years.
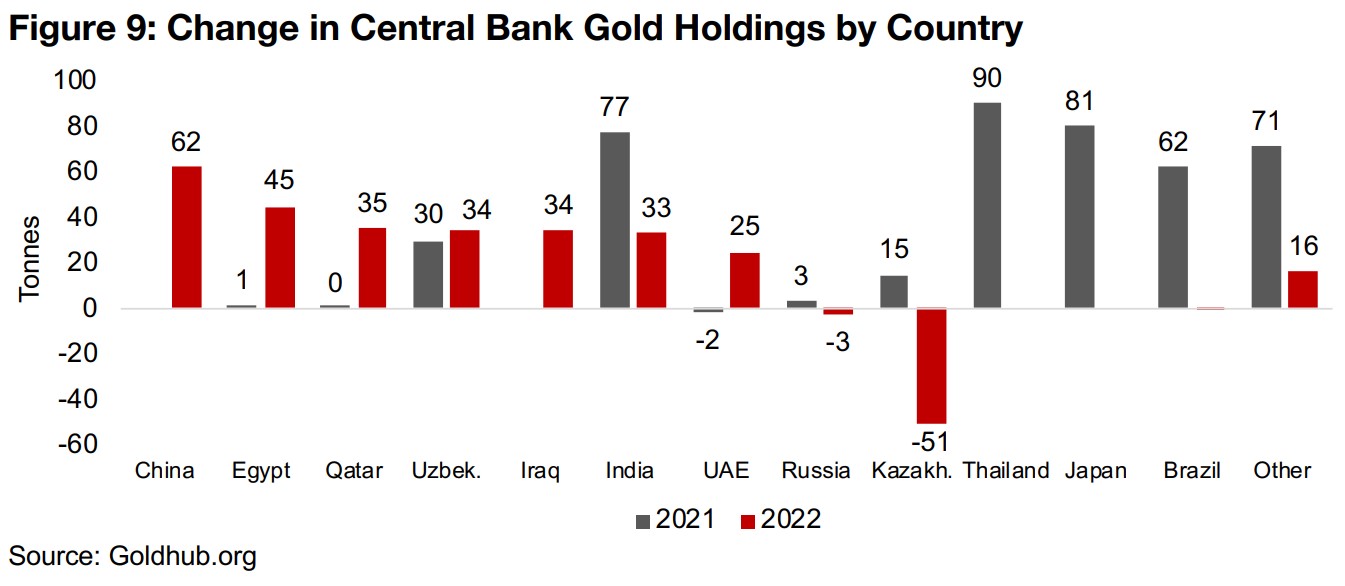
While the individual countries driving the rise in central bank gold buying have differed
considerably between 2022 and 2021, the regional trend is clear, with the purchases
coming especially from Asia and the Middle East, with Brazil the main outlier in 2021
(Figure 9). This overall move towards gold especially since 2008 may indicate that
where many countries' central banks were content to hold large amounts of US bonds
especially in the decades prior to 2008, that over the past fifteen years, they have
been shifting towards using gold as a more key component in their reserves.
With geopolitical and economic risks rising, and likely to continue to do so in the
coming years, we expect that this trend of central banks adding more gold to their
reserves could be sustained. This could support the gold price, especially if these
countries are adding the metal where they previously would have held US bonds,
which could also pressure the dollar, further boosting the gold price in US$ terms.
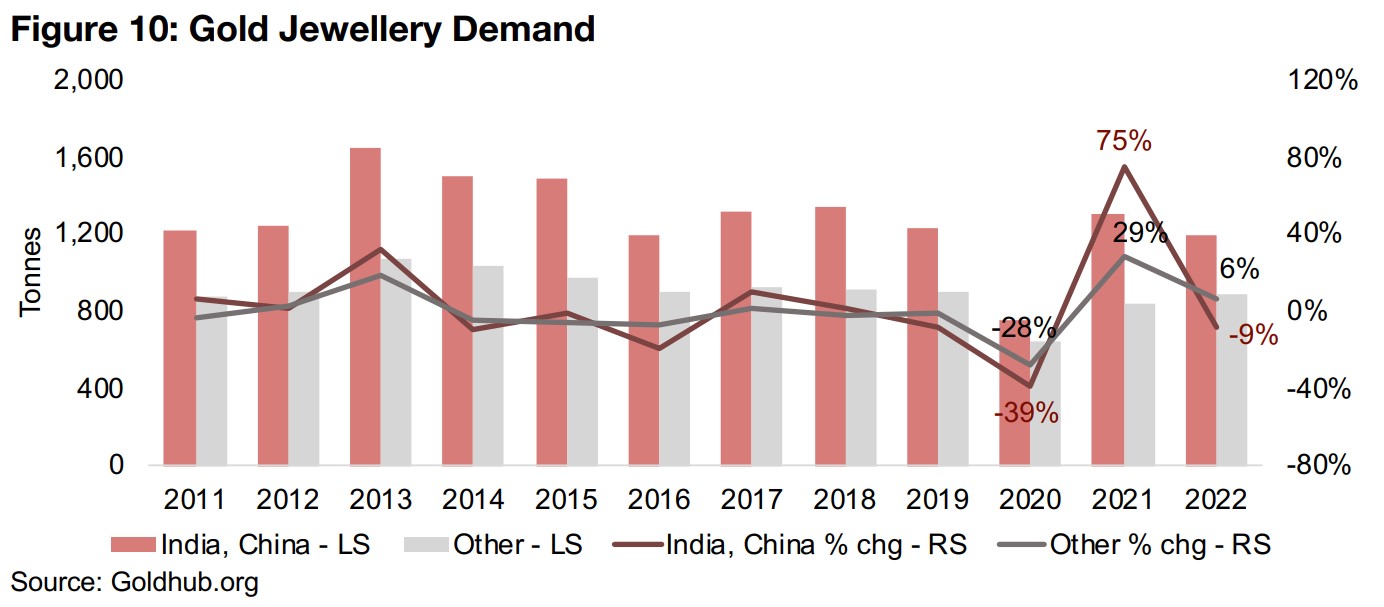
There has been a large round trip in gold jewellery demand over the past four years, with it collapsing in 2020 on the global health crisis, surging in 2021, and back to just a couple of percent below 2019 levels in 2022 (Figure 10). China and India are the major sources of global gold jewellery demand, comprising 57% of the total in 2022, with a -39% collapse in demand from these two regions combined in 2020 followed by a 75% surge in 2021 and then a 9% decline in 2022. While the decline in demand from these two regions last year was likely partly because purchases had been frontloaded in an extremely strong 2021, it is unclear whether demand growth will settle down in 2023. We see a wide range of outcomes as possible for this year, ranging from an economic downturn seeing a pullback in purchases to rising global political and monetary uncertainty driving an increase in purchases as households look to gold as a store of value.
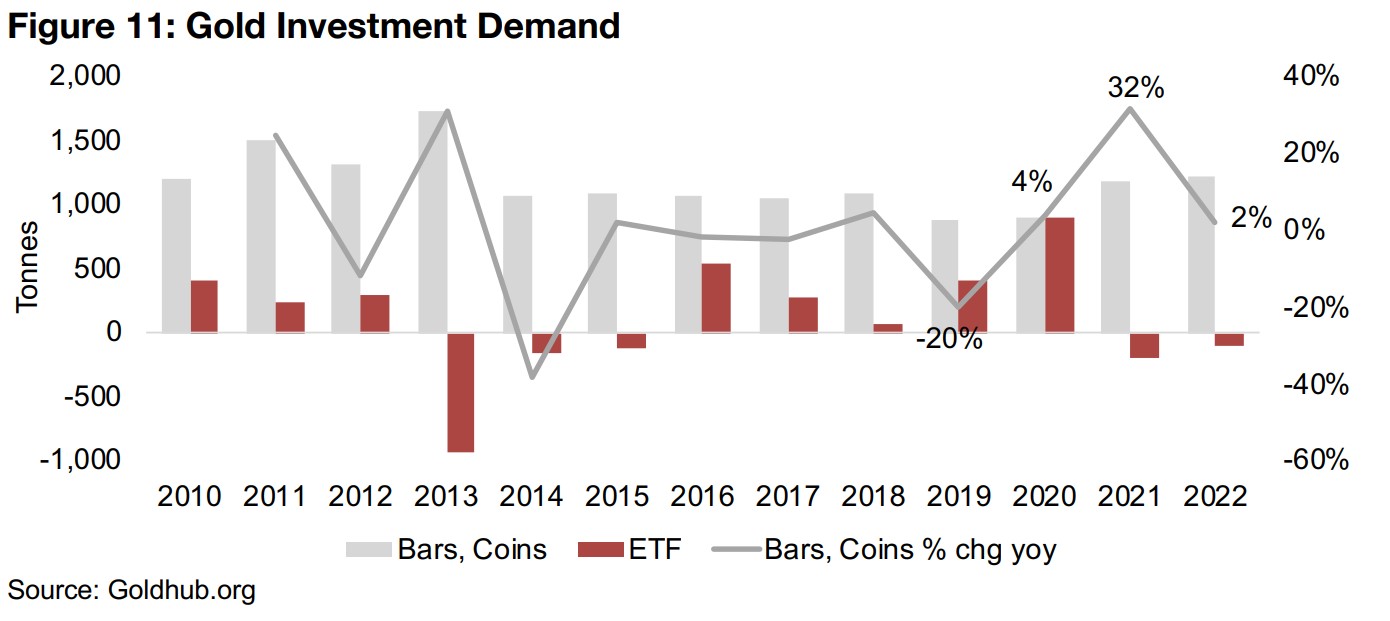
The most consistent component of investment demand for gold is from bars and coins, which rose 32% in 2021 and 2% in 2020 (Figure 11). However, ETF flows add major volatility to this segment, and after a very strong 2020 as the gold price surged, rising to 892 tonnes, they collapsed to a -189 tonnes outflow in 2021, dragging down overall investment demand -44%. While ETF outflows continued in 2022, they were not as severe, at just -110 tonnes, resulting in an overall rise in investment demand of 10%. For 2023, we expect that ETF could actually shift to an inflow, while bar and coin demand could also increase as economic and political risks rise.
Overall we expect that gold demand could considerably outpace supply in 2023, with consensus estimates looking for mine supply to grow at a moderate 2.5%. However, we estimate that demand could rise over 13% on the following assumptions; 1) central banks increase their purchases of gold by 25%, 2) investment demand rises 27% on a 2% gain in bar and coin demand but a shift to ETFs inflow of 166 tonnes, 2) jewellery demand grows only a moderate 3% and technology demand drops -5% to account for a potential economic slowdown.
While these underlying demand and supply factors by sector can certainly affect the gold price to some degree and are interesting to consider, they remain overshadowed by other more critical factors. These include especially gold's role as a monetary substitute, with it considered a major global currency and remaining a critical component of global central banks' reserves. We can see this in 2020, where the underlying gold demand collapsed, but the gold price actually surged, mainly because of the huge global monetary expansion in response the global health crisis.
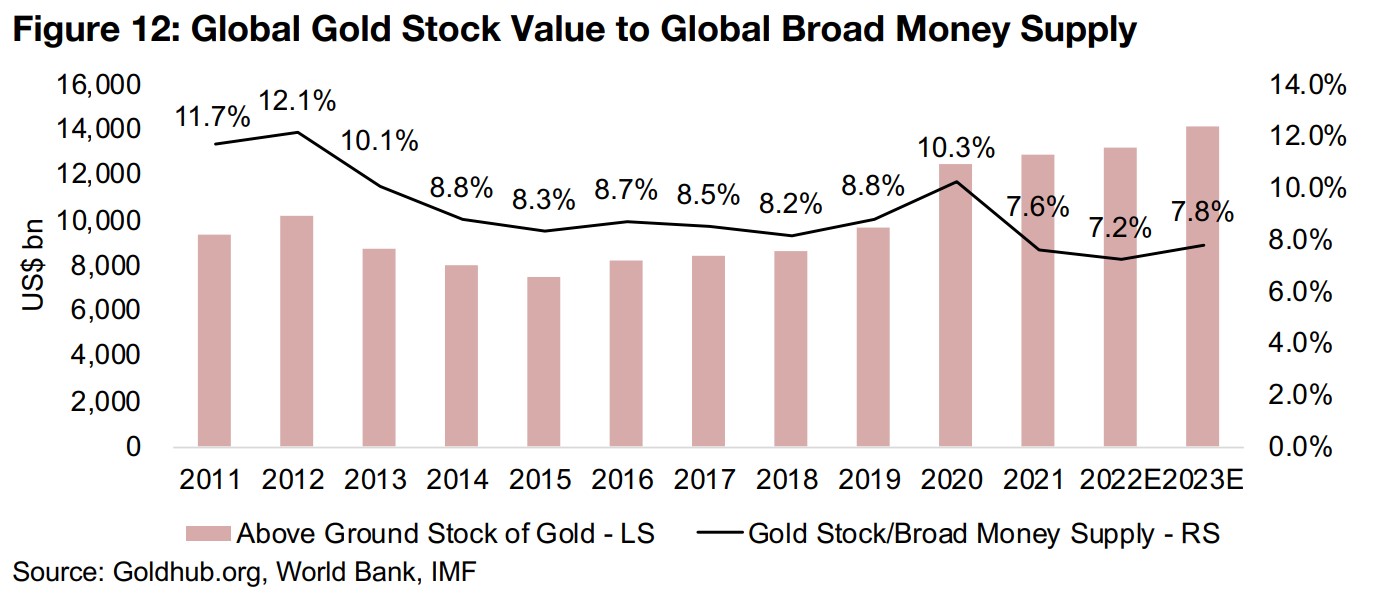
This indicates that comparing gold to monetary aggregates is likely a much stronger indicator of potential direction of its price than the underlying demand factors we have outlined at length above. If gold is indeed a critical global currency, one measure we can consider is the value of the global gold stock versus the value of the broad global money supply (Figure 12). This ratio rose has ranged over the past decade from a peak of 12.1% in 2012 to 7.2% in 2022, with a downtrend from 2021 to 2015 and then a rise from 2016 through to 2020. The 2022 level for the value of gold versus the global money supply looks low at 7.2%, and while based on IMF forecasts, it could rise to 7.8% in 2023E, it would still look low versus its recent history, suggesting that the gold stock is somewhat undervalued versus the global money supply, which could point to a potential rise in gold.
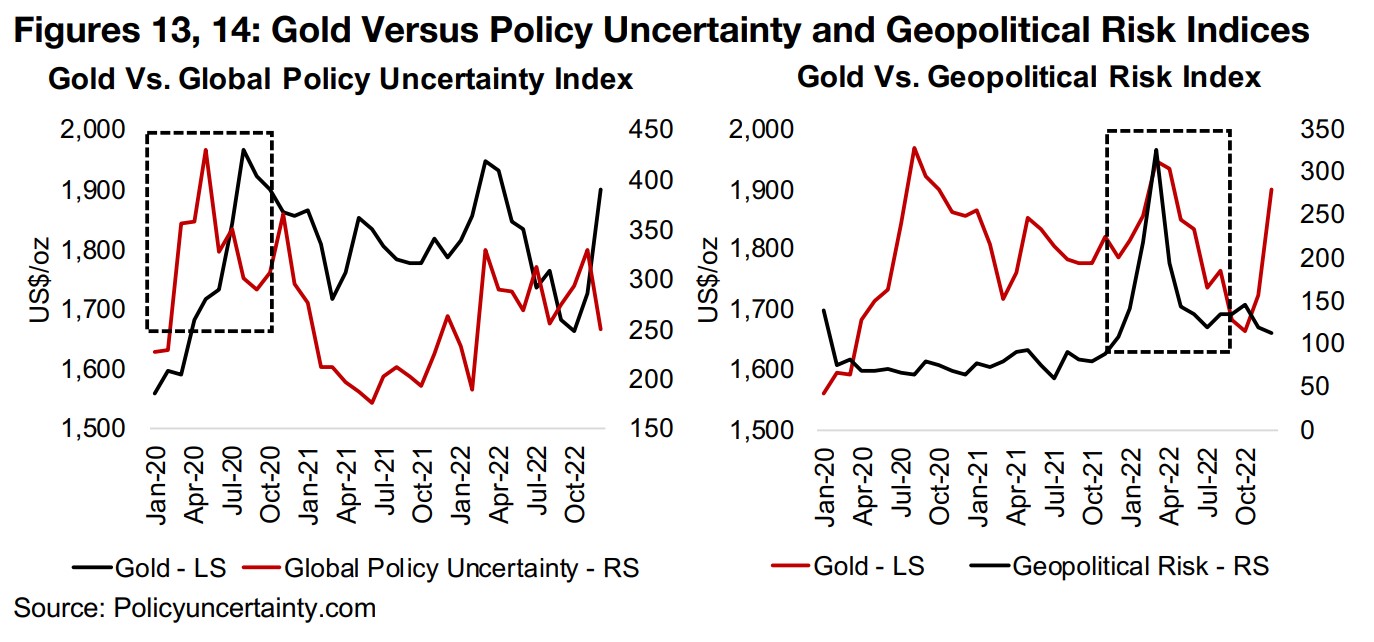
Beyond this broad monetary measure, there is also gold's role as hedge against economic and geopolitical risk, seen clearly in action over the past three years. In early to mid 2020 during the peak fear over the global health crisis, the gold price surged along with the Global Policy Uncertainty Risk Index (Figure 13). Then in early 2022, gold again jumped along with the Geopolitical Risk Index as Russia invaded Ukraine (Figure 14). We expect that the chances of for further jumps in these two indices, and therefore of gold in response, is likely to rise throughout 2023, and could also offer support to the gold price, even if only short-term if the risks prove not to hold over an extended period, as we saw in the first halves of both 2020 and 2022.
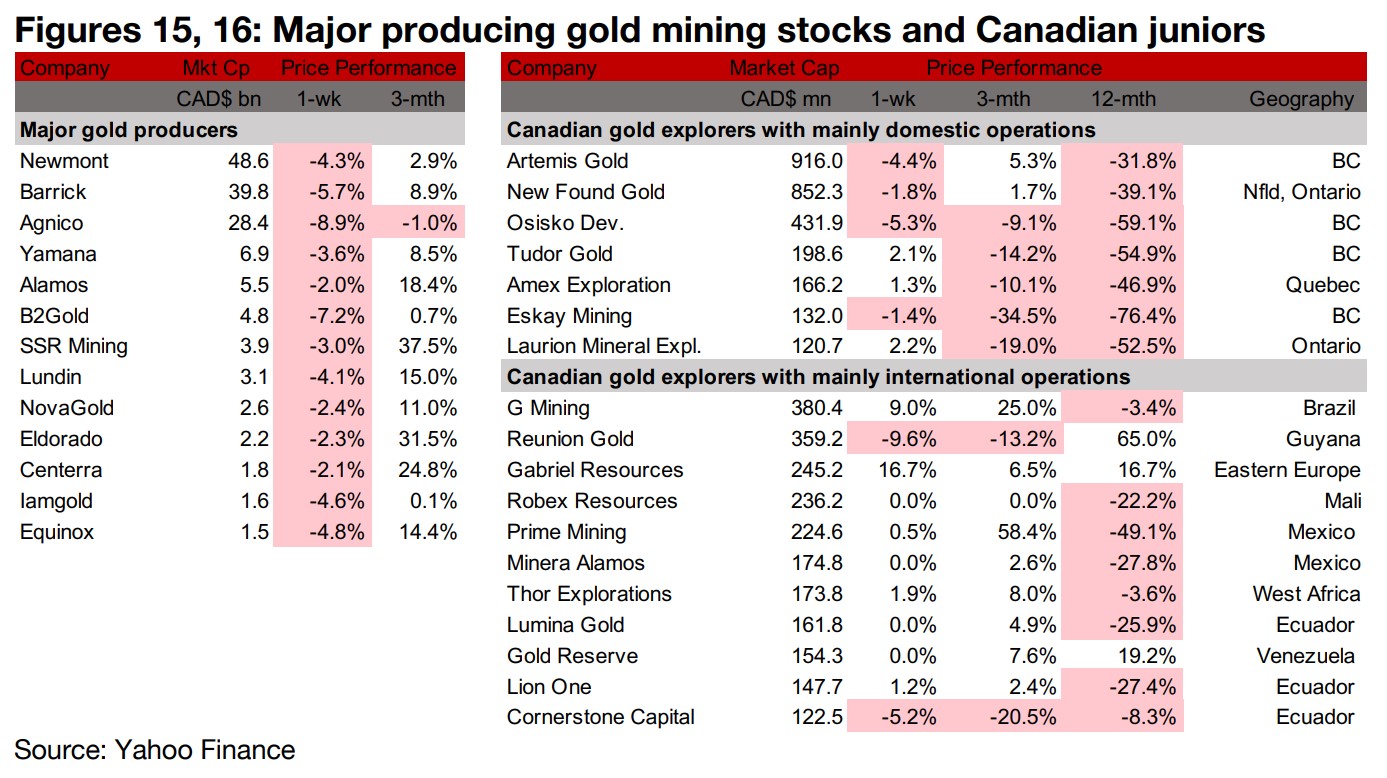
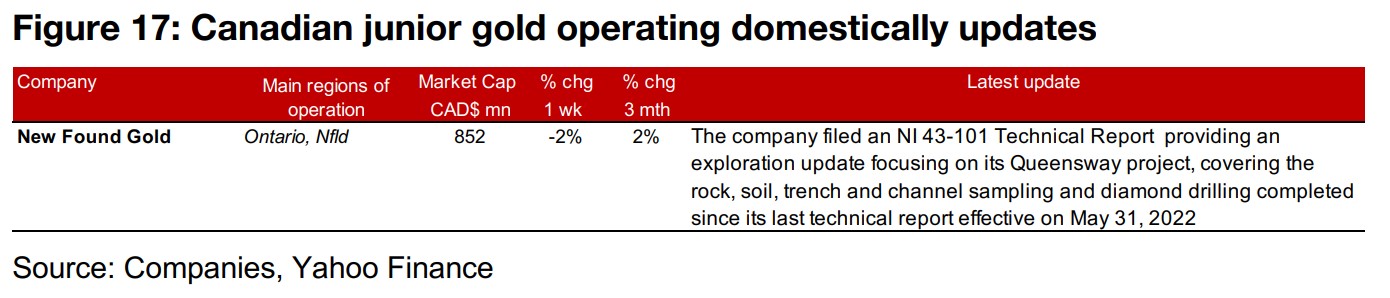
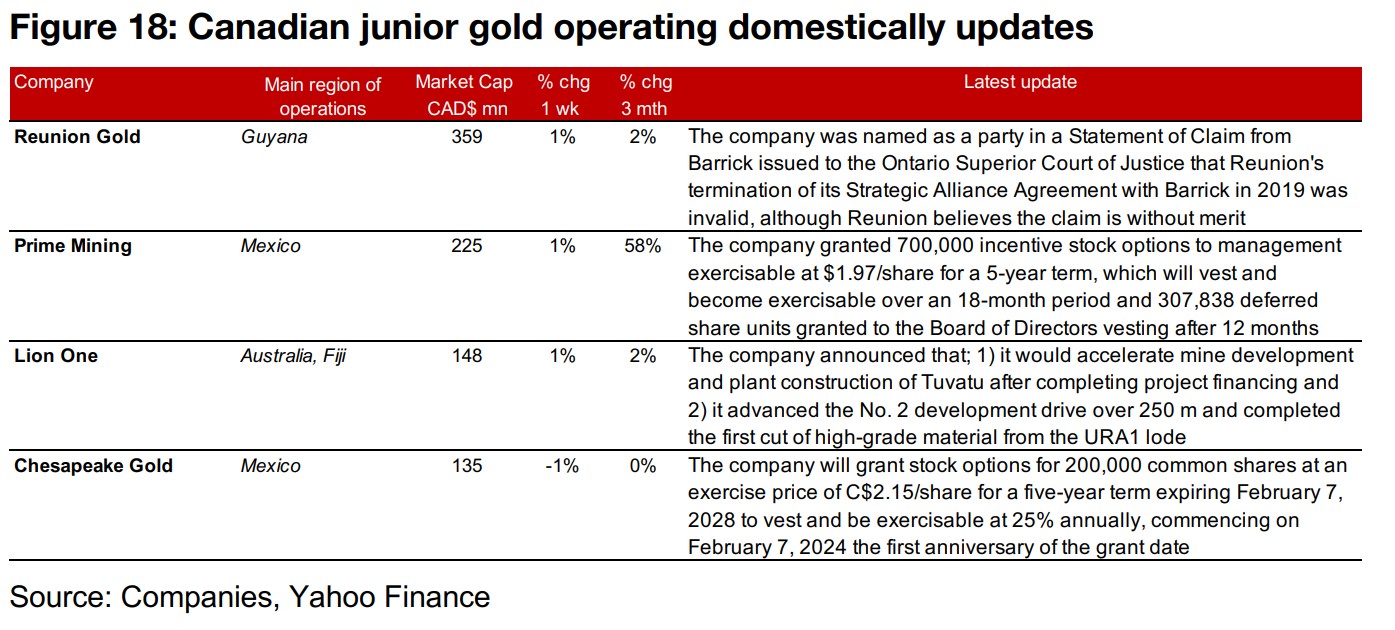
The producing gold miners all declined and many TSXV junior gold miners were flat as the gold price declined and equity markets ranged traded (Figures 15, 16). For the Canadian juniors operating mainly domestically, New Found Gold filed an NI 43-101 Report focusing on exploration at Queensway (Figure 17). For the Canadian juniors operating mainly internationally, Reunion was named as a party in a Statement of Claim from Barrick, Prime Mining granted stock options to management and deferred share units to management to its board, Lion One provided an operations update on Tuvatu and Chesapeake granted stock options (Figure 18).
Disclaimer: This report is for informational use only and should not be used an alternative to the financial and legal advice of a qualified professional in business planning and investment. We do not represent that forecasts in this report will lead to a specific outcome or result, and are not liable in the event of any business action taken in whole or in part as a result of the contents of this report.
Author
Ben McGregor authors the Weekly Roundup at CanadianMiningReport.com, providing sharp analysis of the metals and mining sector. With a talent for spotting trends, Ben distills complex market shifts into clear, engaging insights on TSXV junior miners. His weekly updates cover gold, copper, uranium, and more, blending data-driven perspectives with a knack for identifying opportunities. A vital resource for investors, Ben’s work navigates the dynamic junior mining landscape with precision.