

August 31, 2026
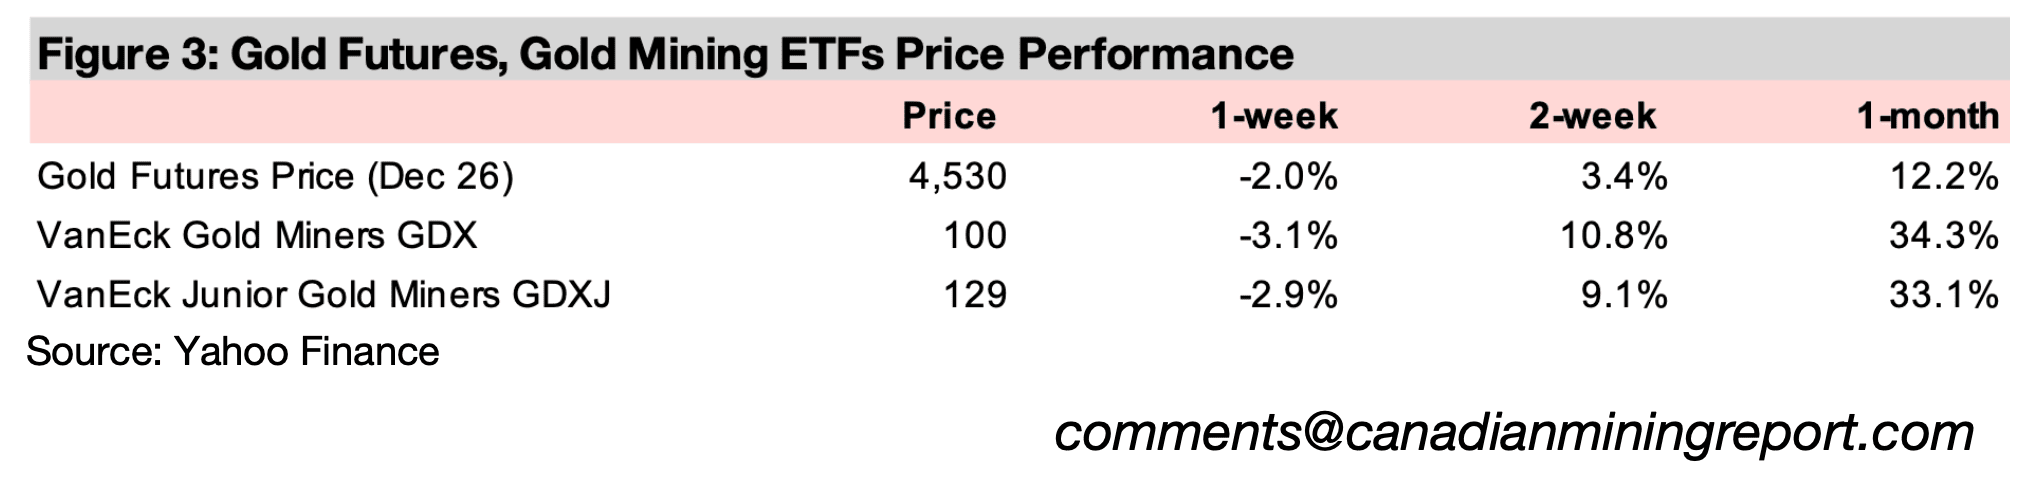
The gold price declined -2.0% to US$4,530/oz after its huge run of the past month where it added US$500/oz, which appears to have been mainly driven by hawkish comments from the US Fed’s new Chair at the Jackson Hole central bankers meeting.
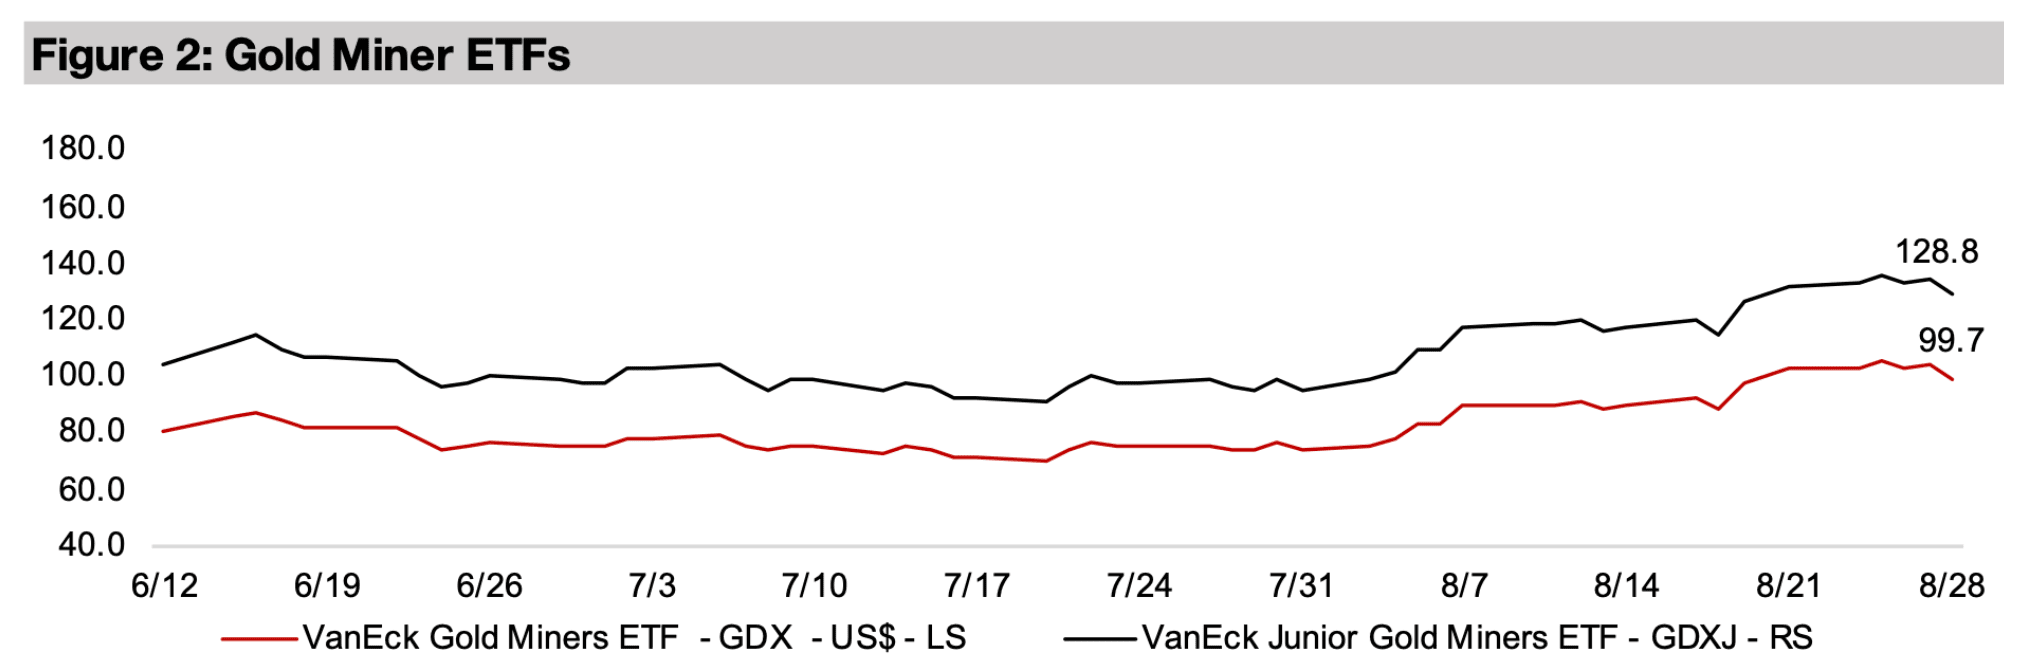
The gold stocks declined, with the GDX down -3.1% and the GDXJ of -2.9%, although they are still up a huge 34% and 35% for August 2026, while the S&P 500 and Nasdaq rose 0.6% and 1.3% as strong Nvidia results offset the hawkish Fed.


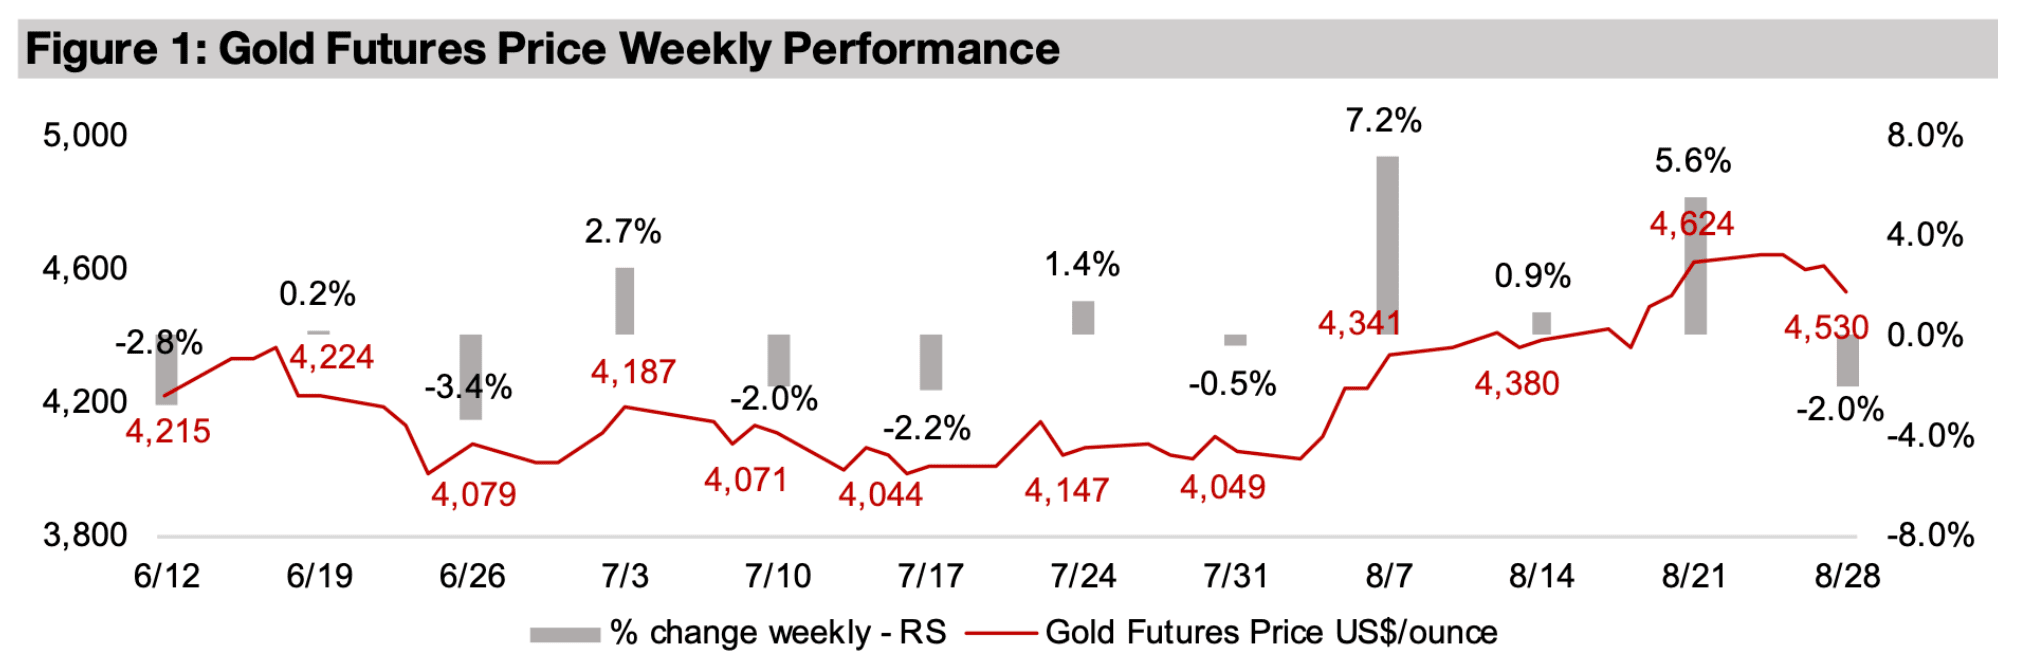
The gold price declined -2.0% to US$4,530/oz, pulling back moderately from a huge
run over the past month where it has added US$500/oz, and briefly went above the
US$4,600/oz level. The drop seems to have been driven by the US Fed Chairman
Warsh’s comments towards the end of the week-long Jackson Hole annual meeting
of global central bankers, which the market took as relatively hawkish. This was
considered the initial major look at the policy stance of this new Chair since being
appointed in May 2022, with this his first time at the meeting as head of the central
bank. The Fed Chairman’s speech and the overall outlook from Jackson Hole are
considered key in setting the tone for US and global monetary policy and can have
therefore have substantial implications for the economy.
The Fed Chairman noted that the central bank’s “price stability objective of 2.0% was
a firm, fixed target,” suggesting that he would not necessarily be as flexible in letting
it continue to run above this level, as was the case for the past few years. Warsh also
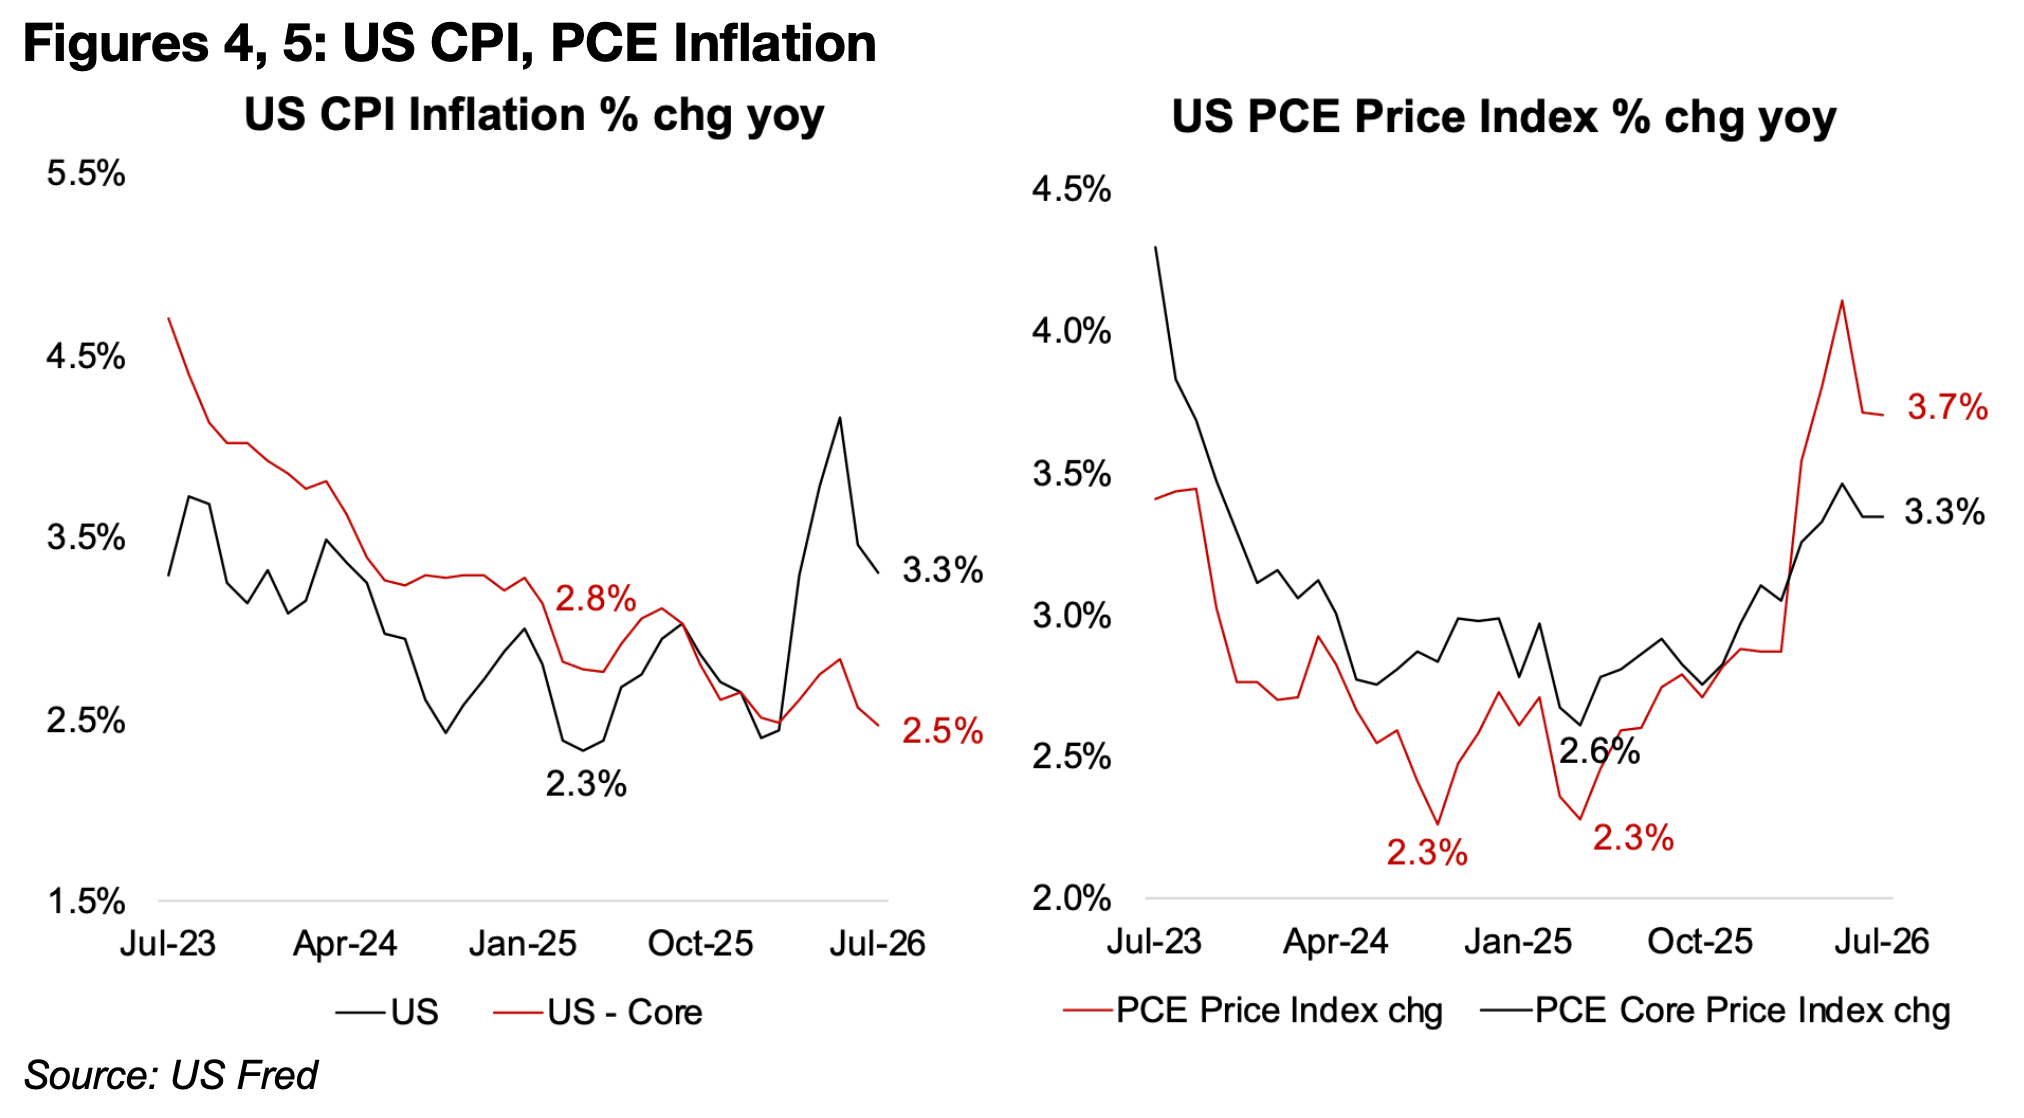
noted that “the Fed’s preferred measure of inflation, the 12-month change in the PCE
Price Index, stands at 3.7%,” and that the CPI index, and core PCE and CPI showed
that “inflation is running above our 2.0% target”. The US CPI rose 3.3% yoy in July
2026, far ahead of the 2.0% target, and while this was boosted especially by volatile
fossil fuel prices, core CPI inflation, excluding food and energy costs, still remained
at 2.5% even after a pullback over the past two months (Figure 4). In addition to the
large rise in the headline US PCE Price Index in July 2026, the Core PCE Index was
also high at 3.3%, and neither of these figures had dropped below the Fed’s target
at their respective recent lows of 2.3% and 2.6% in 2024 and 2025 (Figure 5).
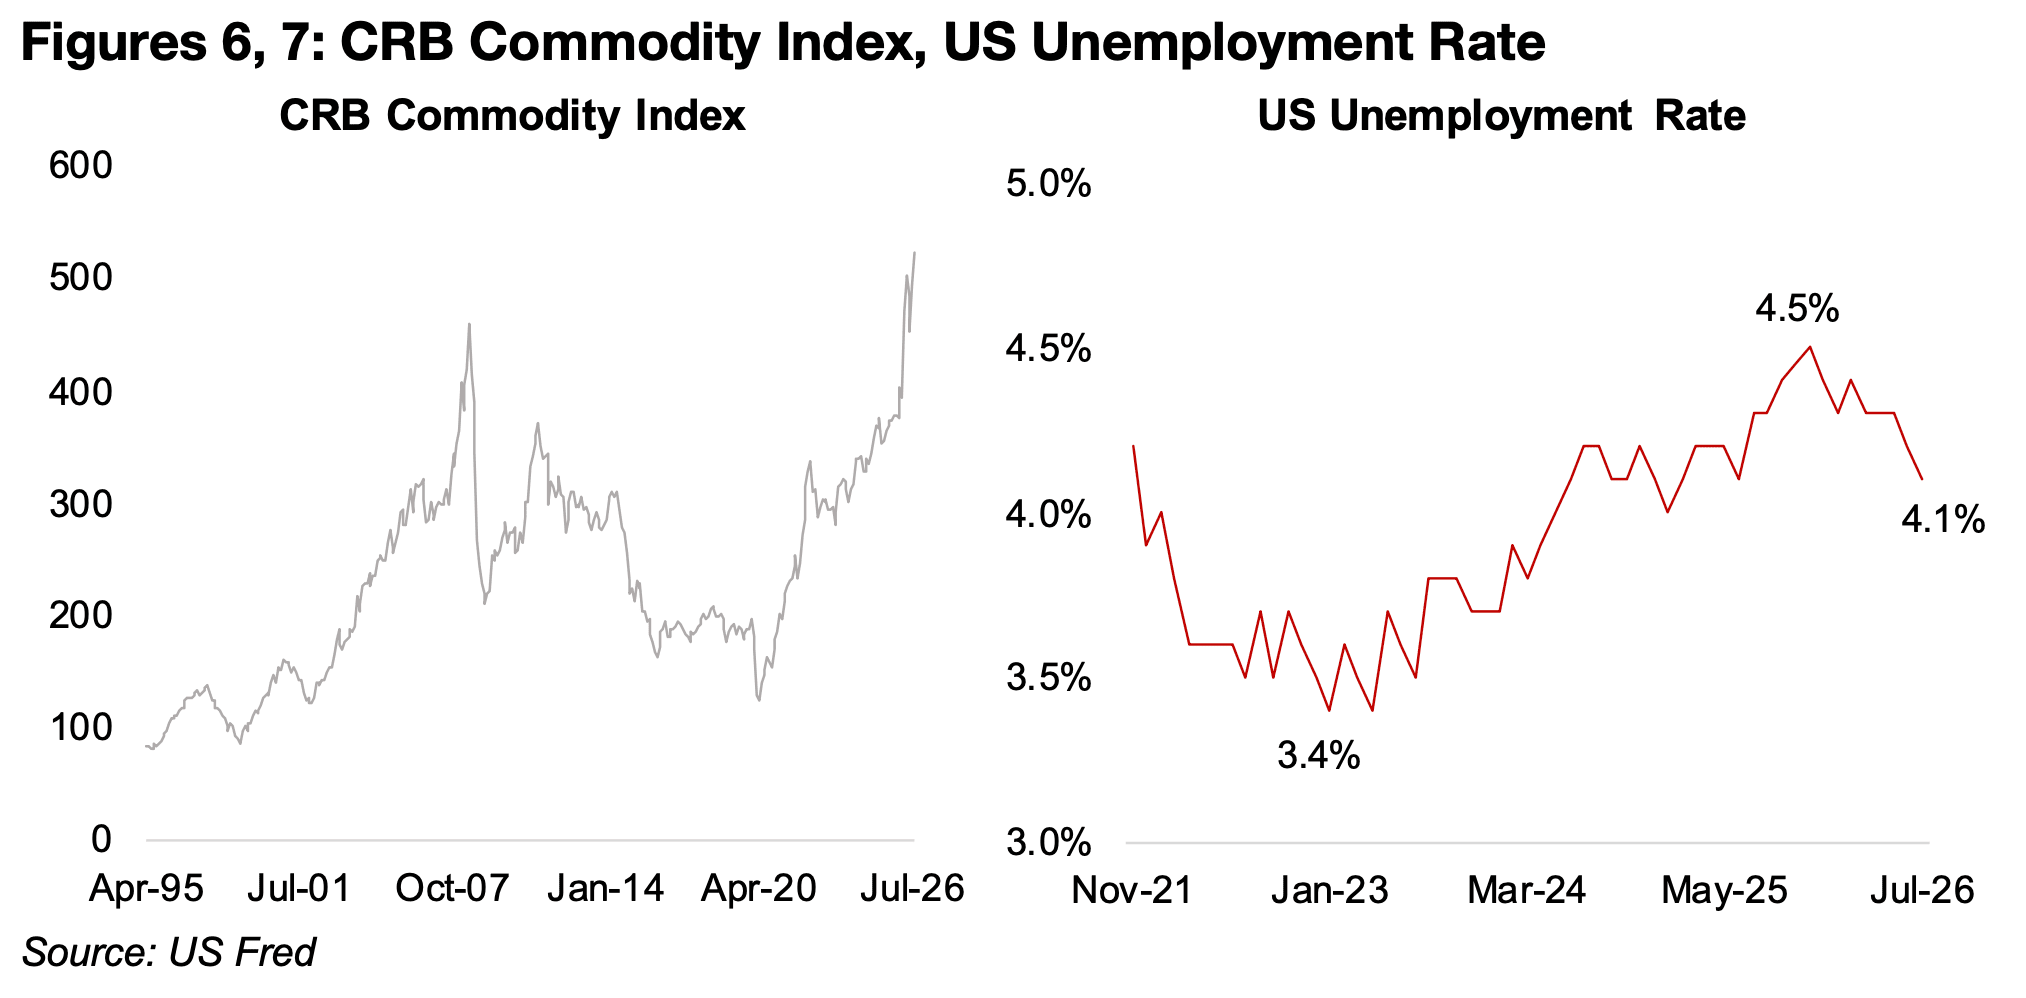
While noting that there was still only moderate wage growth, he suggested that the measure was not that reliable in indicating future inflation. The Chairman also pointed to continued potential inflationary pressures from strong commodities prices, with the CRB index for the sector spiking to 522, its highest level ever, recently surpassing the previous 459 peak in June 2008, on the surge in energy, metals and other commodities prices (Figure 6). In terms of US growth, Warsh noted that the economy ‘appears to have strengthened’ from an already strong outlook at the July 2026 meeting, with the Fed indicating that ‘labour markets were stable, and output was solid.’ Warsh also highlighted strong business capital expenditure, profit growth and high margins, low credit spreads, and strong credit and loan markets as all pointing to a robust economy.
The Fed Chairman also continued to view US employment as strong, given low
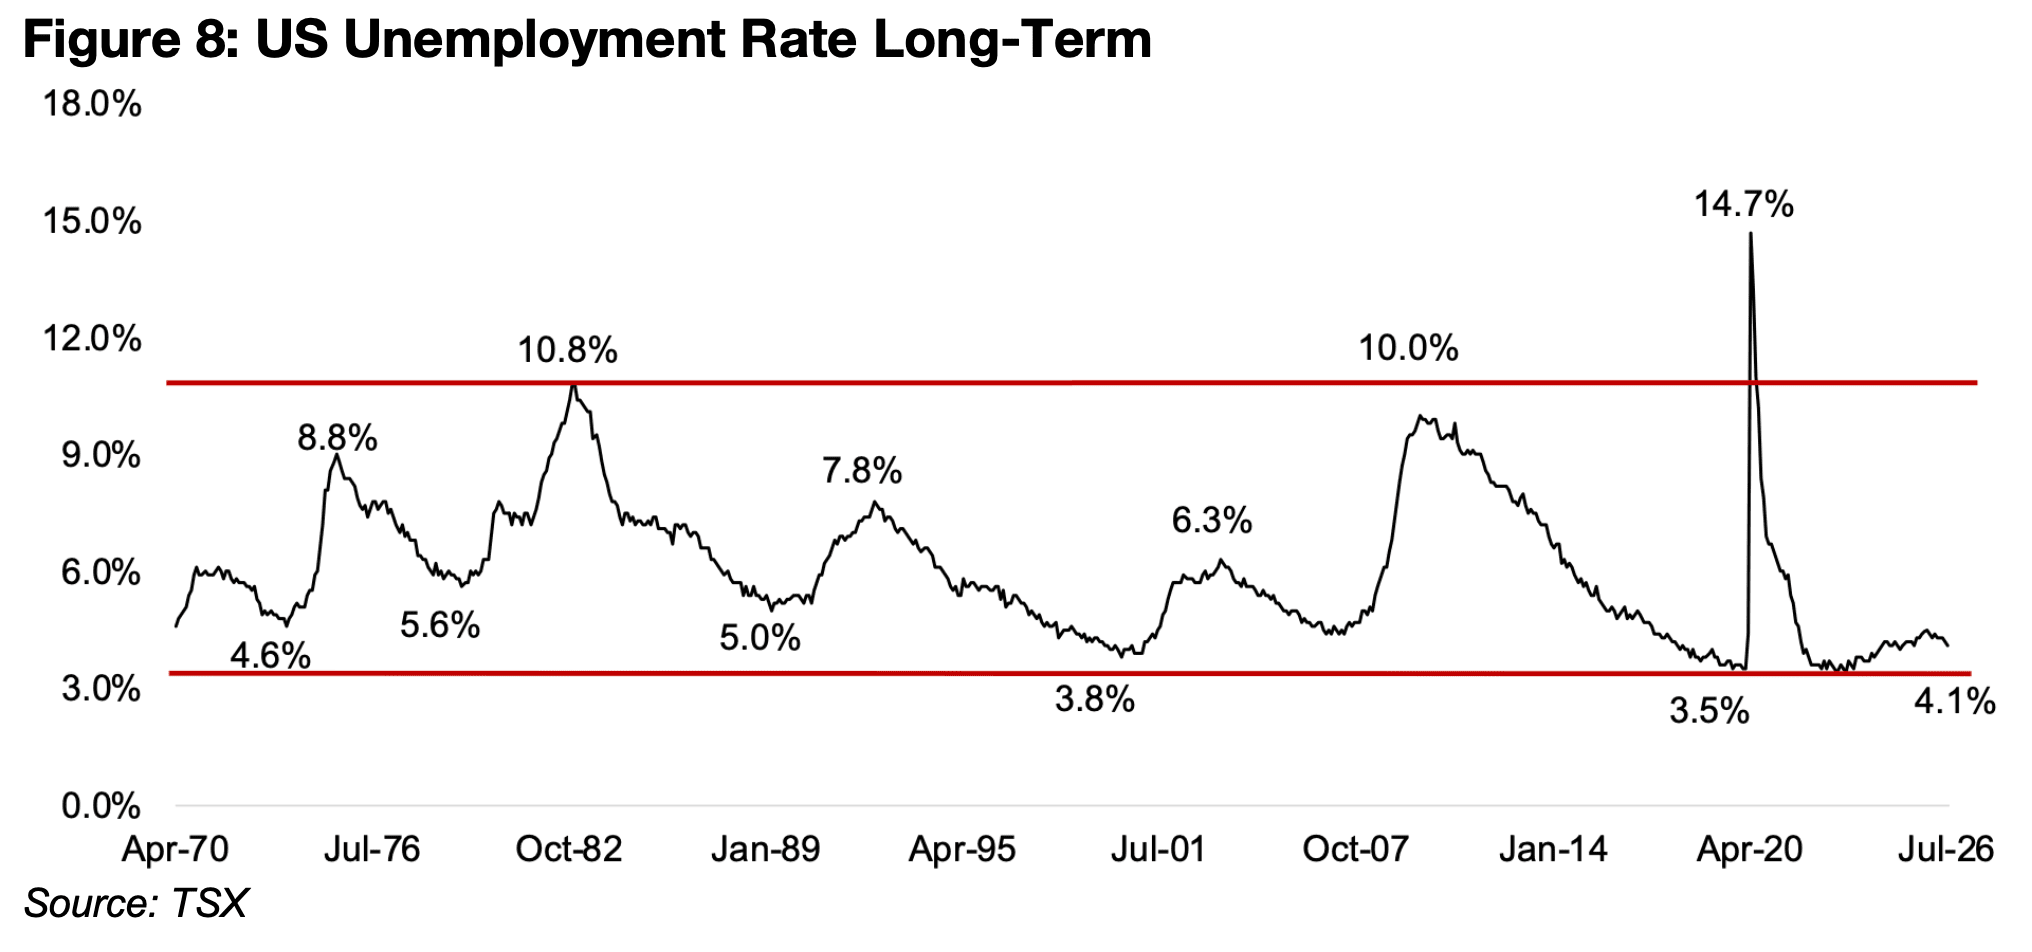
unemployment claims and a low unemployment rate, which while having declined to
4.1% from highs of 4.5%, has still jumped from lows of 3.5% in January 2023 (Figure
7). However, even with the major rise, historically these figures are extremely low, and
the trough in early 2023 was among the lowest US unemployment levels of the past
six decades. It certainly nowhere the typical highs that have been around 10.0%, with
the nearly 15.0% in the global health crisis the only major exception (Figure 8).
Overall, this certainly does not seem to point to a Fed Chairman that has entirely
taken rate hikes off the table for the rest of this year, even though the market’s
expectations for such a move have declined considerably. This had come after major
interventions by the US Treasury and a slump in US payroll figures seemed to indicate
both significant underlying global financial and domestic employment issues,
contrasting with the Fed’s bullish economic outlook. However, Warsh attributed the
weak payroll data to a low level of US labour force growth, suggesting that jobs data
was unlikely to surge without a rising number of workers.
The market interventions by the US Treasury were focused first on the Japanese Yen
in late July 2026 and then long-maturity bonds in the second half of August 2026.
The US Treasury had become concerned with a rise in long-term borrowing rates,
with the 30-year bond yield rising substantially over 5.0%, boosting the government’s
cost of debt service. To lower these yields, it made major 30-year bond purchases,
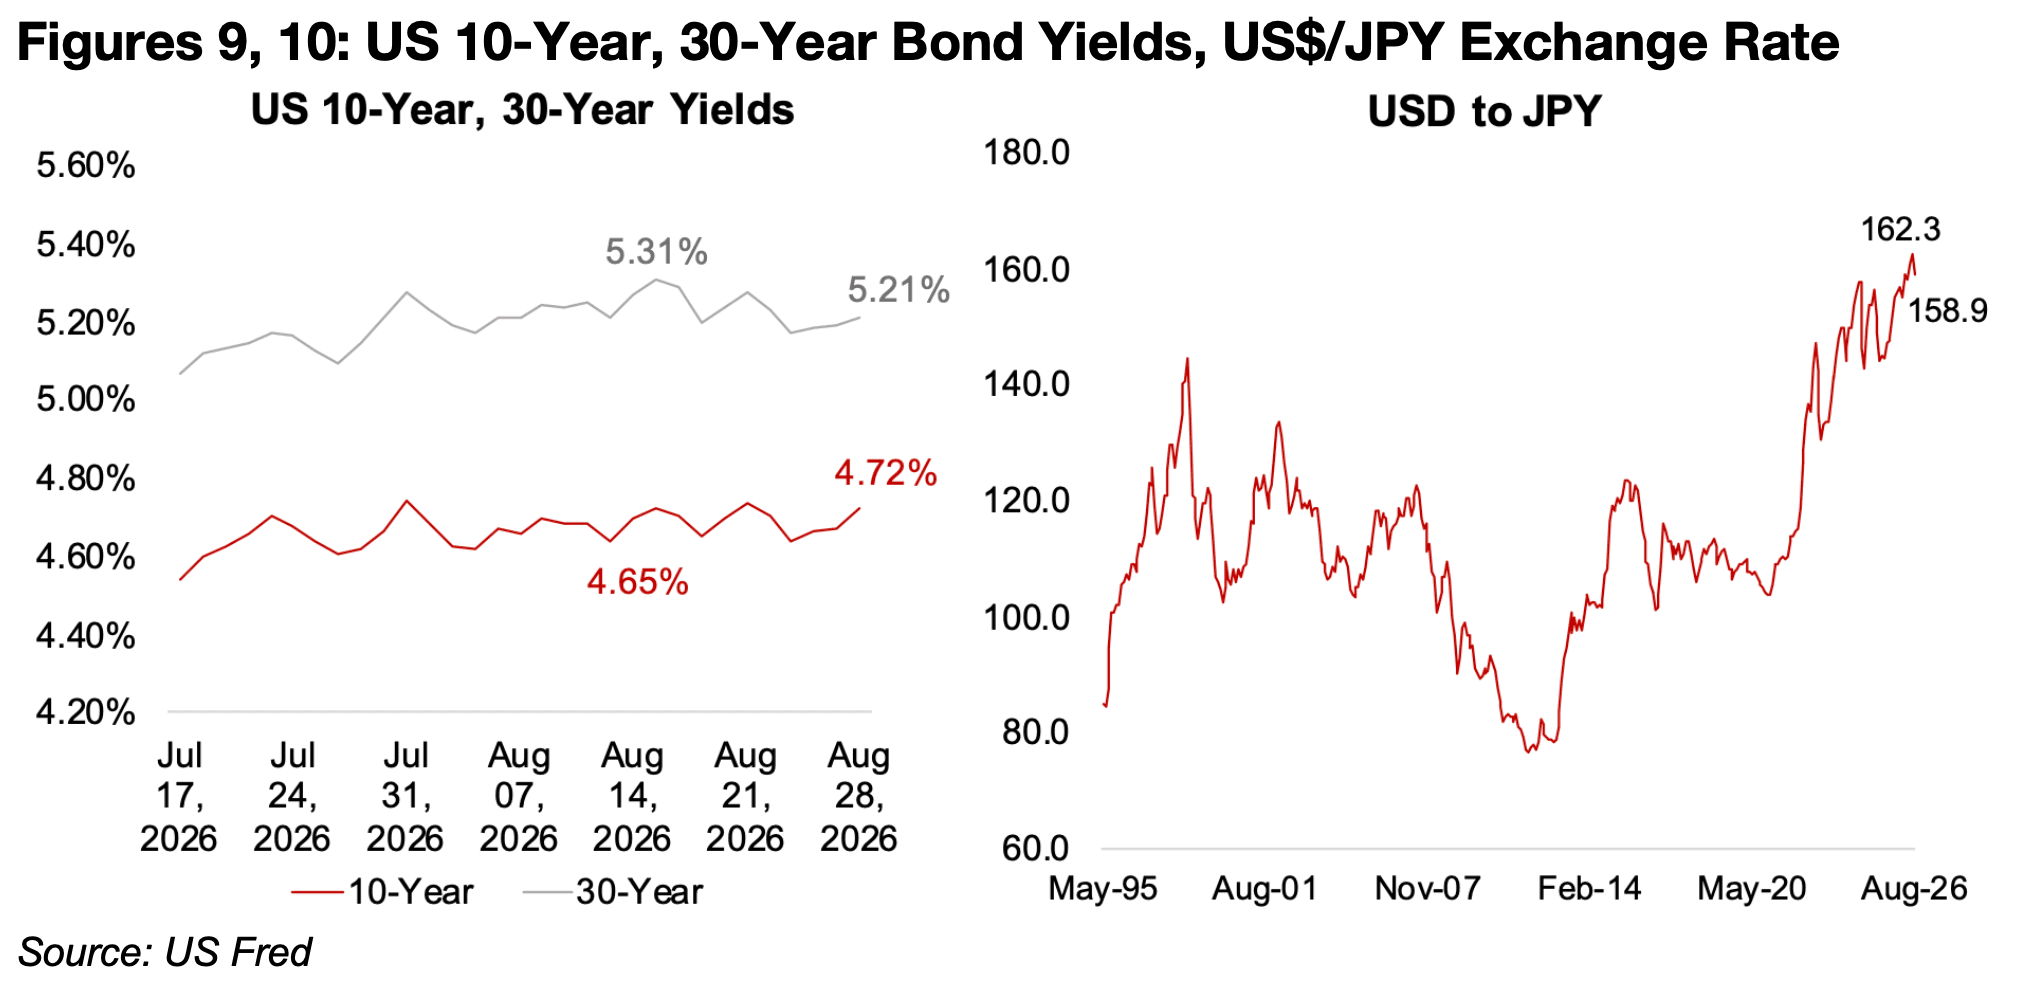
which did reduce the yield to 5.21% from a peak 5.31%, and sold shorter-term bonds
for funding, which lowered the 10-year yield to 4.72% from 4.65% (Figure 9). While
this could be considered somewhat successful, presumably US Treasury would have
been expecting a greater decline in longer-term bond yields.
The US Treasury’s earlier Yen purchases were related to this overall effort to support
the longer-term debt market. While Japan is the largest holder of US debt, the slump
in its currency has increased pressure on the government to sell off some of these
holdings to support its currency. The Yen had ranged consistently between JPY80-
JPY140/US$ for about three decades, but the currency had exited this range in recent
years, slumping to lows of JPY162.3/US$ in July 2026 (Figure 10). To prevent such a
sell off from lowering US bond prices and therefore driving up their yields, the US
Treasury purchased a substantial amount of Yen to support the currency. Similar to
the bond market intervention, there was a degree of success with the rate declining
to JPY158.9/US$, although there remains a question of how long either the US long
bond yield will be held down, or the Yen held up.
While interest rates have actually been rising in Japan, they have not supported the
currency, as might be expected, as the spread with other major countries has
remained reasonably wide. While substantial, the spread has become less attractive
compared to when the country’s interest rates were near zero. This had enabled a
major Japan carry trade, where markets could borrow extremely inexpensive in Yen
and then lend at much higher rates abroad. If Japan rates continues to increase
interest rates and the Yen appreciates further, it could make this trade much less
attractive. This could reduce a major source of funding that global markets have been
using to invest in risky assets, including the ongoing AI-driven tech boom which has
been one of the key sources of global equity market gains for several years.
Neither of these actions from the Treasury seemed to suggest that the US or global
financial system was in great shape, and implied that the strong economic outlook
outlined by the Fed Chairman could be built on somewhat shaky foundations. It
remains to be seen whether the Fed will really be as hawkish in practice as implied in
the Jackson Hole speech. The central bank does have a strong history of attacking
inflation with rate hikes, but this has tended to be only after extreme price increases
heading towards, or above, 10%, as seen in the late-1970s and early-1980s, and
during the inflation surge after the global health crisis. However, the only moderately
elevated inflation of 2.5%-4.0% currently is certainly not a major crisis yet.
The Fed does actually have a history of letting other types of inflation run that are not
showing up in their main inflation measures like CPI or PCE Index. This has included
the extreme share price inflation of the dot.com bubble and the explosion in US house
prices during the 2008-2009 financial crisis. It seems that a similar situation could be
repeating in the current AI boom, with share prices for the largest US tech companies
surging to valuations that appear increasingly precarious.
This continued boom in tech was a key factor supporting the larger cap equity
markets this week, with the S&P 500 up 0.6%, the Nasdaq rising 1.3%, even as the
hawkish Fed might have been expected to drive declines. This was mainly because
of strong results from Nvidia, which now comprises a massive 8.1% of the S&P 500
and 9.5% of Nasdaq. However, there was still a -1.4% decline in the small cap Russell
2000 index, where the maximum market cap is just under US$6.0bn, and therefore is
not influenced by megacap tech like Nvidia.
The concern over a potential rate hike drove down the gold price, as this implied both
higher real yields and an increase in the US$, which move inversely to the metal, and
a potentially lower money supply growth, with an expanding monetary base the key
fundamental long-term driver of the metal. However, gold did not react as negative
as might have been expected by the quite hawkish Fed chair comments, implying
that its current run still has support. The decline in gold stocks was also relatively
muted, with the GDX down -3.1% and GDXJ losing 2.9%, especially in the context
of gains over the past month of 34% and 35%.
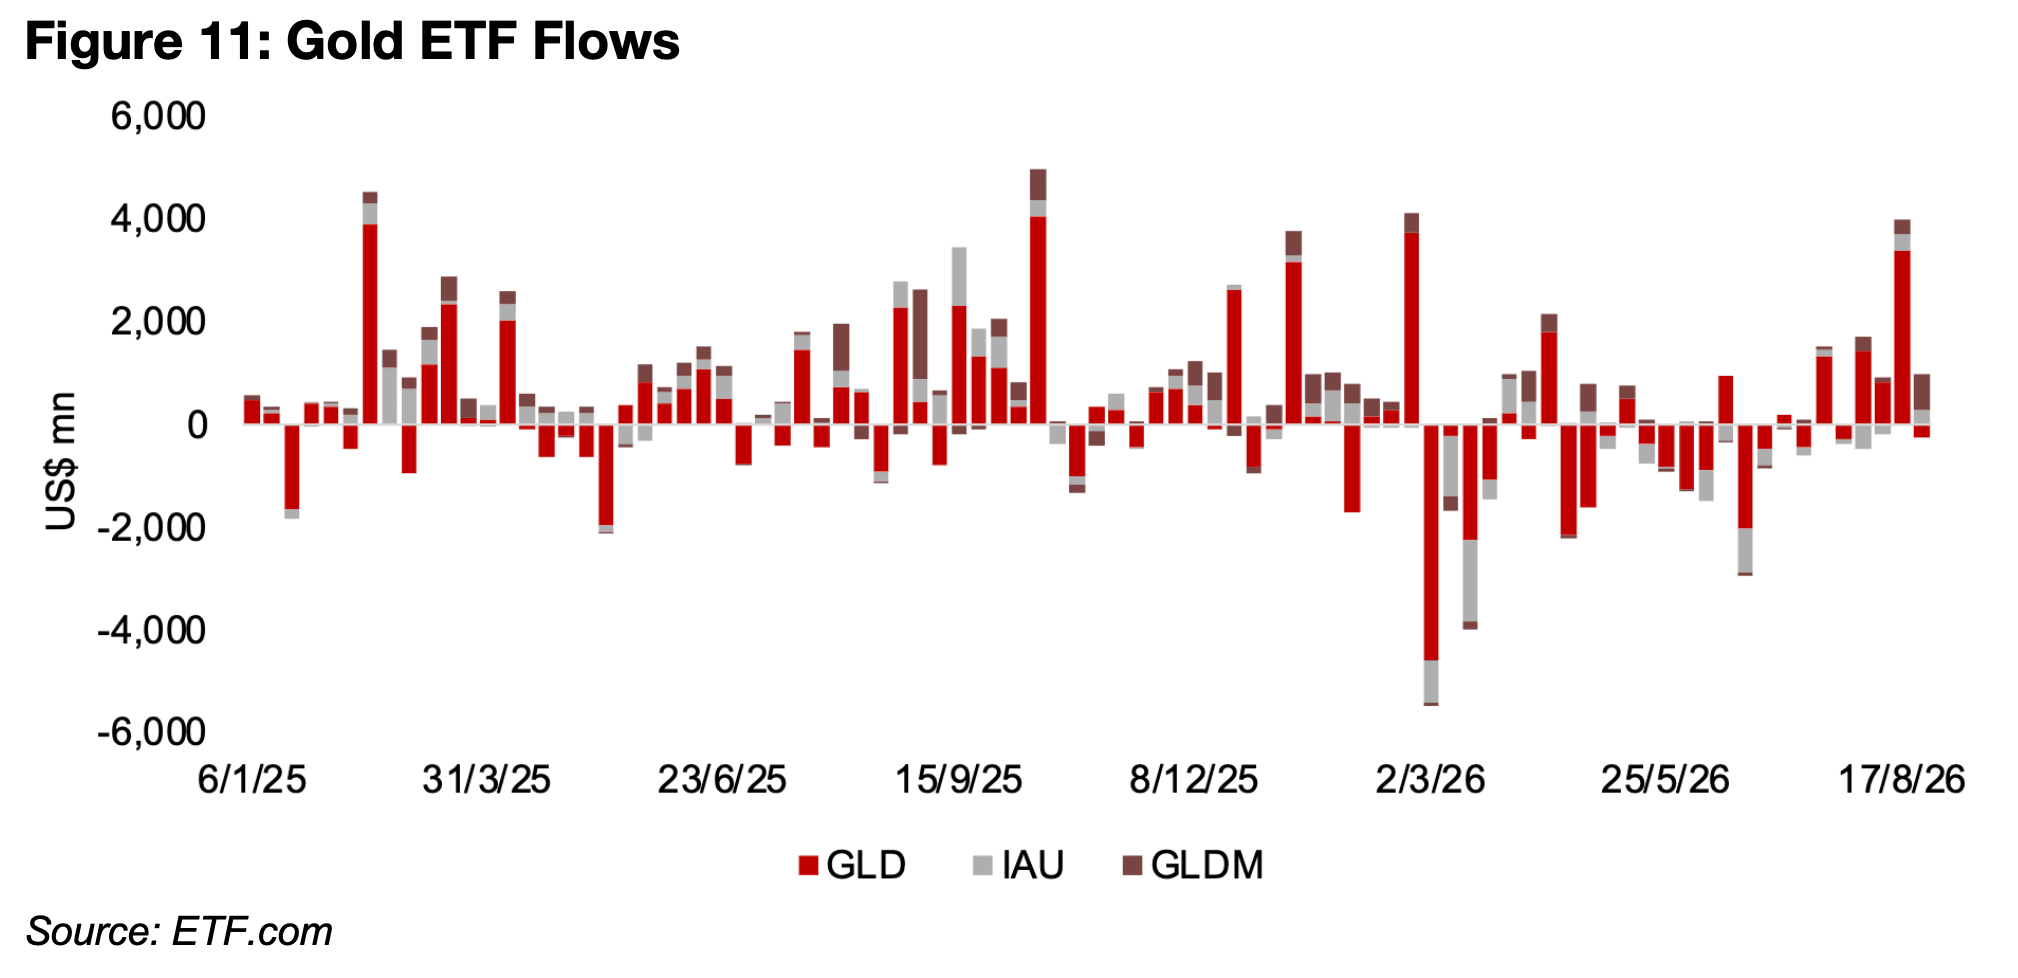
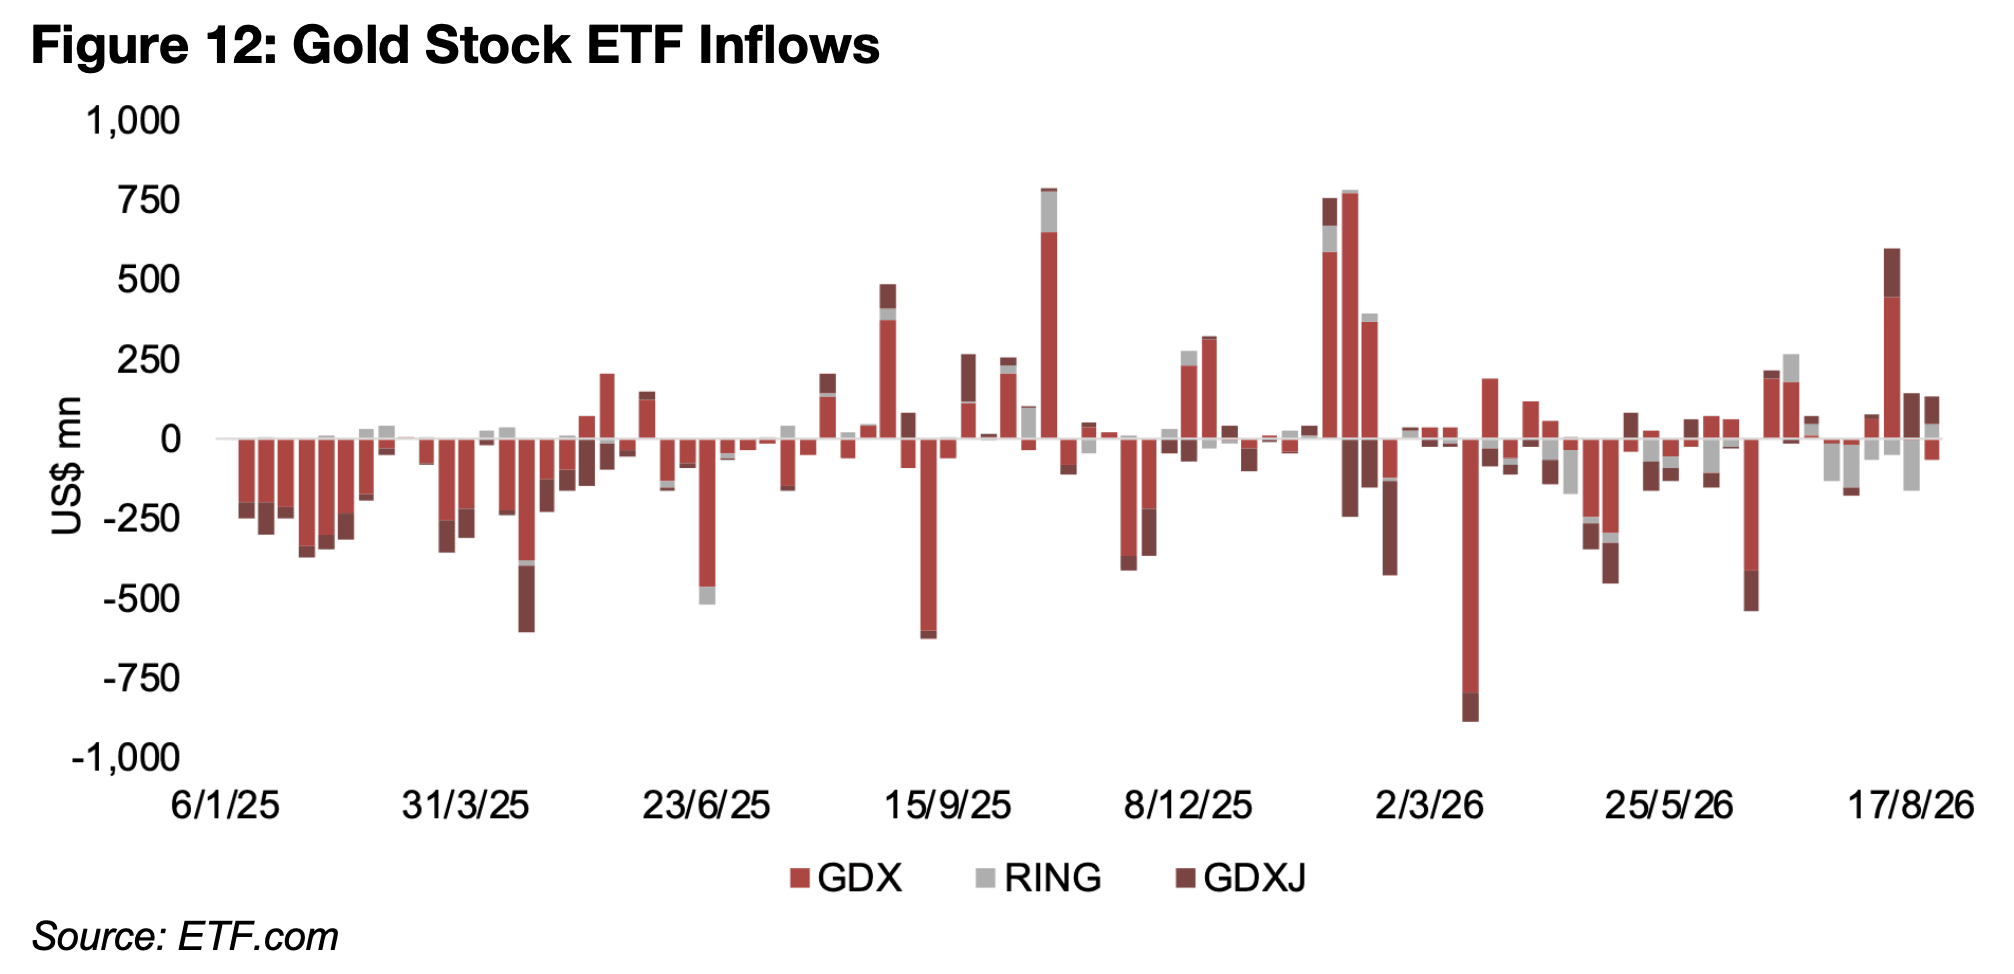
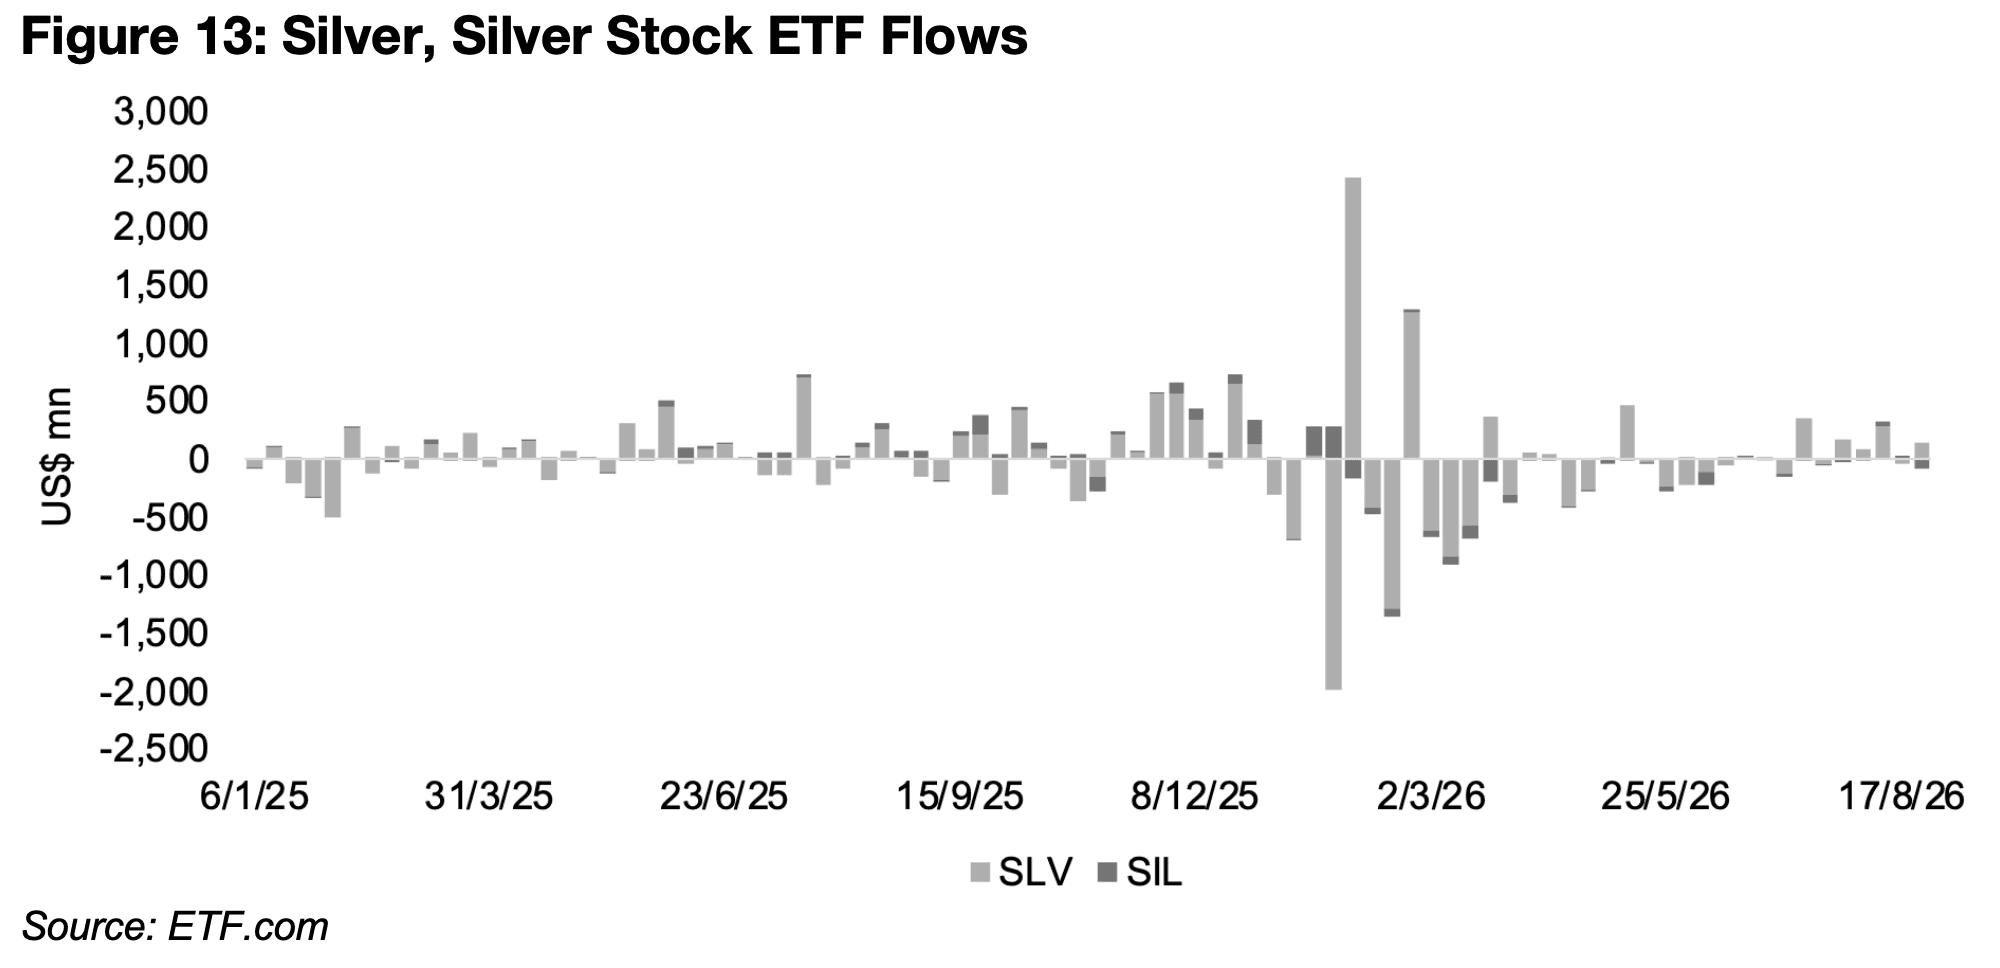
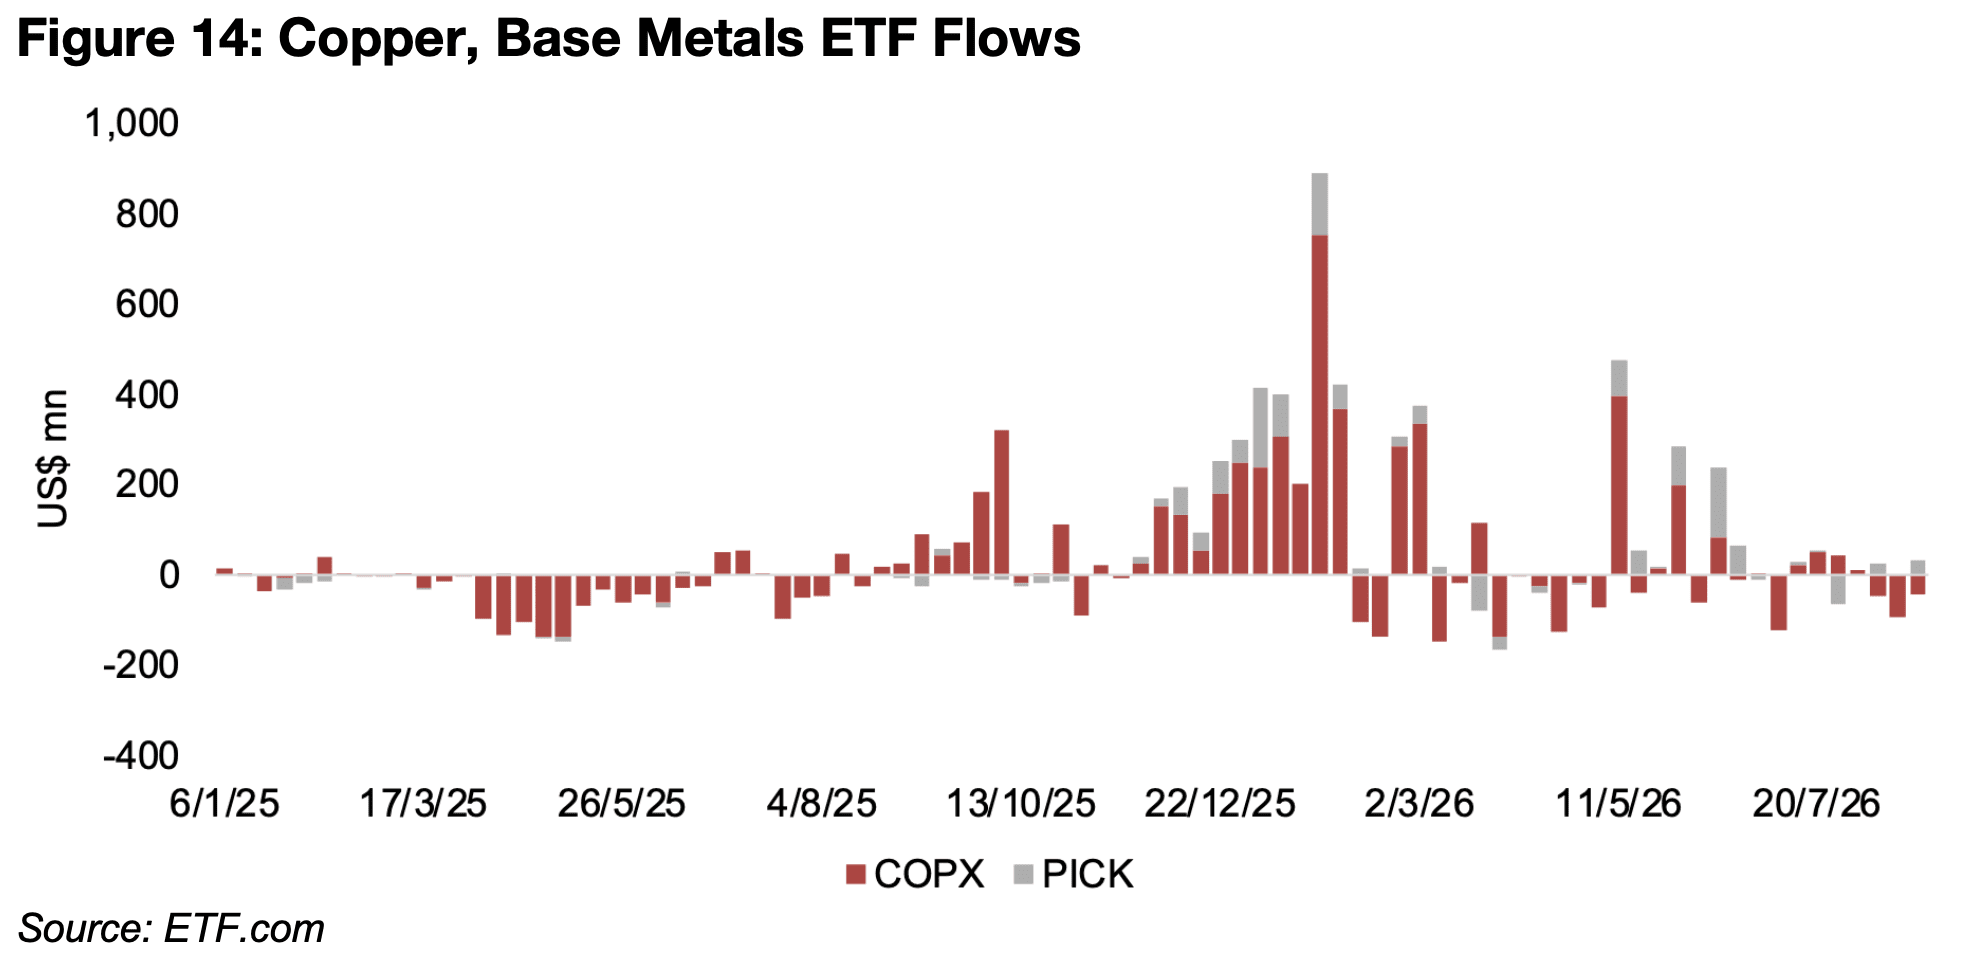
The inflows into the gold and sector stock ETFs during the metal’s major August 2026 run were concentrated in just one week at the start of the month, with a major jump for the GLD gold price ETF and GDX ETF of gold producers, not actually sustained in the subsequent weeks (Figures 11, 12). This seems to show that it is not a more speculative, retail move driving the gains, and the US Treasury interventions suggest changes in fundamentals that could support gold, even given a more hawkish Fed. The inflows into the SLV silver price ETF and SIL ETF of silver stocks have been subdued even as the metal price jumped and inflows into the COPX ETF of copper stocks have been relatively low as the metal price has declined (Figures 13, 14).
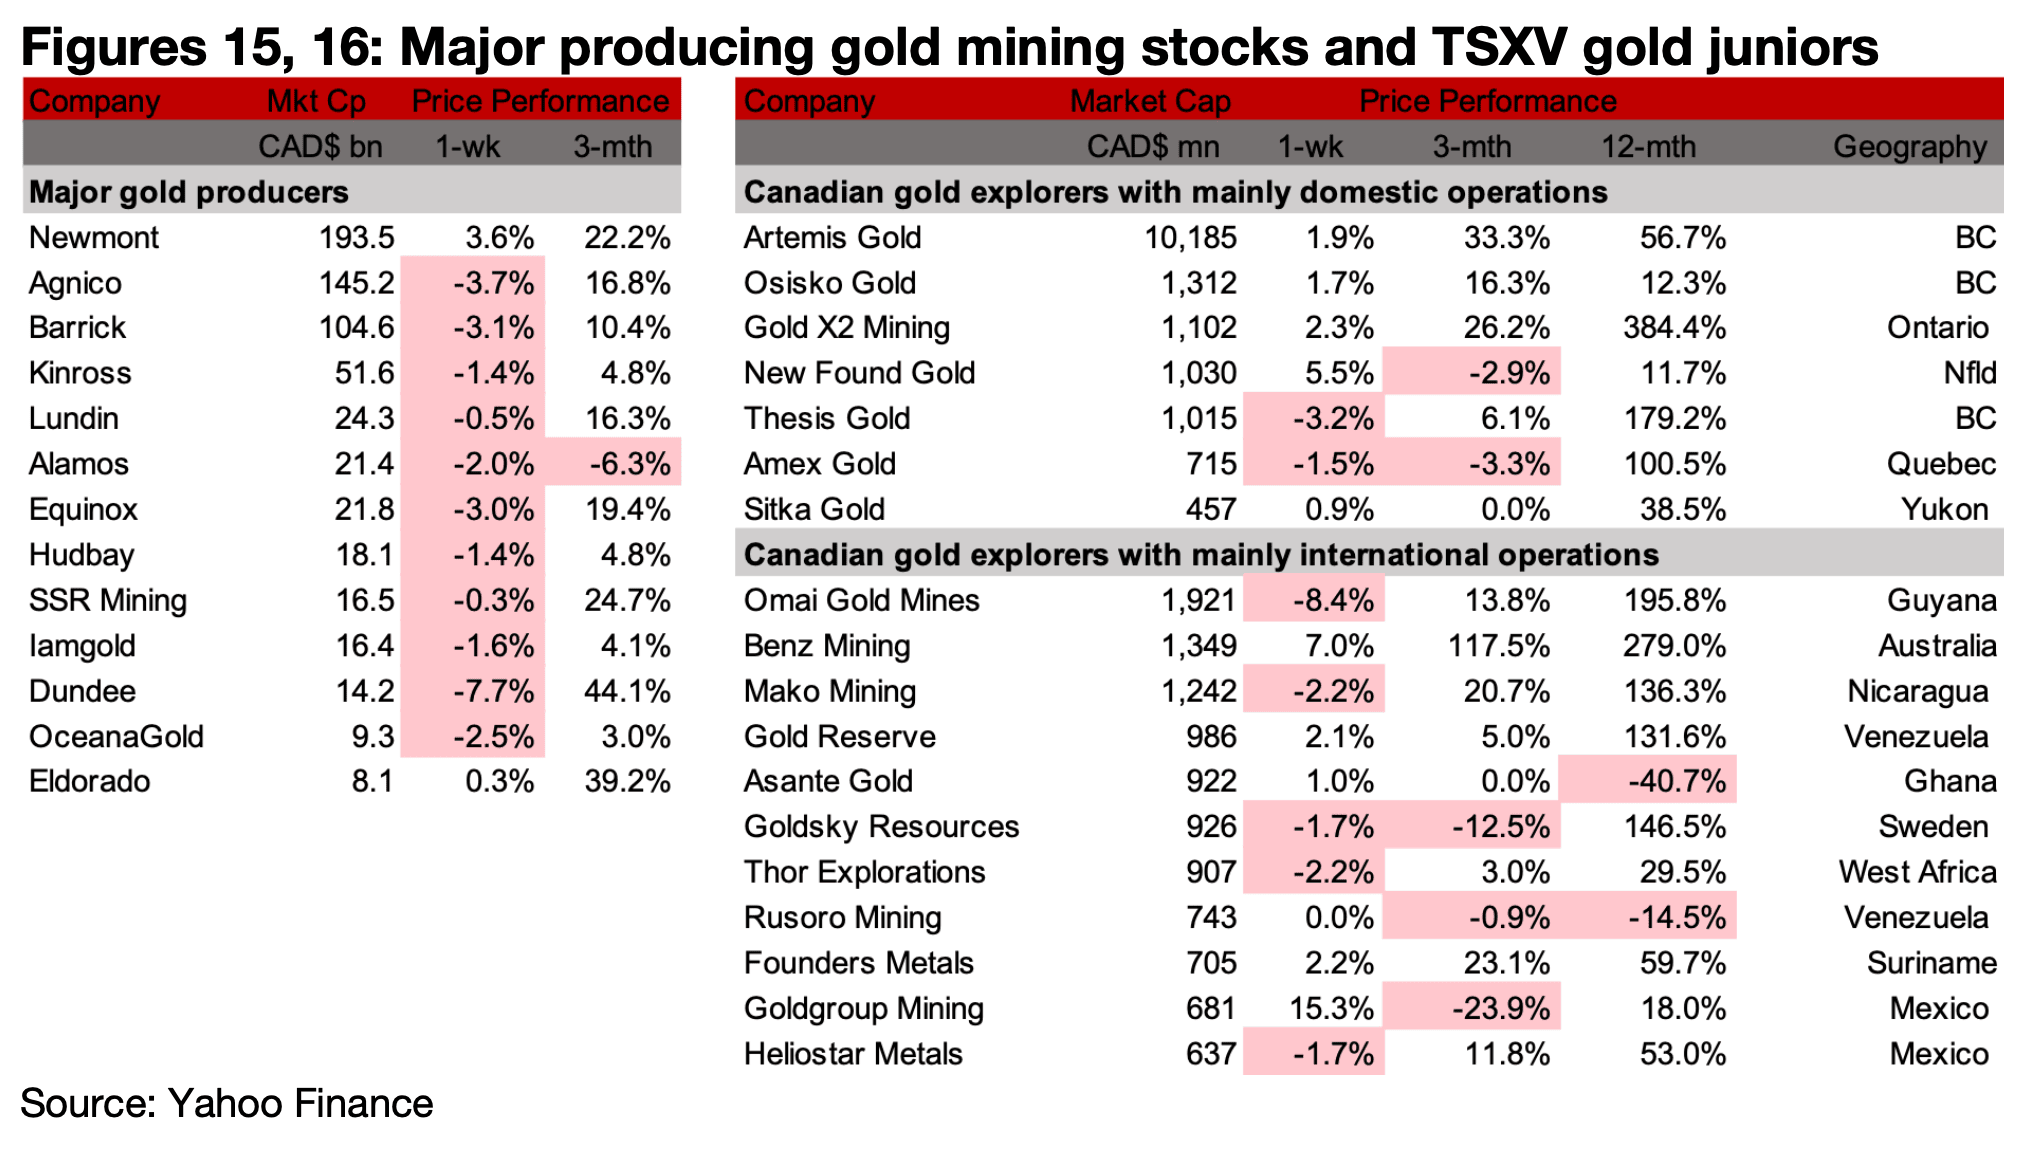
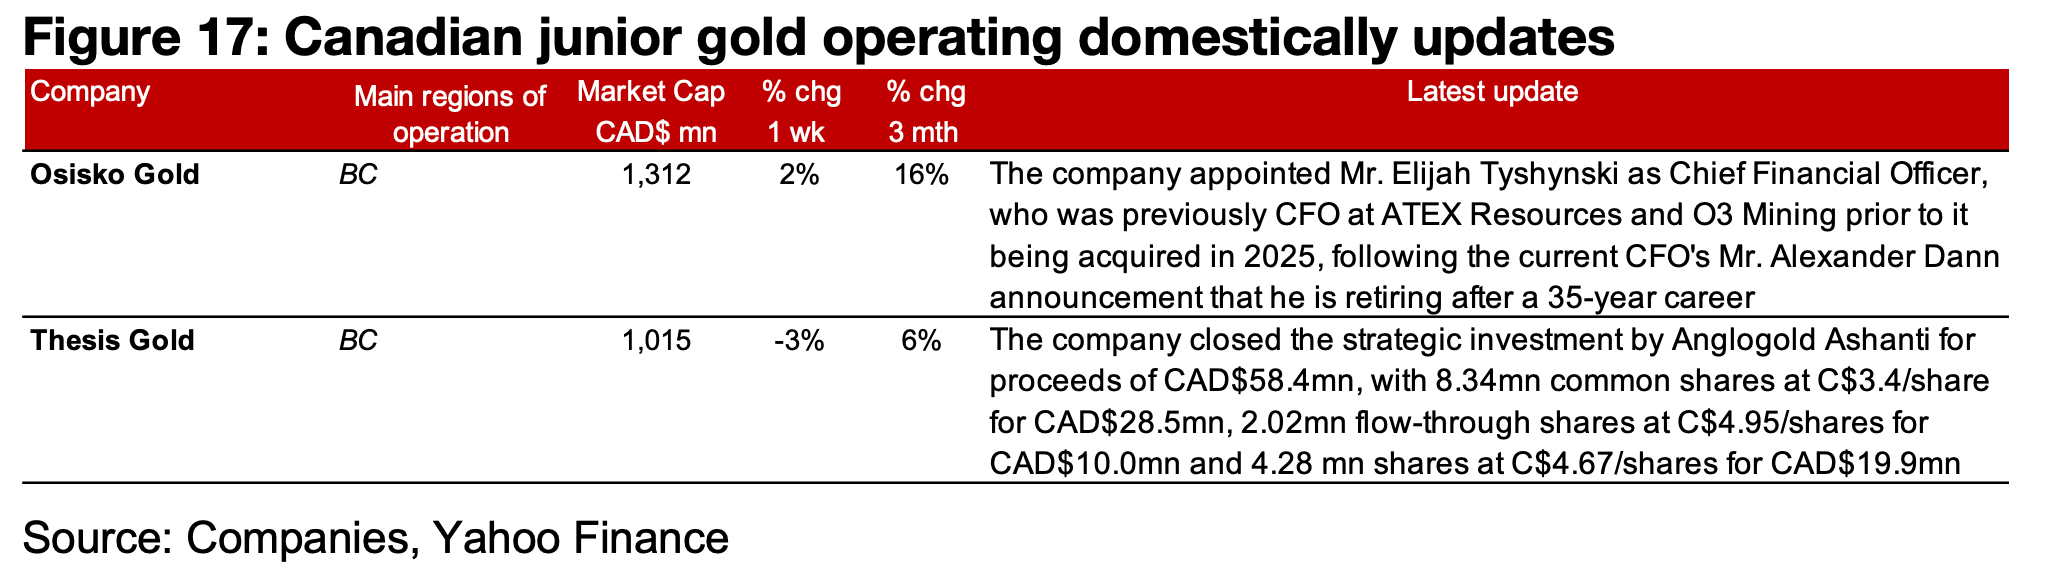
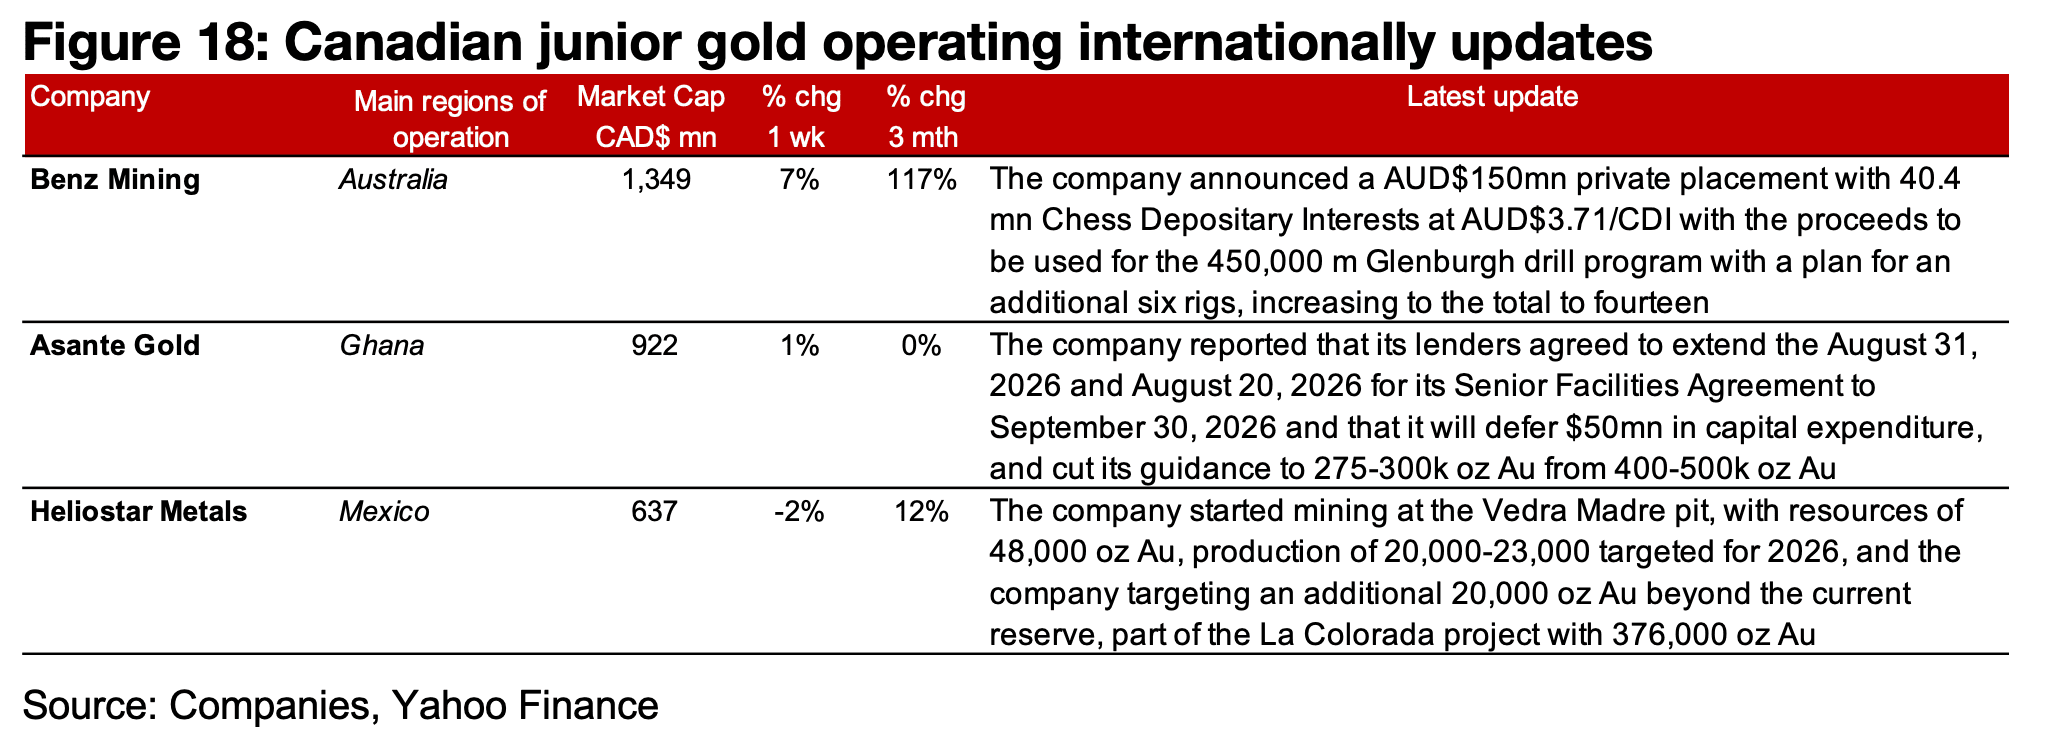
The major producers nearly all declined and TSXV gold was mixed (Figures 14, 15). For the TSXV gold companies operating mainly domestically Osisko appointed Mr. Elijah Tyshynski as its Chief Financial Officer and Thesis closed its strategic investment by Anglogold Ashanti for proceeds of CAD$58.4bn. (Figure 16). For the companies operating mainly internationally, Benz announced an AUD$150mn private placement, Asante reported an extension of Senior Facilities agreements and deferral $50mn in capital expenditure and reduced its production guidance, and Heliostar started mining at the Vedra Madre pit (Figure 17).
Disclaimer: This report is for informational use only and should not be used an alternative to the financial and legal advice of a qualified professional in business planning and investment. We do not represent that forecasts in this report will lead to a specific outcome or result, and are not liable in the event of any business action taken in whole or in part as a result of the contents of this report.
Author
Ben McGregor authors the Weekly Roundup at CanadianMiningReport.com, providing sharp analysis of the metals and mining sector. With a talent for spotting trends, Ben distills complex market shifts into clear, engaging insights on TSXV junior miners. His weekly updates cover gold, copper, uranium, and more, blending data-driven perspectives with a knack for identifying opportunities. A vital resource for investors, Ben’s work navigates the dynamic junior mining landscape with precision.