
June 23, 2025
While gold declined -1.2% to US$3,390/oz, this pullback could be brief as geopolitical risk surged over the weekend, with the US attack on Iran likely more quick and severe than the market had expected and not fully priced in yet.
This week we look at the possibility that gold may already be pricing in surging geopolitical, trade and economic risk, but not a potential rise in the US$, and the potential for energy to outperform mining given suddenly strong supply side drivers.
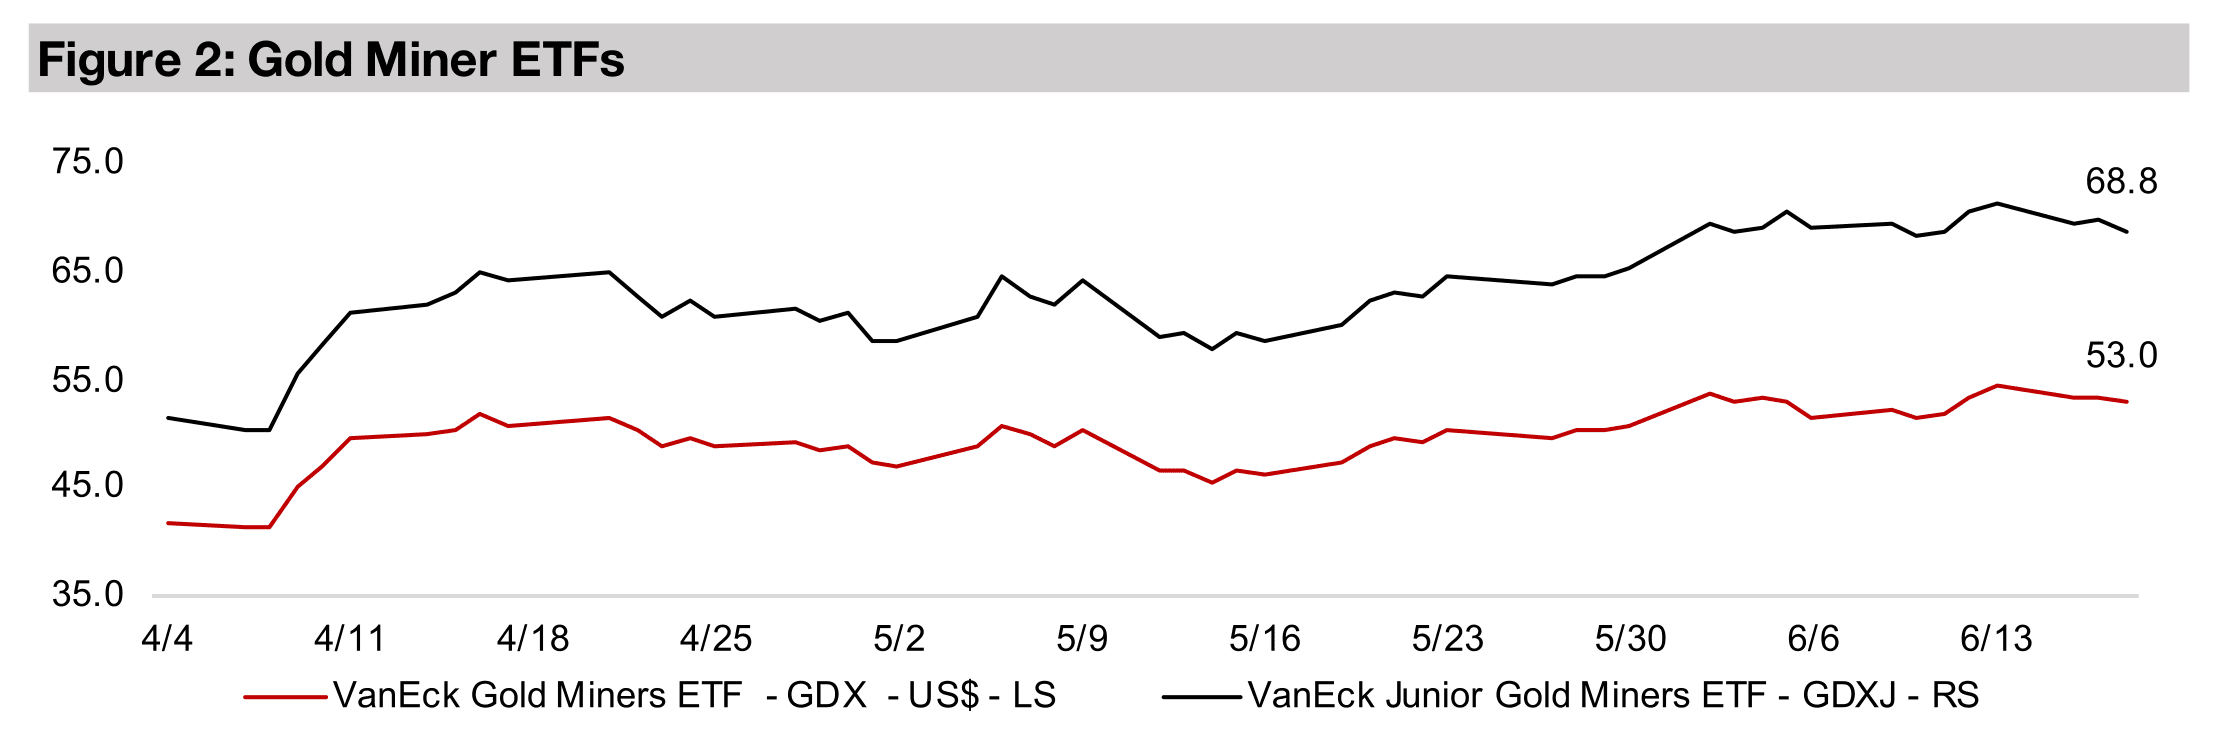
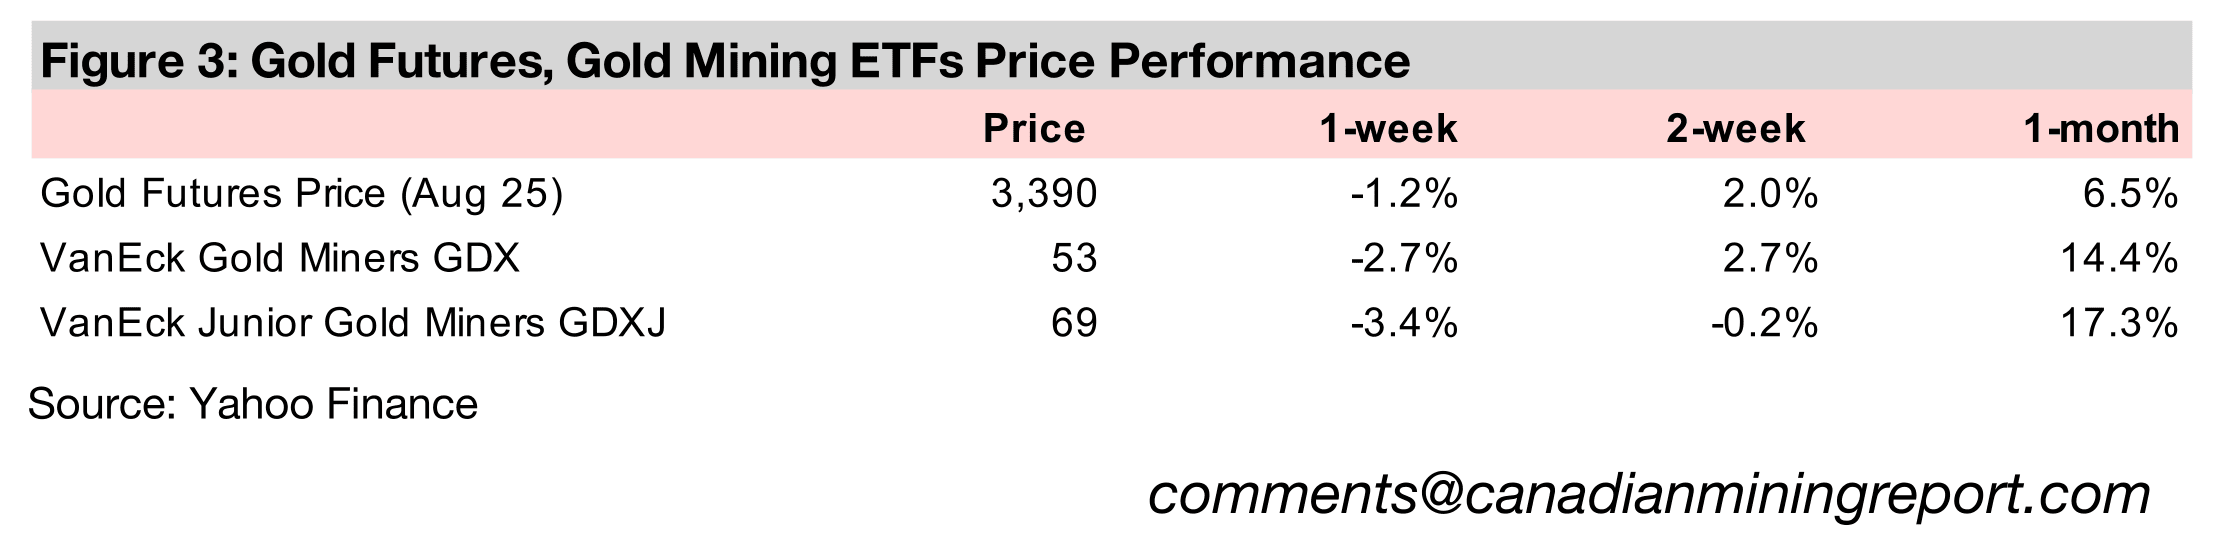
The gold stocks declined with the GDX down -2.7% and GDXJ losing -3.4%, mainly on the drop in the metal price, as the equity markets remained relatively flat, with the S&P 500 down -0.6% but the Nasdaq and Russell 2000 off just -0.02% and -0.2%.


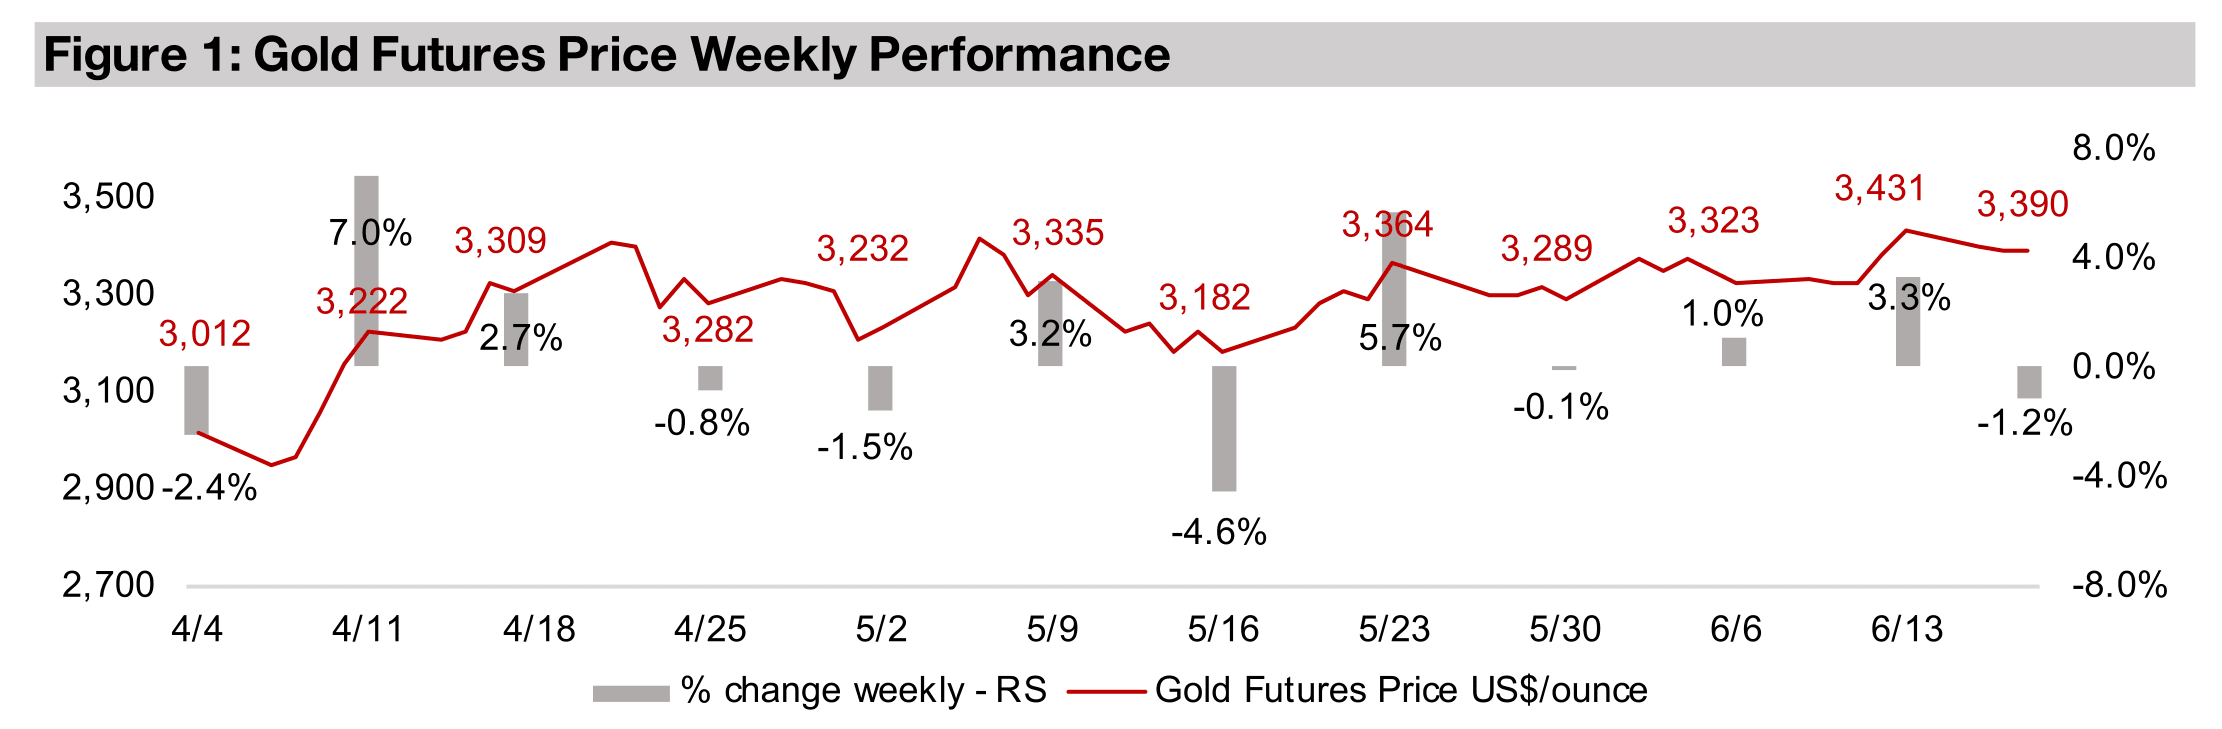
The gold price declined -1.2% to US$3,390/oz, dipping back into the US$3,200/oz-
US$3,400/oz range that has held for most of the past two and half months. The major
driver was likely a 0.7% rise in the US$ as the Fed held rates flat at its meeting.
However, this and other news flow earlier in the week were dwarfed in significance
by the dramatic escalation of geopolitical risk following a direct attack on Iran by the
US, with previous strikes coming only from Israel. We expect that this will drive major
moves in many markets in the coming week, including gold, oil and equities.
While the S&P 500 declined -0.6%, the Nasdaq and Russell 2000 were near flat, down
-0.02% and -0.2%, respectively, although further pressure on equity markets is likely
this week. The gold stocks declined on the pullback in the metal price, with the GDX
down -2.7% and GDXJ off -3.4%, and while silver was near flat, up 0.2%, the
platinum bull market continued, with it rising 3.5%, and palladium gained 2.1%. The
oil price had already gained 3.5% by the last trading day of the week, but this did not
yet incorporate the recent escalation, and with Iran having now closed the key Straits
of Hormuz shipping route, markets are forecasting a continued rebound in oil.
Geopolitical risk has been a major driver for gold over the past few years, and we
estimate about a US$500/oz a premium in the price just from ongoing conflicts. We
could see such a premium rise on the recent US action, as the market may not have
priced in something so soon or so severe. While an initial take could be that
geopolitical risk has actually declined, as Iran can no longer access nuclear weapons,
there is a high likelihood of a major reaction from Iran and other proxies. So while the
long-term risk of a nuclear conflagration may have declined, the risk in the Middle
East of a protracted conventional conflict have likely increased.
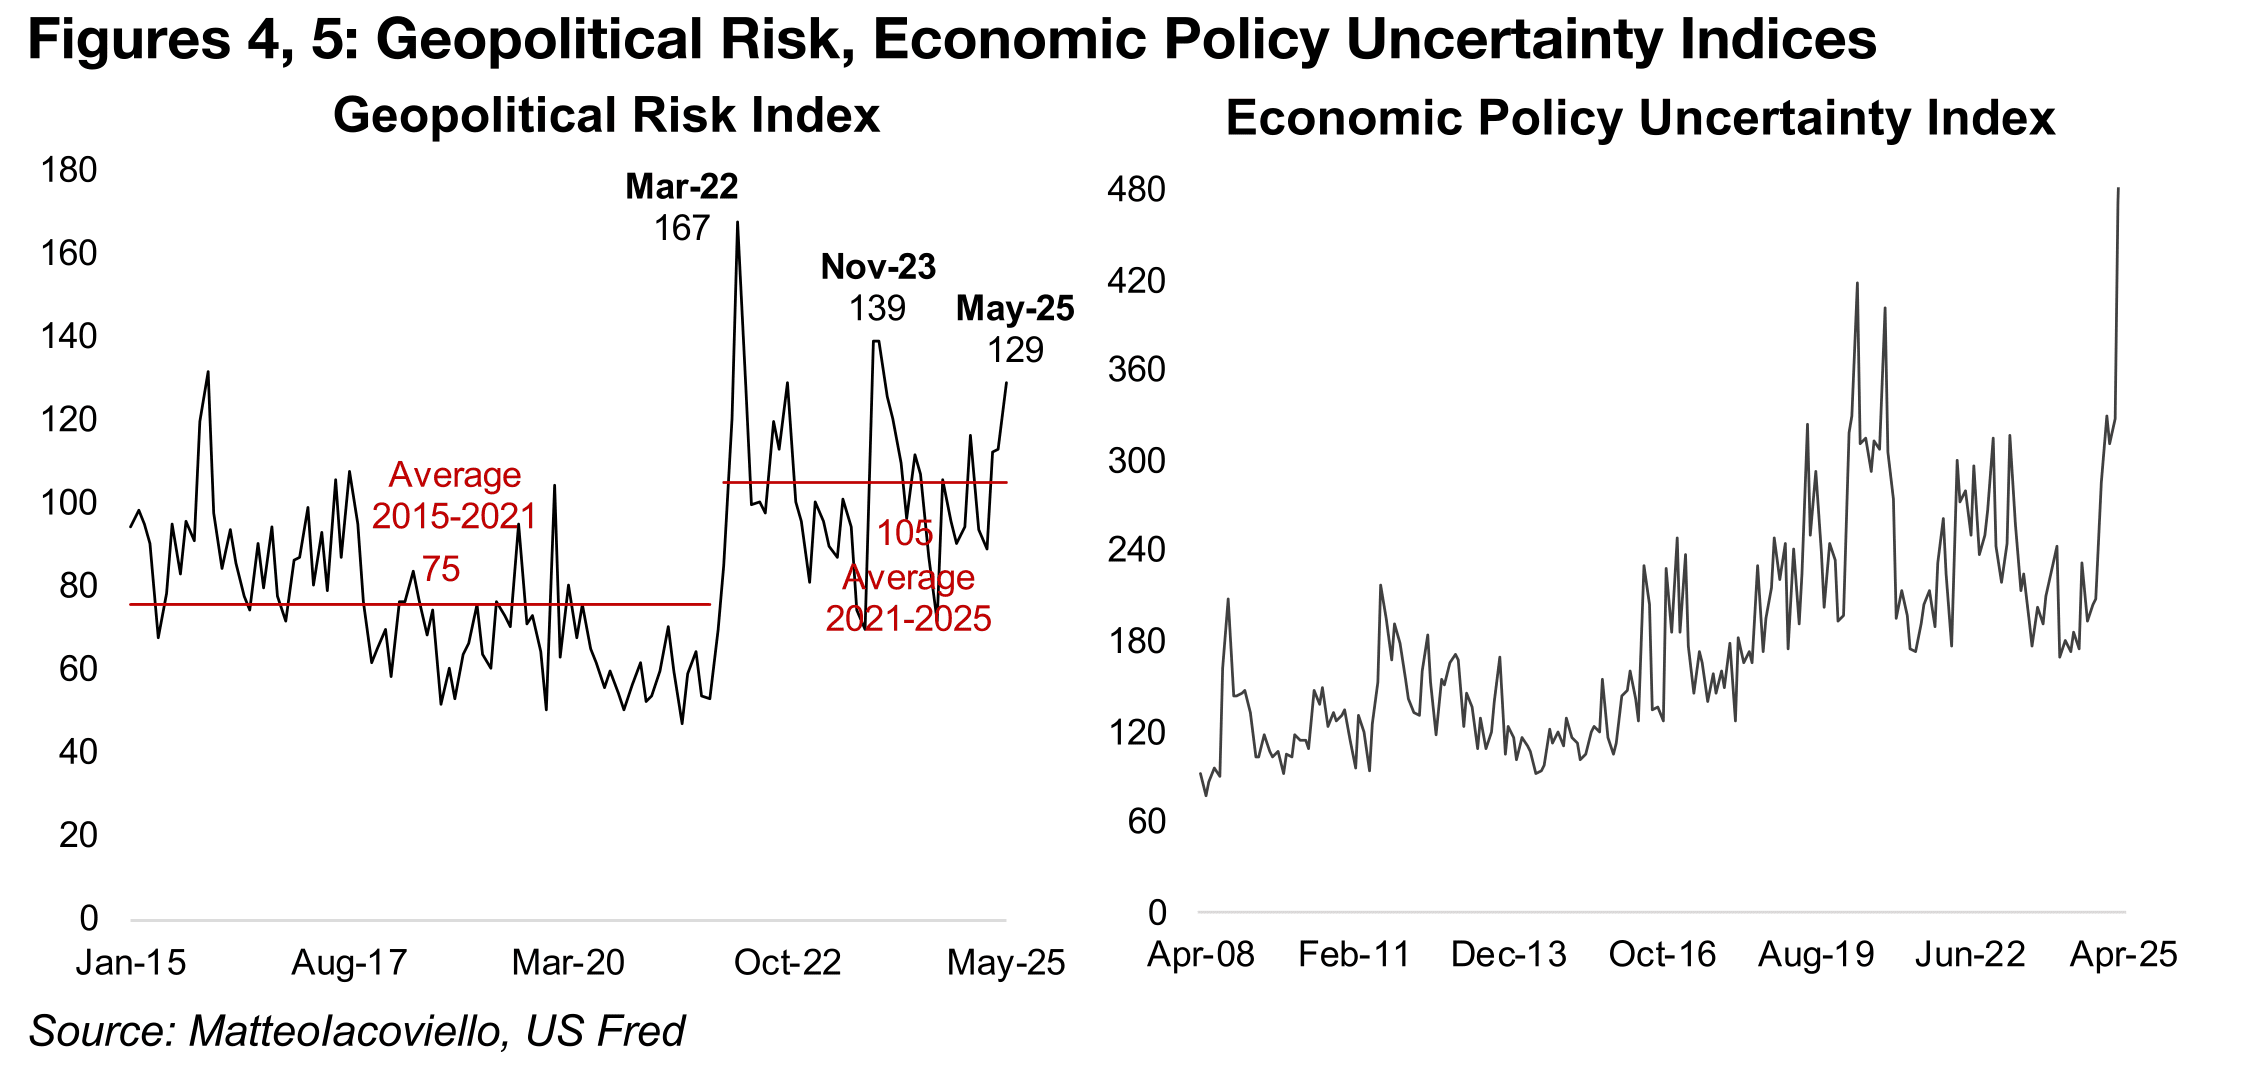
The Geopolitical Risk index in May 2025 was already elevated versus its recent history
at 129, with it only higher in November 2023 at 139 after the initial escalation in the
Middle East, and in March 2022 at 167 as the Russia-Ukraine war started (Figure 4).
This is also before considering the developments over the past week, with the June
data very likely to show a further rise that could move above these past two peaks.
The average since 2021 of 105 is well above the 2015-2021 average of 75 and shows
a clear shift to a sustained period of higher geopolitical risk over the past five years.
However, it is not only geopolitical risk that has jumped this year, but also economic
and trade risks. The Economic Policy Uncertainty Index has risen to near 480, by far
its highest level of the past twenty years, and far higher than either the 2008 global
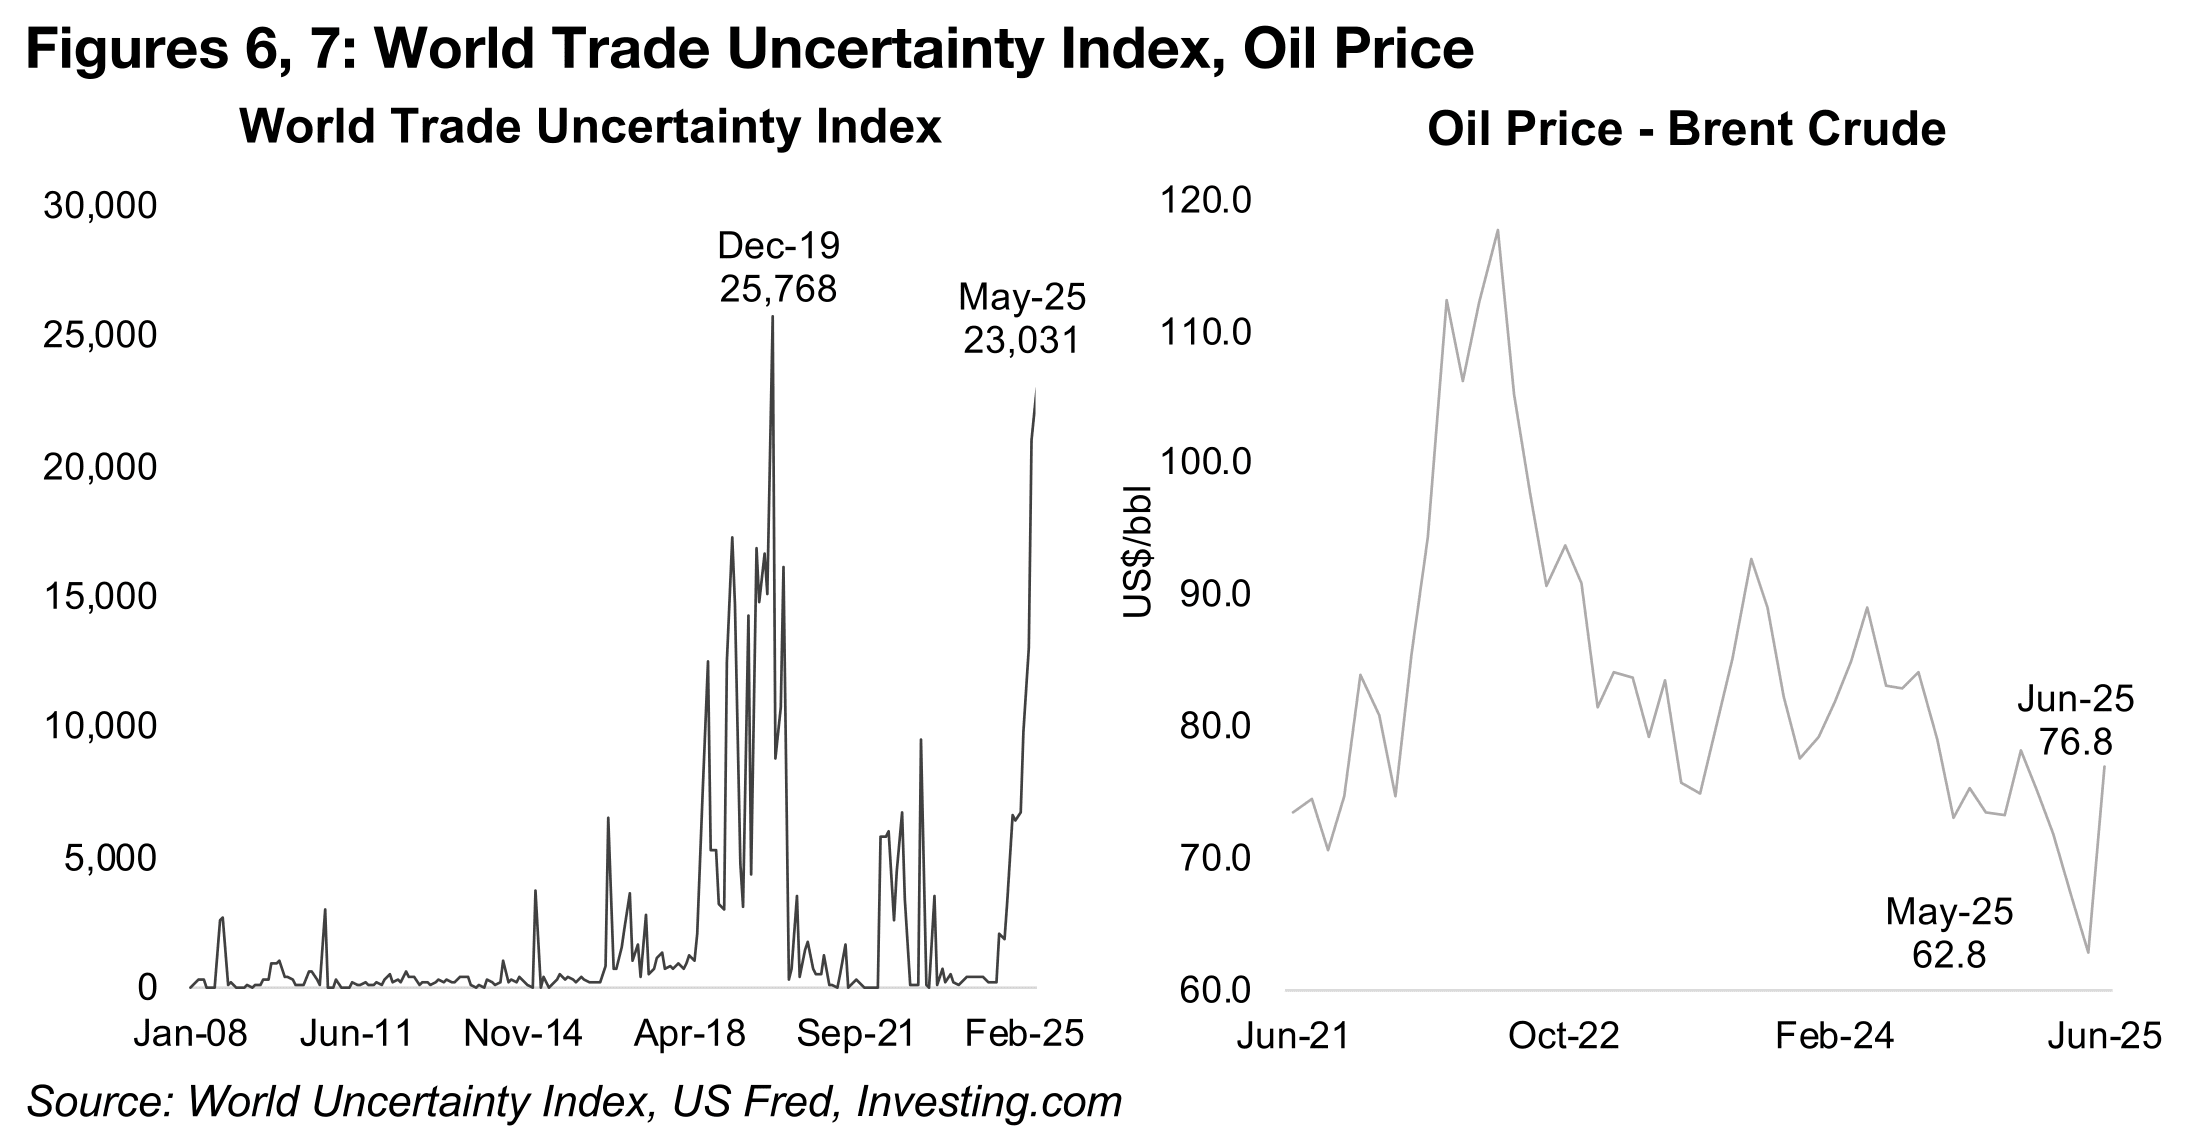
financial crisis or the 2020-2021 peak of the global health crisis (Figure 5). The World
Trade Uncertainty Index has also soared, as would be expected given the trade war,
to 23,031in May 2025, near the previous highs of 25,678 in December 2019, which
was actually prior to the onset of the global health crisis (Figure 6).
The question now is just how much of all this risk has gold already priced in, given
that these difficult situations are actually all well known to the markets. The most
recent escalation in the Middle East is new and will likely be priced in over the next
week, which could give gold a short-term lift. However, the price has been range
bound for over two months, indicating that the market is seeing the metal as
reasonably fully valued. Many of its ratios versus key commodities, including the other
precious metals, oil and other commodities had moved far above historical averages
this year, indicating that it was getting relatively inexpensive. This suggested that
some rebalancing would likely occur, either through a decline in gold, or a rise in
these other commodities.
This shift has already started over the past month, and it had been driven by a rise in
the commodities, while gold has remained relatively flat. The gold to oil ratio had
particularly started to look extreme this year, surging to all time highs, as the oil price
continued a slump from a peak in Brent crude of over US$117/barrel in June 2022
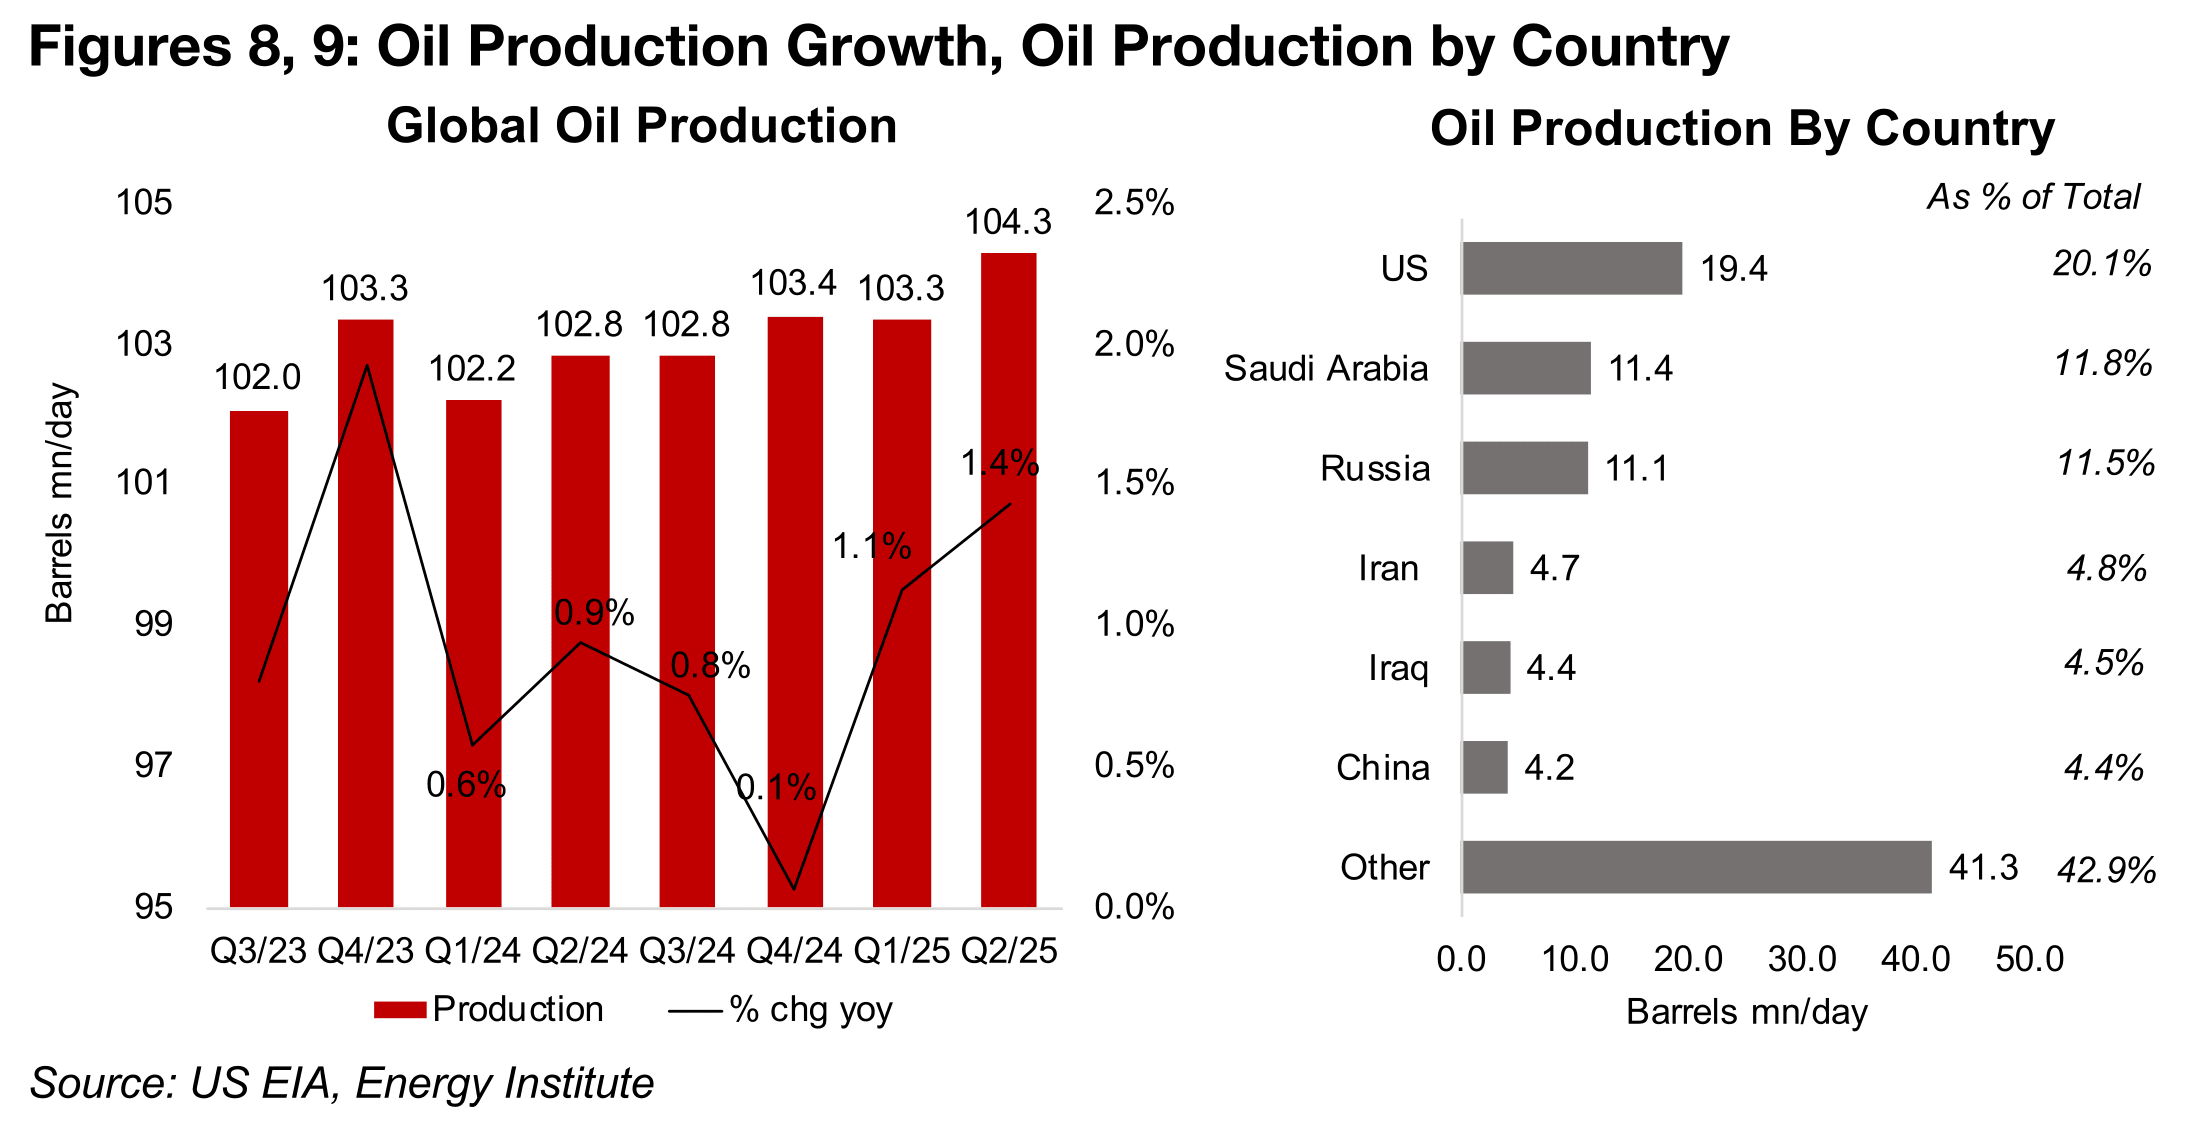
(Figure 7). This extended decline been driven by reasonably strong production growth,
of 1.1% in Q1/25 and 1.4% in Q2/25, after growth below 1.0% for the first three
quarters of 2024.
The US Energy Information Agency had expected that this strong production growth
would continue through H2/25 and into 2026, which had put major pressure on the
oil price. However, the recent developments could see these production forecasts
downgraded substantially, especially with Iran the number four global supplier in
2023, at 4.8% of the total (Figure 9). Even if production were to remain strong, there
is also the new constraint on getting it to market, with the closure of the Straits of
Hormuz, which could also drive up the oil price.
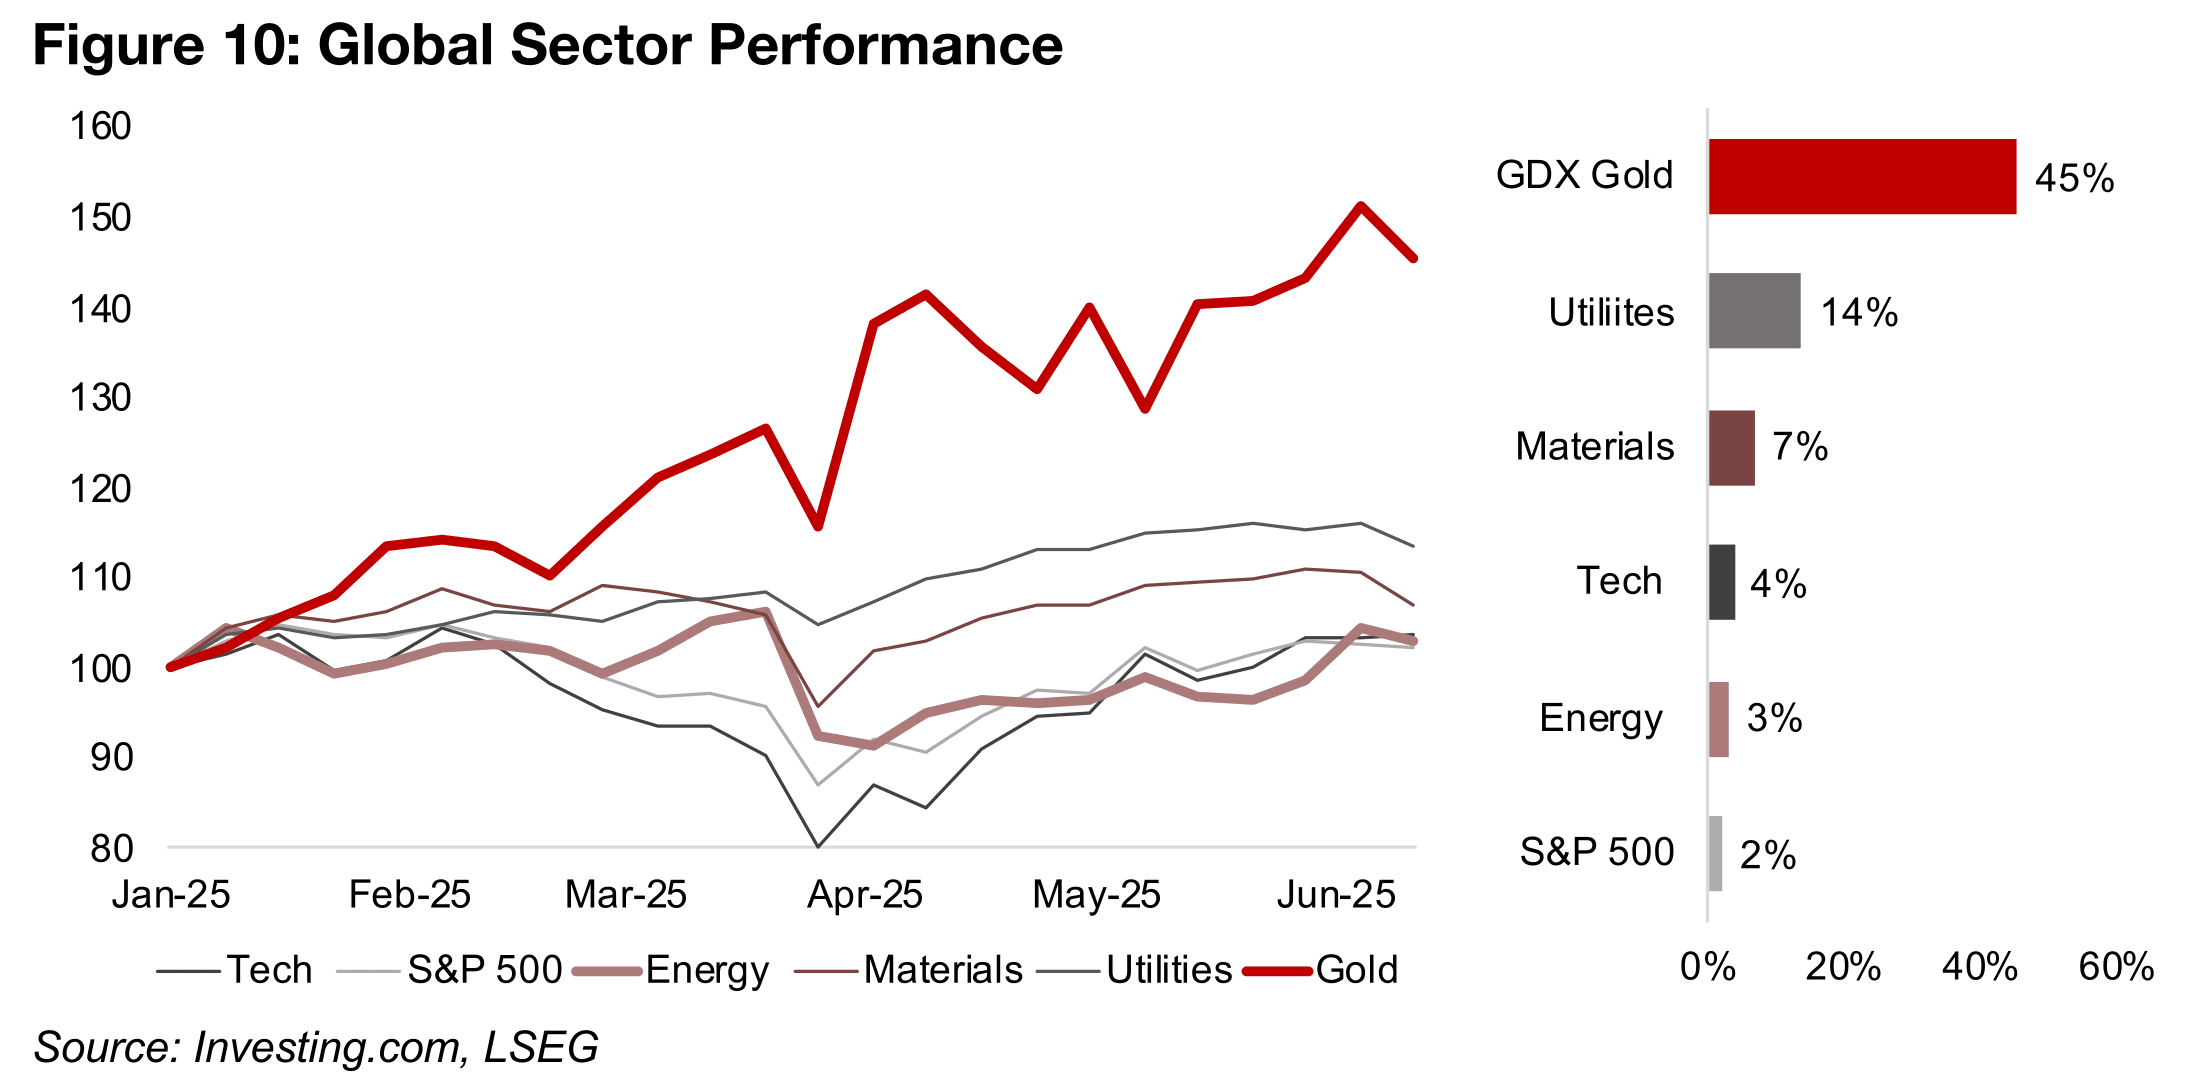
After a long downtrend for oil and other fossil fuels prices, and with such a major shift in the fundamentals in just a week, we see a rising probability that energy could outperform mining within the broader materials sector this year. At least one investment bank is already forecasting a US$110/barrel oil price. While gold could continue to hold up, it has had a major run, with the GDX ETF of gold stocks up 45%, dwarfing the performance of other sectors, including energy, gaining just 3% (Figure 10). The GDX price to book (P/B) of 2.4x is also starting to get moderately high, versus just 1.9x a year ago, and the gold trade appears to have become an increasingly consensus one, which is often a warning of a potential reversal (Figure 11).
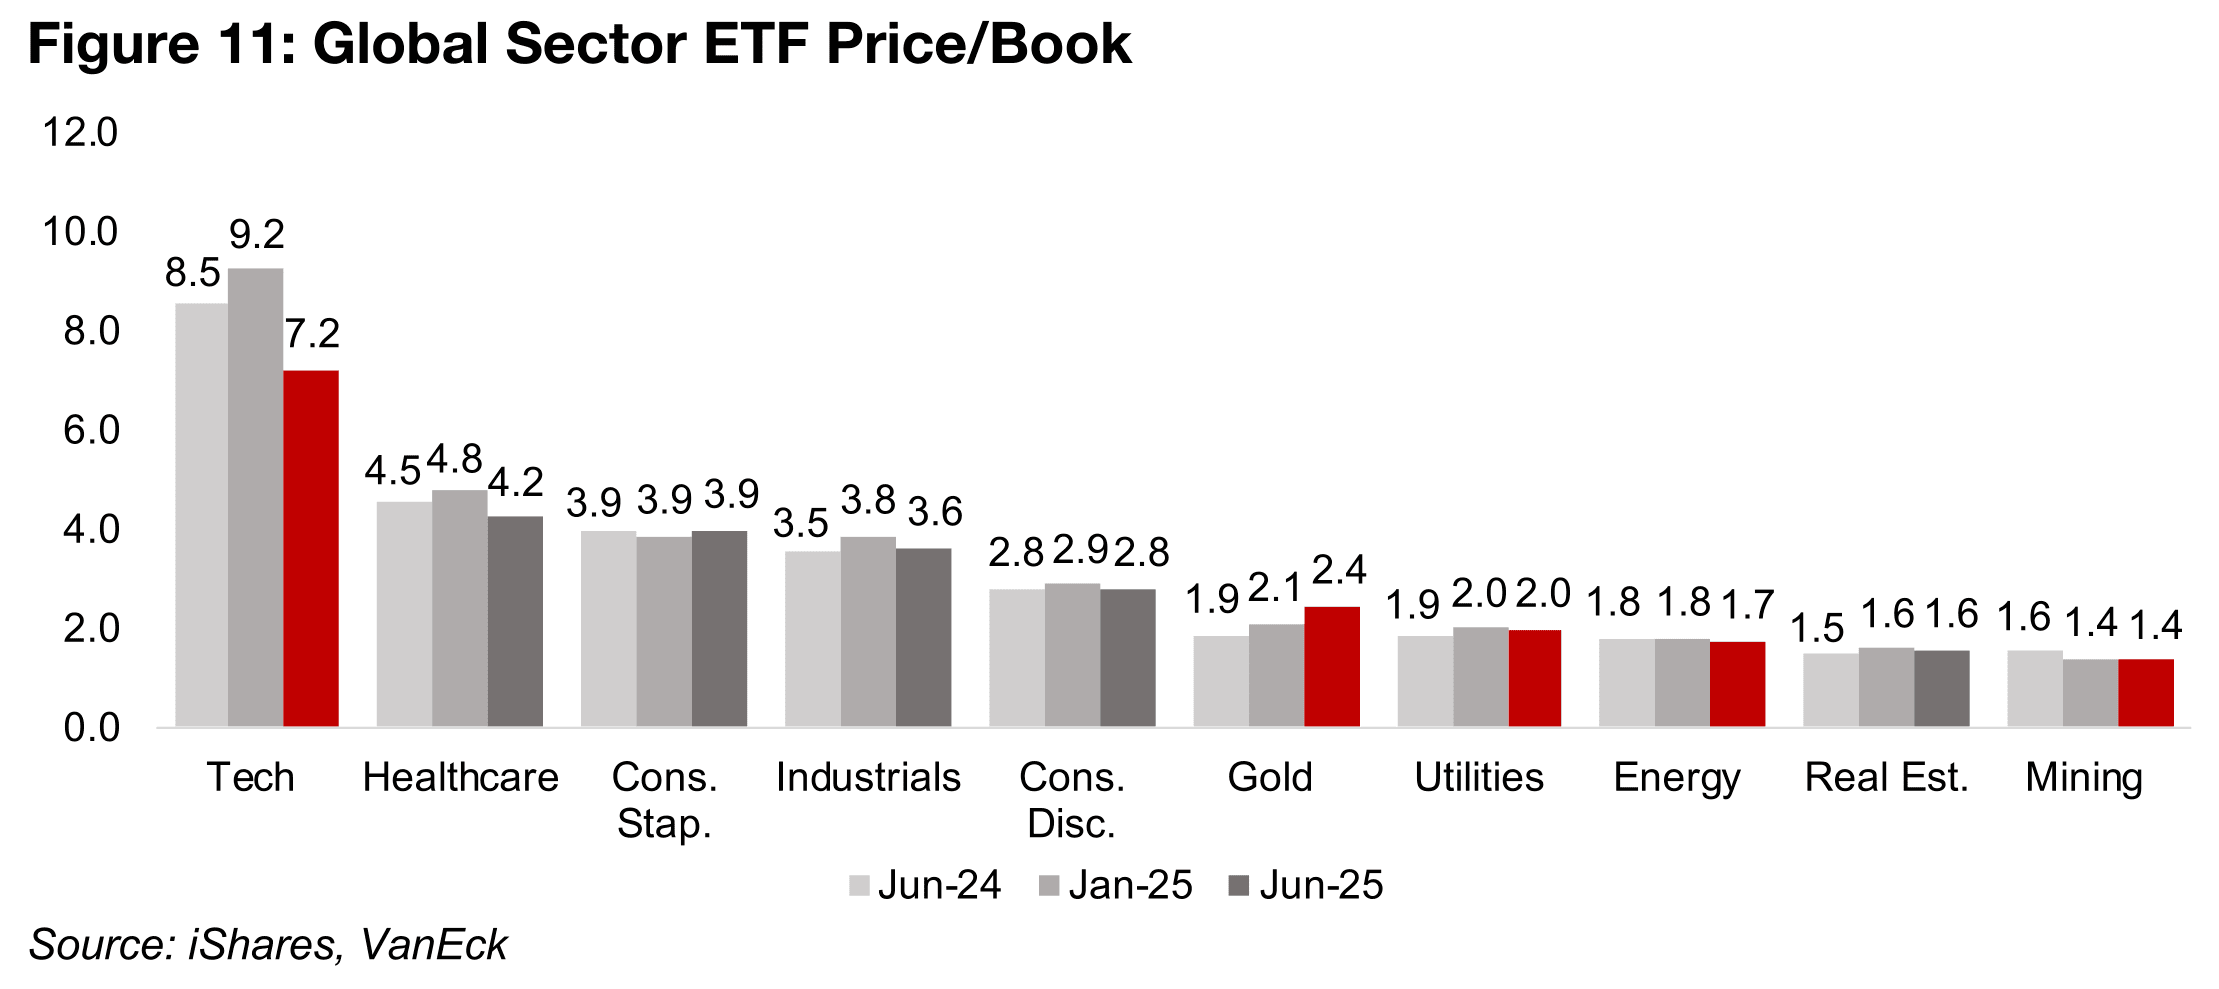
Apart from the surge in the ‘other’ precious metals, platinum and palladium, the rest
of the mining sector is struggling overall, with relatively flat copper and aluminum
prices and weakness in iron ore and many other base metals. The low iron ore price
has especially hit the MSCI Metals and Mining ETF, which has a particularly high
weighting to companies with a large proportion of their revenue from this metal. This
has weighed on its valuations, with a P/B of just 1.4x, down from 1.6x in June 2024.
The energy ETF P/B is also relatively low, at just 1.7x, with only the real estate and
mining sector below it. While a case could be made for an outperformance by the
mining ETF on such a low valuation, the outlook for iron ore is still weak, and there
are risks to copper and other base metals of a decline on low economic growth. This
contrasts with the convincing supply side story now backing the energy sector.
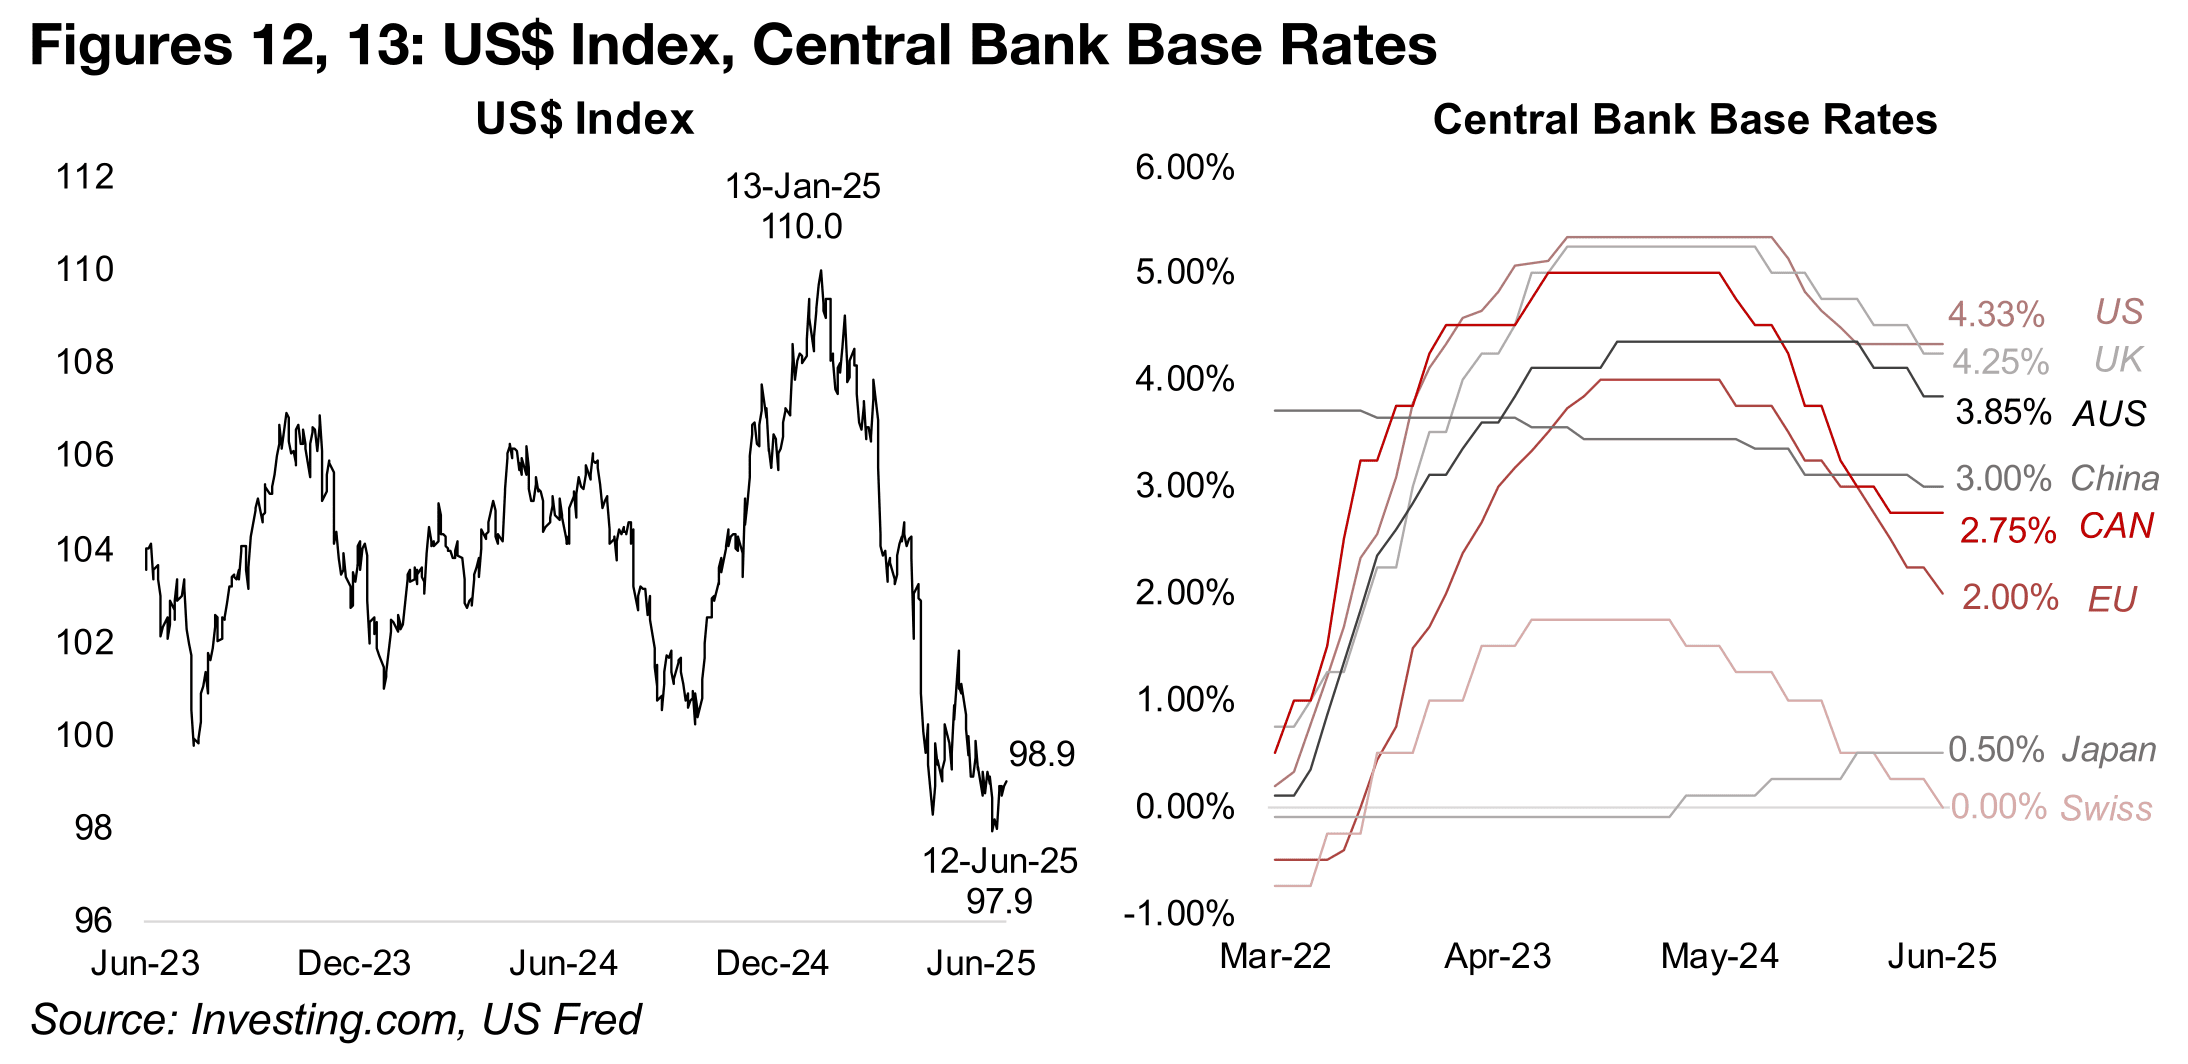
One potential hurdle we see for the gold price is a surprise rebound in the US$ after
the market has been extremely negative on the currency this year. The index slumped
from 110 in January 2025 at a low of 97.9 earlier this month, although it has recovered
moderately to 98.9 (Figure 12). This has come even as the US now has the highest
base rate of any central bank, after holding rates steady at 4.33% at its recent
meeting. This would theoretically be expected to drive global inflows into the US$, as
markets seeks higher yields, all else equal, and the dollar has typically been a safe
haven currency in times of very high risk.
However, all else has clearly not been equal recently, with the US-led trade war the
main driver that has driven down the country’s currency. The market has been
expecting that the huge rise in tariffs could potentially curb US growth, boost its
inflation and overall lead to the country being less attractive to foreign investors. With
such a major collapse of the dollar this year already, a large degree of these market
concerns may have already been priced in. Also, the effect of the tariffs, including
dampening growth and boosting inflation, is likely to be global and could have a
negative effect on other countries.
The UK previously had the highest base rate until April 2025, but it was cut to just
4.25% in May 2025 (Figure 13). Both the US and UK rates are also far higher than all
the other markets, most of which have been on a major cutting cycle. The European
Union has especially seen a major reduction, from 5.0% in May 2024 to just 2.0% as
of their most recent cut this month, taking them from one of the highest rates of the
major central banks to one of the lowest. The Swiss National Bank is now the lowest,
after a cut this month to zero percent, although they had much lower rates throughout
the recent cycle, with a peak at only 1.75.
In Japan, rates have actually risen, to 0.50%, which is relatively rare for a country
mainly mired in deflation for the past thirty years. While China’s rates have declined,
the pace has been more moderate, down from 3.30% in 2022 to 3.00% currently.
The rates of the other major central banks, Australia and Canada, have also dropped
significantly below US rates, at 3.85% and 2.75%. Even given the increased risks the
market expects for the US$, this widening interest rate differential seems eventually
likely to start to draw funds back to the country.
The only major US$ alternative in terms of the size and convertibility is the Euro. The
absolute size of the Yen currency base is much smaller than that of the US$ and the
Euro, and Chinese Yuan has a closed capital account, meaning that the flow of the
currency in and out of the country is strictly controlled. While the Yuan is used
increasingly widely for global transactions, and this is likely to grow over time, its
international use currently remains relatively limited. So the Euro is the main option
to the US$ for a safe haven global reserve currency.
However, it does not seem likely that the ongoing trade wars and hot wars will leave
Europe unscathed relative to the US and it is not clear that the Euro is an obviously
superior alternative, especially with interest rates at half the level of the latter. Overall
we believe that there is a case for a rebound in the US$ this year, and this could
potentially weigh on the gold price. Markets are also already becoming more
interested in alternatives like platinum, palladium and silver, which look relatively less
expensive. While this all might not necessarily drive a major collapse in gold, with the
market overall still clearly bullish on the metal, it could see it remain relatively flat,
possibly within the recent trading range.
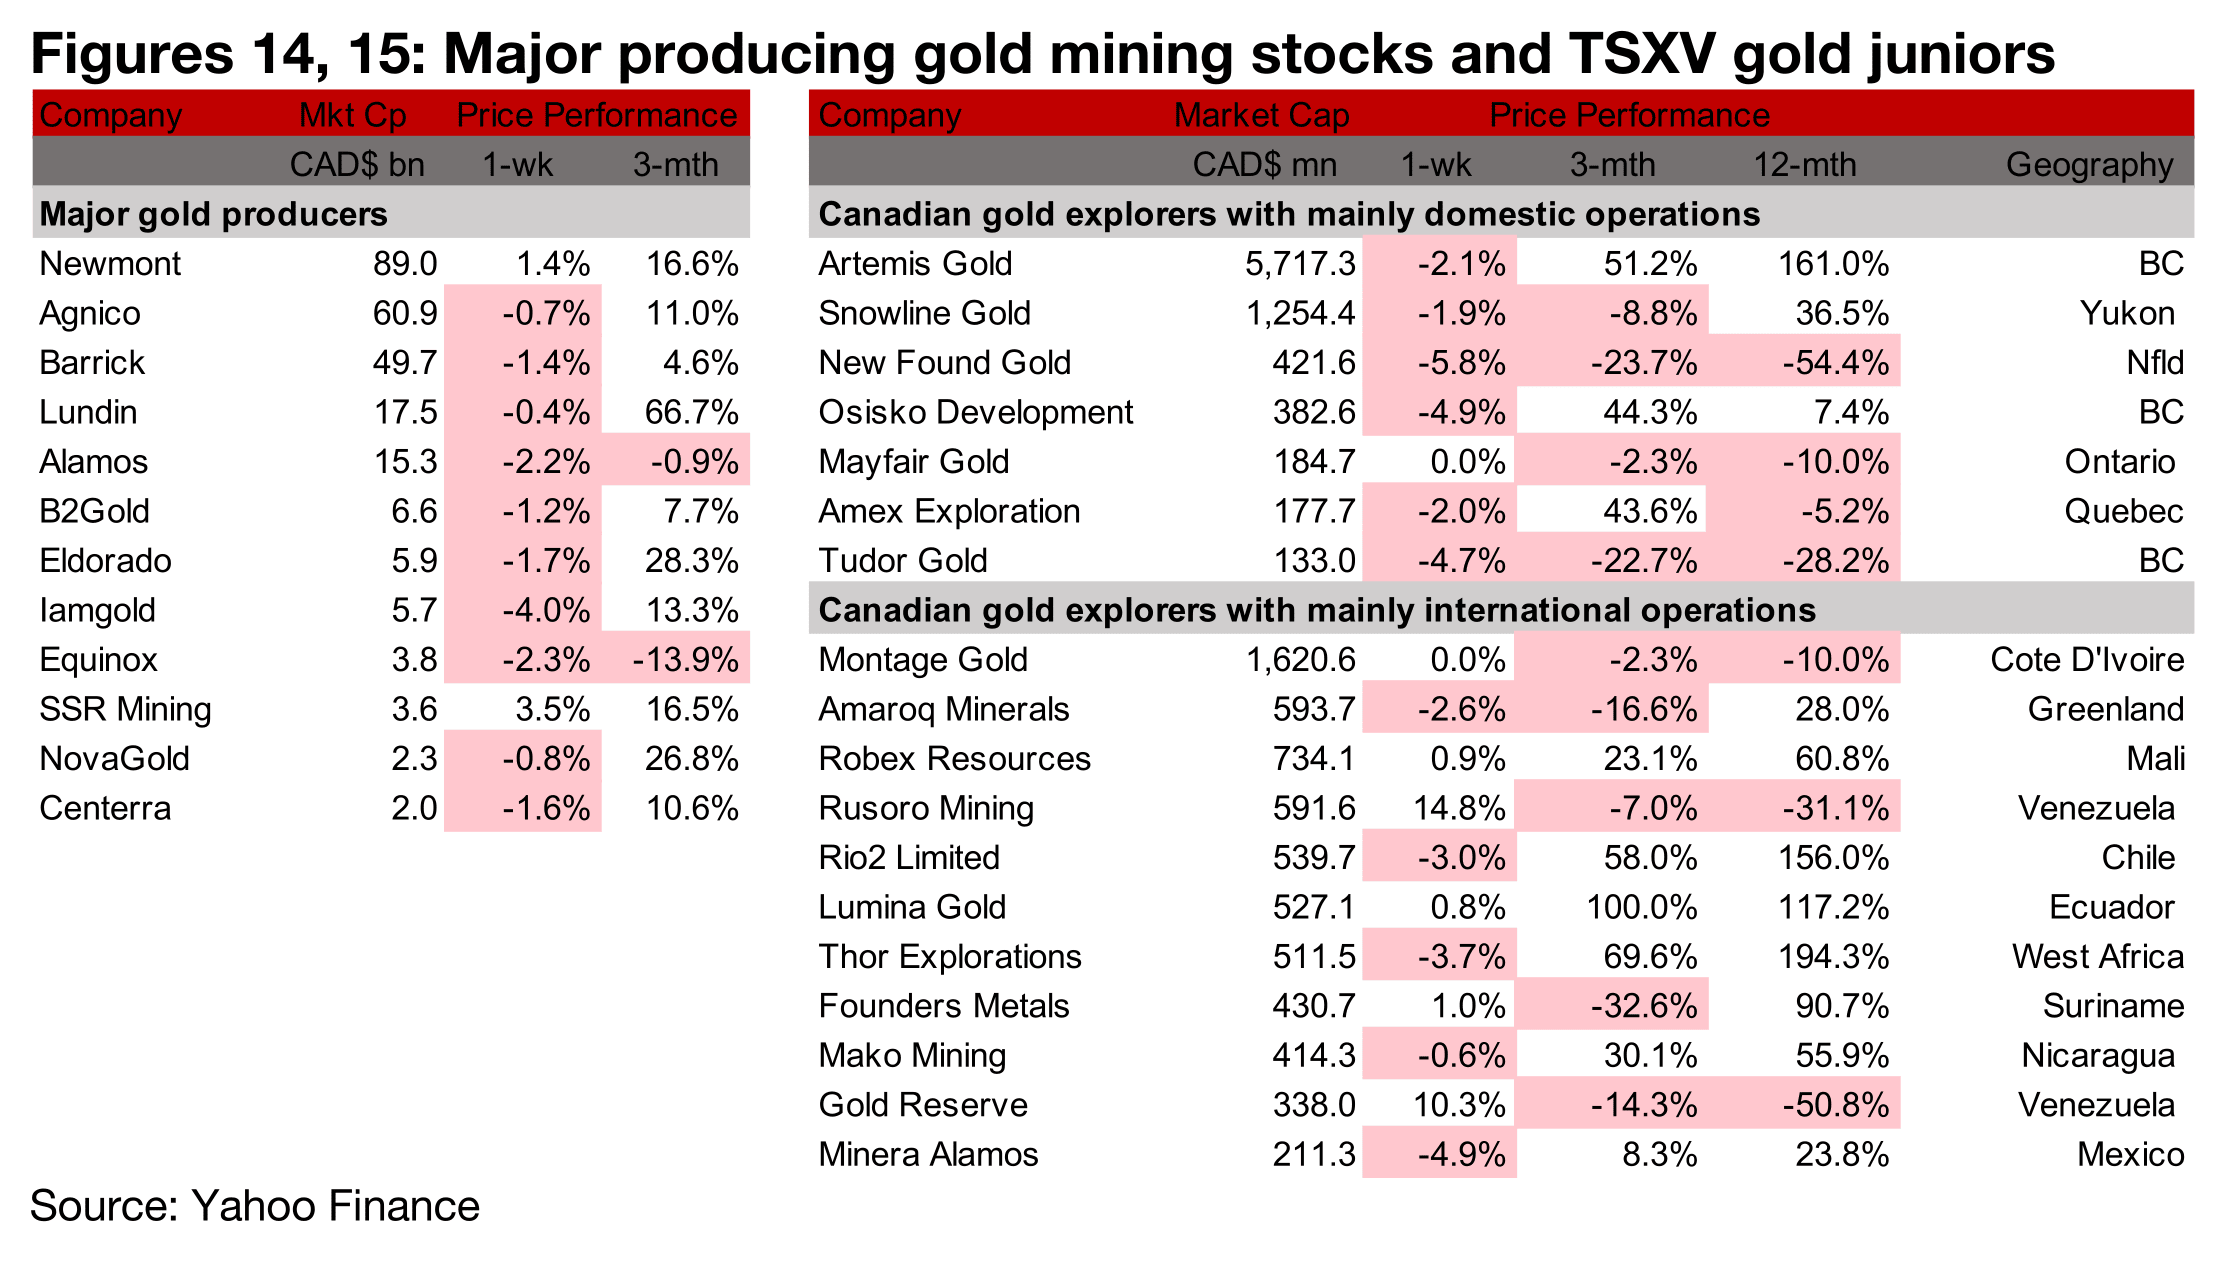
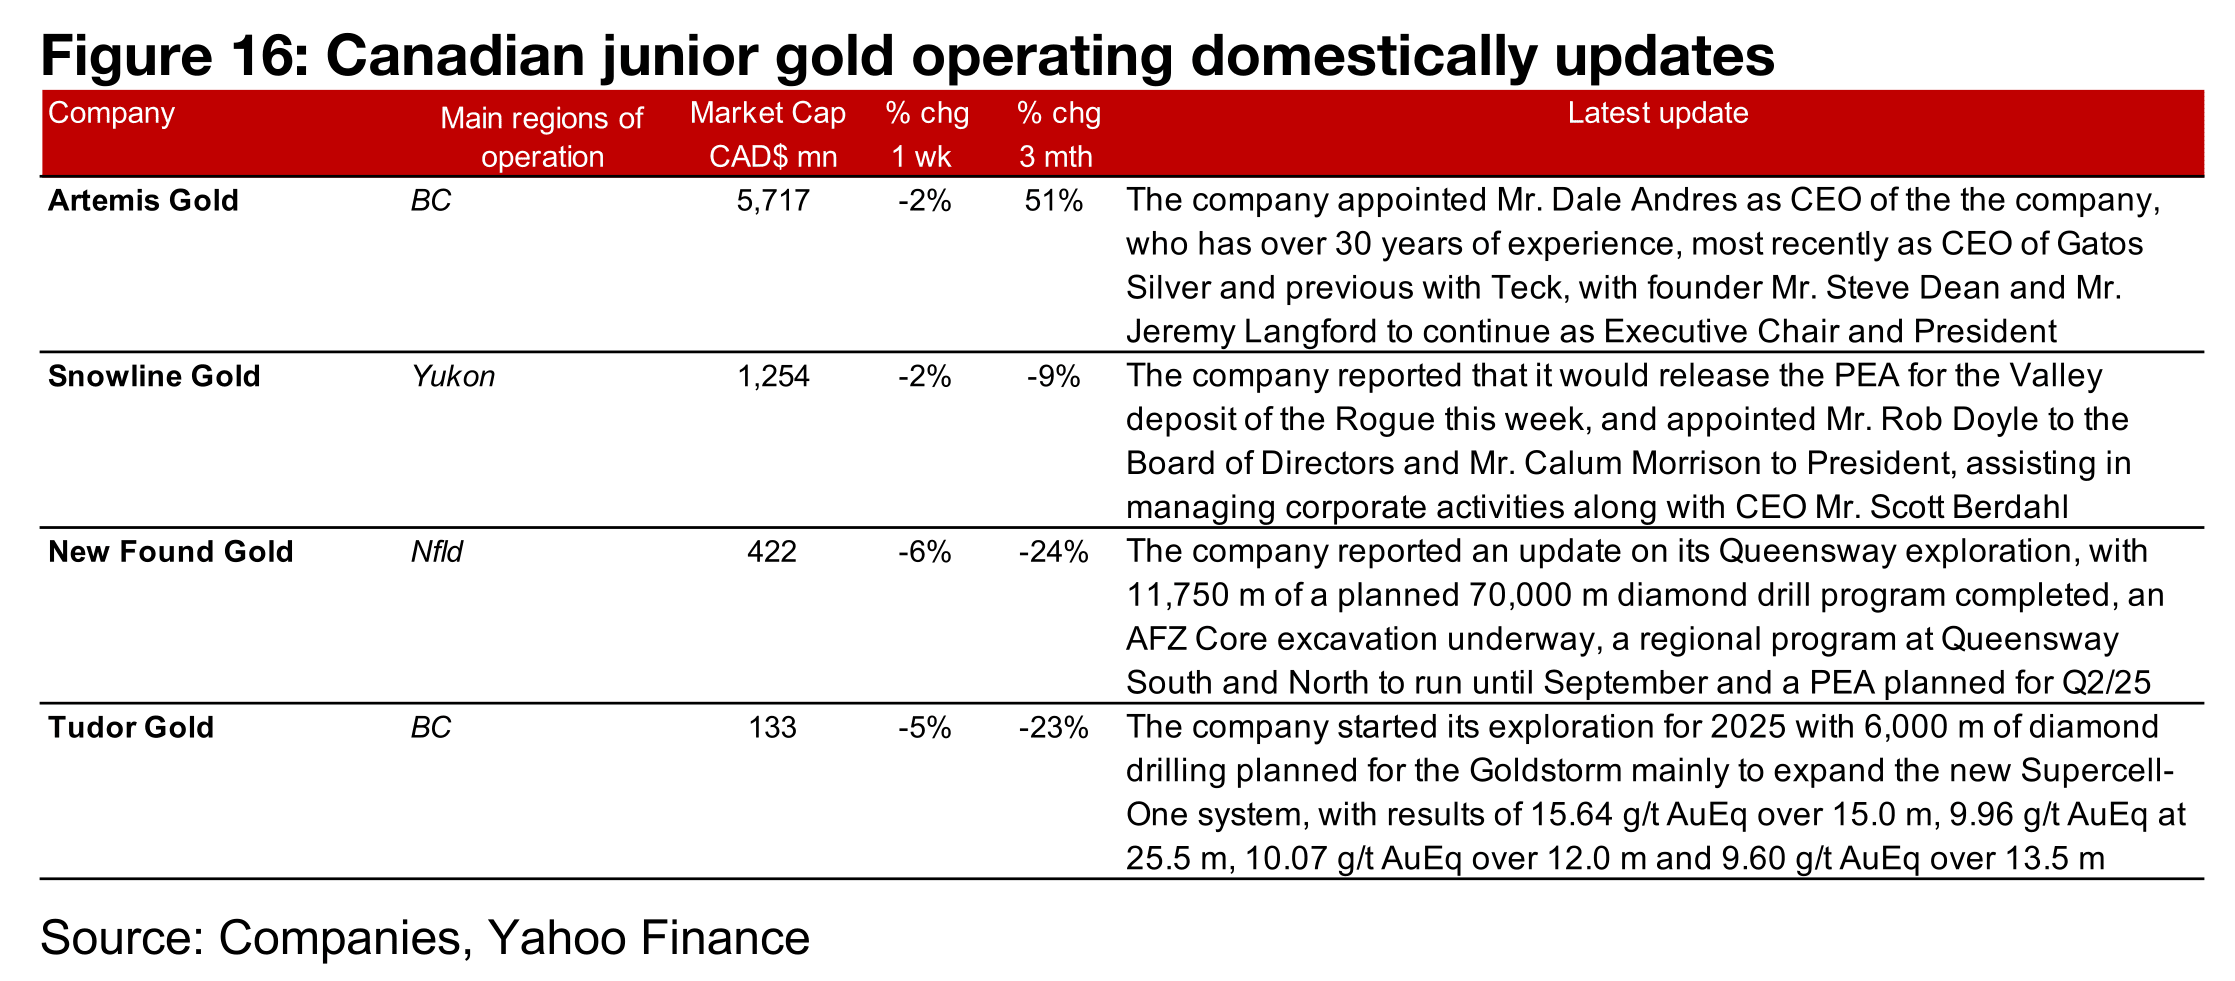
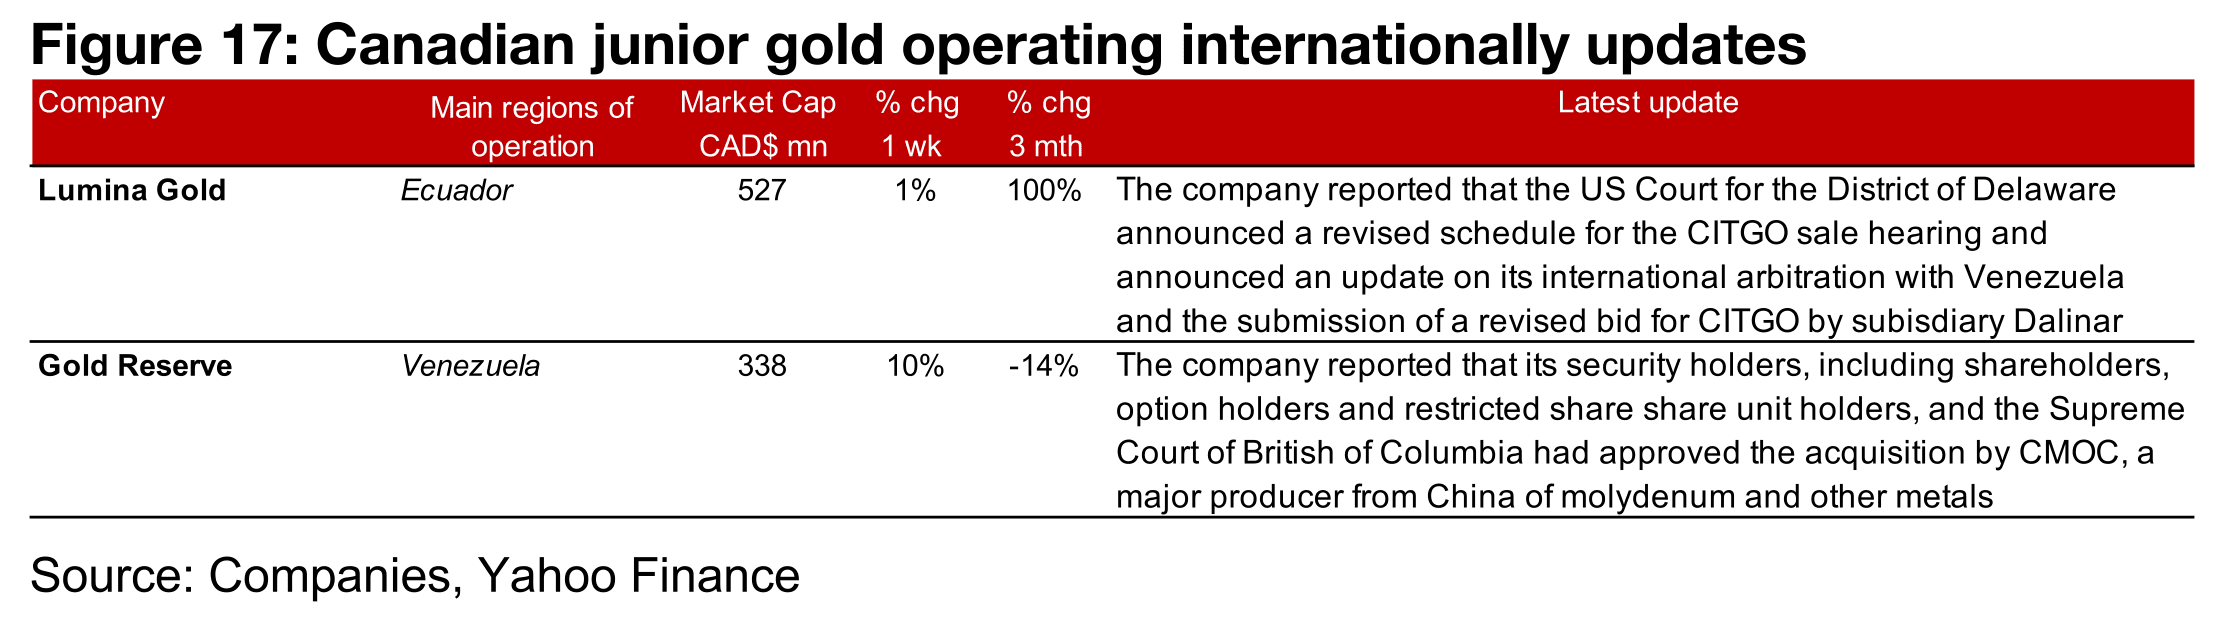
Most of the major producers and TSXV gold declined on the drop in the gold price (Figures 14, 15). For the TSXV gold companies operating mainly domestically, Artemis Gold announced new management appointments, including a new CEO, as did Snowline, which also reported that it would release the PEA for the Valley deposit of Rogue this week. New Found Gold and Tudor Gold provided updates on their exploration programs for Queensway and the Goldstorm deposit at Treaty Creek (Figure 16). For the TSXV gold companies operating mainly internationally, Lumina Gold reported that its acquisition by CMOC had been approved by its shareholders and the B.C. Supreme Court and Gold Reserve reported an update on the ongoing sale process of CITGO including court decisions of timelines and on its international arbitration by ICSID with Venezuela (Figure 17).
Disclaimer: This report is for informational use only and should not be used an alternative to the financial and legal advice of a qualified professional in business planning and investment. We do not represent that forecasts in this report will lead to a specific outcome or result, and are not liable in the event of any business action taken in whole or in part as a result of the contents of this report.
Author
Ben McGregor authors the Weekly Roundup at CanadianMiningReport.com, providing sharp analysis of the metals and mining sector. With a talent for spotting trends, Ben distills complex market shifts into clear, engaging insights on TSXV junior miners. His weekly updates cover gold, copper, uranium, and more, blending data-driven perspectives with a knack for identifying opportunities. A vital resource for investors, Ben’s work navigates the dynamic junior mining landscape with precision.