

July 13, 2026
Gold declined -1.8% to US$4,144/oz on new Middle East attacks, with markets putting more weight on potentially higher oil prices driving rate hikes and increased yields, and less on the metal as a hedge against inflation and geopolitical risk.
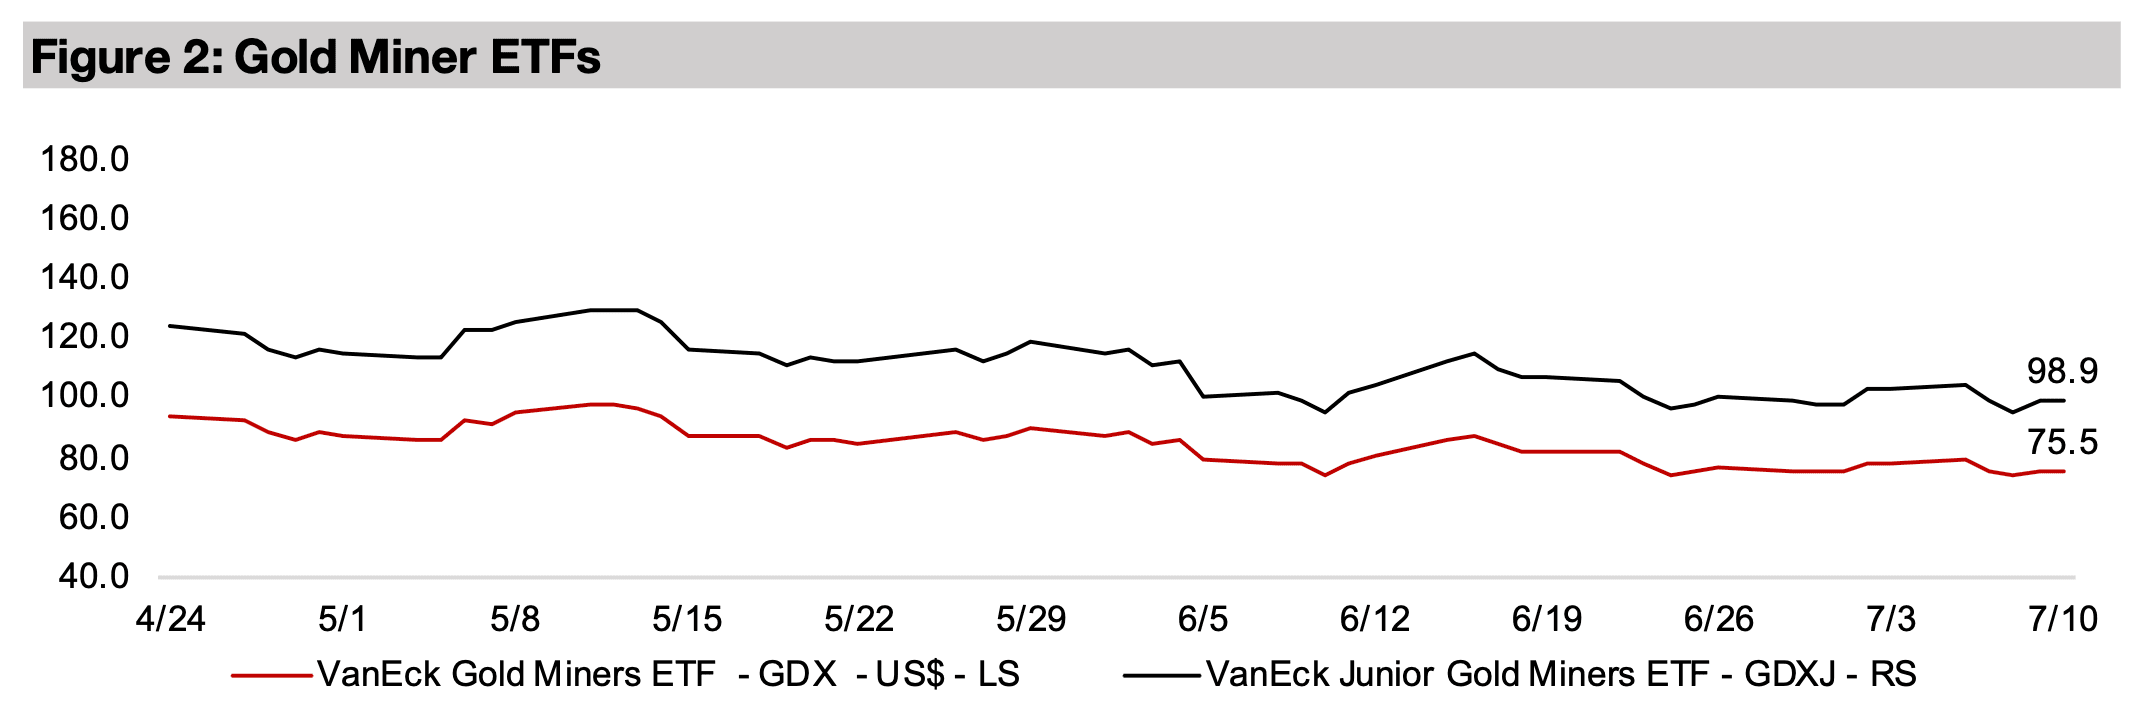
The gold stocks declined on the drop in the metal, with the GDX down -3.7% and GDXJ losing -3.9%, underperforming large caps, with the S&P 500 up 0.9% and Nasdaq rising 1.1%, although small caps declined with the Russell 2000 down -0.6%.


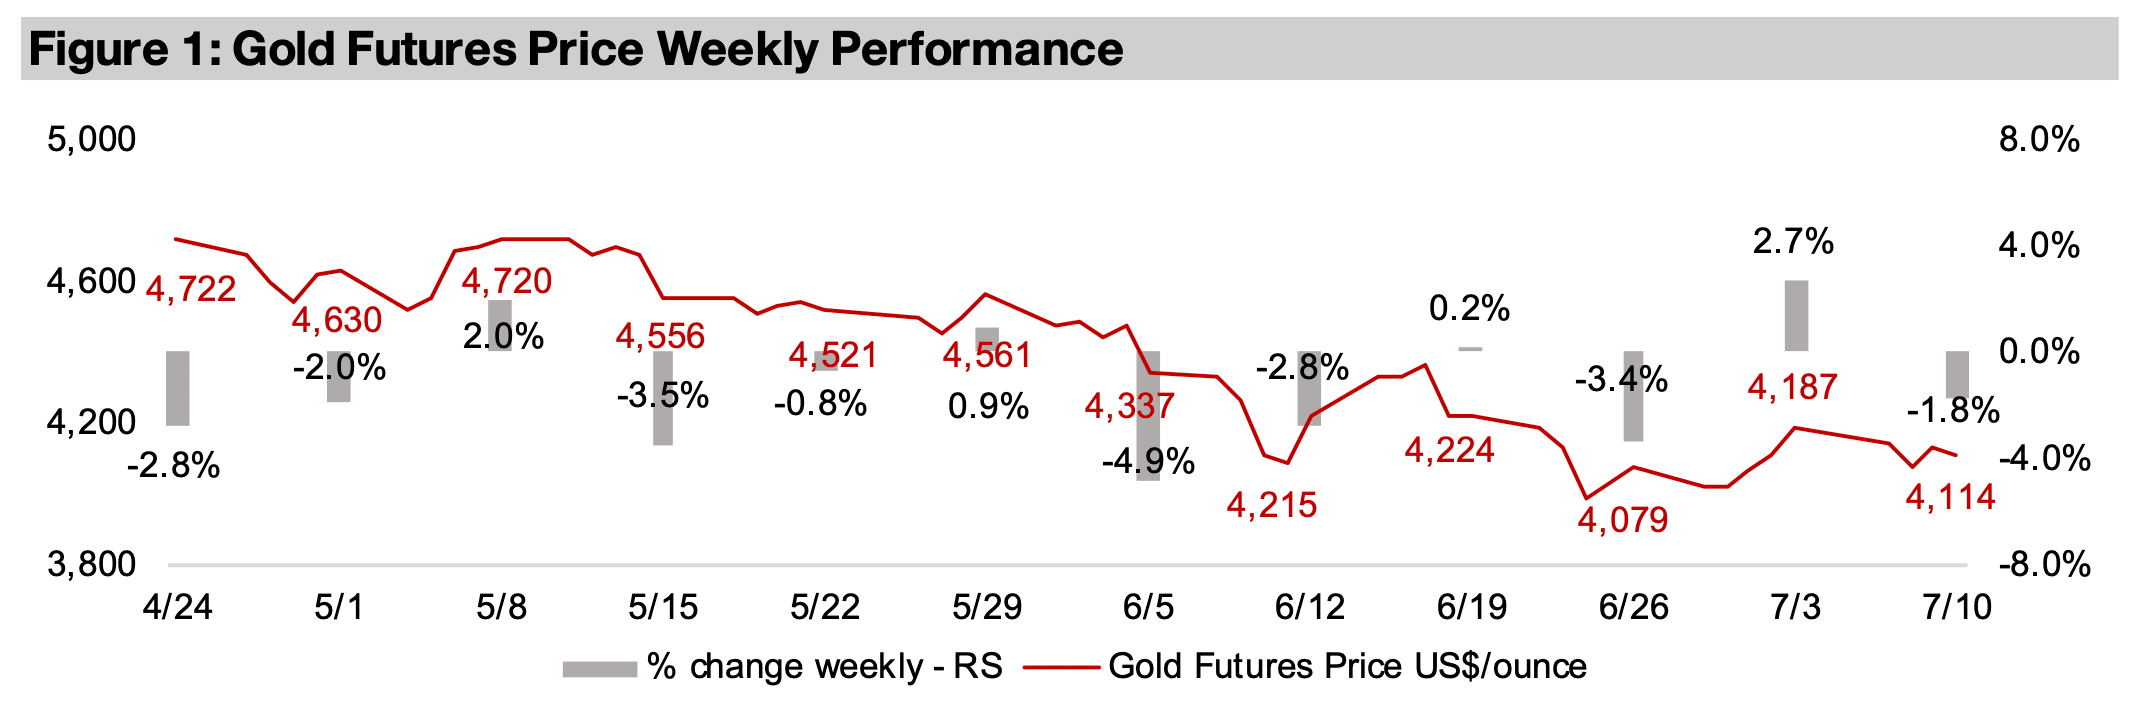
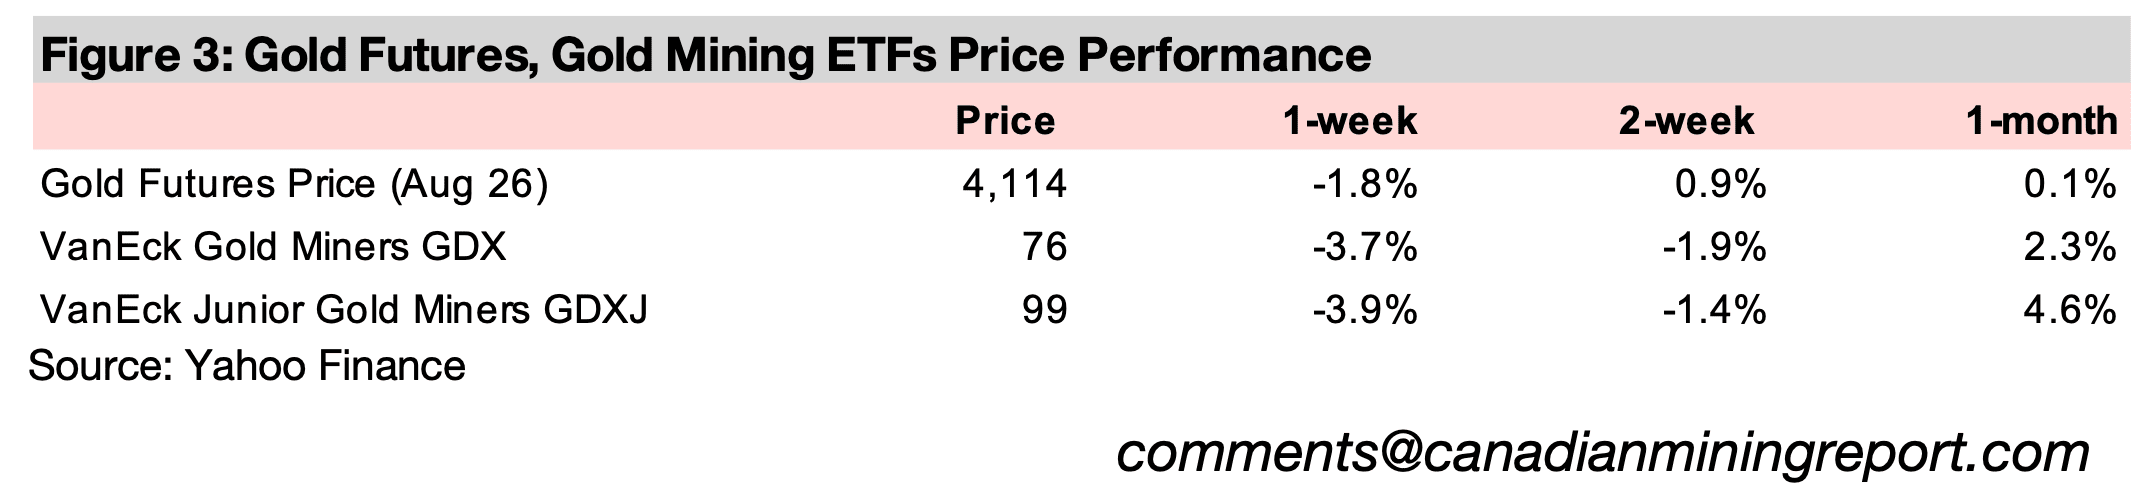
The gold price fell -1.8% to US$4,114/oz as conflict in the Middle East resumed.
While this will actually have had a mixed effect on key drivers affecting the metal, the
market was clearly putting more weight on the factors that that would indicate
downside pressure. The main concern appears to have been that oil prices would
jump again, with Brent crude up 5.3% this week, implying that inflation could continue
to increase. This could be viewed in two ways for gold, the first being that the inflation
prompts rate hikes by the Fed and potentially other central banks, increasing real
yields, making the opportunity cost of holding yield-less gold higher and driving down
the metal price. The US 10-year yield did jump significantly this week, rising 1.6% to
5.6%, its highest since May 2026.
However, a second effect of expected inflation for gold is that it can rise as a hedge
against it, although for now the market seems to expect the first effect to dominate.
Potentially higher US rates could also boost the currency, which tends to move
inversely to gold, although the dollar was more subdued than bond yields, edging up
only 0.13% this week. The other issue that presumably should have been supporting
gold is the sudden spike in geopolitical risk, which in recent years would have likely
driven up the metal. However, it could be that the market had already been pricing in
the recent peace in the Middle East as relatively tentative, and that the restarted
conflict was not actually considered a major shock.
The large cap US equity markets did not drop on either the implied expectations for
higher rates or the rise in geopolitical risk, which again indicates that both of these
may have already been price in by markets. The S&P 500 rose 0.9% and the Nasdaq
gained 1.1%, although there was some degree of risk-off as small caps declined, with
the Russell 2000 down -0.6. While US tech was not hit this week, there was continued
sign of difficulty for the global tech bubble, especially in South Korea. The country’s
KOSPI Index, which has been driven especially by some major semiconductor stocks,
plunged another -14.0% this week, and is now down -25.3% from its late June 2026
peak. The gold stocks declined on the drop in the metal price, with the GDX down -
3.7% and GDXJ losing -3.9%.
Looking at gold’s ratio’s versus other key commodities this year seems to point to a
major rebalancing this year of several price relationships that had moved substantially
away from their medium-term averages especially in 2025 and early 2026. These
ratios have now returned towards these recent historical averages, indicating perhaps
that the previous volatile price action in some of the assets have cooled and that there
is some degree of shift away from speculation and more of a return to fundamentals.
This seems to indicate that the drop in the gold price to around US$4,000/oz has
brought markets more in balance, and the move towards US$5,000/oz or higher was
probably getting unsustainable, at least in the short-to-medium term.
The gold to silver ratio is certainly an example of this, with a huge spike in the ratio in
early last year through to a peak of 104.7x in April 2025 as the gold price soared, far
above the 2021-2026 average of just 80.1x, with a silver boom in late 2025-early 2026
seeing this reverse severely to just 45.9x (Figure 4). The declines in these metals this
year have seen the ratio rise to 69.9x, or reasonably close to the medium-term
average, and the end to the highly speculative periods for both metals earlier this year
probably actually point to healthier markets overall.
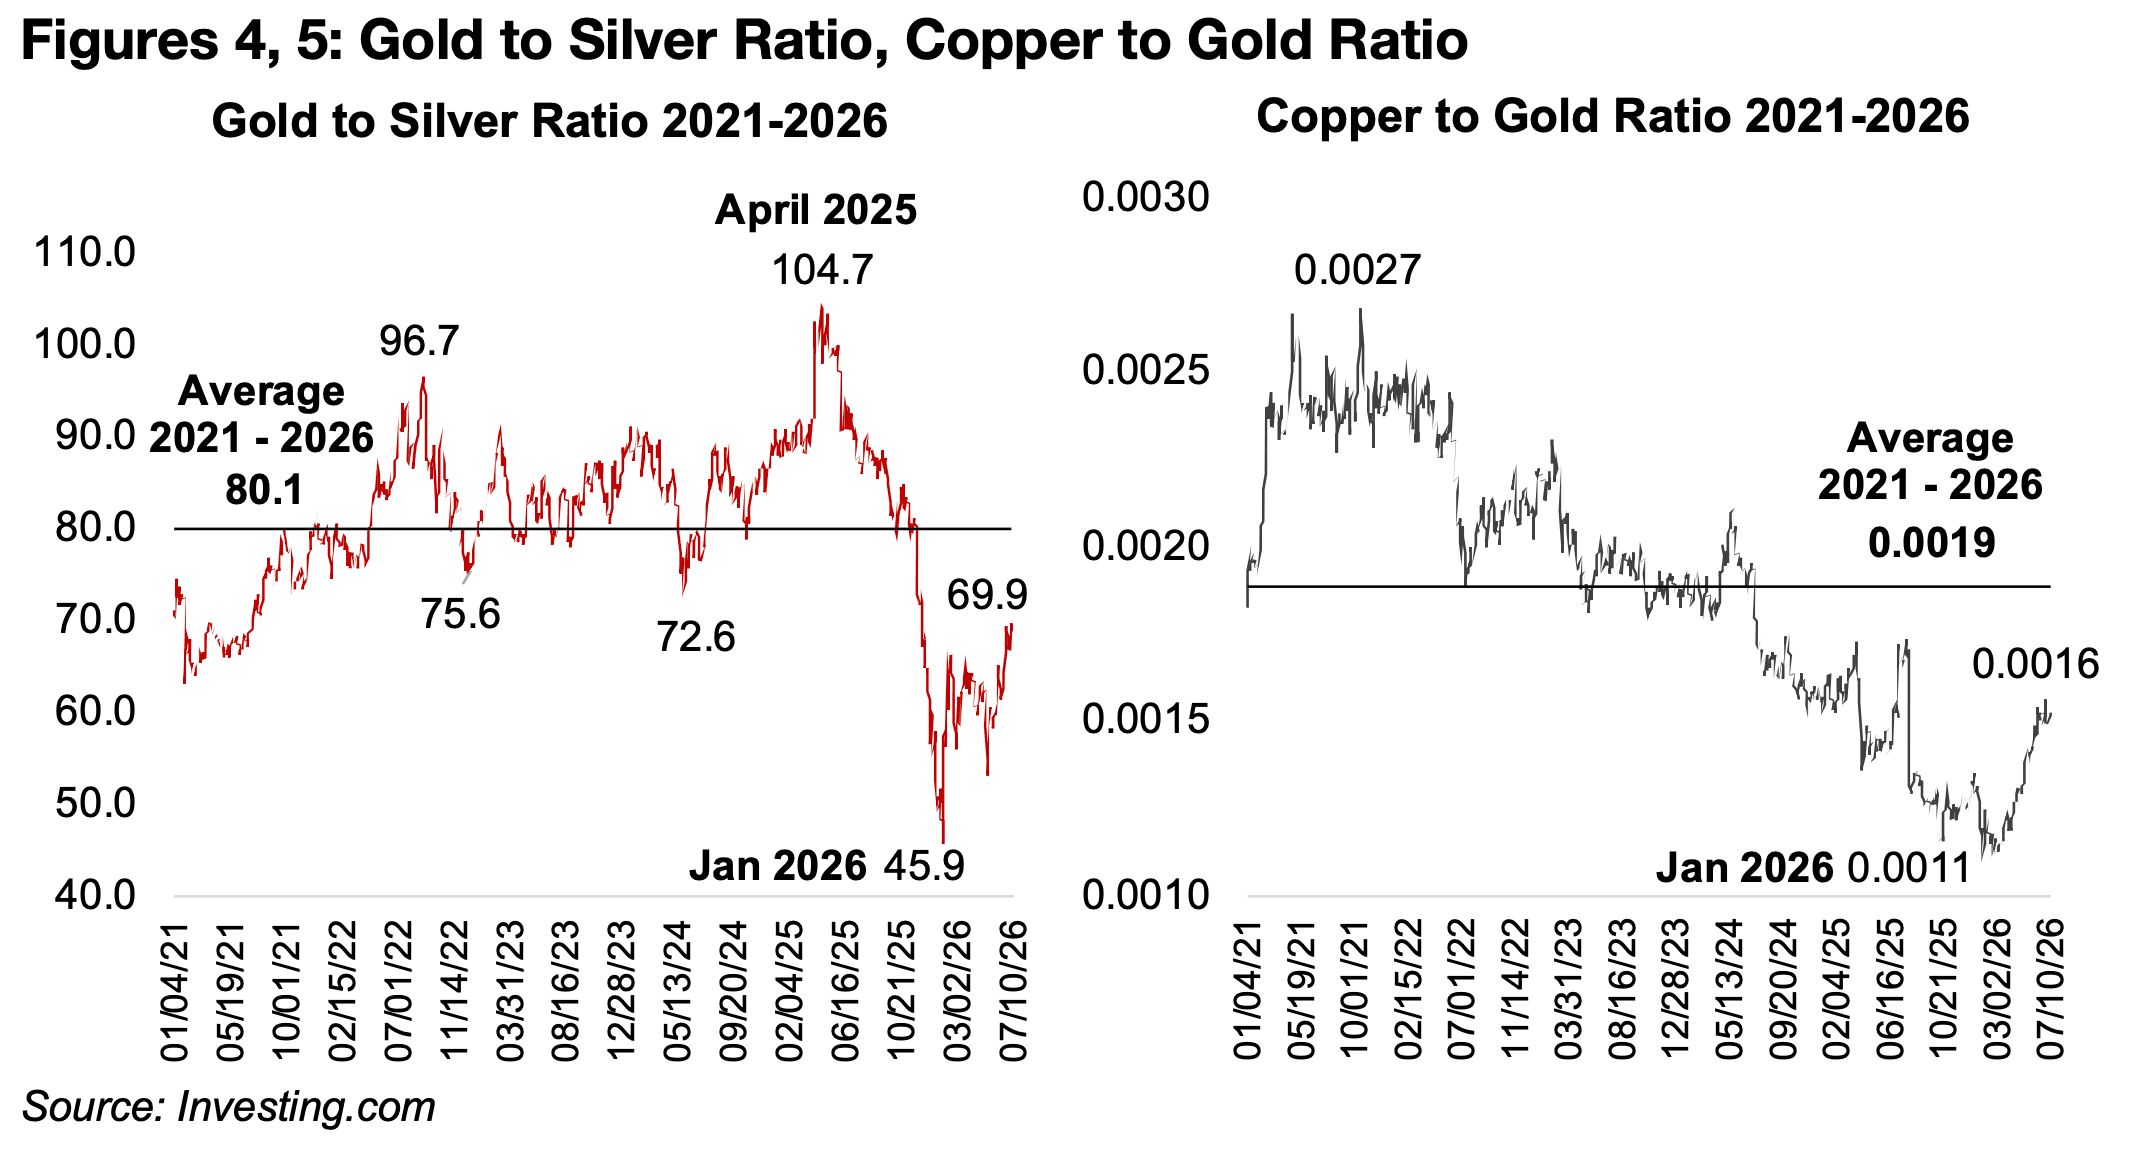
The copper to gold ratio has also started to move back towards its medium-term
average of 0.0019, after dipping as far below it as 0.0011 in January 2026, as gold
surged and copper was relatively flat (Figure 5). The copper price has risen especially
since around March 2026, while gold has declined, returning the average to 0.0016.
However, we note that this is somewhat distorted, as the ratio is based on the US
CME copper futures price, which has seen a huge jump in its spread over the UK
LME price to around 6.0% over the past month.
This has been driven by expectations that the US could implement additional tariffs
on the metal, leading traders to stockpile the metal in the country in advance of the
potential tariffs. While the US Department of Commerce submitted its review of the
copper market to the government on June 30, 2026, and some increase in tariffs
reportedly recommended, the final decision from the government has yet to be
announced. If we take the ratio instead based on the LME price, it has also risen, but
not by as much, to 0.0014. The decision from the US could drive considerable
volatility in the copper price, especially if any actual tariffs imposed are quite low, as
the CME to LME price differential indicates markets expect them to be substantial.
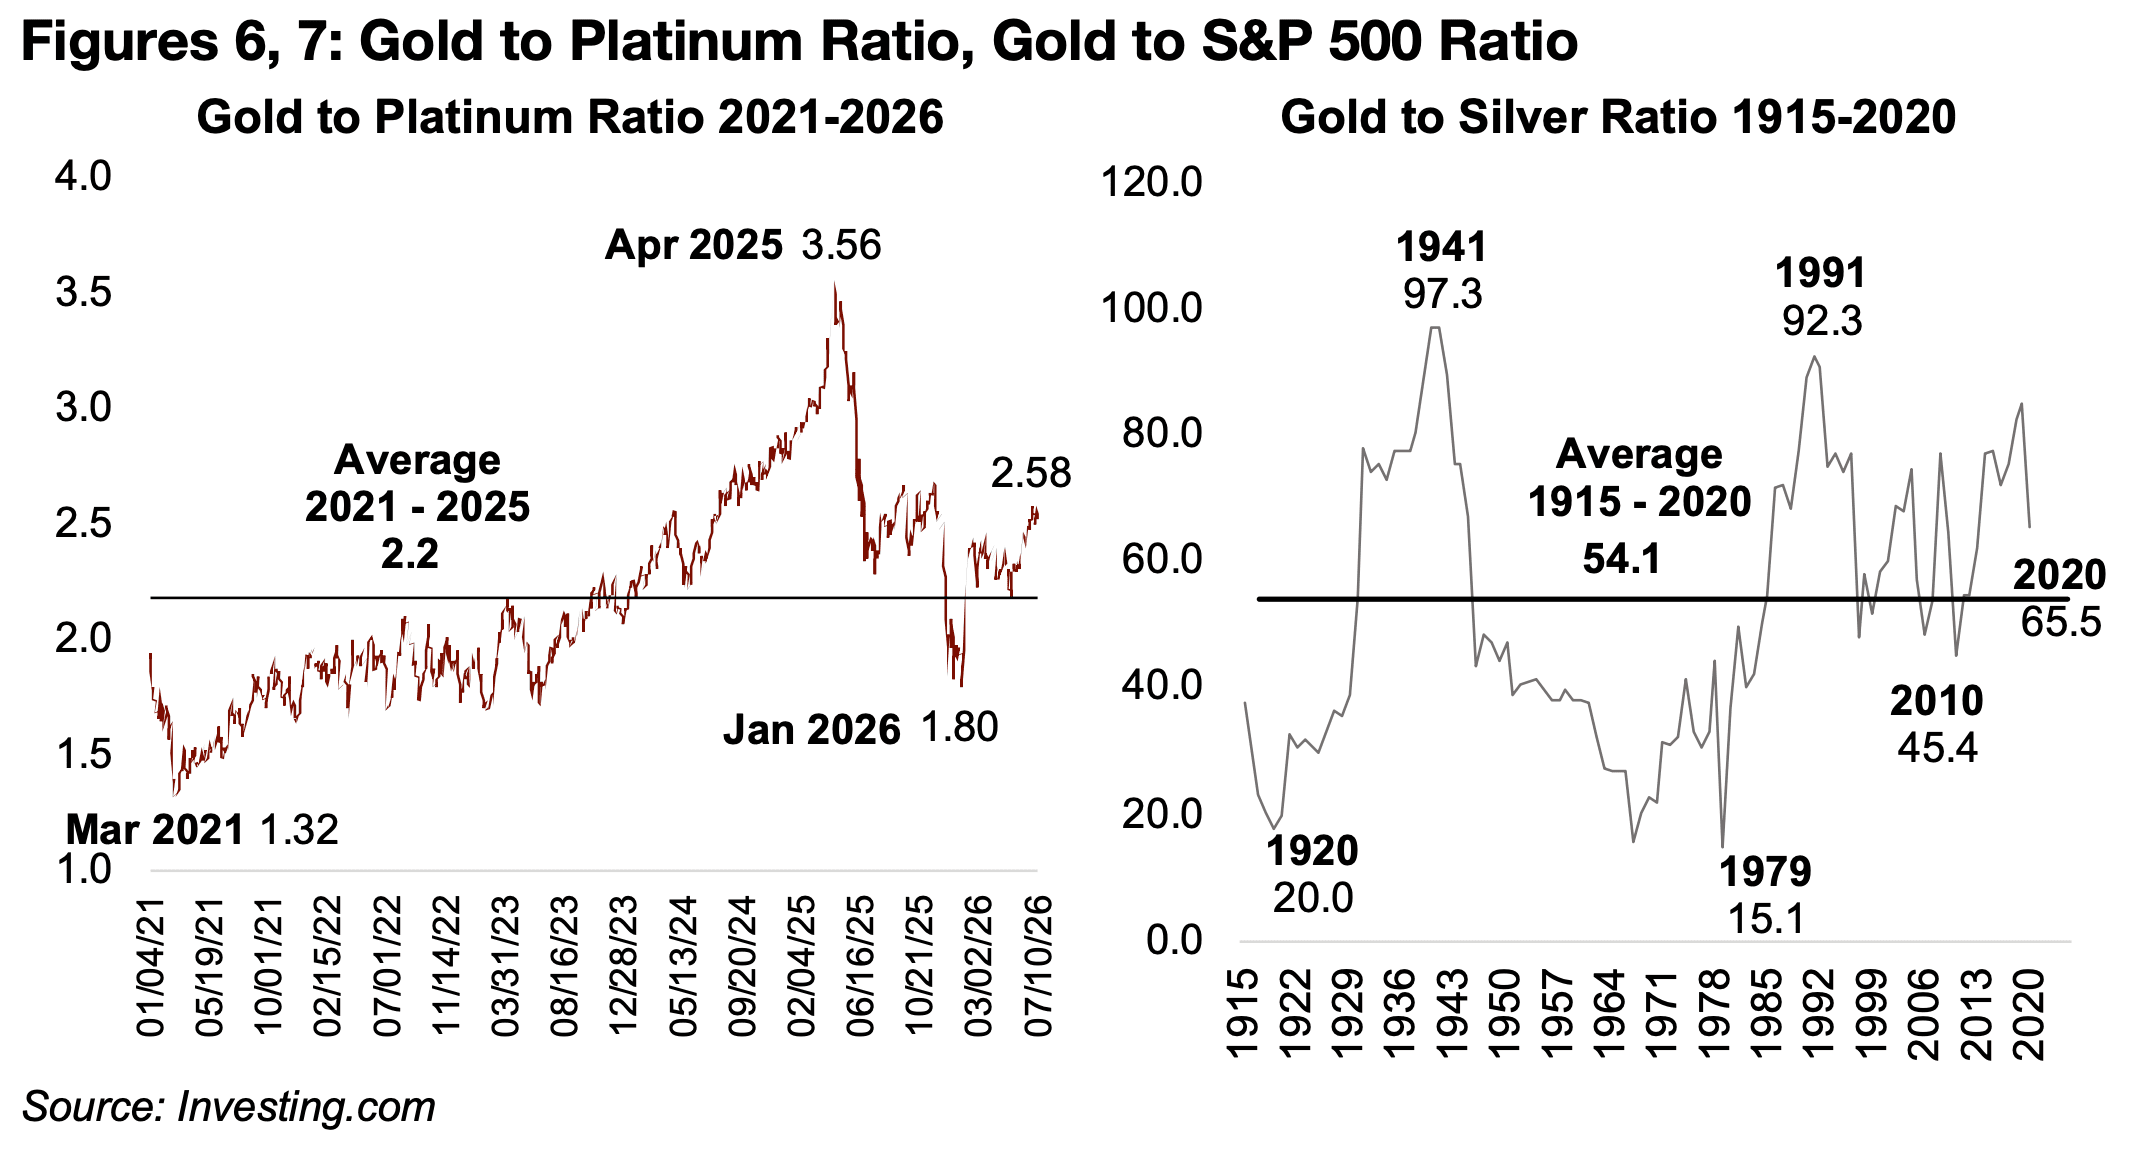
The gold to platinum ratio has returned to near its 2.2x medium-term average from March 2026 to June 2026 after a jump to 3.56x in April 2025 and drop to 1.80x in January 2026, although it has risen somewhat to 2.58x over the past month (Figure 6). The gold to silver ratio average in recent years is still elevated compared to the long-term average of 54.1x, although this could be from long-term structural changes in the markets (Figure 7). The copper to gold ratio average long-term, at 0.0020x from 1980 to 2020, is almost exactly inline with the 0.0019x 2021-2026 average (Figure 8).
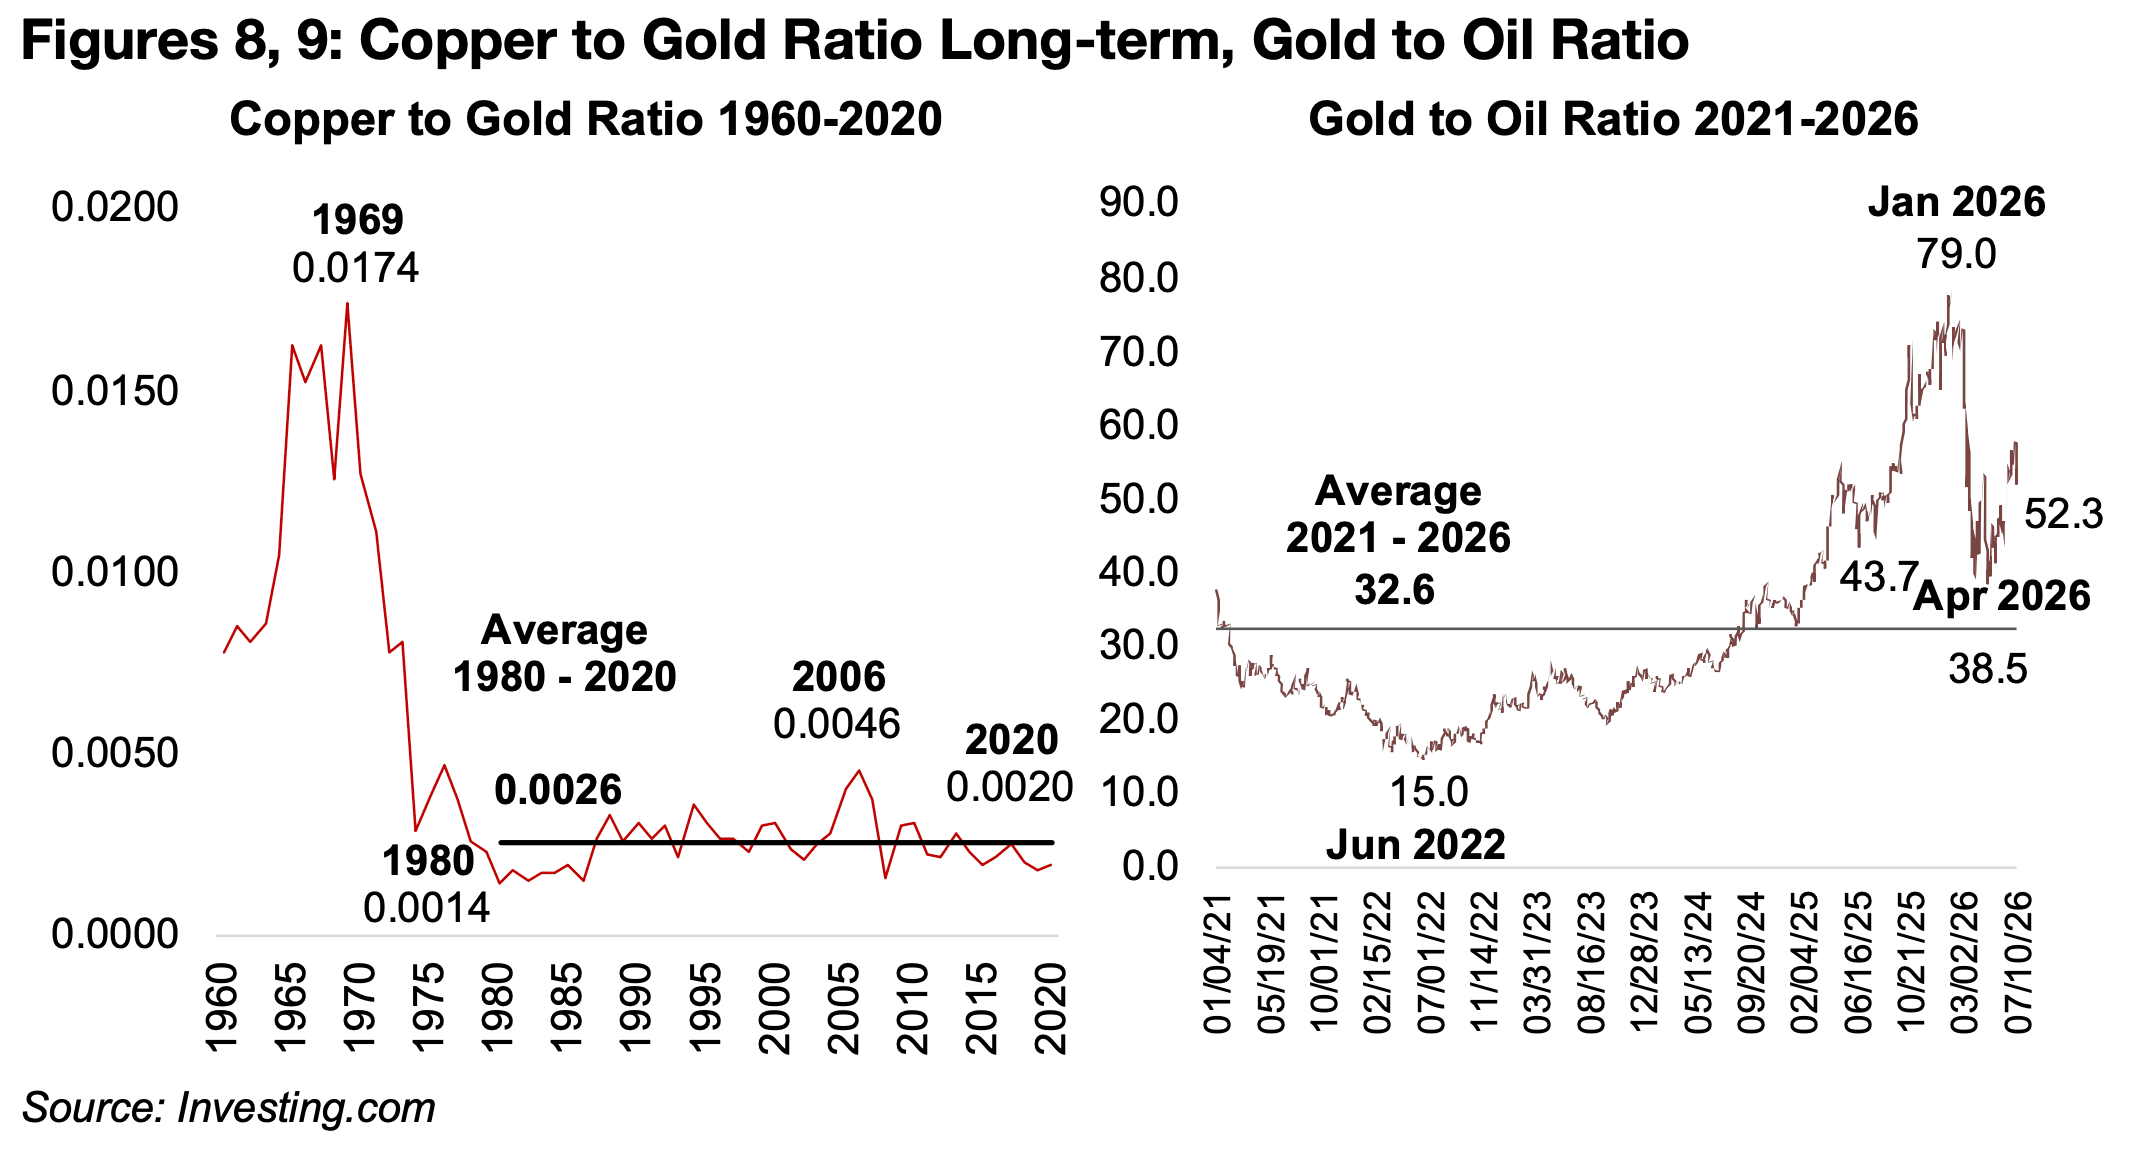
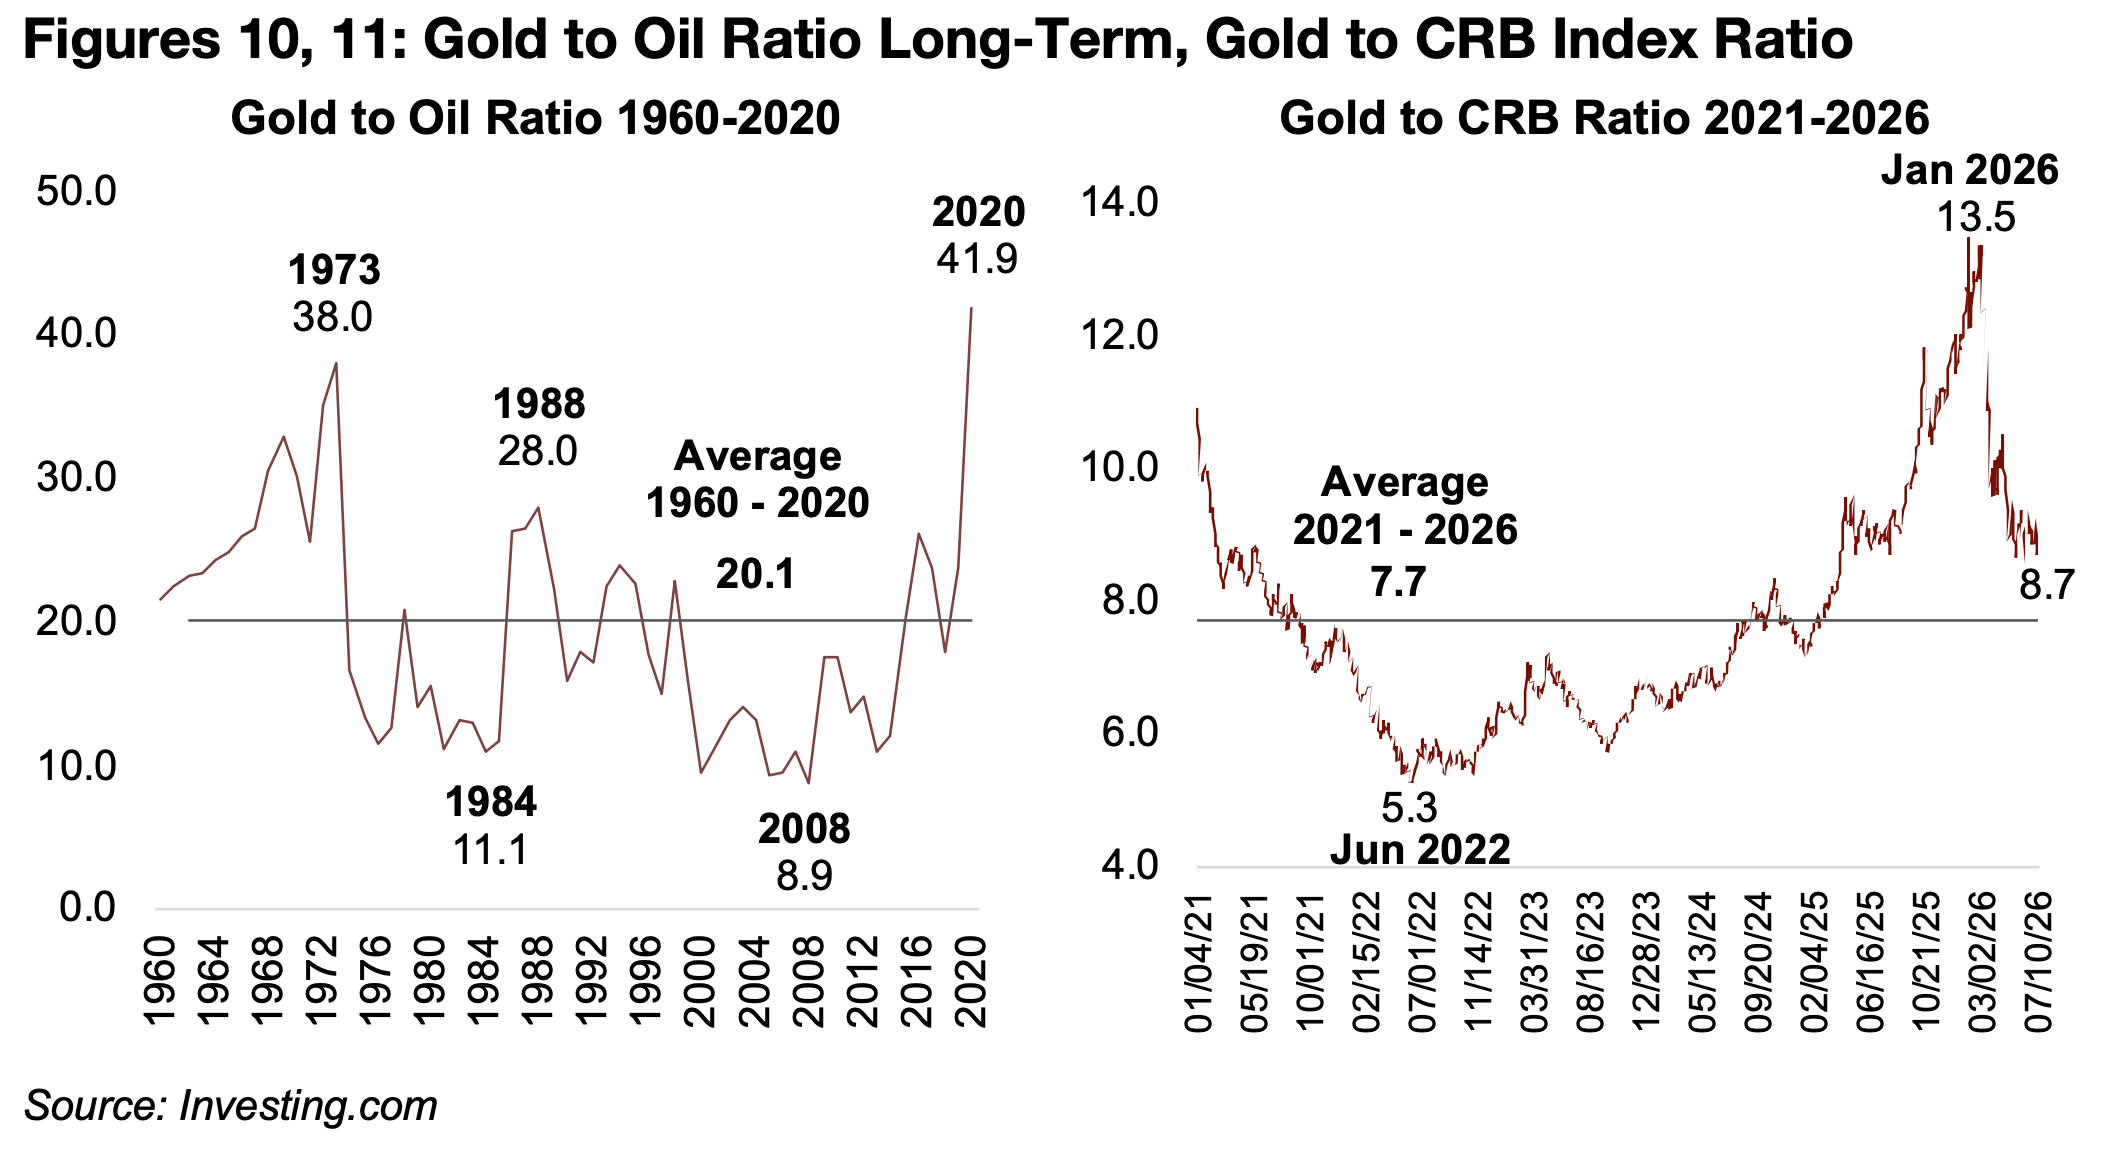
The Middle East war has driven a major drop in the gold to oil ratio, to as low as 43.7x in April 2026, reasonably close to the medium-term average of 32.6x, especially after the spike to 79.0x in January 2026 (Figure 9). While this is still relatively high compared to the long-term average from 1960 to 2020 of 20.1x, it seems to imply more balanced recent pricing between the assets (Figure 10). The gold to commodities ratio, using the CRB Index, has declined to 8.7x, moderately above its 7.7x medium average, down from 13.5x in January 2026 (Figure 11).
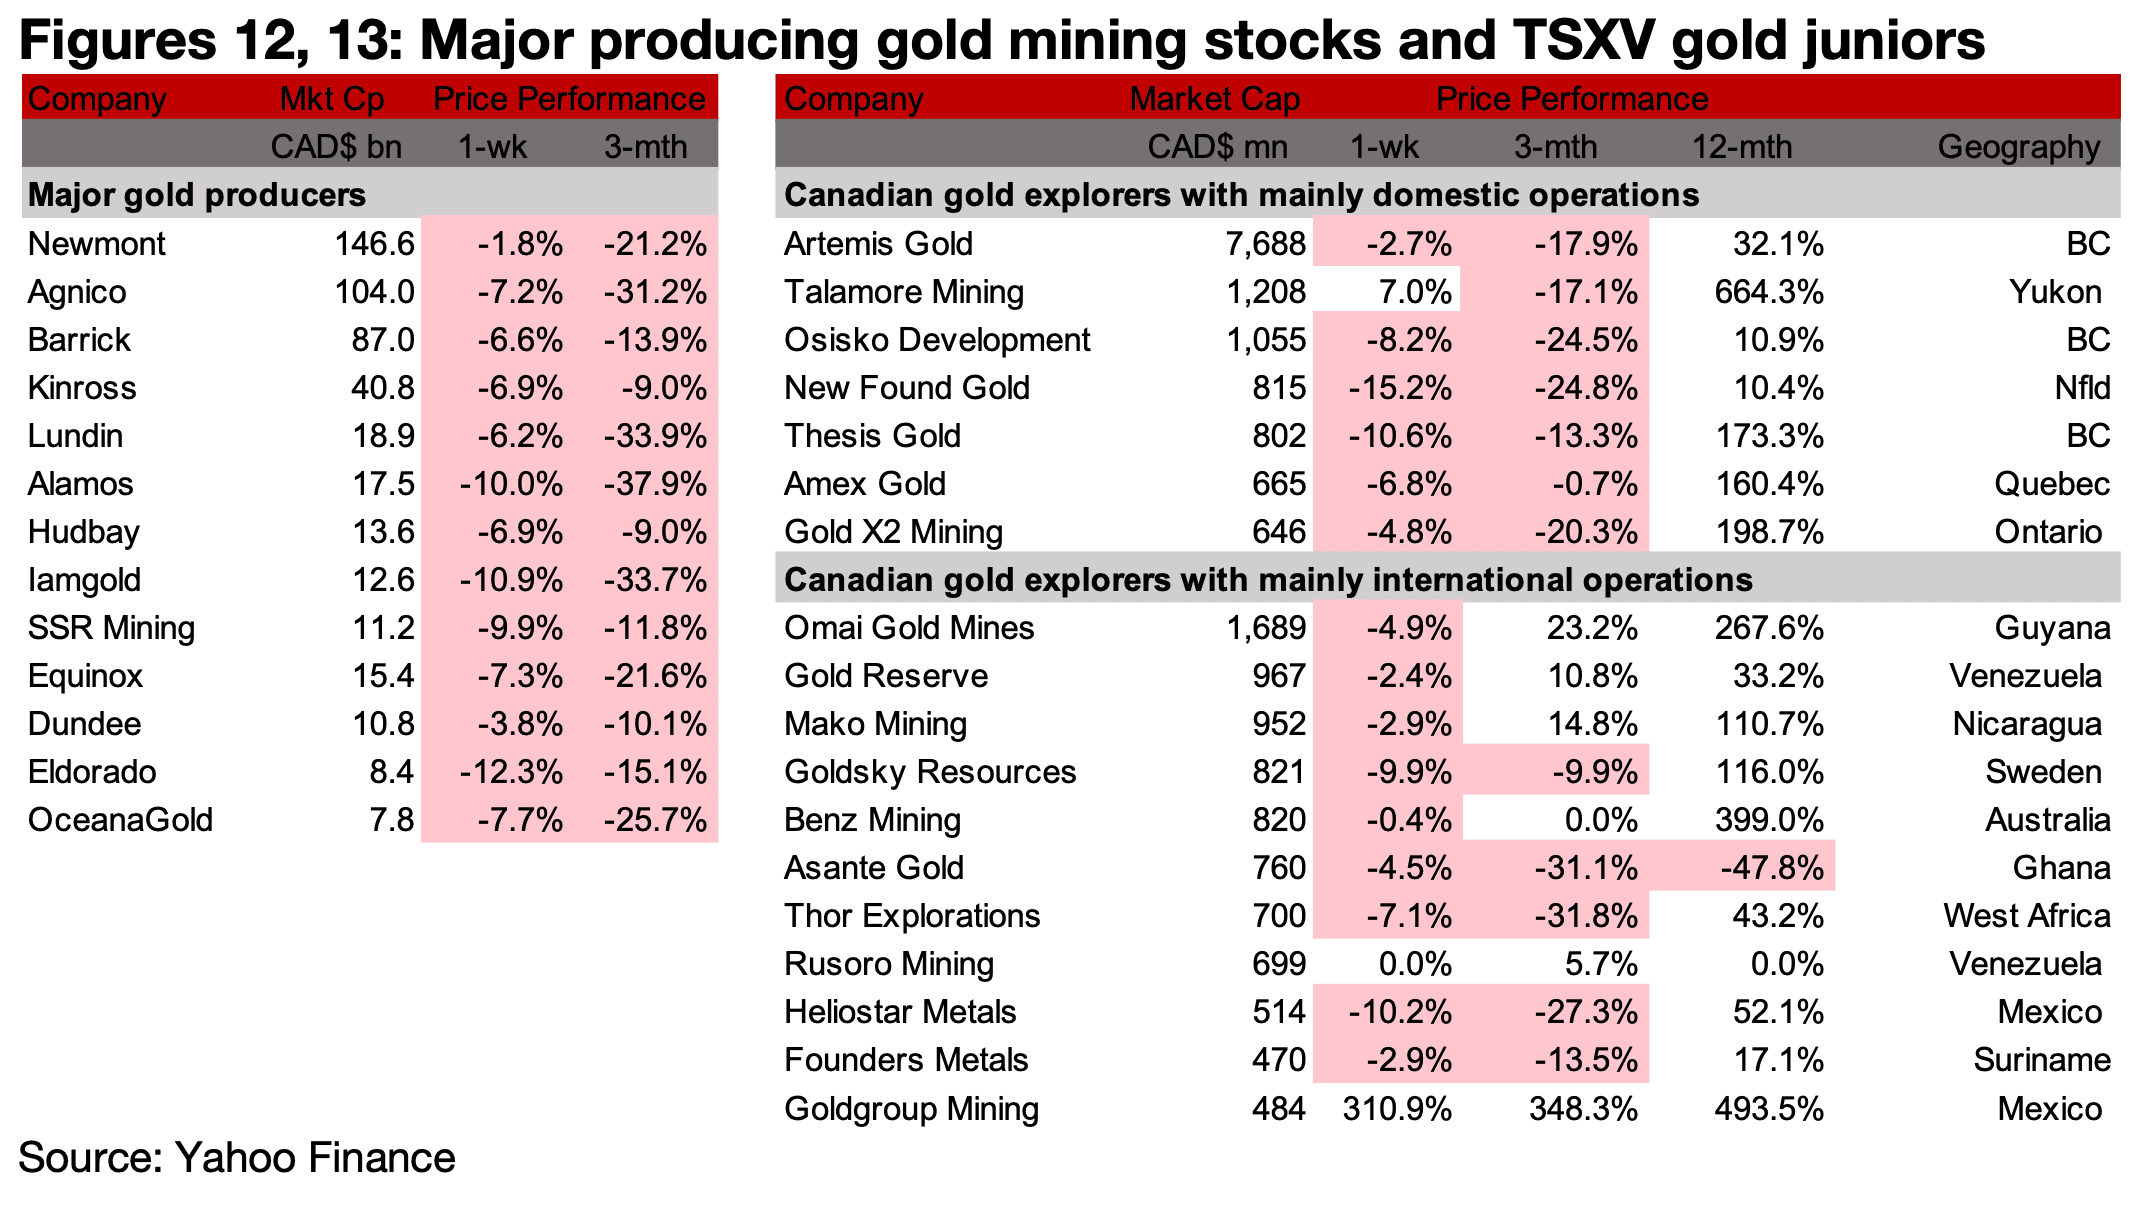
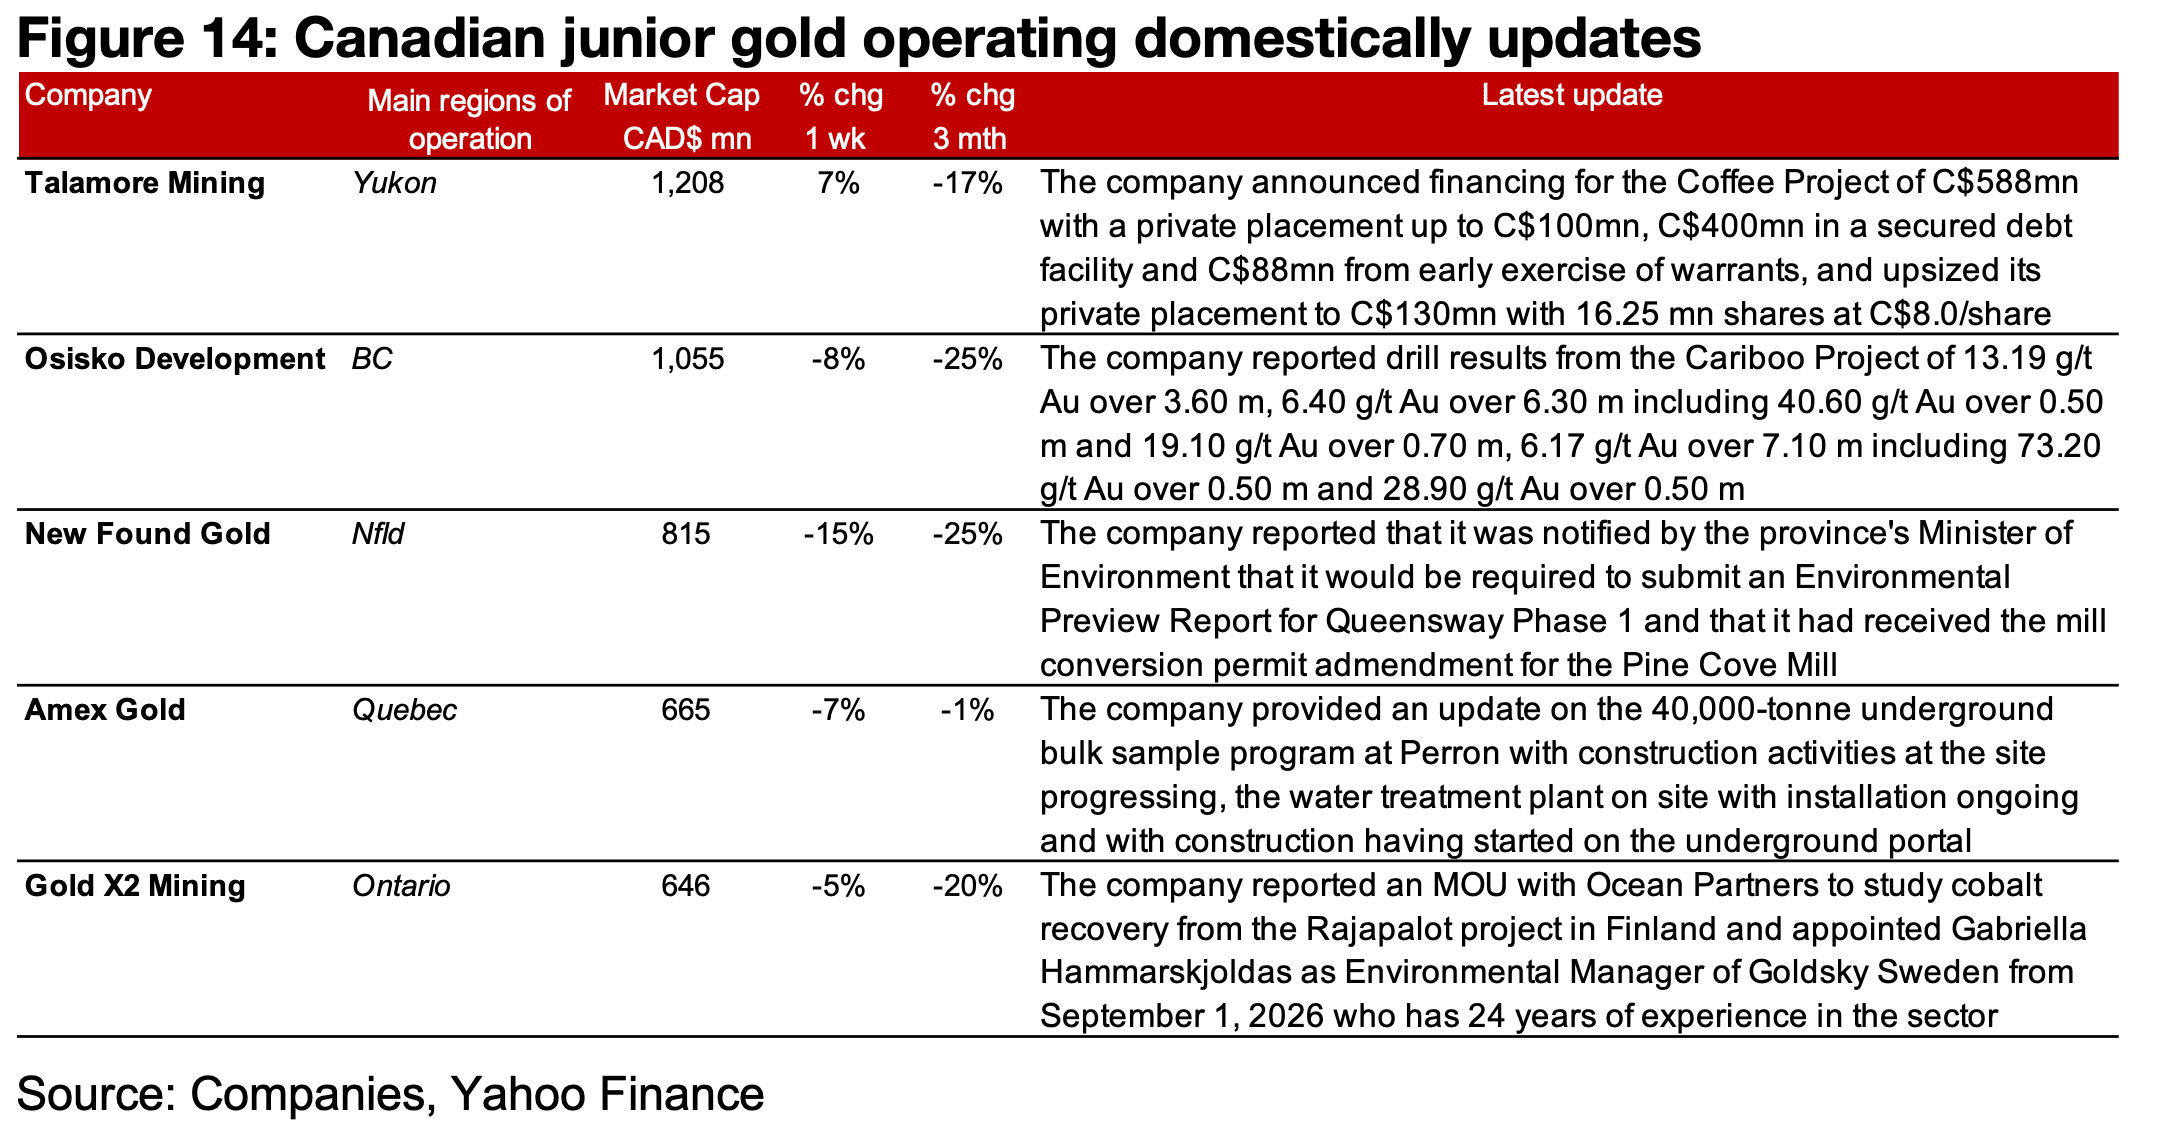
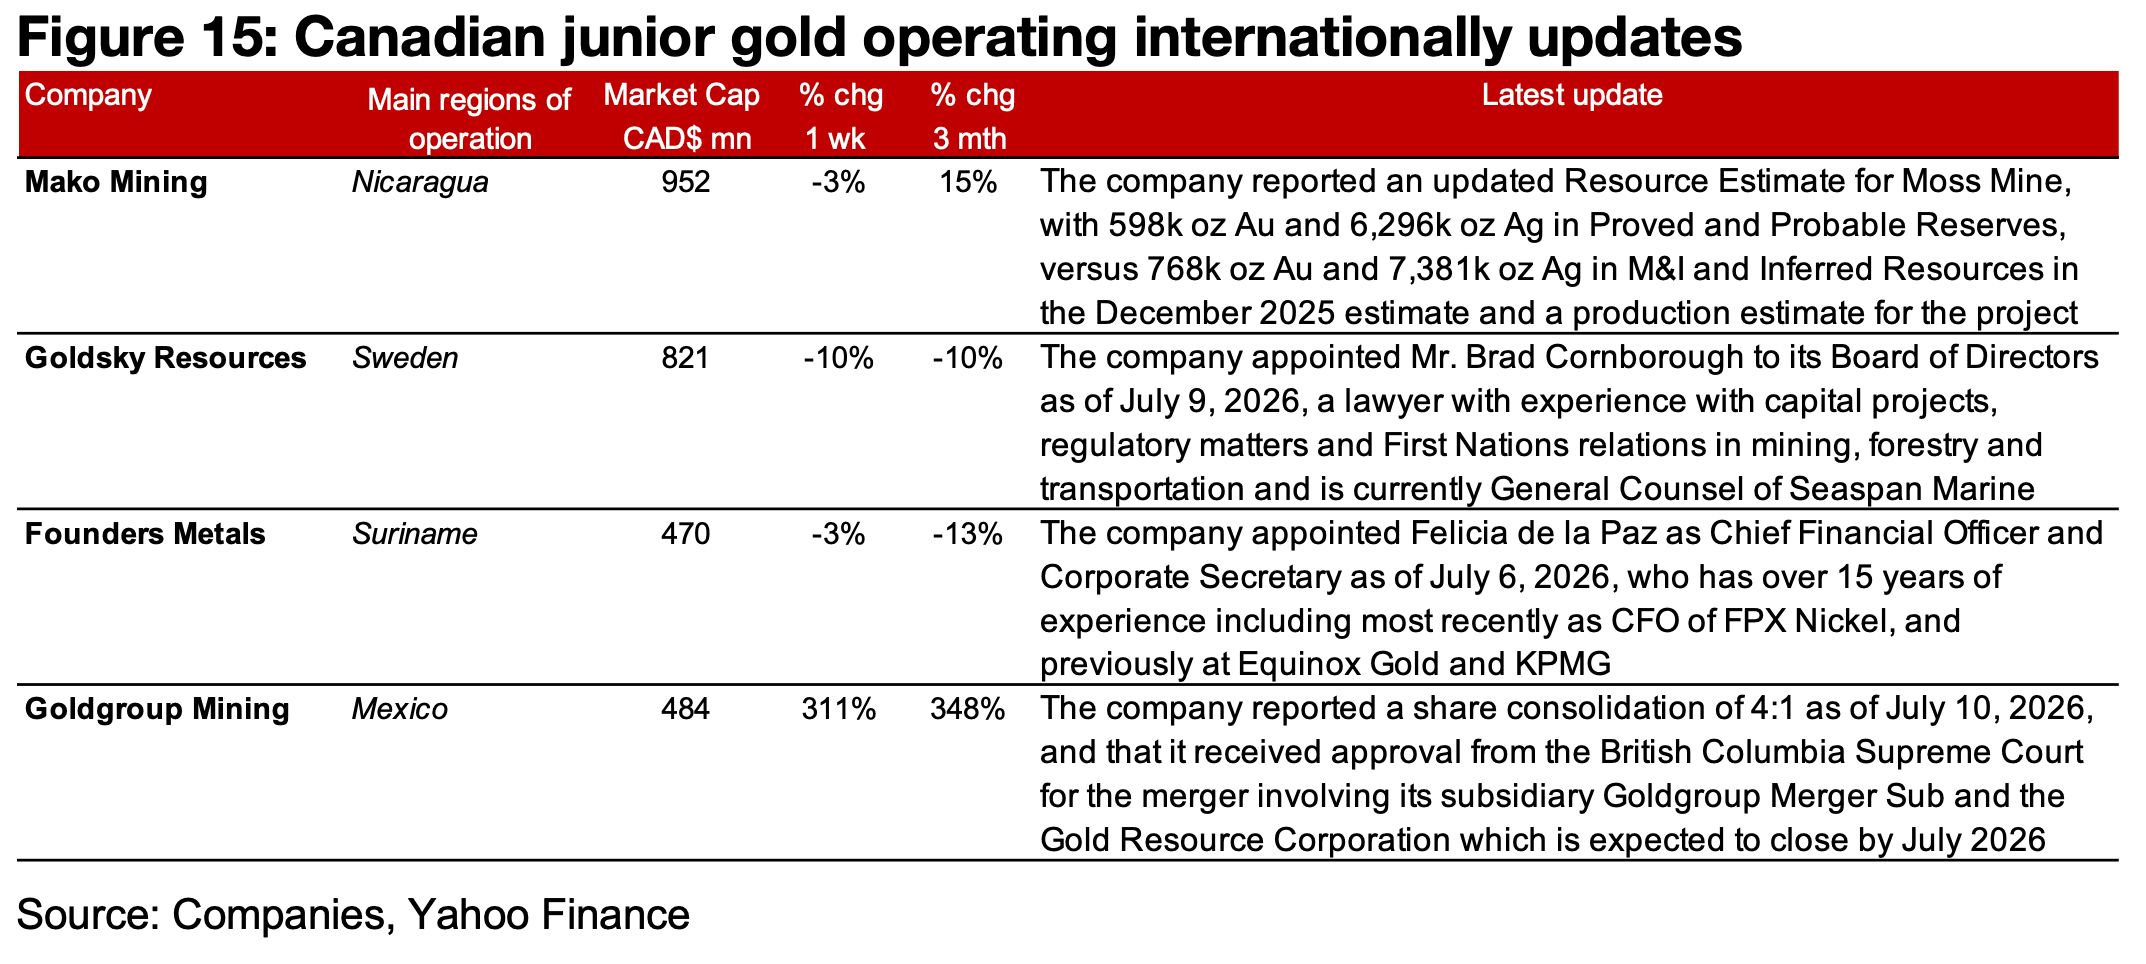
The major producers all saw major drops and TSXV large gold was mostly down on the decline in the metal price (Figures 12, 13) For the TSXV gold companies operating mainly domestically, Talamore mining reported financing for the Coffee project and upsized its private placement, Osisko reported drill results from Cariboo, New Found Gold provided permitting updates, Amex gave an update on the bulk sample program at Perron and Gold X2 reported an MOU to study cobalt recovery from Rajapalot in Finland and appointed a new Environmental Manager in Sweden (Figure 14). For the TSXV gold companies operating mainly internationally, Mako updated its Moss Mine Resource Estimate, Goldsky and Founders reported new management appointments and Goldgroup reported a share consolidation and approval of a merger (Figure 15).
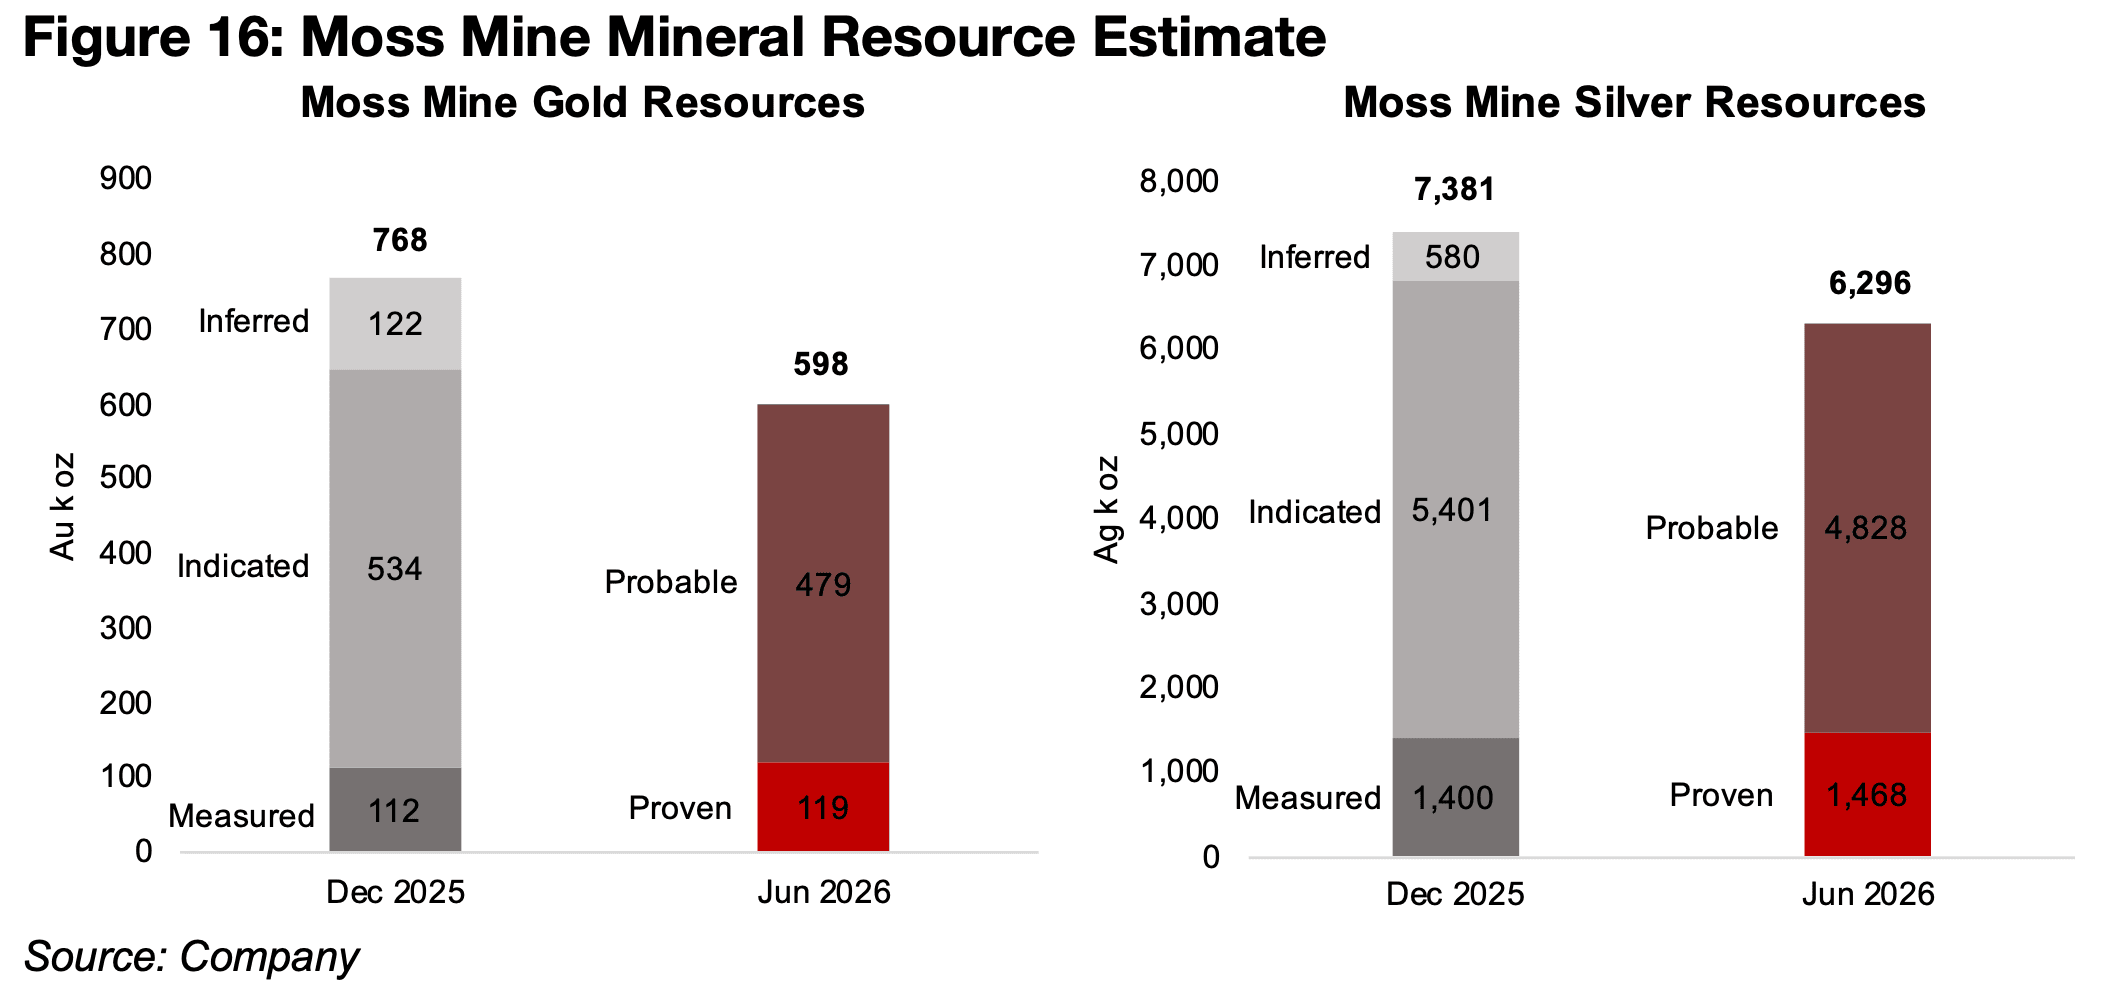
Mako Mining’s updated Mineral Resource Estimate for the Moss Mine in Arizona, U.S., comes only six months after its last reported Resource in December 2025. The estimate shows a major shift from the previous estimate, which was entirely Measured, Indicated and Inferred Resources, to Proved and Probable. The December 2025 Resource had 768 k oz Au, with the majority, 534 k oz Au, Indicated, and the January 2026 estimate has a total 598 k oz Au, with most, 479 k oz Au, Probable (Figure 16). The silver resources are now 6,296 k oz Ag Proved and Probable, and were 7,831 k oz Ag in the previous estimate.
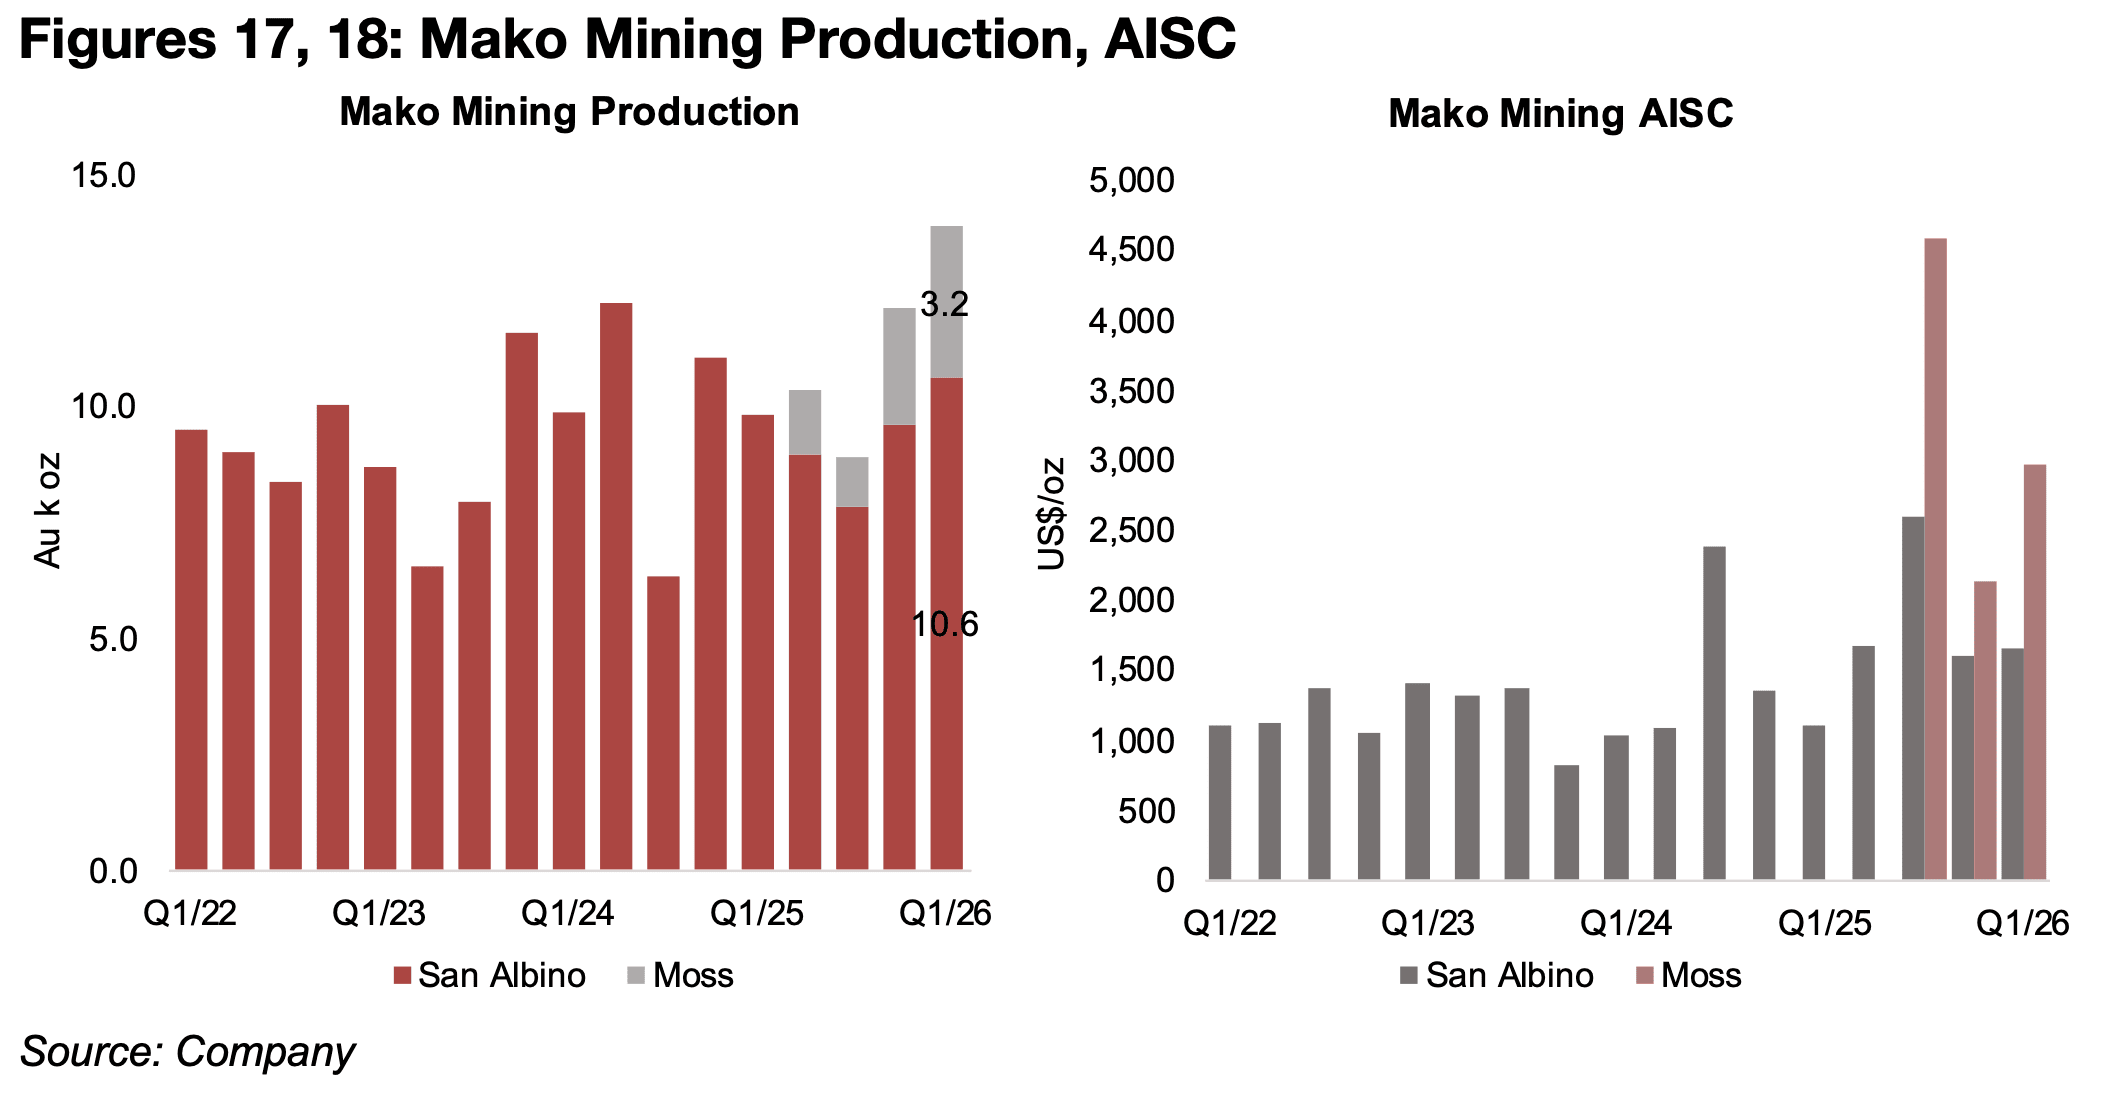
The company completed the acquisition of the project in March 2025, and it is
included in production results from Q2/25, and in Q1/26 contributed 3.2 k oz Au
(Figure 17). The company’s main project remains the San Albino mine in Nicaragua,
with output of 10.6 k oz Au in Q1/26. The Moss Mine has had a high AISC given that
it is in the relatively early stages of production and output is still ramping up, with a
target for production to rise to 30k oz Au annually on average, or about three times
the level of current production (Figure 18).
This was outlined in the production model that was released along with the new
Mineral Resource estimate. Diverging from the typical process, Mako had not
previously had a mineral estimate with Proved and Probable Reserves that would
typically come before production, and still has never reported a PEA or other study
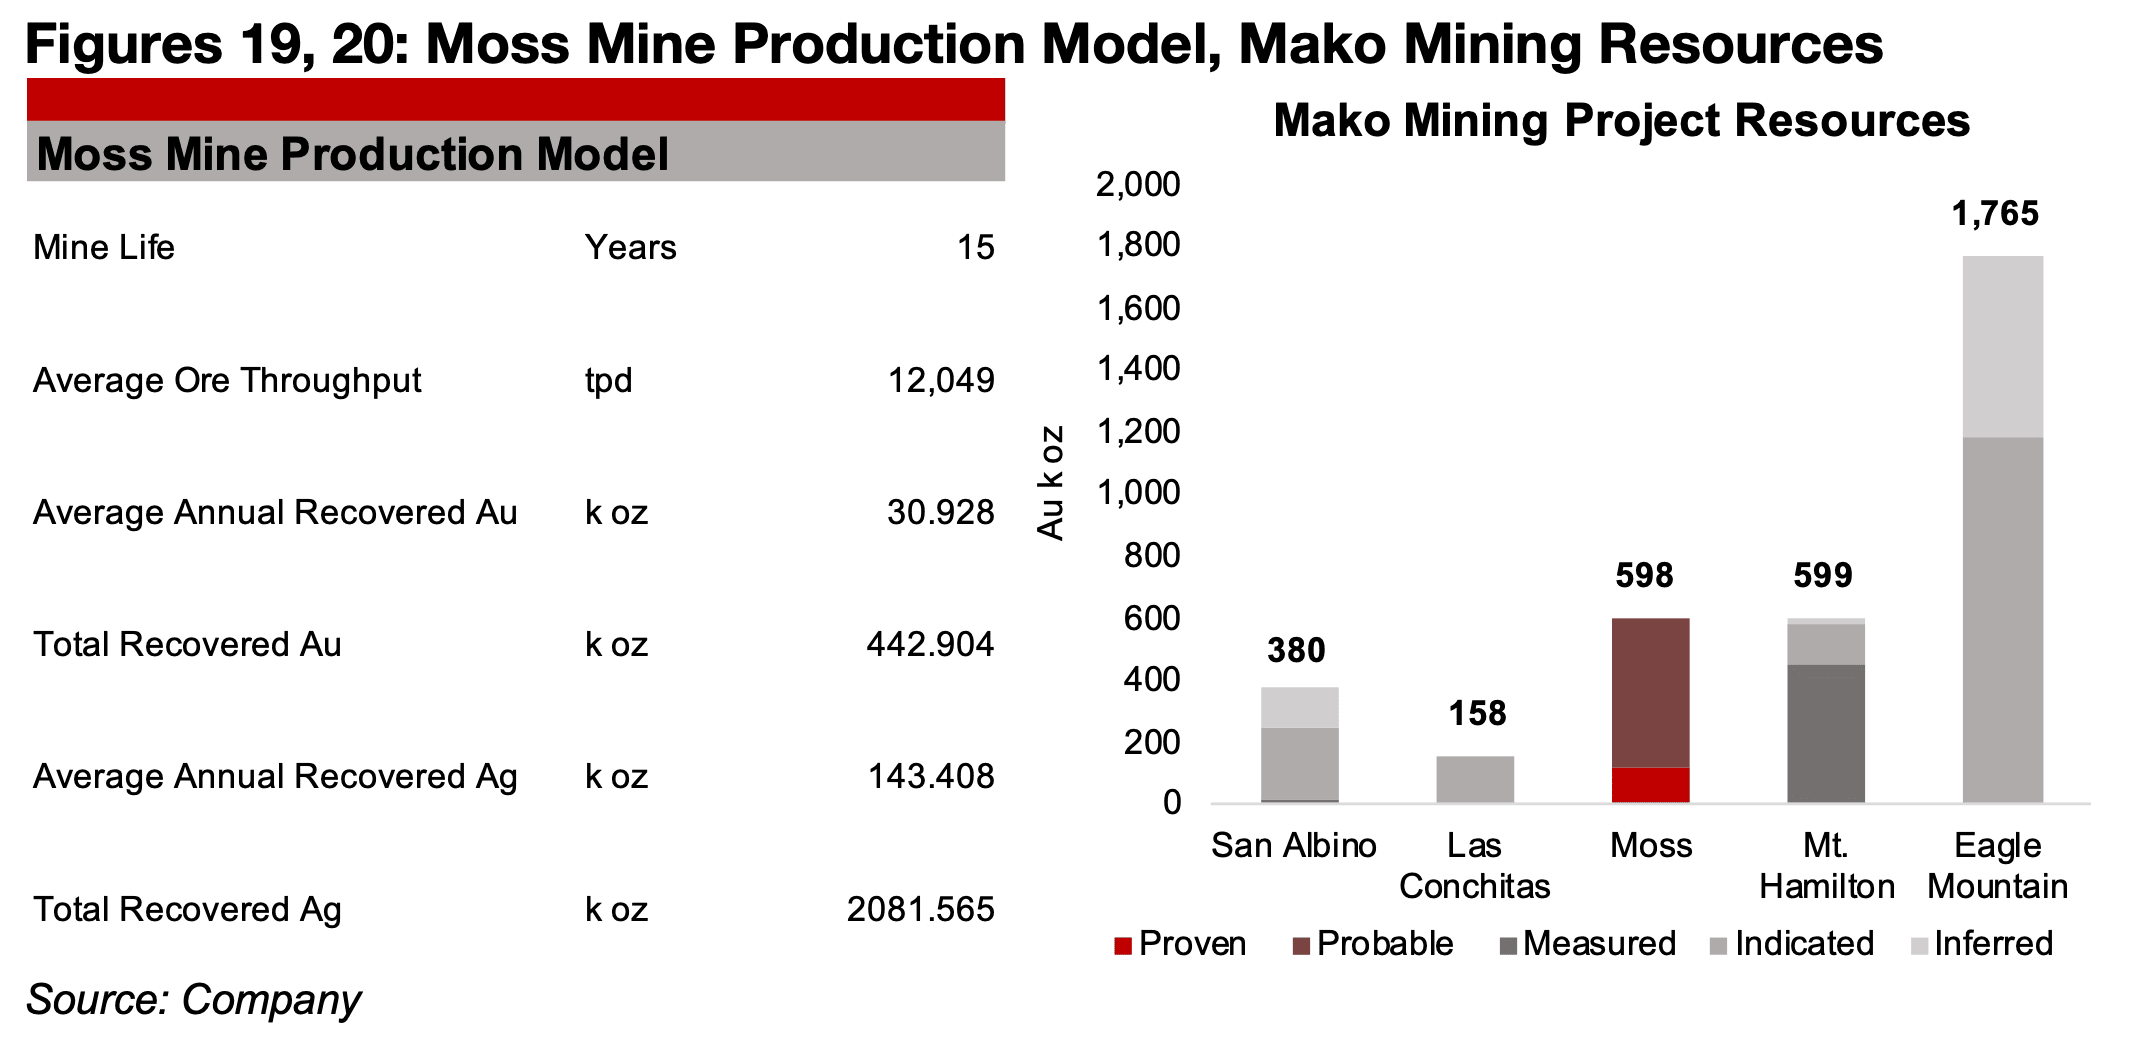
which outlines the long-term production costs for the mine. The company estimates
that the Moss Mine will operate for 15 years with the 30k oz Au per year production
estimate near the annual output of San Albino, which was 35k oz Au over the past
year (Figure 19).
The San Albino project has 380k oz Au in Resources, with the adjacent Las Conchitas
project with 158k oz Au, for a total 538k oz Au between the two projects, which could
potentially provide well over ten years of production at the current levels of output
(Figure 20). The Moss Mine Proved and Probable Reserves of 598 k oz Au are at a
similar level, and also the Mt. Hamilton project in Nevada with 599k oz Au, which the
company expects to start operating by 2027, and there is further upside to production
from the Eagle Mountain project in Guyana, which has 1.8mn oz Au in Resources.
Disclaimer: This report is for informational use only and should not be used an alternative to the financial and legal advice of a qualified professional in business planning and investment. We do not represent that forecasts in this report will lead to a specific outcome or result, and are not liable in the event of any business action taken in whole or in part as a result of the contents of this report.
Author
Ben McGregor authors the Weekly Roundup at CanadianMiningReport.com, providing sharp analysis of the metals and mining sector. With a talent for spotting trends, Ben distills complex market shifts into clear, engaging insights on TSXV junior miners. His weekly updates cover gold, copper, uranium, and more, blending data-driven perspectives with a knack for identifying opportunities. A vital resource for investors, Ben’s work navigates the dynamic junior mining landscape with precision.