
June 15, 2026
Gold dropped -2.8% to US$4,215/oz, neared lows of US$4,000/oz mid-week and had trended down for two months, as US CPI inflation jumped and the EU hiked rates, increasing concerned that a global rate tightening cycle may be starting.
The large gold stocks do not look overvalued on a P/B to ROE basis versus the major global sectors and consensus targets imply significant upside for the group and the large TSXV miners, with tech still the clear outlier for high multiples versus returns.
The gold stocks rose even with the metal price down, with the 3.6% gain for the GDXJ ETF of juniors outperforming the 1.5% rise in GDX, inline with strong small caps overall with the 2.8% rise in the Russell 2000 outpacing the near flat S&P.


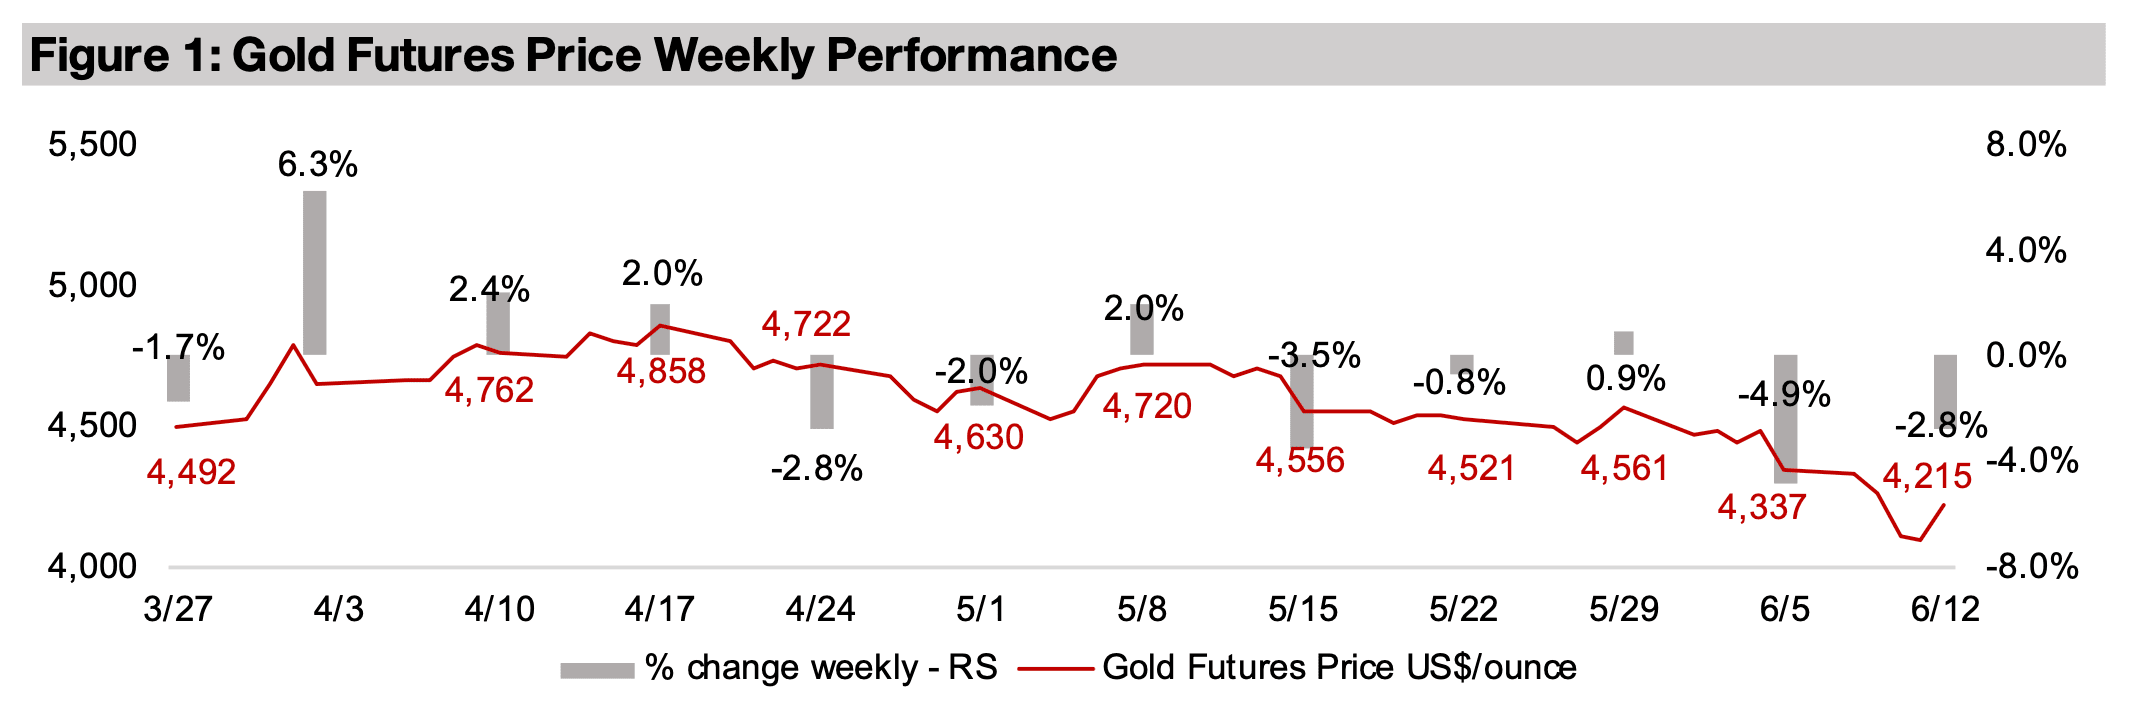
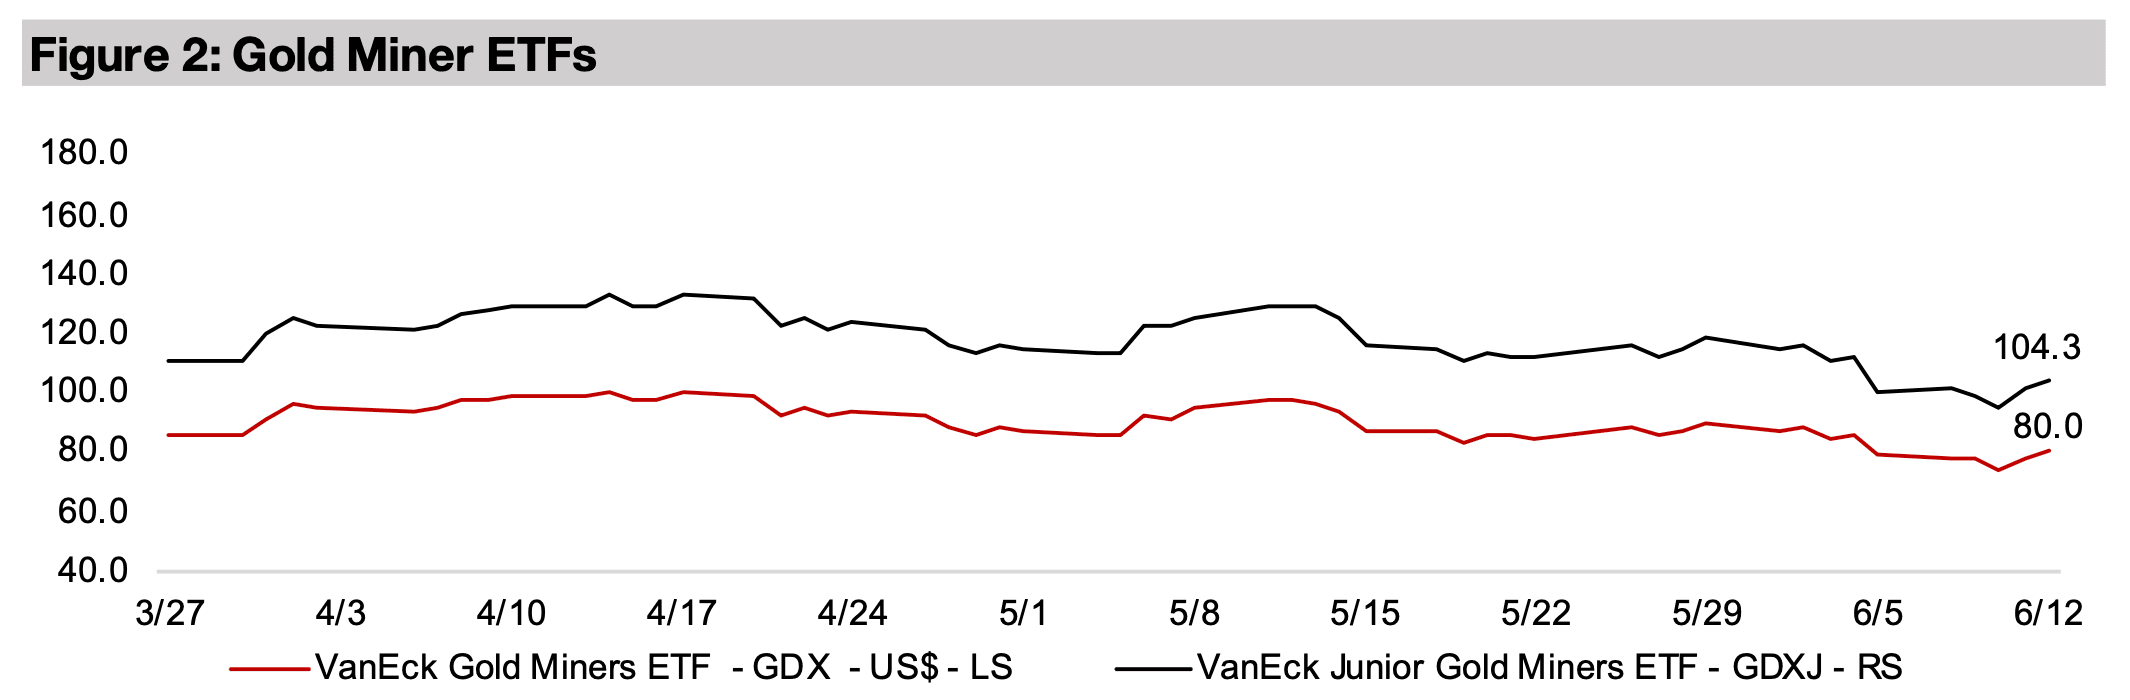
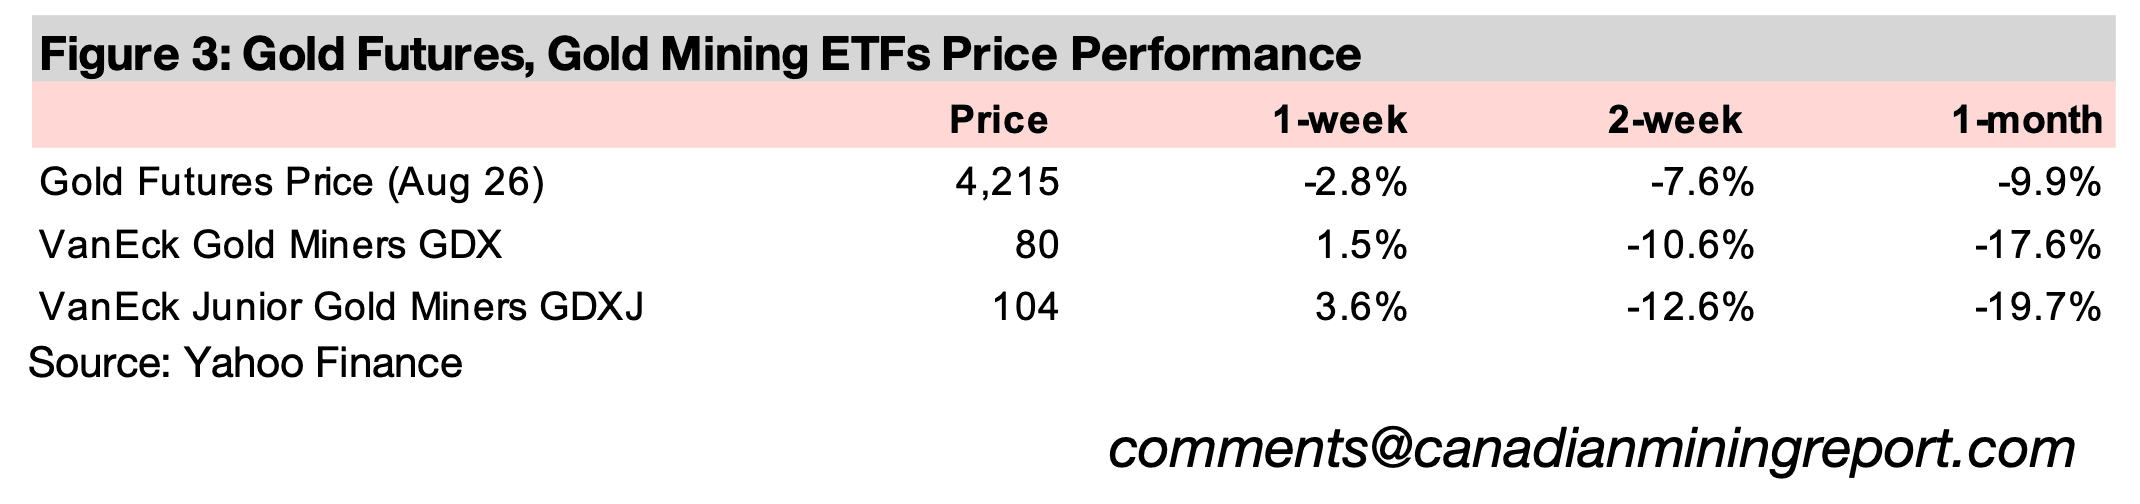
The gold price declined -2.8% to US$4,215/oz, continuing an overall downtrend for the past two months from the recent highs of US$4,858/oz in mid-April 2026, hitting the lows for the year, and dropping as low as US$4,090/oz mid-week. This seems to have been driven by concerns that global central banks may be entering a rate hike cycle in response to a potential increase in inflation driven by the spike in the oil price from the war in the Middle East. This came after a continued rise in US CPI inflation in May 2026, which was likely viewed as putting more pressure on the Fed to hike, and European Central Bank actually did boost rates. The large cap equities reacted negatively overall with the S&P 500 near flat, down -0.1%, and the Nasdaq declining -0.7%, although the Russell 2000 small cap index was up 2.8%. The gold sector also saw relative strength for smaller companies, with the GDXJ of junior miners rising 3.6%, outperforming the GDX ETF of large producers, up 1.5%.
However, with a US-Iran peace deal now having been announced, there is likely to
be a decline in the oil price at least short-term, which could also see inflation
eventually reduced to some degree and reduced the pressure for rate hikes. The
question becomes whether or not the decline in conflict in the region can hold, and if
the oil price will drop to pre-war levels, or still remain elevated, even if considerably
below the highs. The effects from higher oil prices in recent months will also have a
lagged effect and could continue to flow through the global supply chain, and still
boost CPI inflation in many countries for several months. It will therefore likely take
considerable time before global central banks are satisfied that inflation has been
brought under control and that the conflict will not flare up again.
This could see global central banks continue to lean towards hikes through this year,
which could continue to pressure the gold price. Rising rates imply a contraction in
the money supply, and monetary expansion tends to be the key driver of the gold
price long-term. While nominal yields would also likely rise on central bank hikes, gold
is more driven by real yields, which tend to move inversely to the metal. The direction
for real yields, which are calculated by nominal yields minus inflation, remains unclear
as the path of prices remains uncertain. If inflation declines on falling oil prices, real
yields could decline even if nominal yields rise on central bank rate hikes, which could
actually boost gold.
The peace deal also implies that there could be a significant decline in the premium
included in the gold price for geopolitical conflict, which has been a major driver of
the metal price since the start of the Russian and Ukraine war. However, we suspect
that this premium will not decline to zero any time soon and the market will take
considerable time to view the conflict as fully resolved. The gold price has actually
increased moderately since the announcement of the peace deal, indicating that the
markets continue to hedge with the metal, even as geopolitical risk has likely declined.
One of the reasons that the gold stocks may have risen even as the metal price
declined this week is that they still likely have some support from valuations which
look low especially in the context of the sector’s very strong return on equity. The
global return on equity (ROE) for all ninety sub-sectors is provided by Damodaran,
and using this data we have calculated an average for the major eleven sectors of
global markets, Financials, Tech, Consumer Staples, Consumer Discretionary,
Materials, Healthcare, Energy, Real Estate, Industrials, Telecoms, and Utilities. The
Price to Book for each of these sectors is provided by iShares in the information on
its ETFs for these sectors, making possible an ROE to price to book comparison
(Figure 4). We have also included the precious metals, and metals and mining,
subsectors’ ROE from Damodaran compared to the P/Bs of the VanEck GDX ETF of
gold producers and iShares PICK ETF of Metals and Mining producers.
The valuation line indicates that as a sector’s ROE increases, we would expect that
the market will pay a higher valuation in terms of price to book. Generally this is the
case for most sectors, although some are moderately above the line, potentially
indicating some degree of overvaluation, or below it, suggesting a level of
undervaluation. The only huge standout, clearly far above the valuation line, is the
tech sector, which while having the strongest ROE of the major sectors, also has a
P/B over twice the next highest sector. This is partly because the ‘book’, or equity,
which equals assets minus liabilities, in the P/B ratio can be low in tech versus other
sectors. This is because tech tends to not have the large assets of many sectors
which have factories and major equipment. However, even considering this factor,
the tech P/B looks extremely high versus its returns.
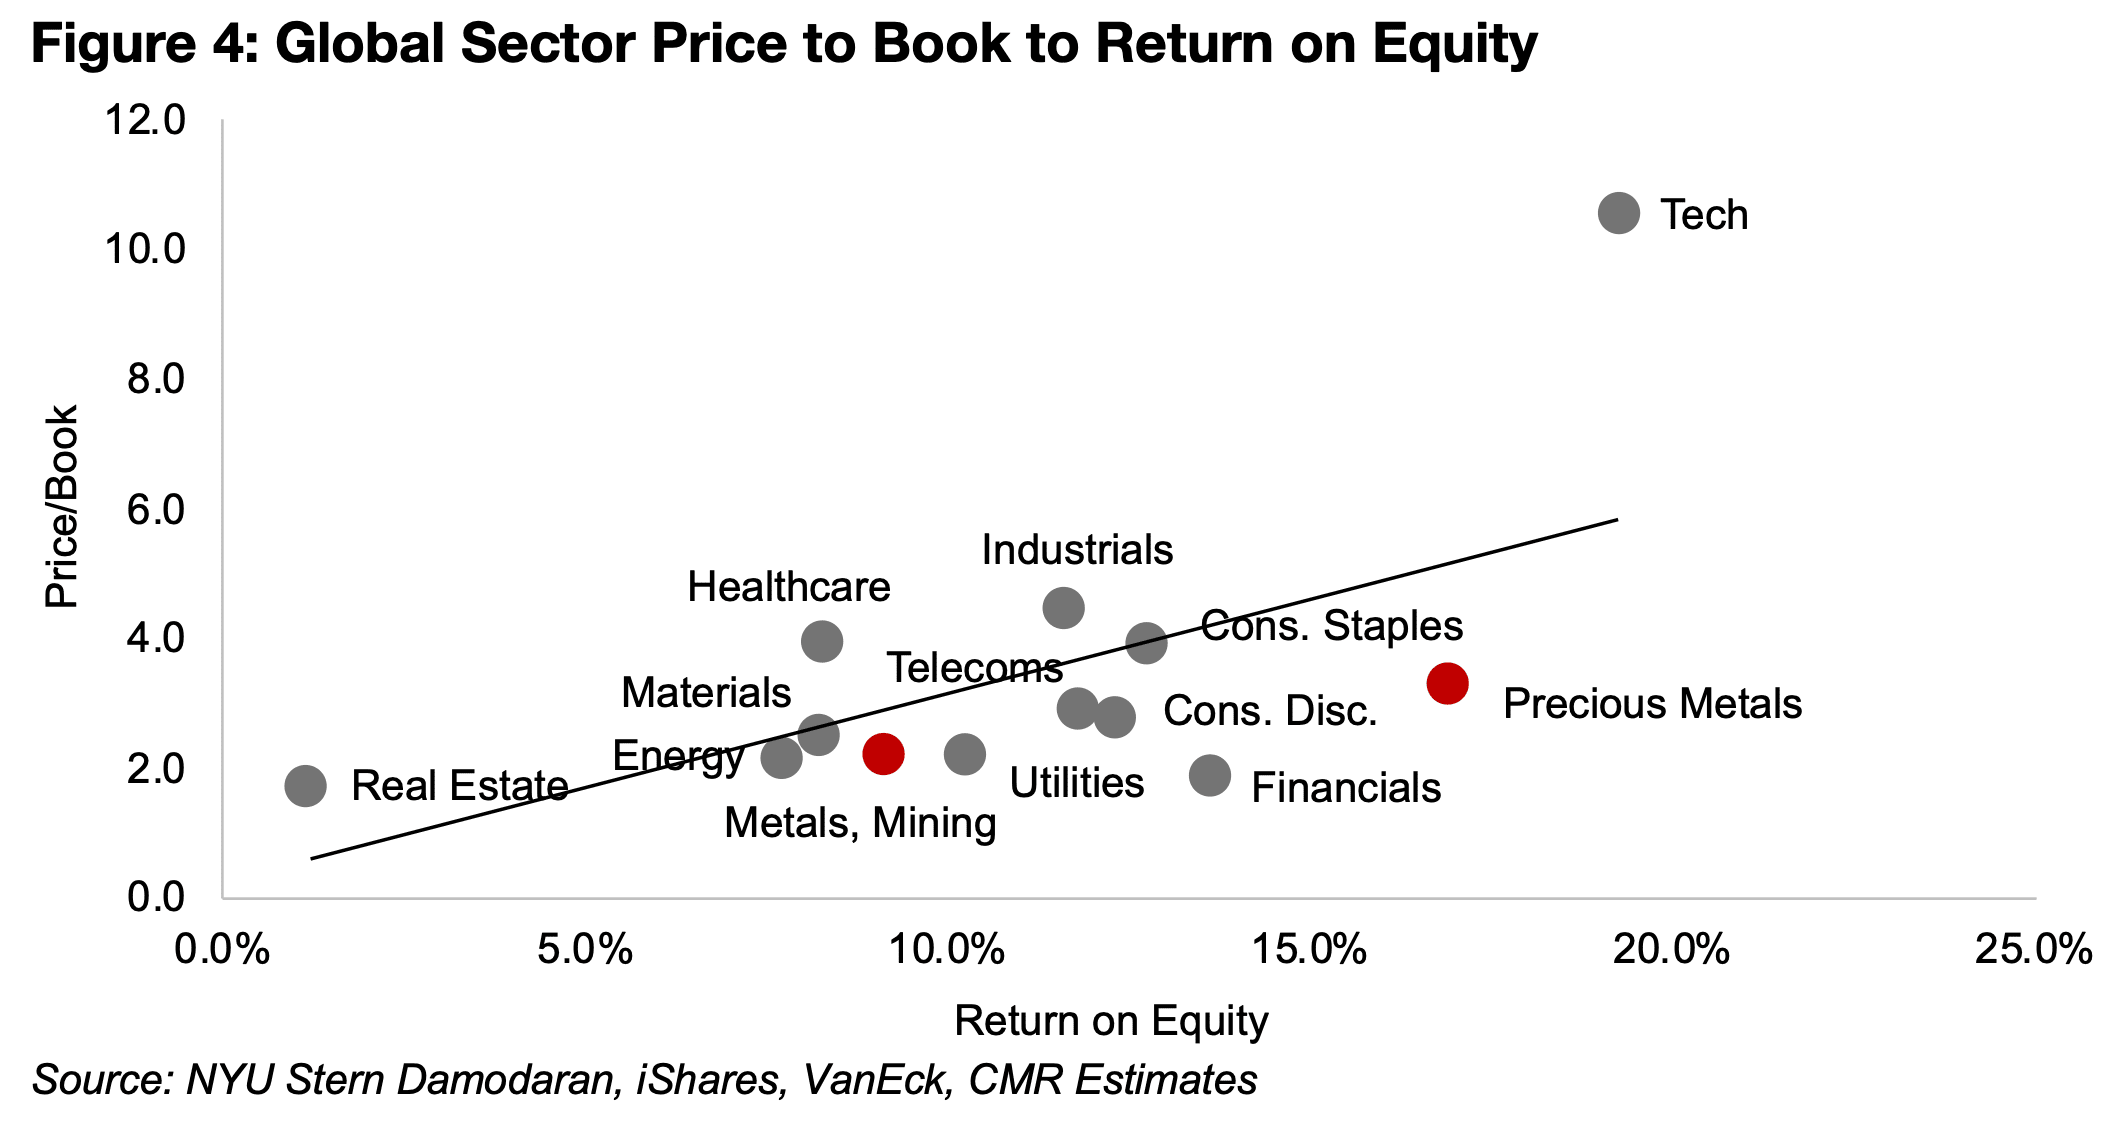
The precious metals sector, which will mainly be gold companies, has the second highest ROE after tech, but a far lower P/B ratio, which puts it below the valuation line. This certainly does not point to significant overvaluation for the sector, even if we assume a moderate pullback in returns from a declining gold price. The data for ROE is also supplied from Jan 5, 2026, so it will be based on 2025 financial information, and not reflect the dramatic rise in ROE for the sector over Q1/26 on a surging gold price. If we assume that the current ROE has dropped back more to the levels near the end of 2025, it appears that the gold sector is actually still quite undervalued relative to most other sectors given its returns. While the returns of the metals and mining sector are far lower than gold, as it also has a relatively low P/B, it is also below the valuation line.
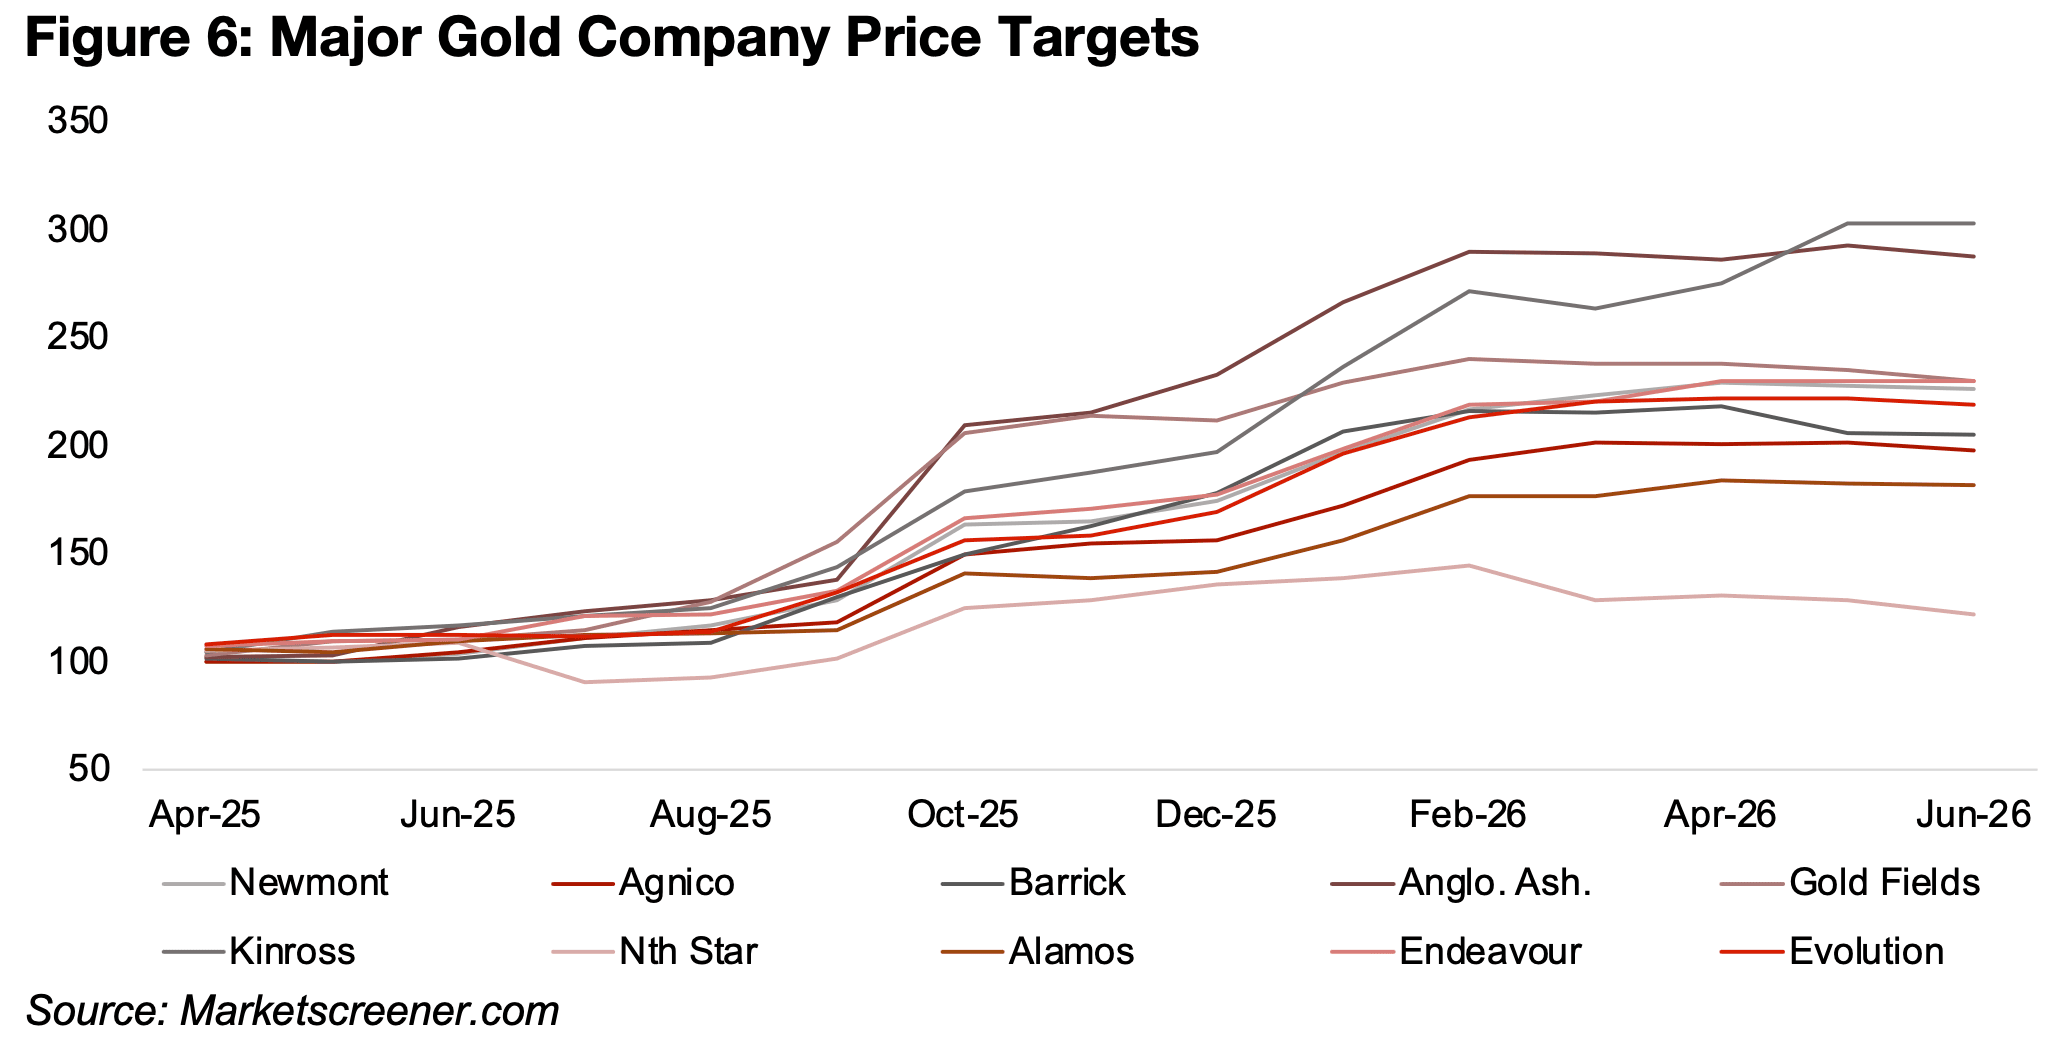
A P/B to ROE valuation for the largest gold companies does not seem to indicate major mispricing within the sector, with only Evolution Mining standing out as considerably above the market cap weighted valuation line, and only Gold Fields below (Figure 5). With the gold price having declined for the past two months, we would expect that some analysts could start to downgrade their targets for these companies to some degree. However, while the trend of upgrades largely ended in by April 2026, there have only been moderate downgrades so far (Figure 6). This suggests that the average gold price expectations baked into these targets may have not been adjusted up towards the highs this year of well over US$5,000/oz, and that around the US$4,000/oz may have still been assumed. Several of these companies have seen their targets remain relatively flat over the past two months, only Barrick and Northern Star have seen significant downgrades, and Kinross has even see a major increase
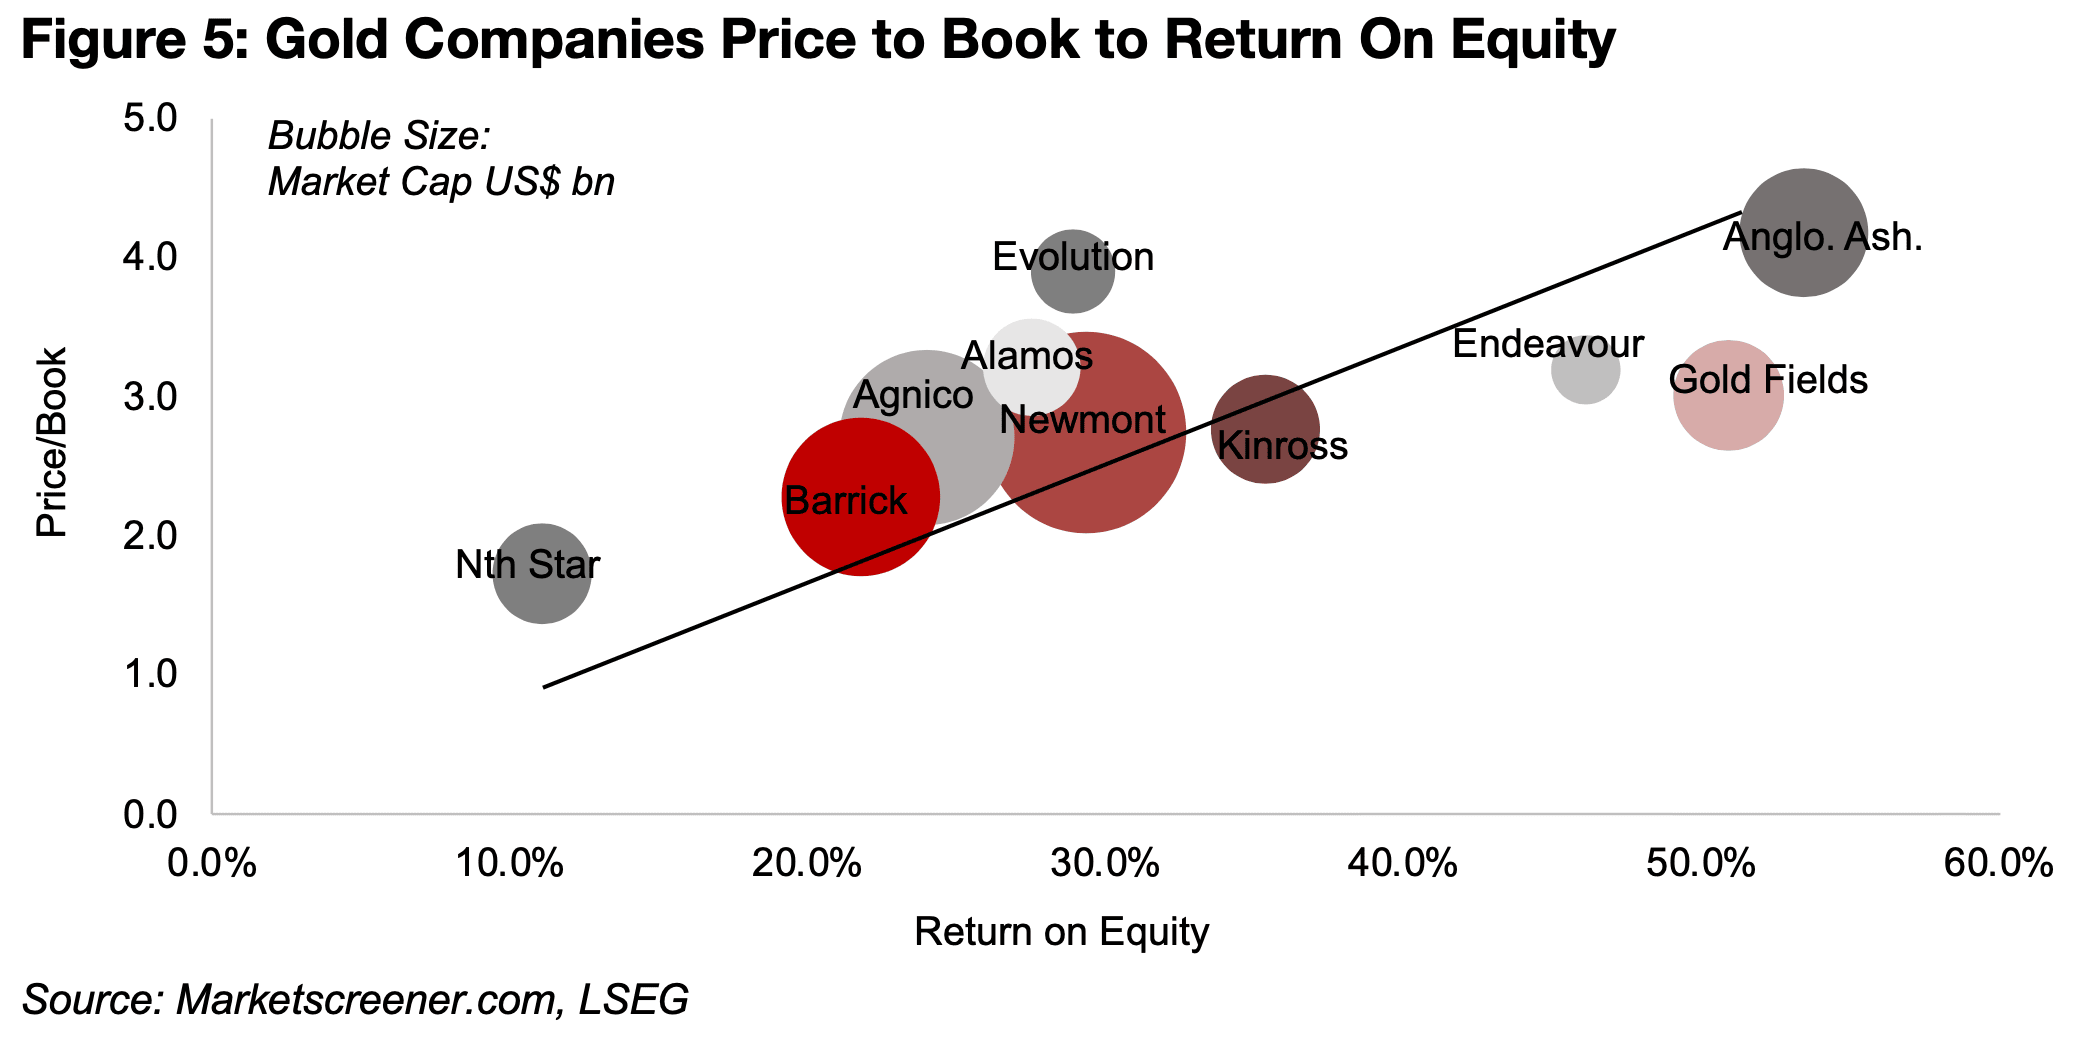
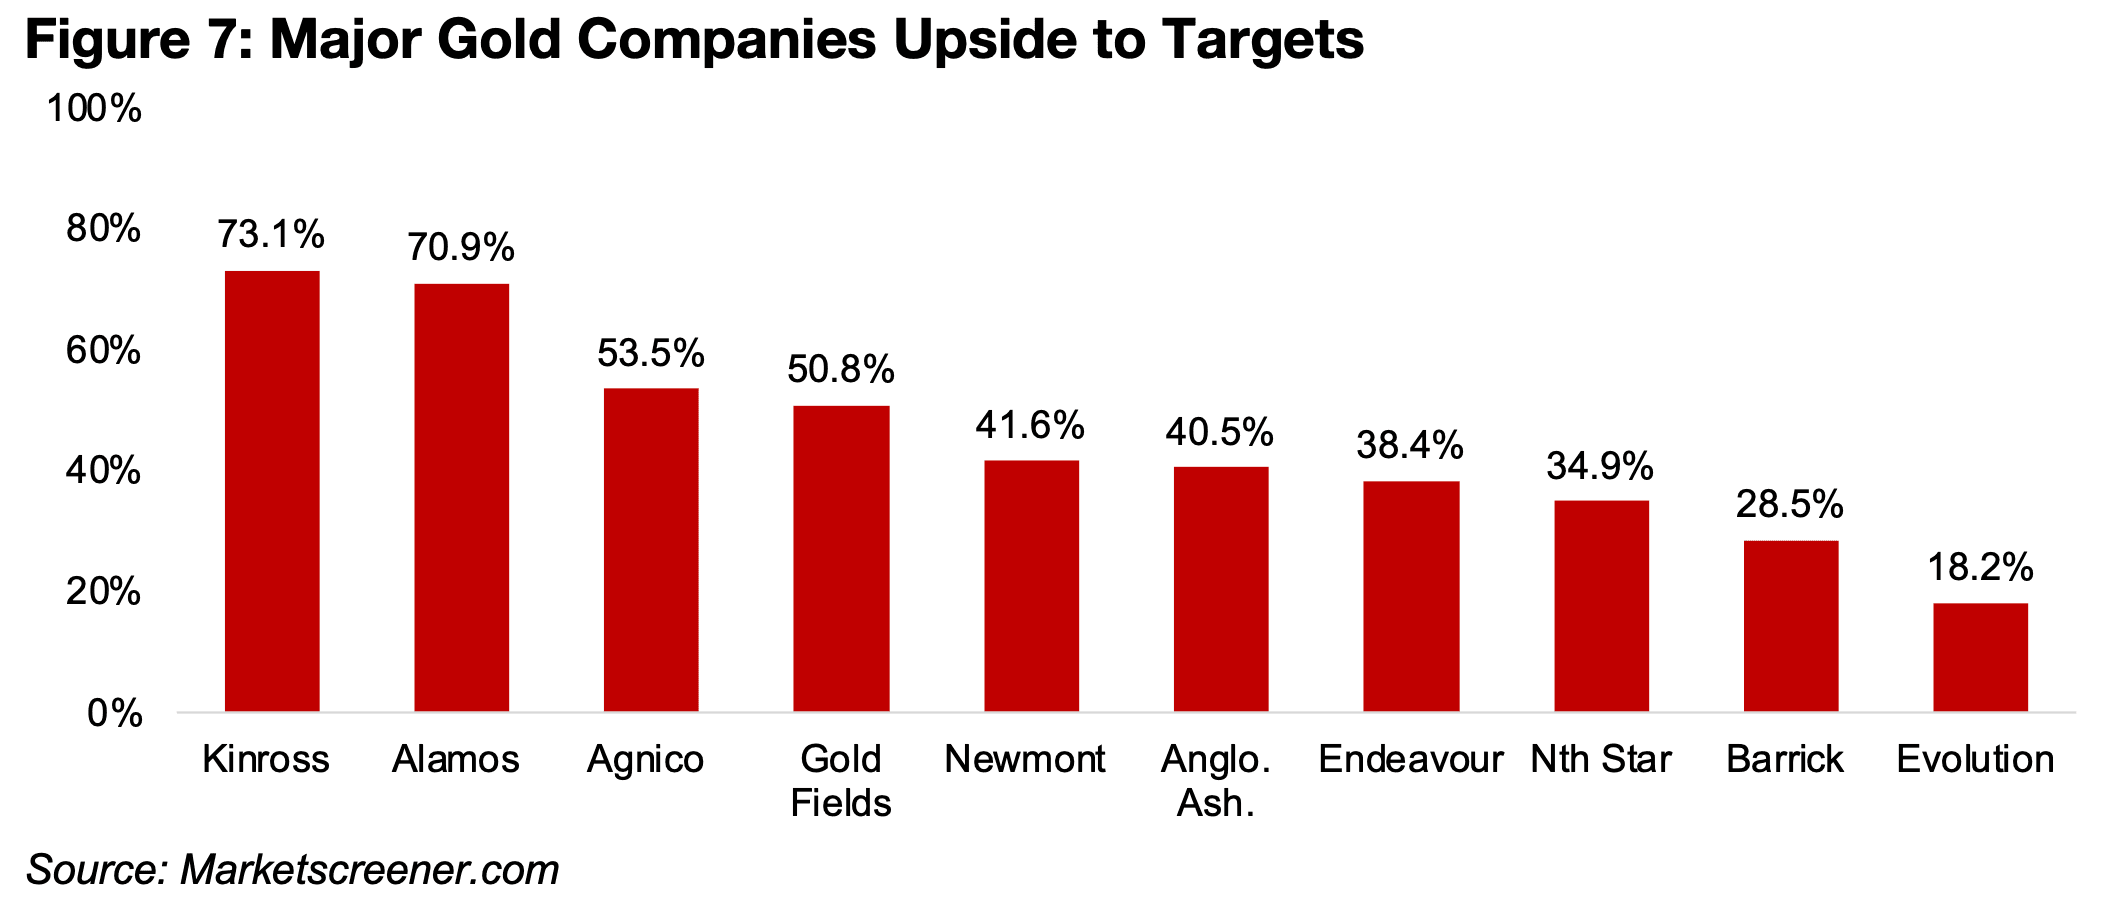
The market also continues to see considerable upside to the target prices of all the major gold companies, ranging from 18.2% for Evolution to 73.1% for Kinross (Figure 7). This likely partly reflects the relatively low P/B versus ROE seen for precious metals versus the other major global sectors, which implies rooms for gains only just shifting up to valuation line, even without moving above it.
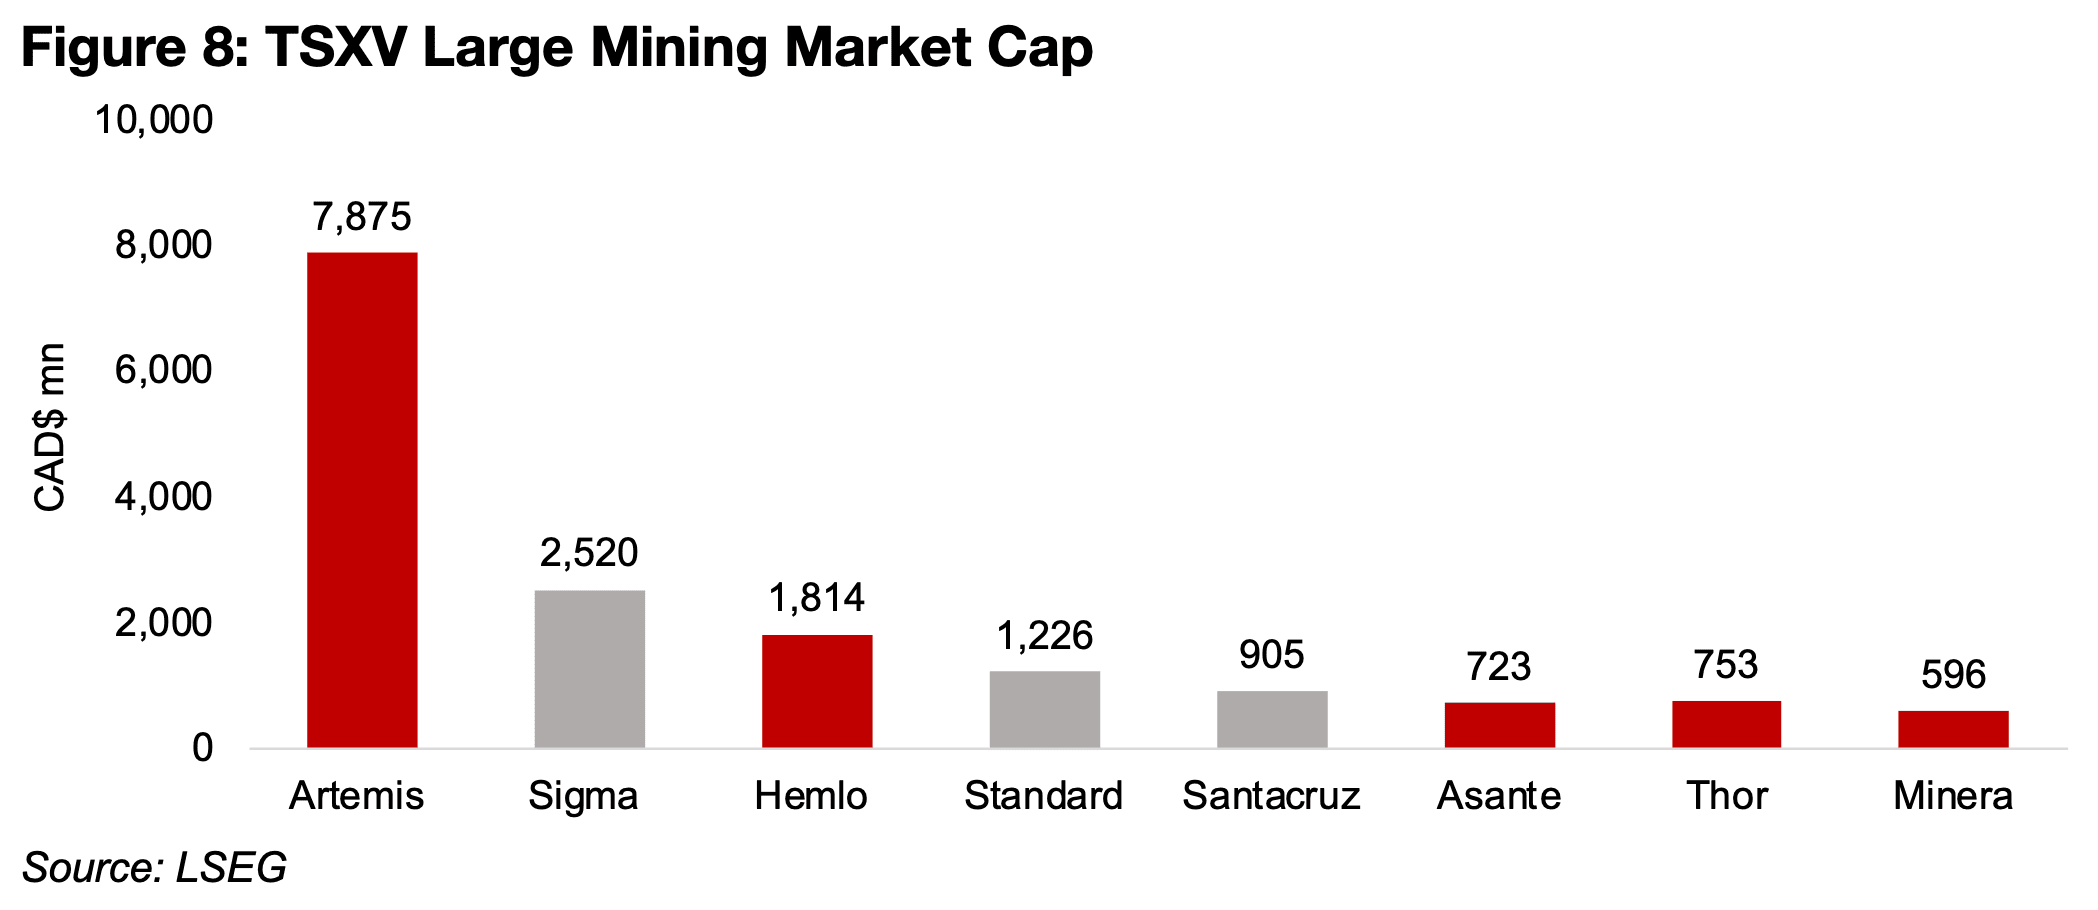
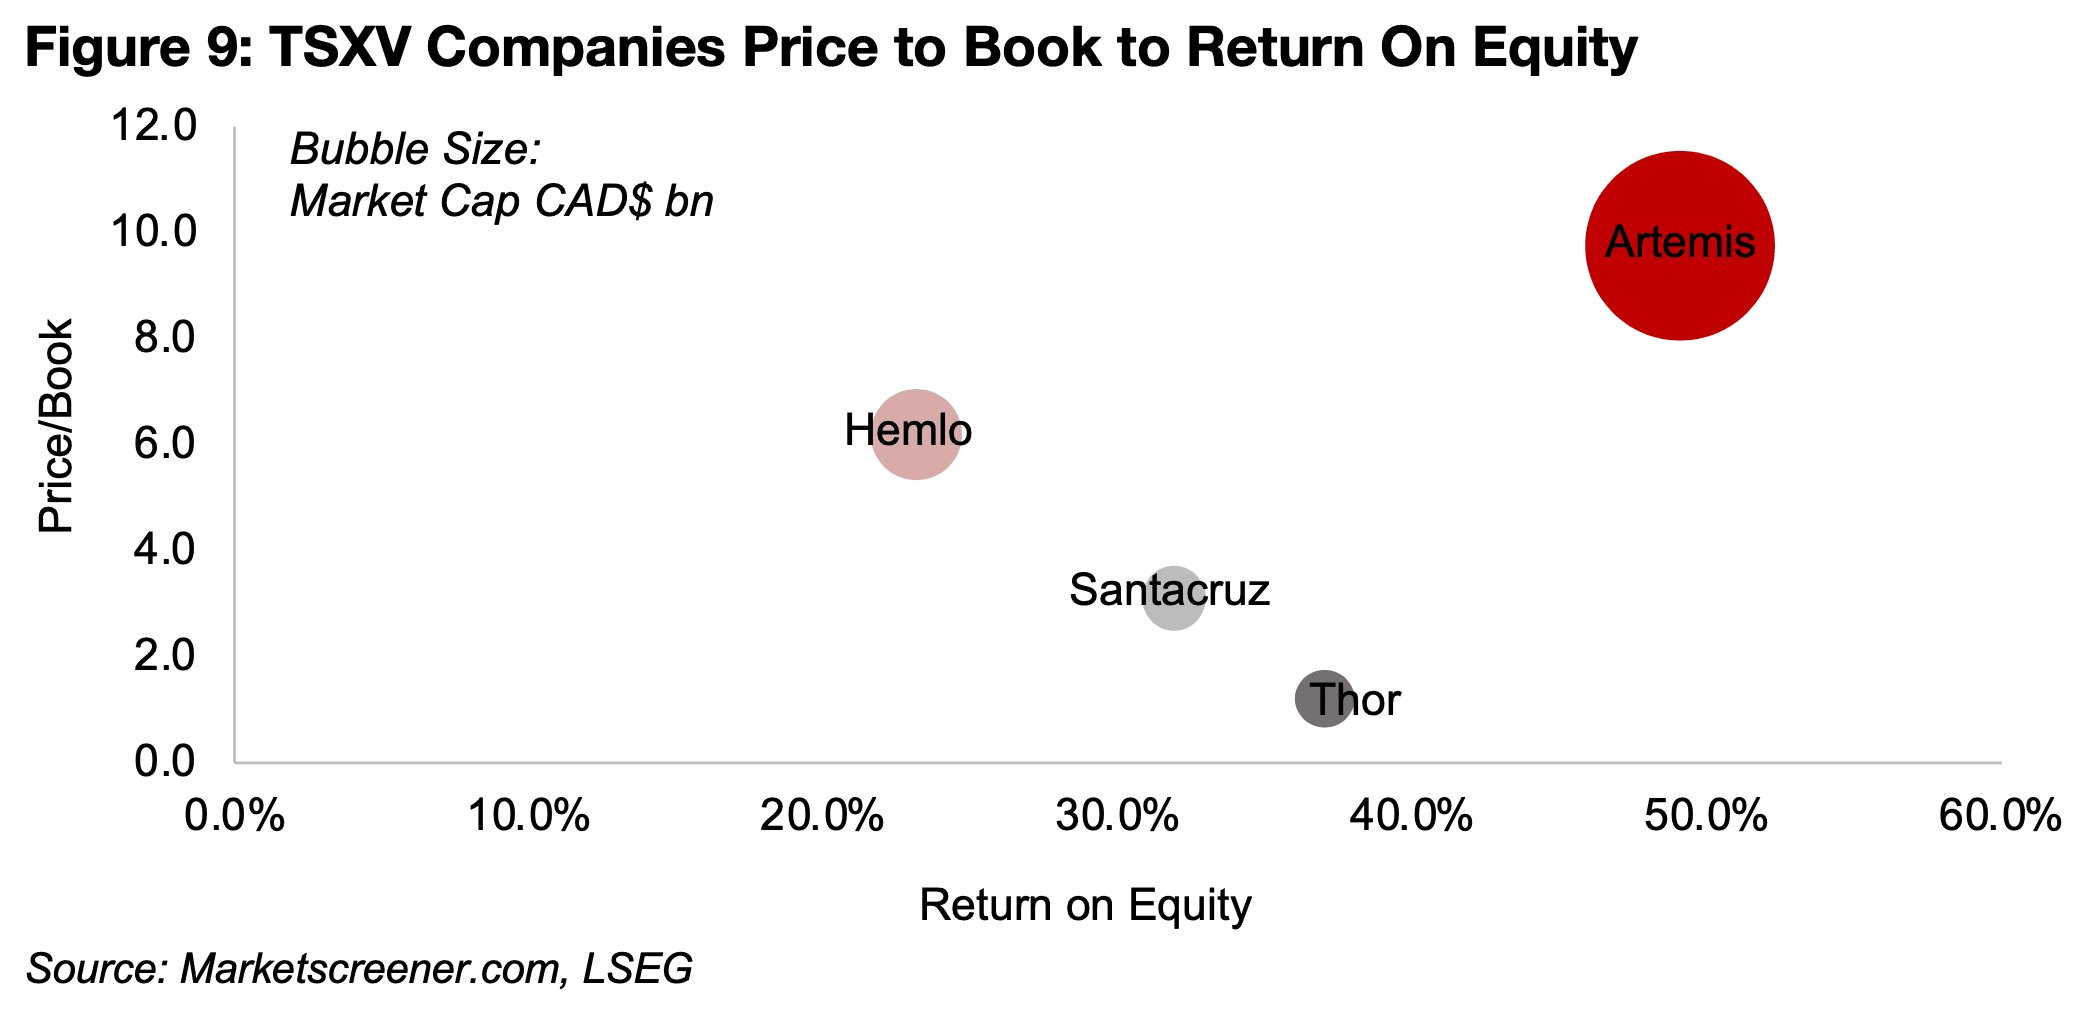
For the large producing TSXV mining stocks, only a few have the data to calculate
the P/B and ROE, which makes a look at relative pricing for the sector difficult. There
is also a huge weighting of the sector to Artemis Gold, with a CAD$7.9bn market cap,
over three times the next largest, Sigma Lithium, at CAD$2.5bn, which makes a
weighted valuation line mainly reflect this one company (Figure 8).
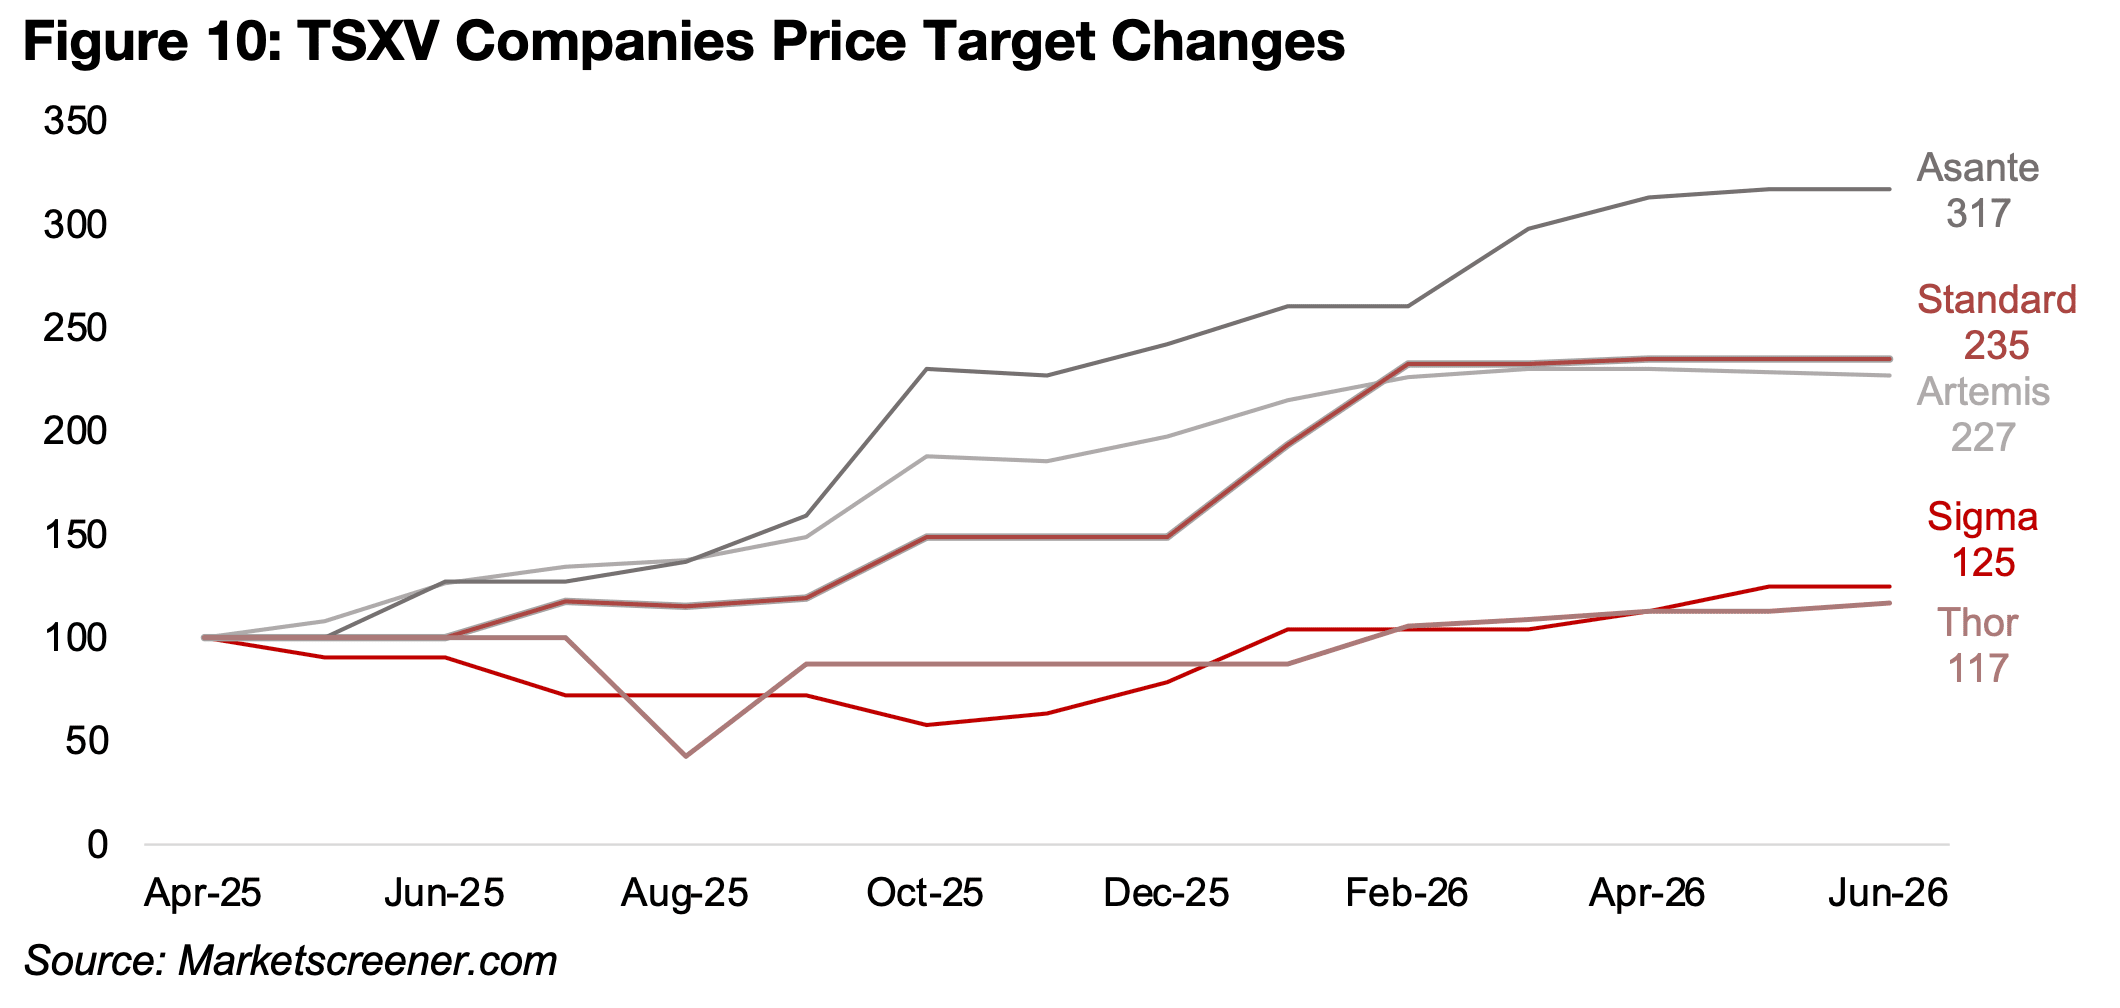
There have been significant upgrades for the target prices of all the companies this
year, with gains especially for Asante Gold, which forecasts a considerable rise in the
production over the next several years (Figure 10). The targets for Artemis Gold and
Standard Lithium peaked in February 2026 and have edged down since, Sigma only
peaked in May 2026, and pulled back slightly June 2026, and Thor’s target has seen
gradual gains over the past few months. We have excluded Santacruz, as it literally
goes off the chart given a surge in its target by ten times over the past year.
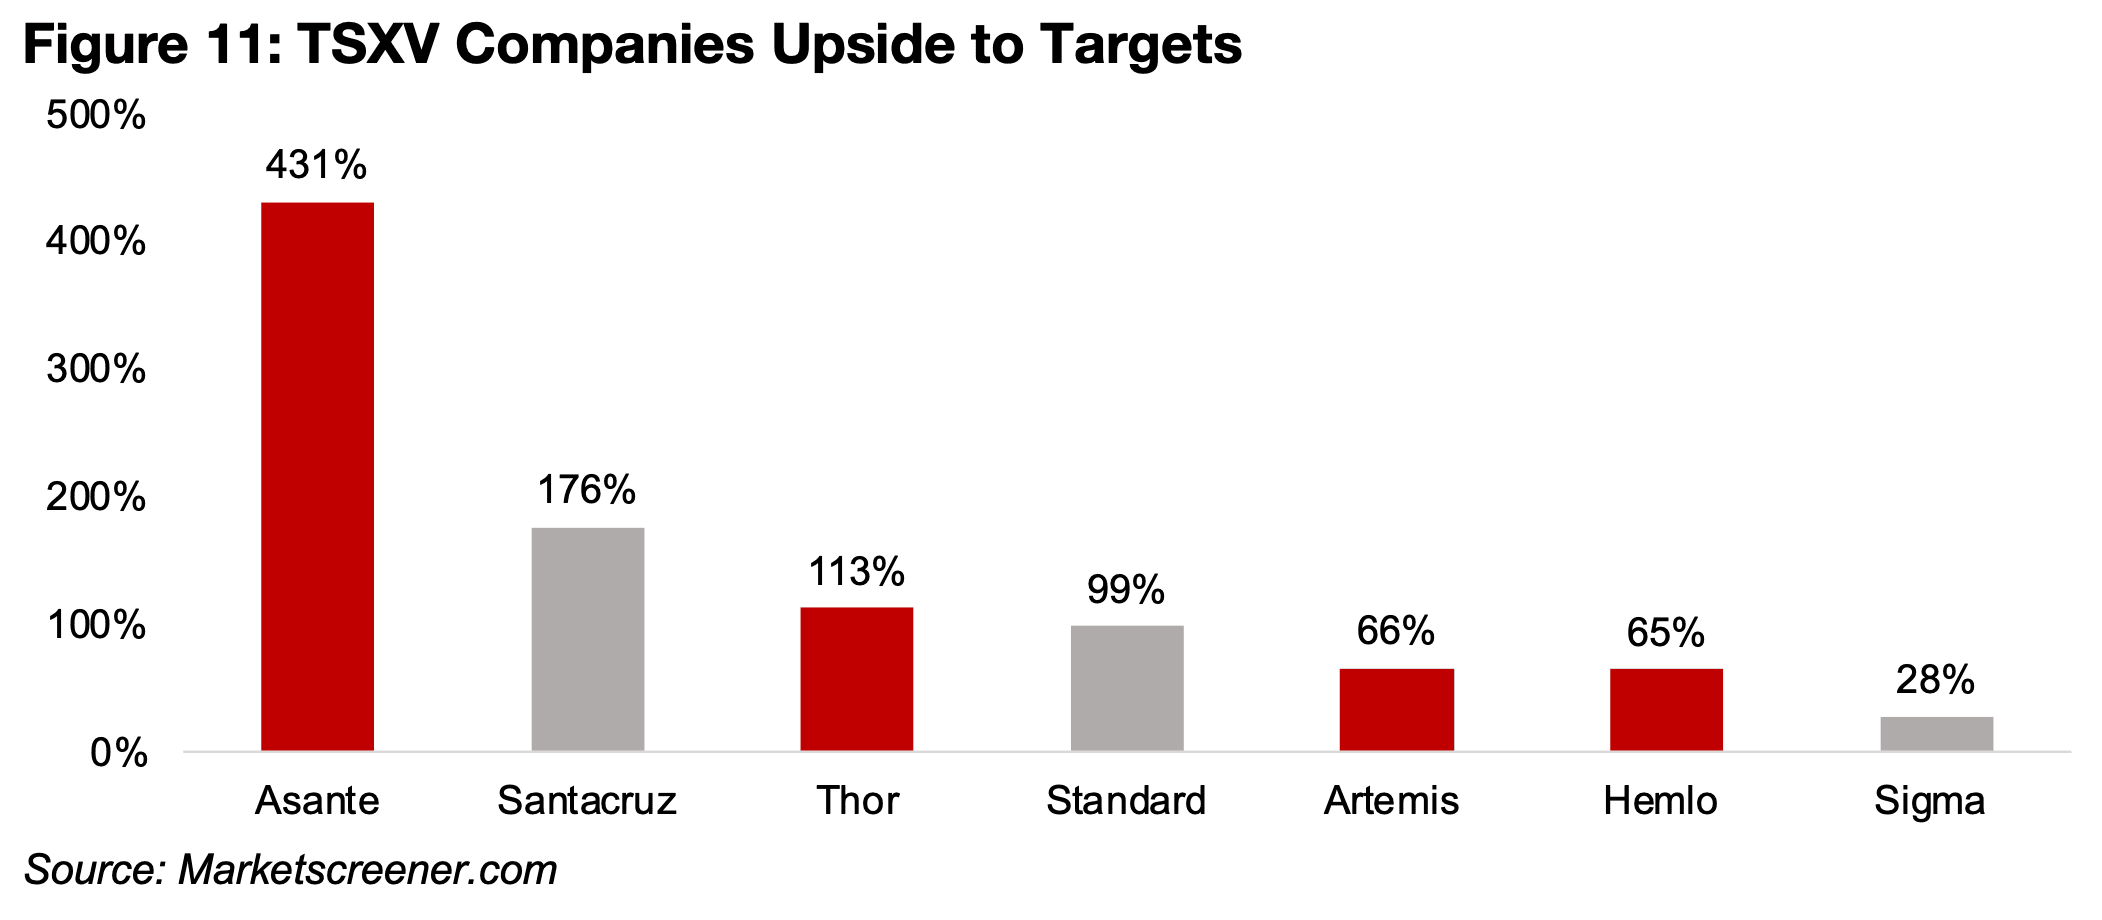
The market is the most bullish on the upside for Asante, with 431% upside to its
target, which could be driven by it hitting its strong production growth targets (Figure
11). The targets for the gold companies indicate 65%, 66% and 113% upside for
Hemlo, Artemis and Thor, with 28% and 99% gains implied for lithium companies
Sigma and Standard, and 176% upside for silver producer Santacruz (Figure 11).
Hemlo has recently announced its shift to a TSX listing and will therefore no longer
be considered part of this group. The two lithium companies have been supported
by a major rebound in the metal price this year, after its stagnated near lows through
most of 2024 and 2025. While Thor is producing at Segilola in Nigeria, it could deplete
its reserves by next year, although it is exploring to extend the mine life of the project.
While it expects to start operating Douta in Senegal by 2028, with a PFS having been
completed in January 2026, as this project’s annual production will be around the
same level as Segilola, it partly explains the company’s relatively low multiple.
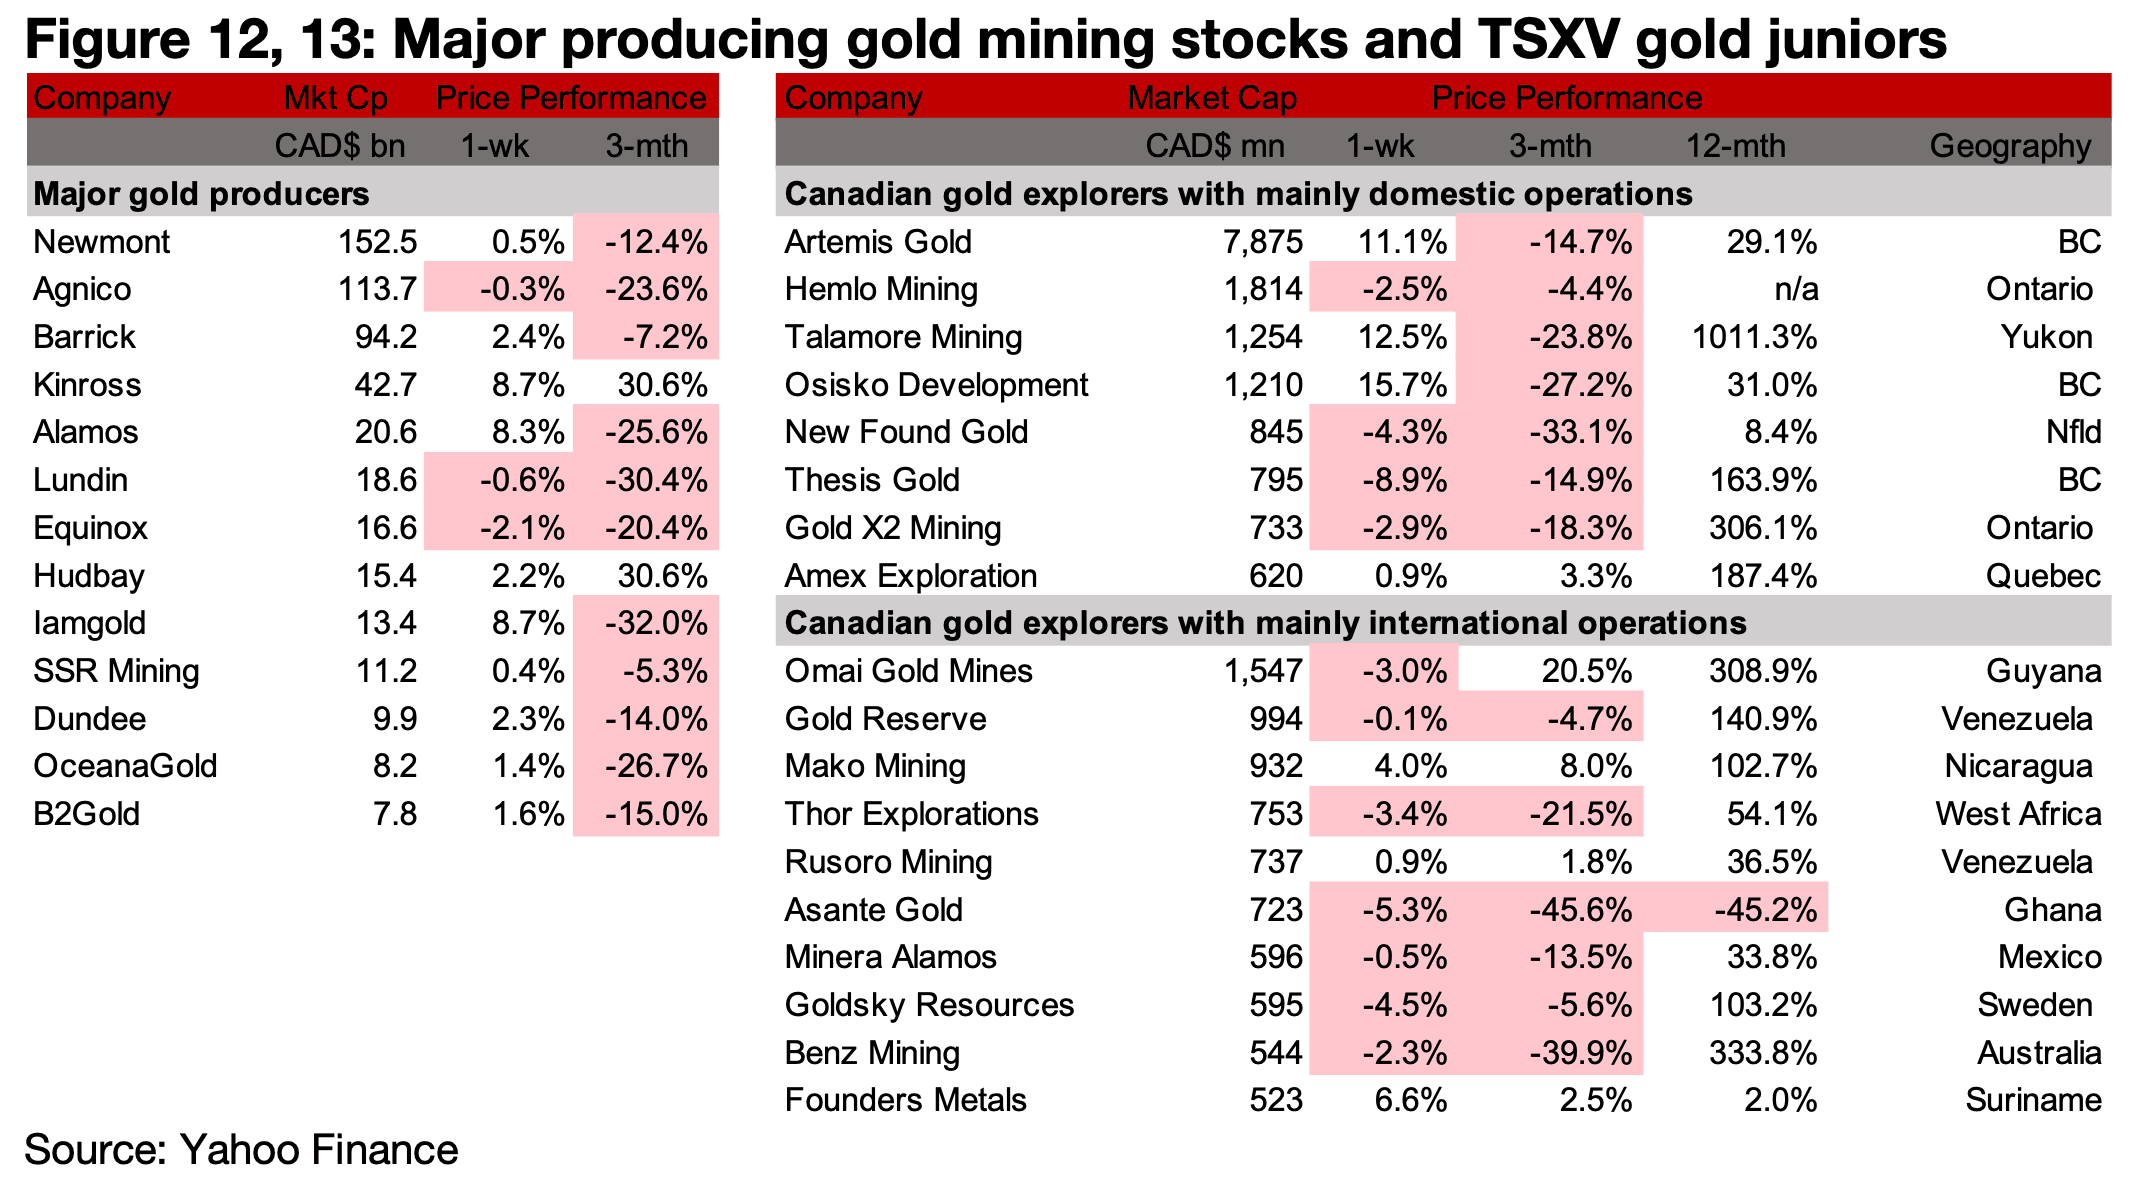
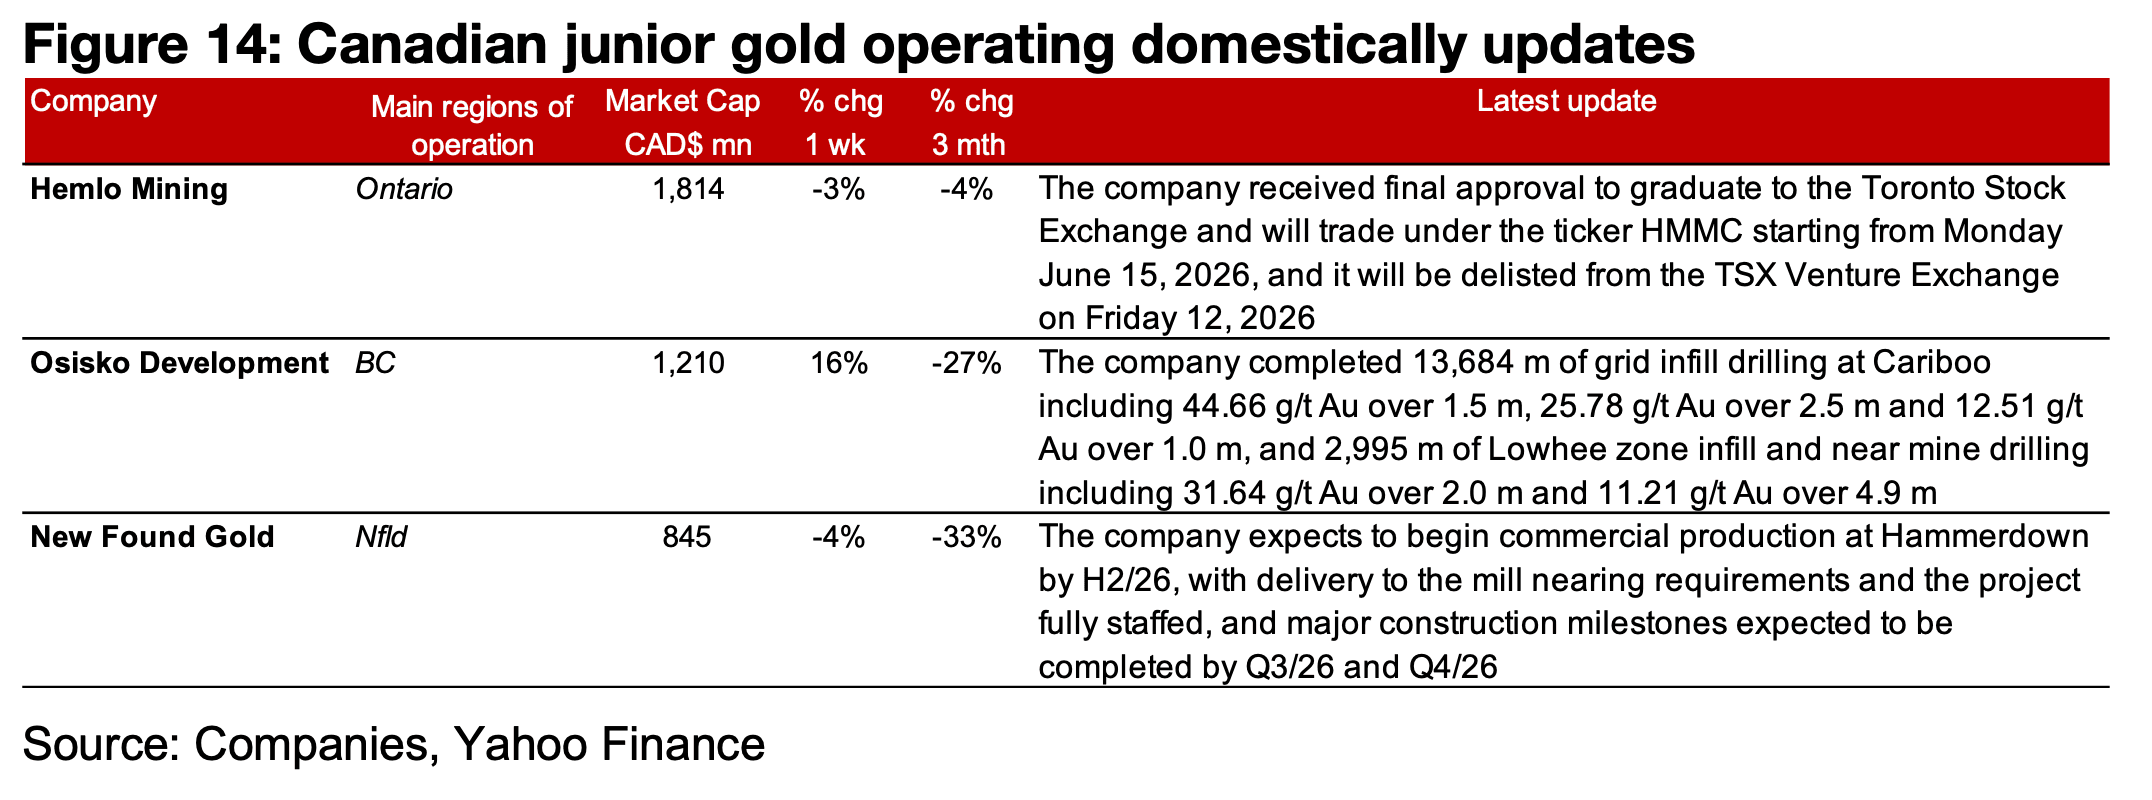
The major producers mostly rose and TSXV gold nearly all declined (Figures 12, 13) For the TSXV gold companies operating mainly domestically, Hemlo received approval to shift to the TSX exchange from the TSXV, Osisko Development reported drill results from Cariboo and New Found Gold provided an operational update on the Hammerdown project (Figure 14). For the TSXV gold companies operating mainly internationally, there was no major news.
Disclaimer: This report is for informational use only and should not be used an alternative to the financial and legal advice of a qualified professional in business planning and investment. We do not represent that forecasts in this report will lead to a specific outcome or result, and are not liable in the event of any business action taken in whole or in part as a result of the contents of this report.
Author
Ben McGregor authors the Weekly Roundup at CanadianMiningReport.com, providing sharp analysis of the metals and mining sector. With a talent for spotting trends, Ben distills complex market shifts into clear, engaging insights on TSXV junior miners. His weekly updates cover gold, copper, uranium, and more, blending data-driven perspectives with a knack for identifying opportunities. A vital resource for investors, Ben’s work navigates the dynamic junior mining landscape with precision.