

August 10, 2026
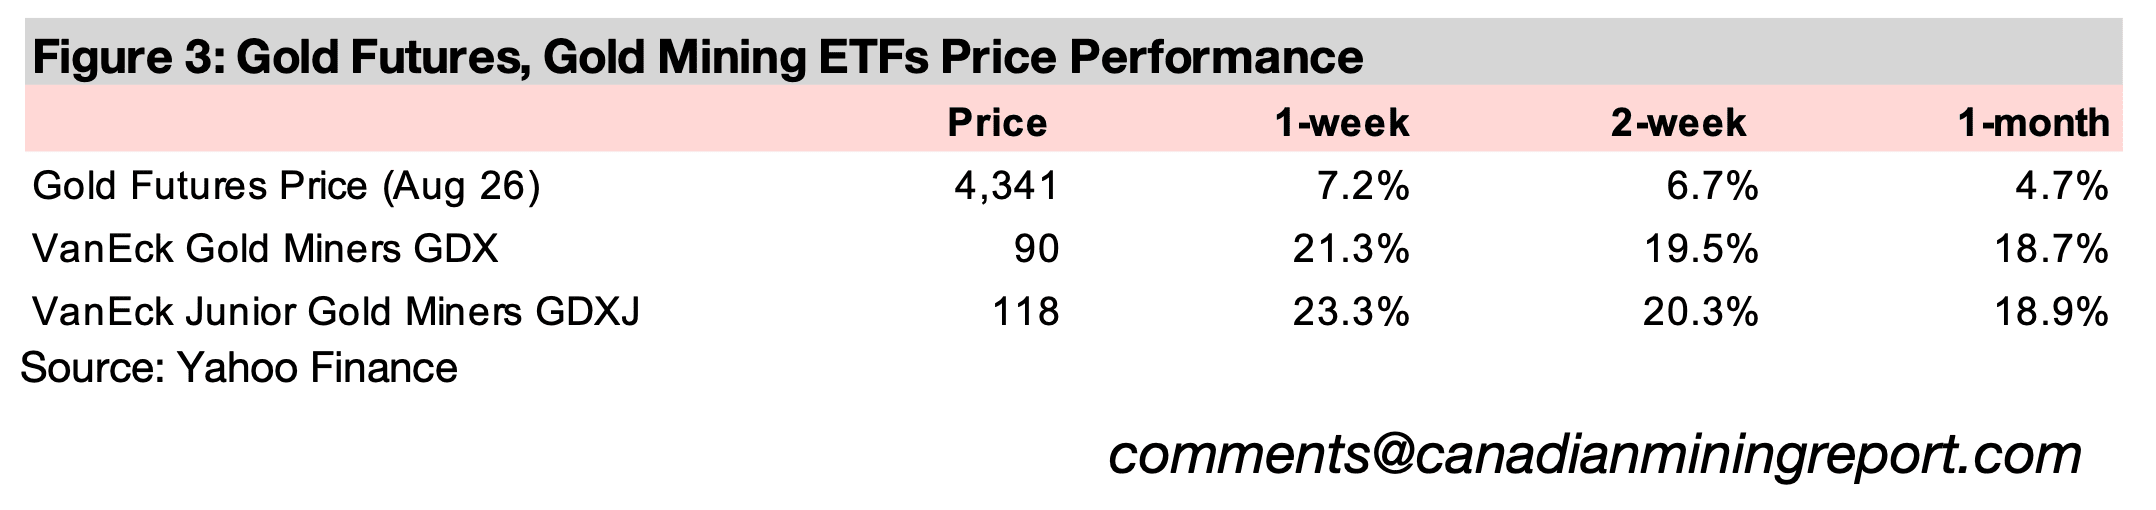
The gold price surged 7.2% to US$4,341/oz, on weakening U.S. jobs data that came in much lower than consensus estimates and tensions somewhat easing in the Middle East, leading to a decline in expectations for both inflation and rate increases.
While equities markets are at or near highs, so are their valuations, and credit spreads remain very low, suggesting an especially low level of fear in markets, which has often been a set up for major reversals, to which gold can be a significant hedge.
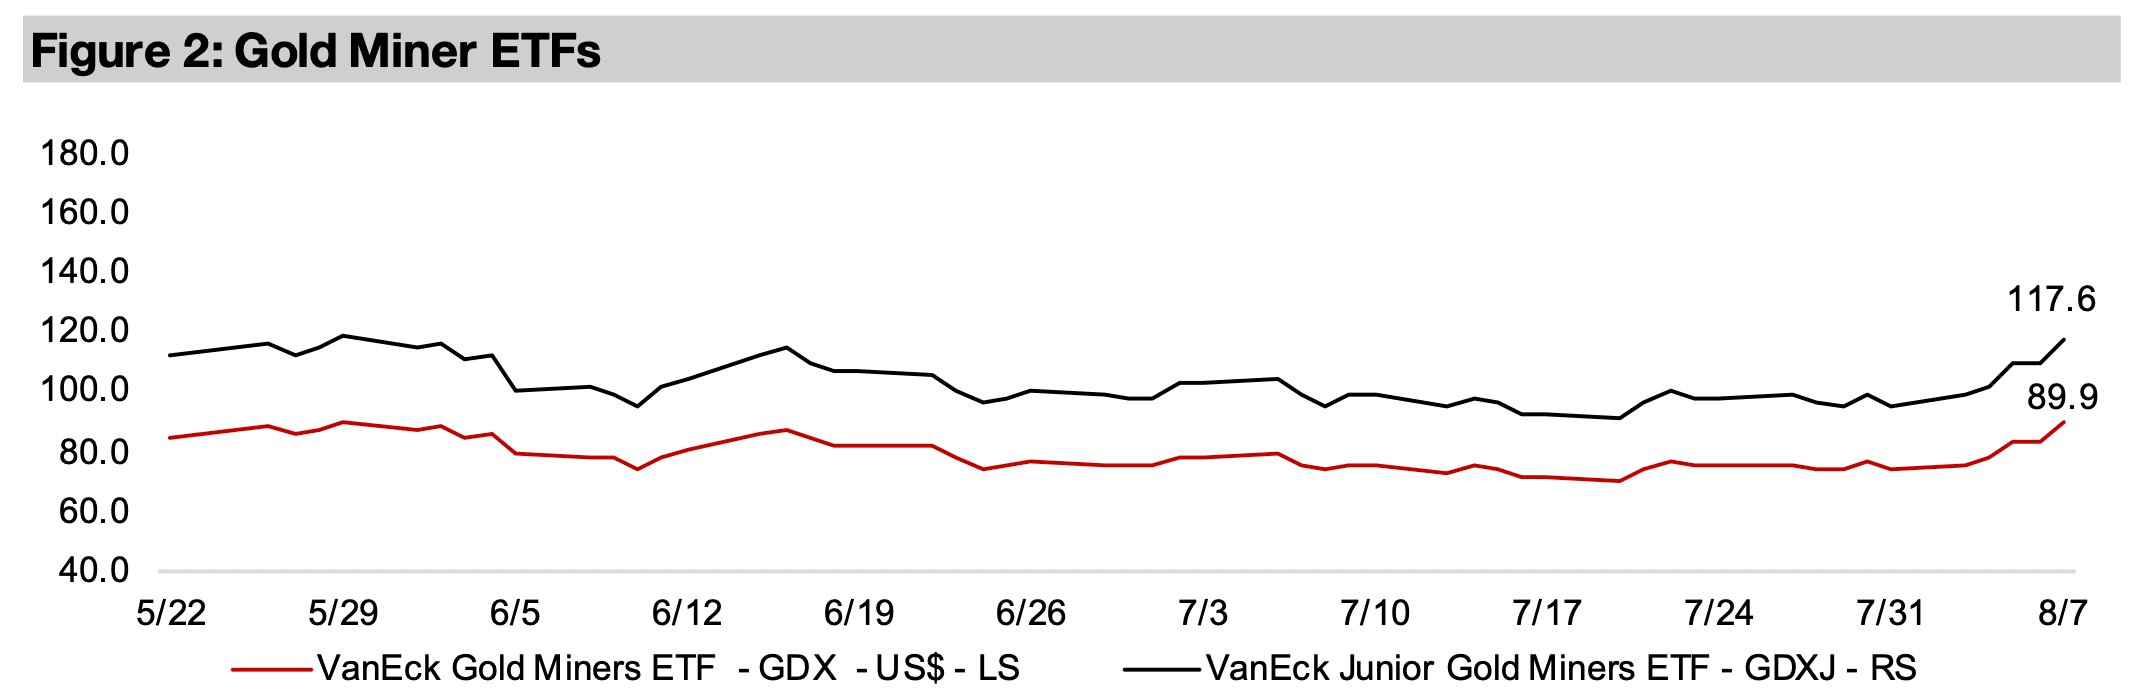
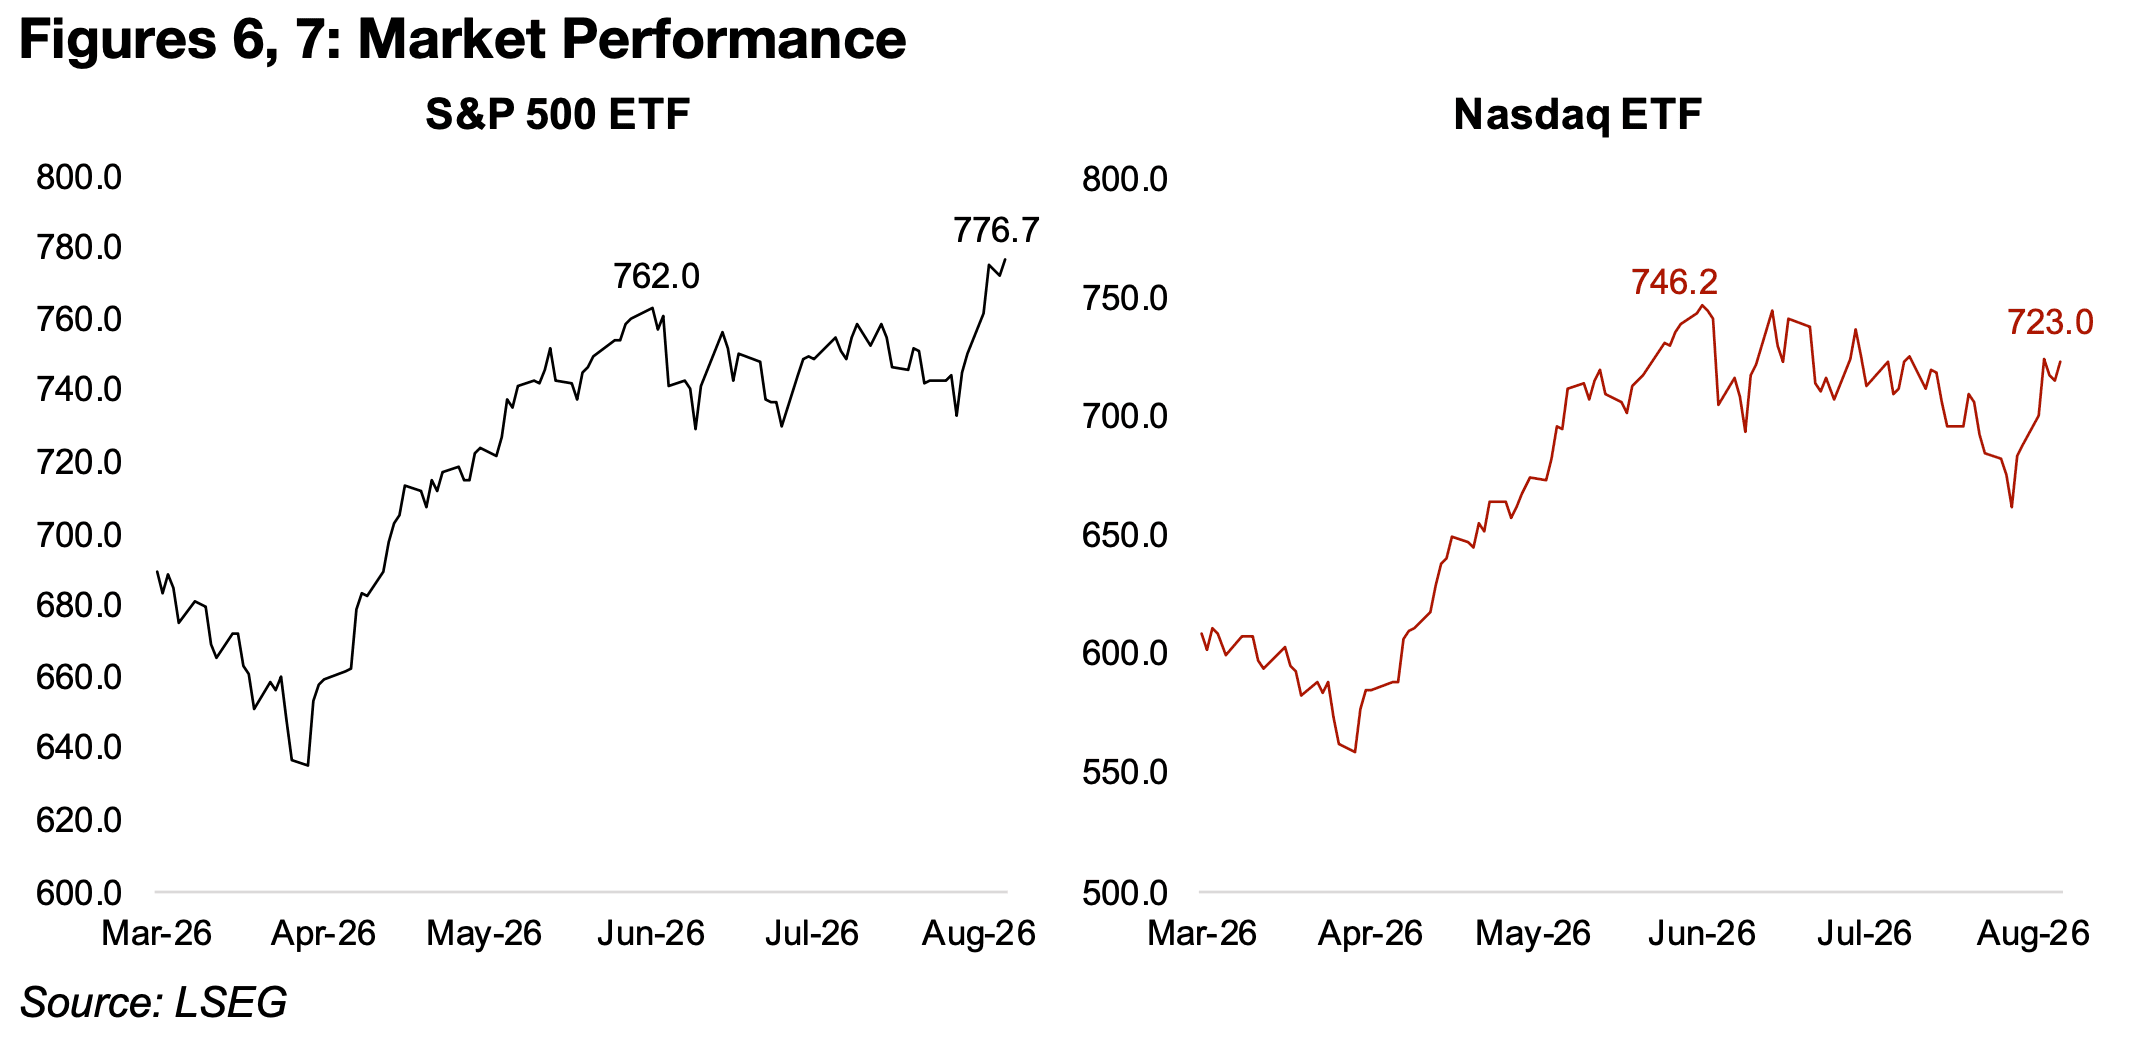
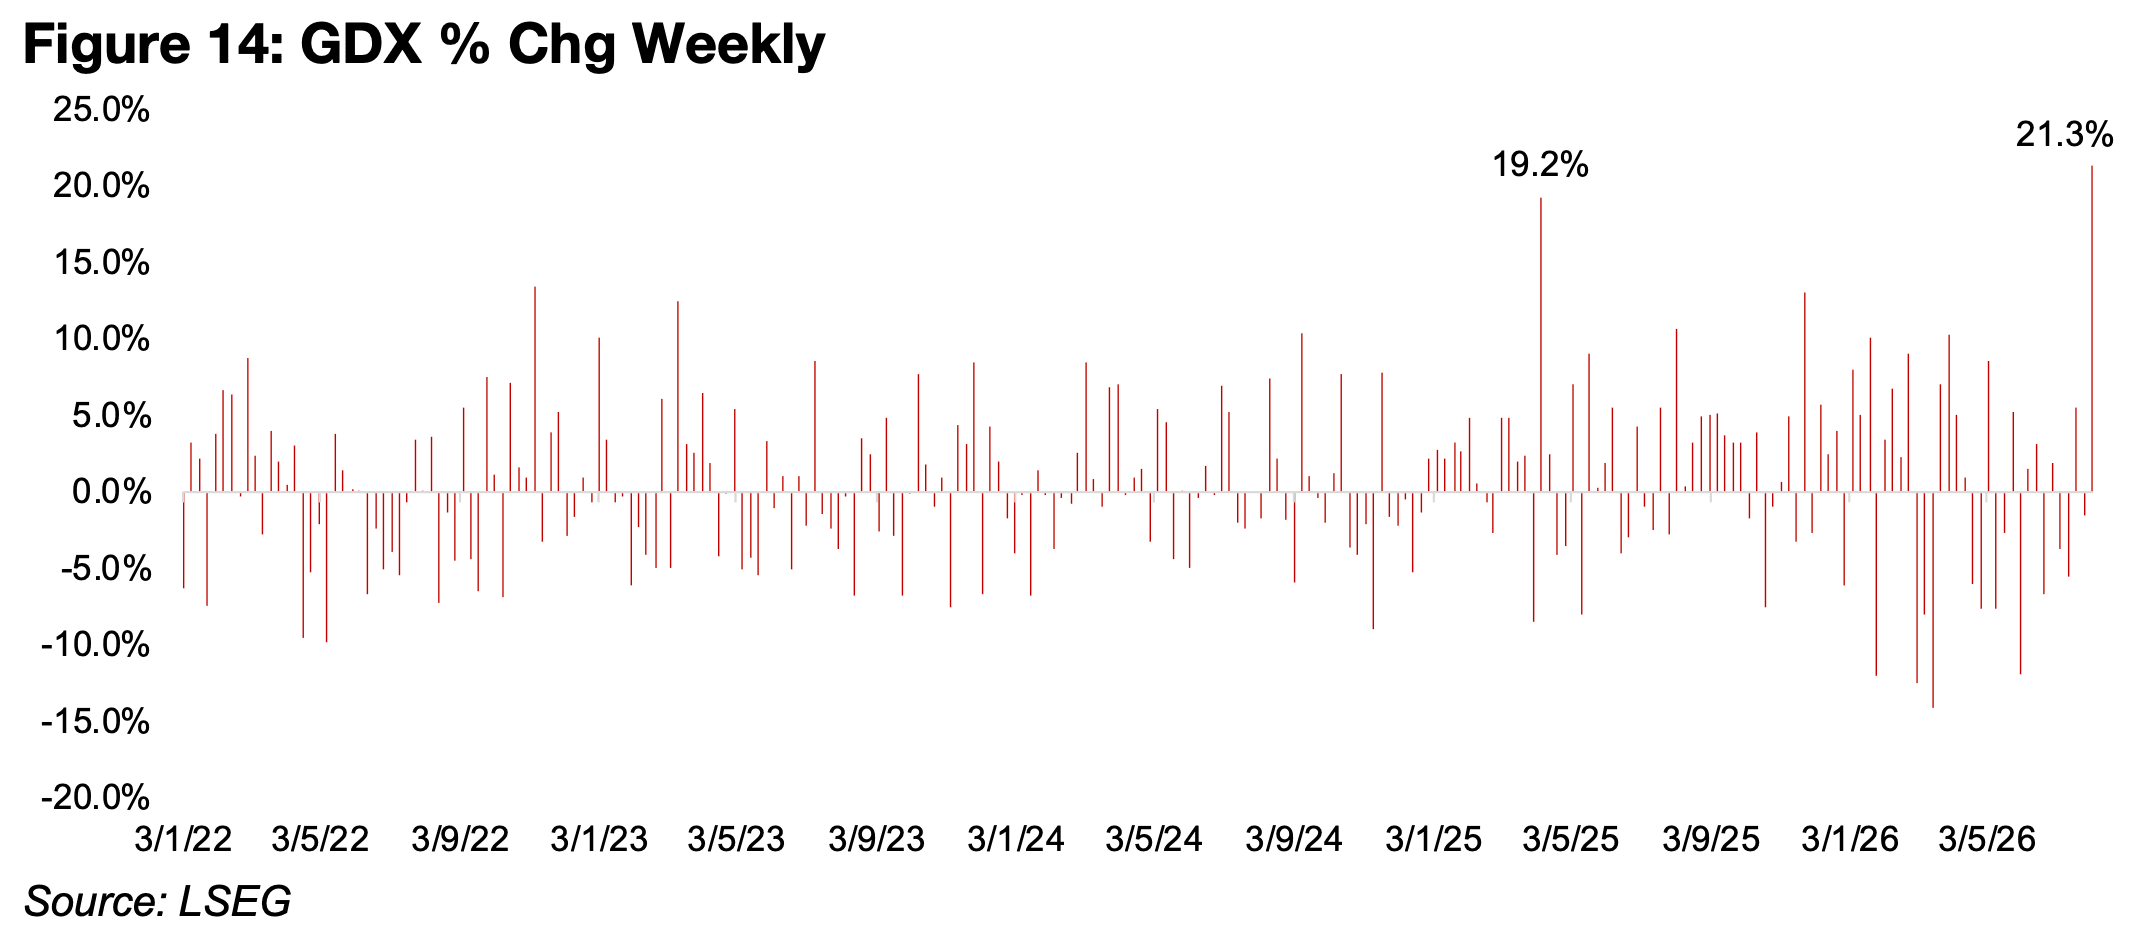
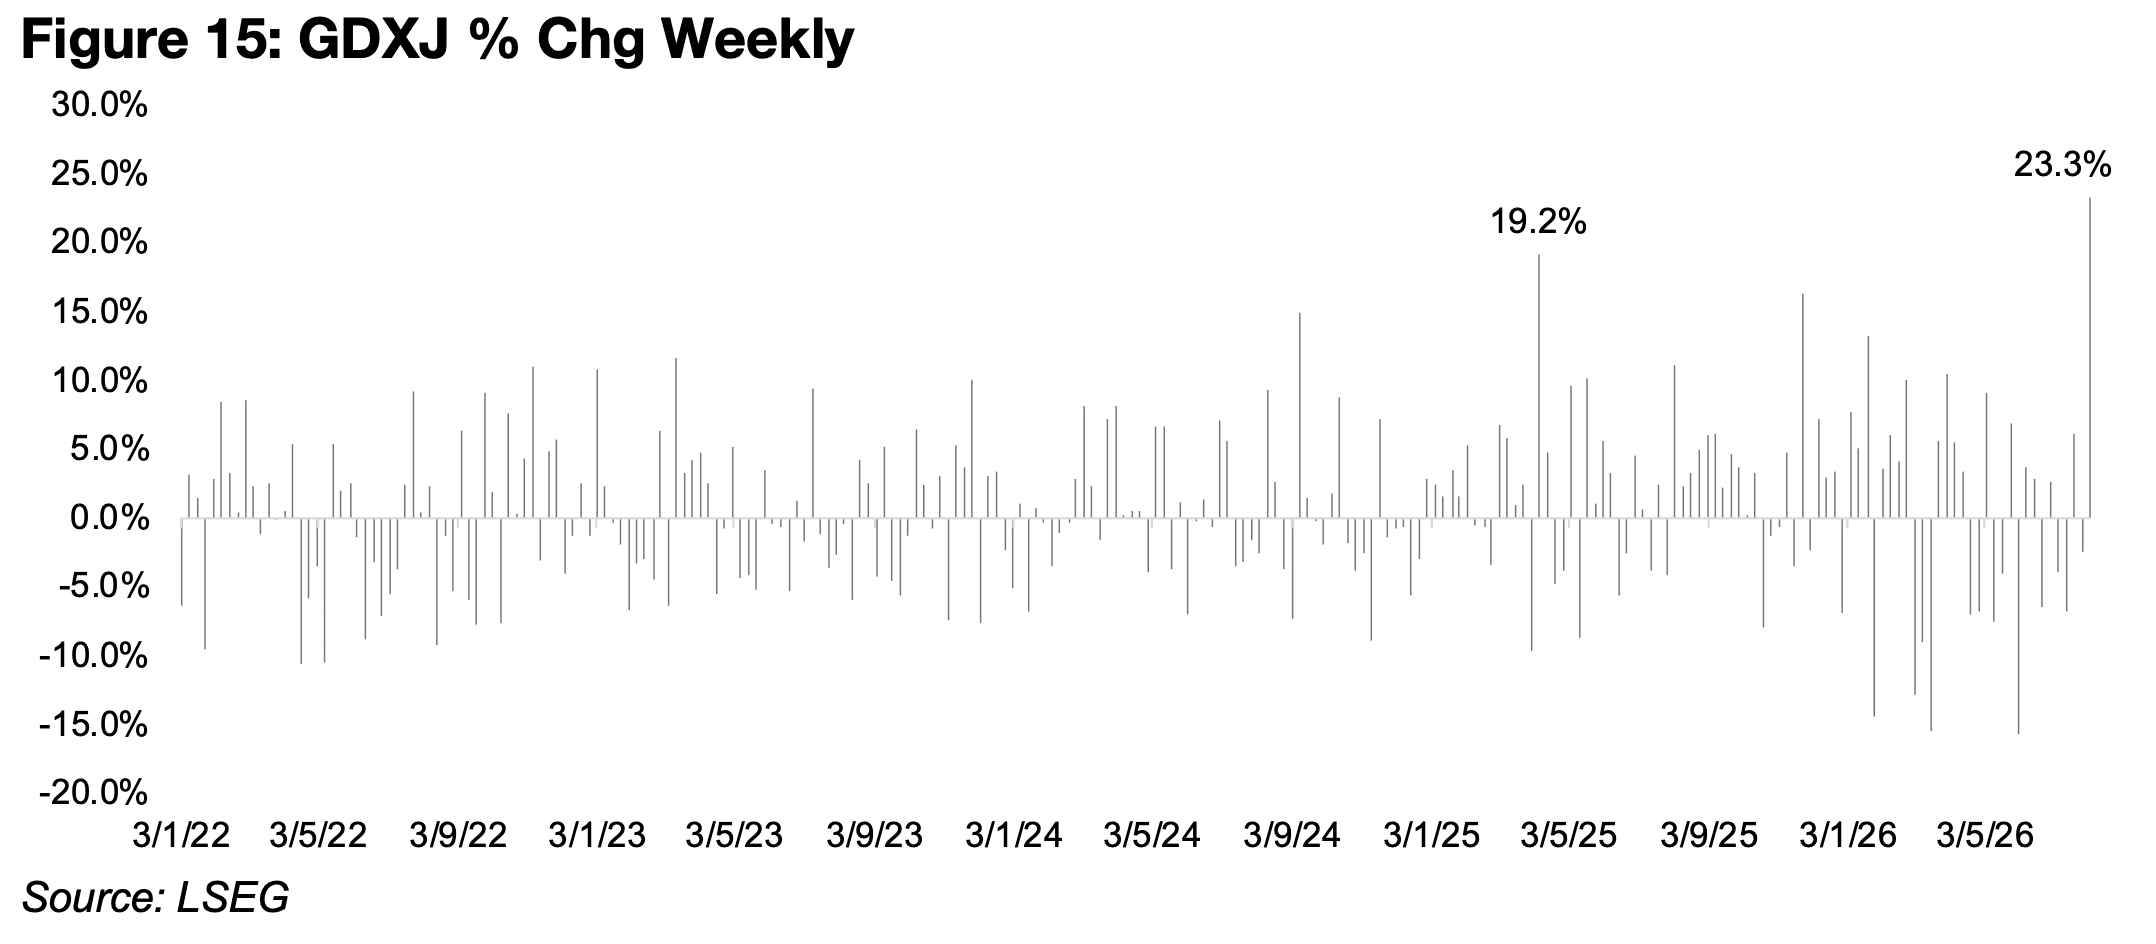
The gold stocks rocketed to their strongest week of the past decade, with the GDX up 21.3% and GDXJ gaining 23.3%, outpacing strong gains for equities, with the S&P 500 up 3.8% to new highs, Nasdaq rising 4.9% and Russell 2000 adding 3.4%.


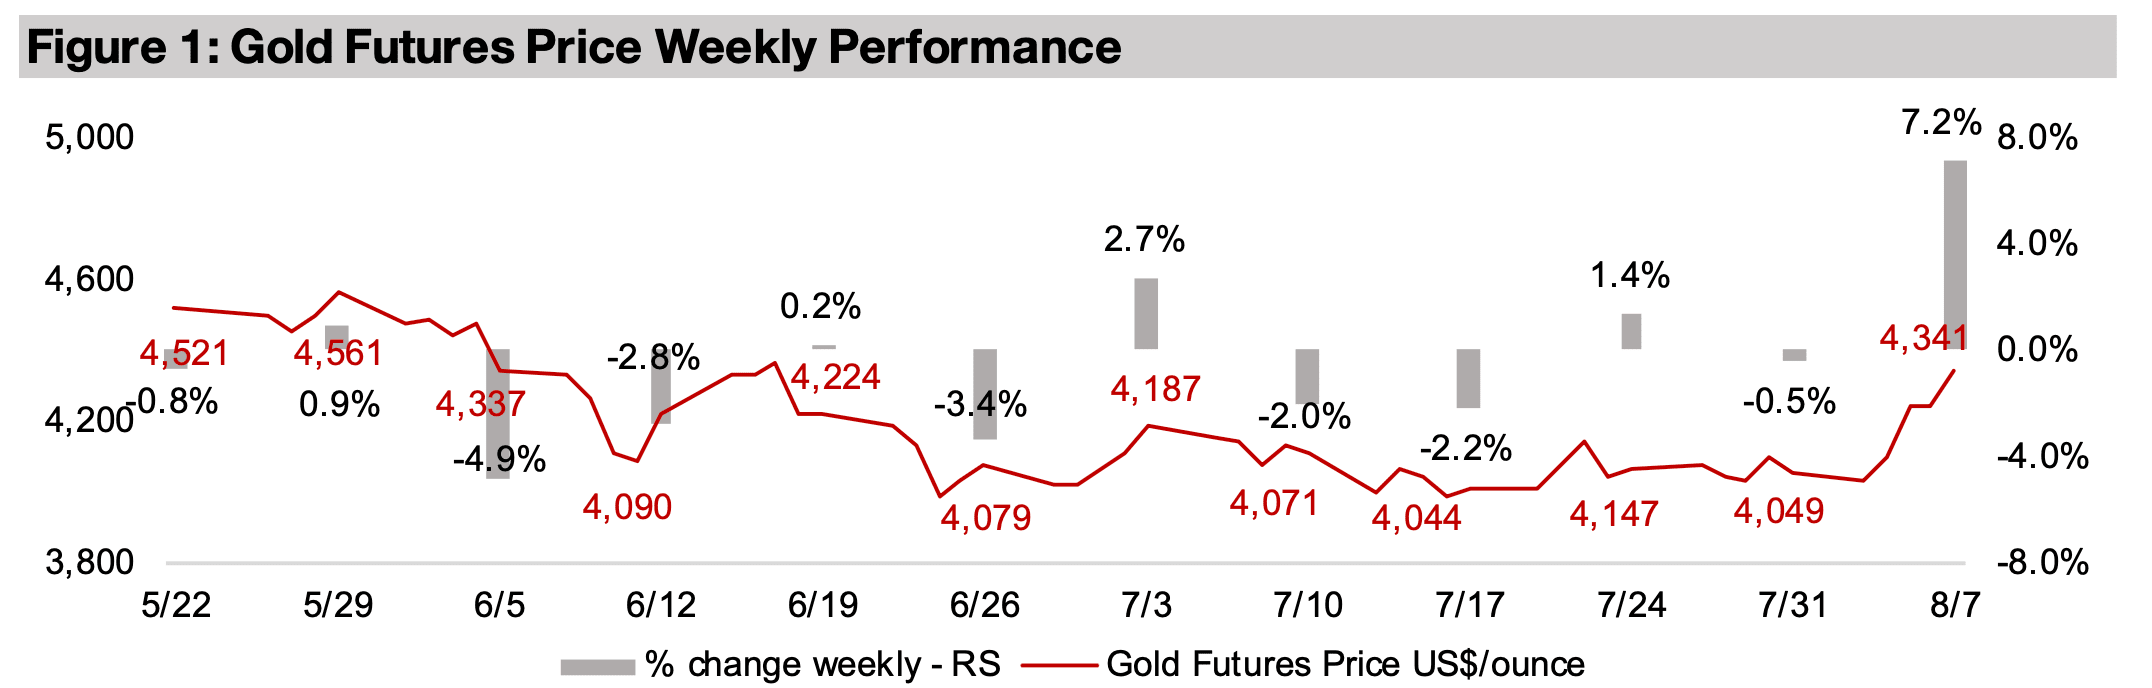
The gold price erupted, jumping 7.2% to US$4,341/oz, its largest weekly gain since
the third week of January 2026, after remaining dormant just above the US$4,000/oz
for the previous six weeks. While the main driver appears to have been weak US jobs
data, the metal price had become a bit of coiled spring after not only the recent
extended trough, but also the broader -24.8% downturn from its peak on January 28,
2026 at US$5,302/oz to the lows of US$3,986/oz on July 16, 2026. While this decline
had partly been from fundamental drivers putting pressure on the price, these seem
to have been finally priced in, and an unwinding of the severe speculative excesses
from early this year also seems to have completed about two months ago.
One of these key negative drivers had been rising real yields, which tend to be
inversely correlated to the metal, and concerns that they could move higher with on
upcoming U.S. interest rate increases. However, this had been partly based on
expectations of a continued strong U.S. employment situation and high oil prices
driving up inflation and therefore putting pressure on the Fed to hike rates. The shock
of weak U.S. jobs data and some progress on cooling the Middle East conflict, have
reduced these expectations substantially
The probabilities for a September 2026 rate hike plunged to just 44% from 81%
previously, and for October 2026 to 59% from 87%, showing the market shifting from
almost completely certainty of a rate hike over the next few months to a much more
opaque situation. There may be both a sustained decline in U.S. employment data
and extended peace in the Middle East, would could mean there is no rate hike from
the US Fed in 2026, in distinct contrast to the outlook just a week ago.
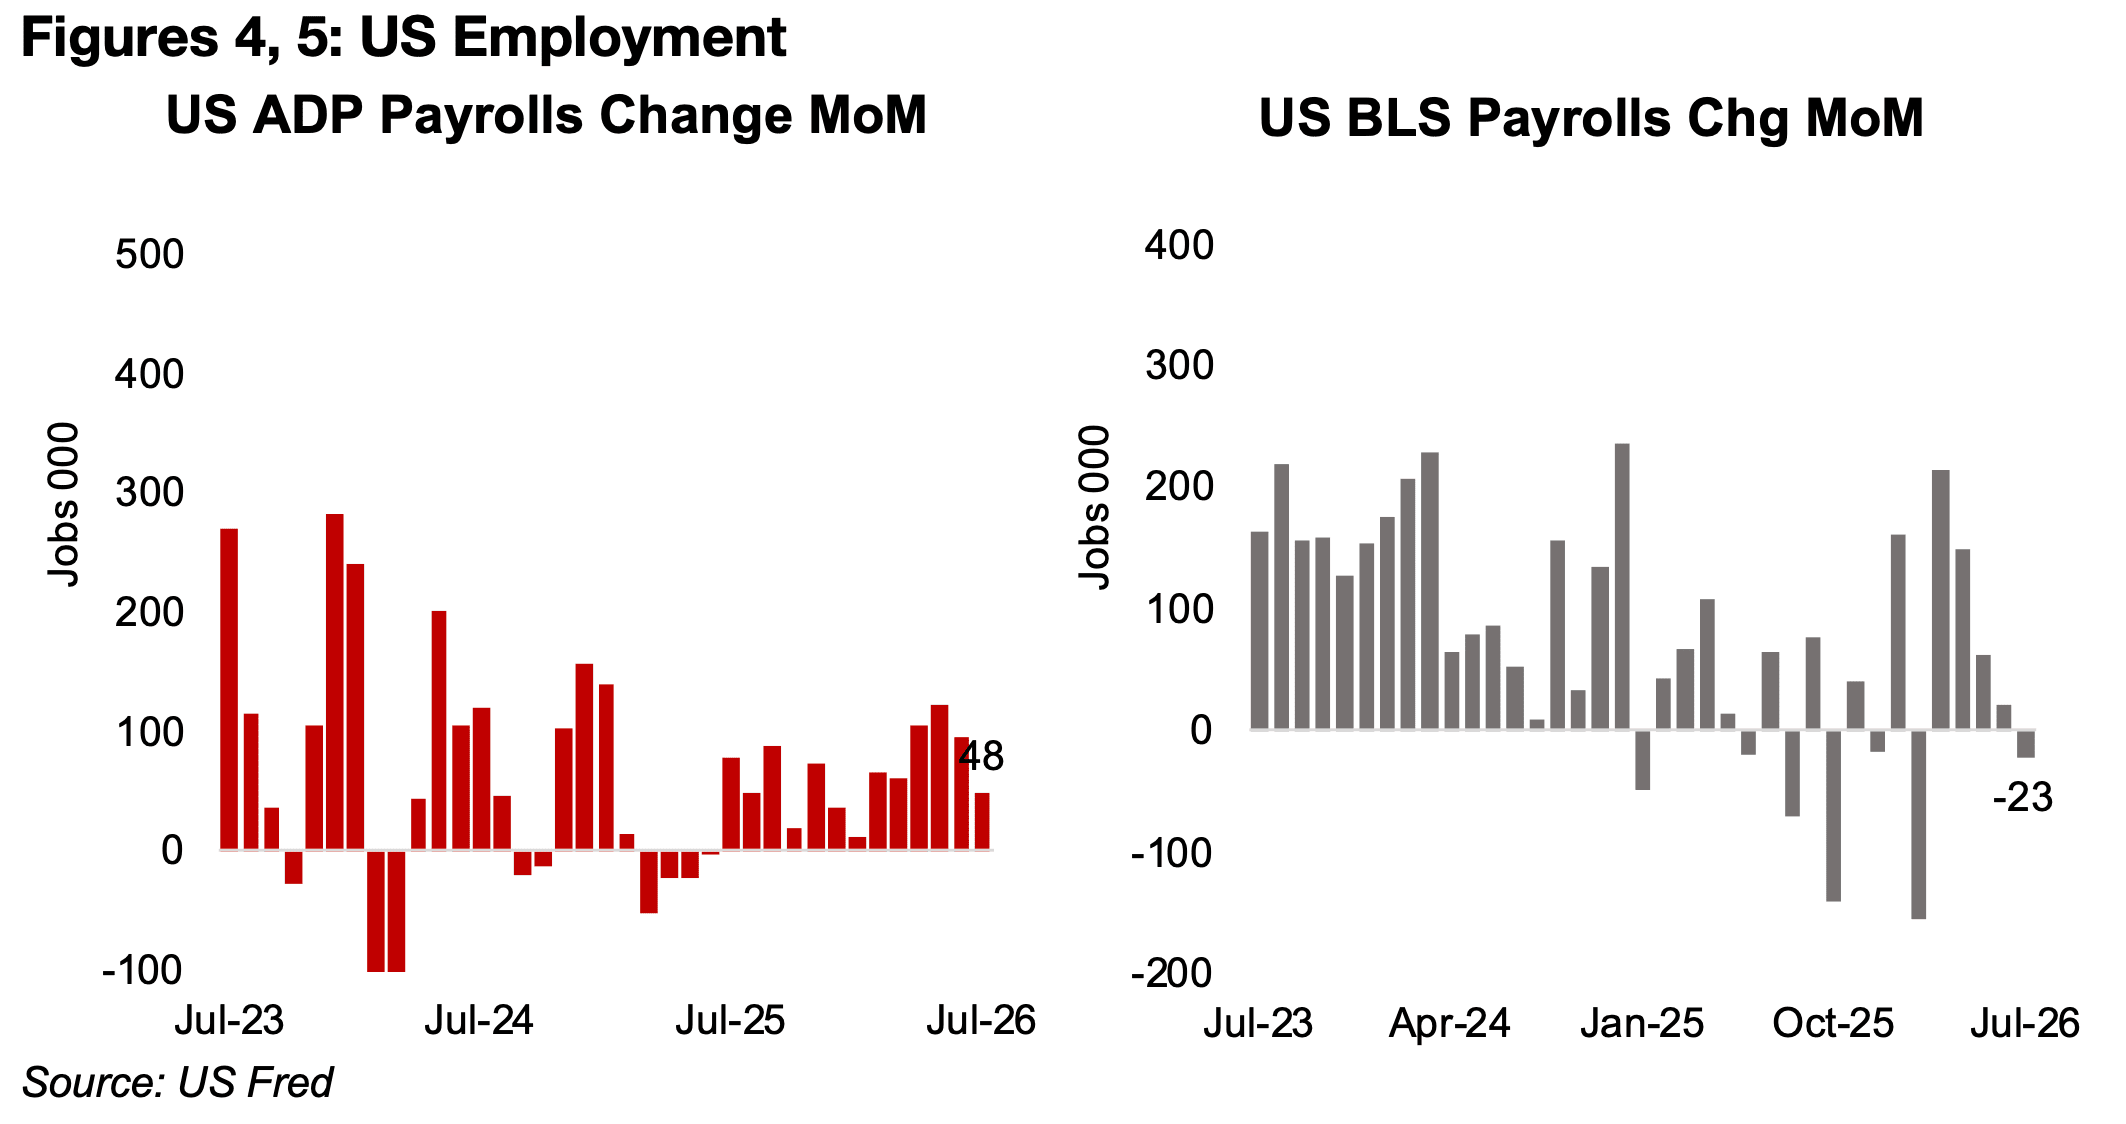
Both the major U.S. employment reports for July 2026 saw significant declines versus June 2026 and were considerably below market expectations. US ADP payrolls released at the end of the week rose 48k, versus expectations of 75k, down from 95k in the previous month, and a peak of 122x in May 2026 (Figure 4). The US BLS payrolls were released mid-week, and seem to have been the major driver of the jump in the gold, with a -23k contraction far below the market’s expectations for an 83k increase, and slumping considerably from a peak at 214k in March 2026 (Figure 5).
The potential for interest rates to remain on hold and lower oil prices boosted equities
market substantially, with the S&P 500 jumping 3.8% and finally breaking through to
new all-time highs after struggling for gains through June and July 2026. While
Nasdaq also saw major 4.9% gains, it has not regained its early-June 2026 highs and
prior to this jump had declined quite significantly in the second half of July 2026 as
AI stocks were pressured (Figure 6). The Russell 2000 rose 3.4%, reaching new highs
mid-week, but had edged just below these levels by the end of the week (Figure 7).
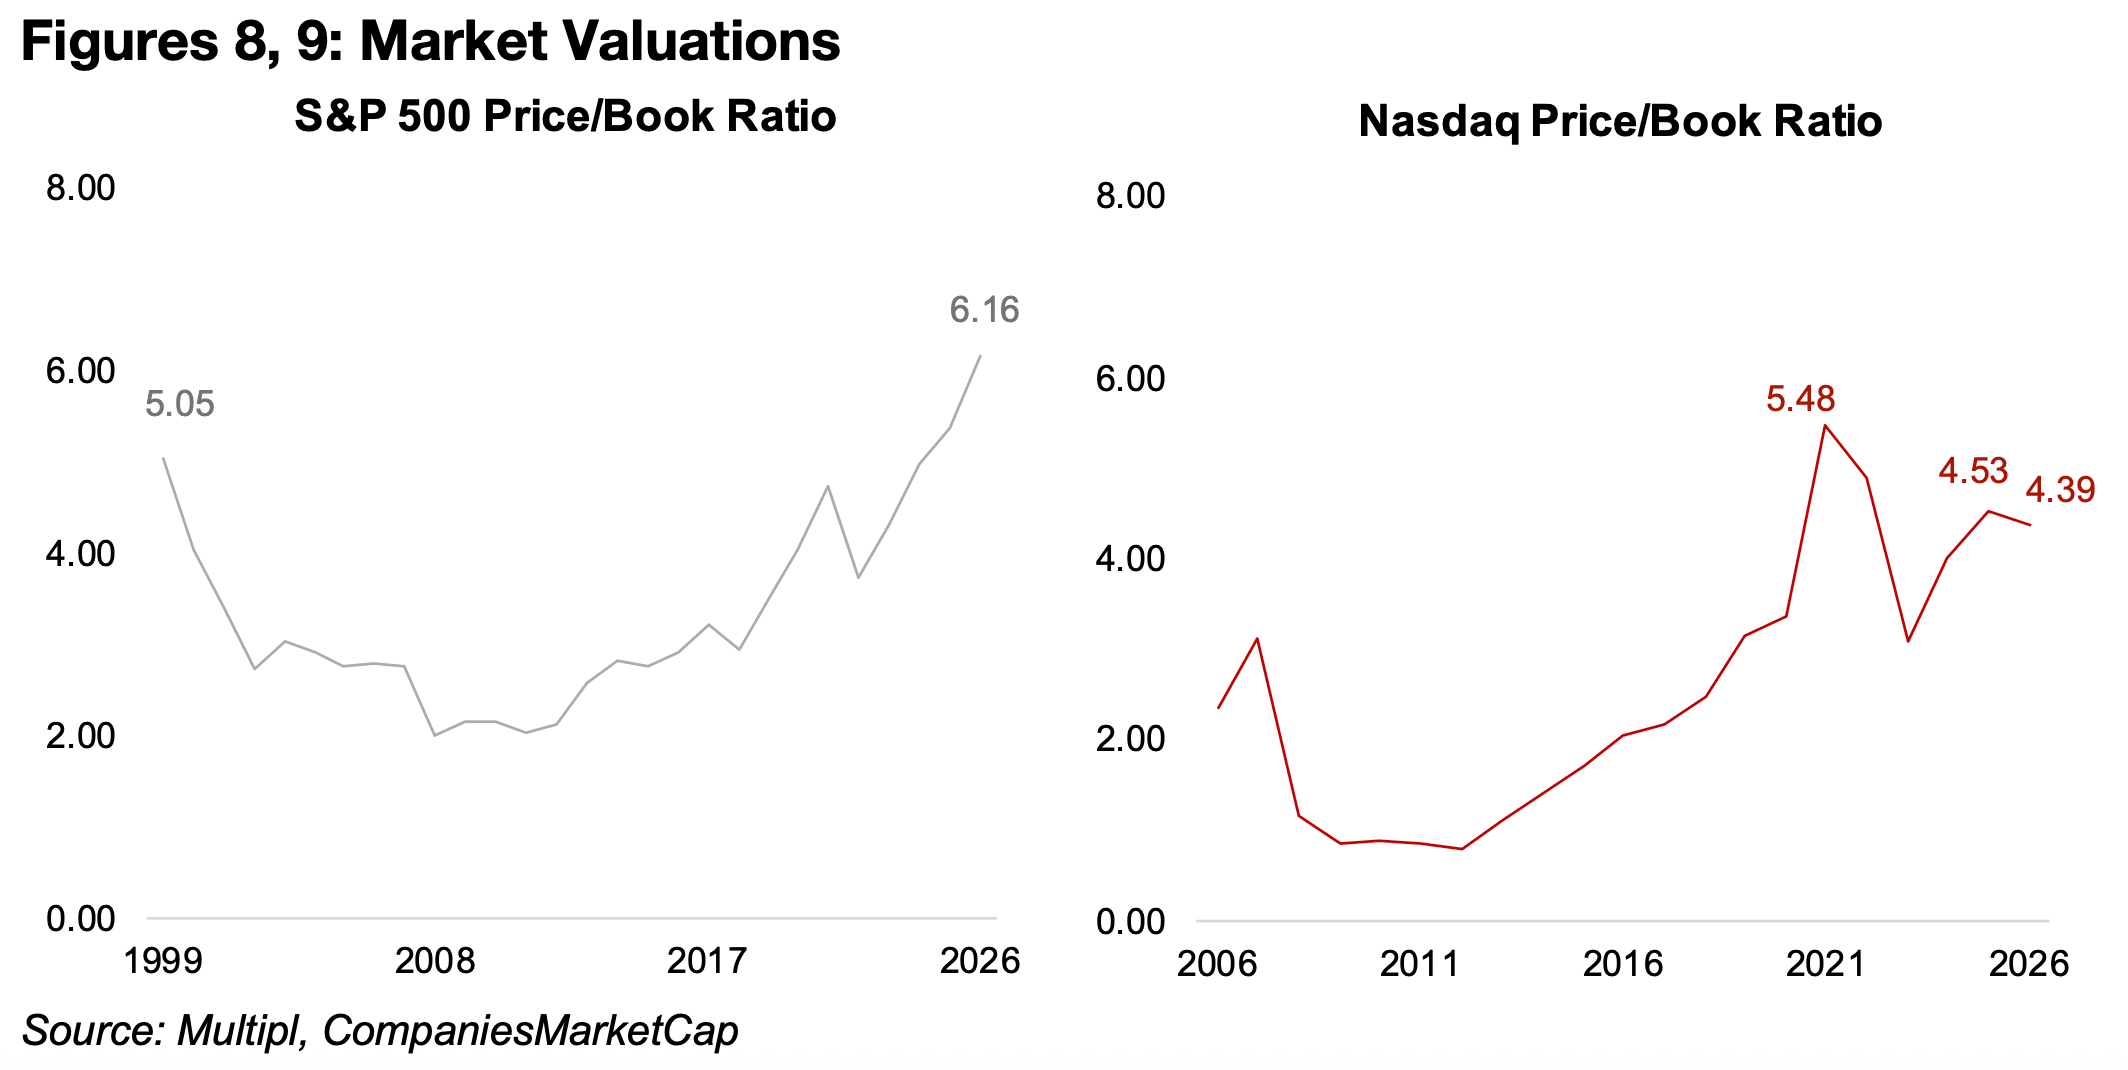
However, these breakouts may not necessarily be signs of market health, as they are
based on valuations which have also surged towards historical highs and are looking
increasing risky. The price to book multiple for the S&P 500 at 6.16x is well above
even the previous peak of 5.05x in 1999 during the dot.com bubble, which saw
multiples slump over the next decade to lows around only 2.0x (Figure 8). While the
Nasdaq P/B at 4.39x is actually off the highs of 5.48x in 2021 when many tech stocks
saw huge earnings gains from the global health crisis, this multiple is still extremely
elevated versus the past two decades (Figure 9). There are major increasing market
concerns over the sustainability of the earnings growth and multiples of the AI stocks
that are the key drivers of the high valuations.
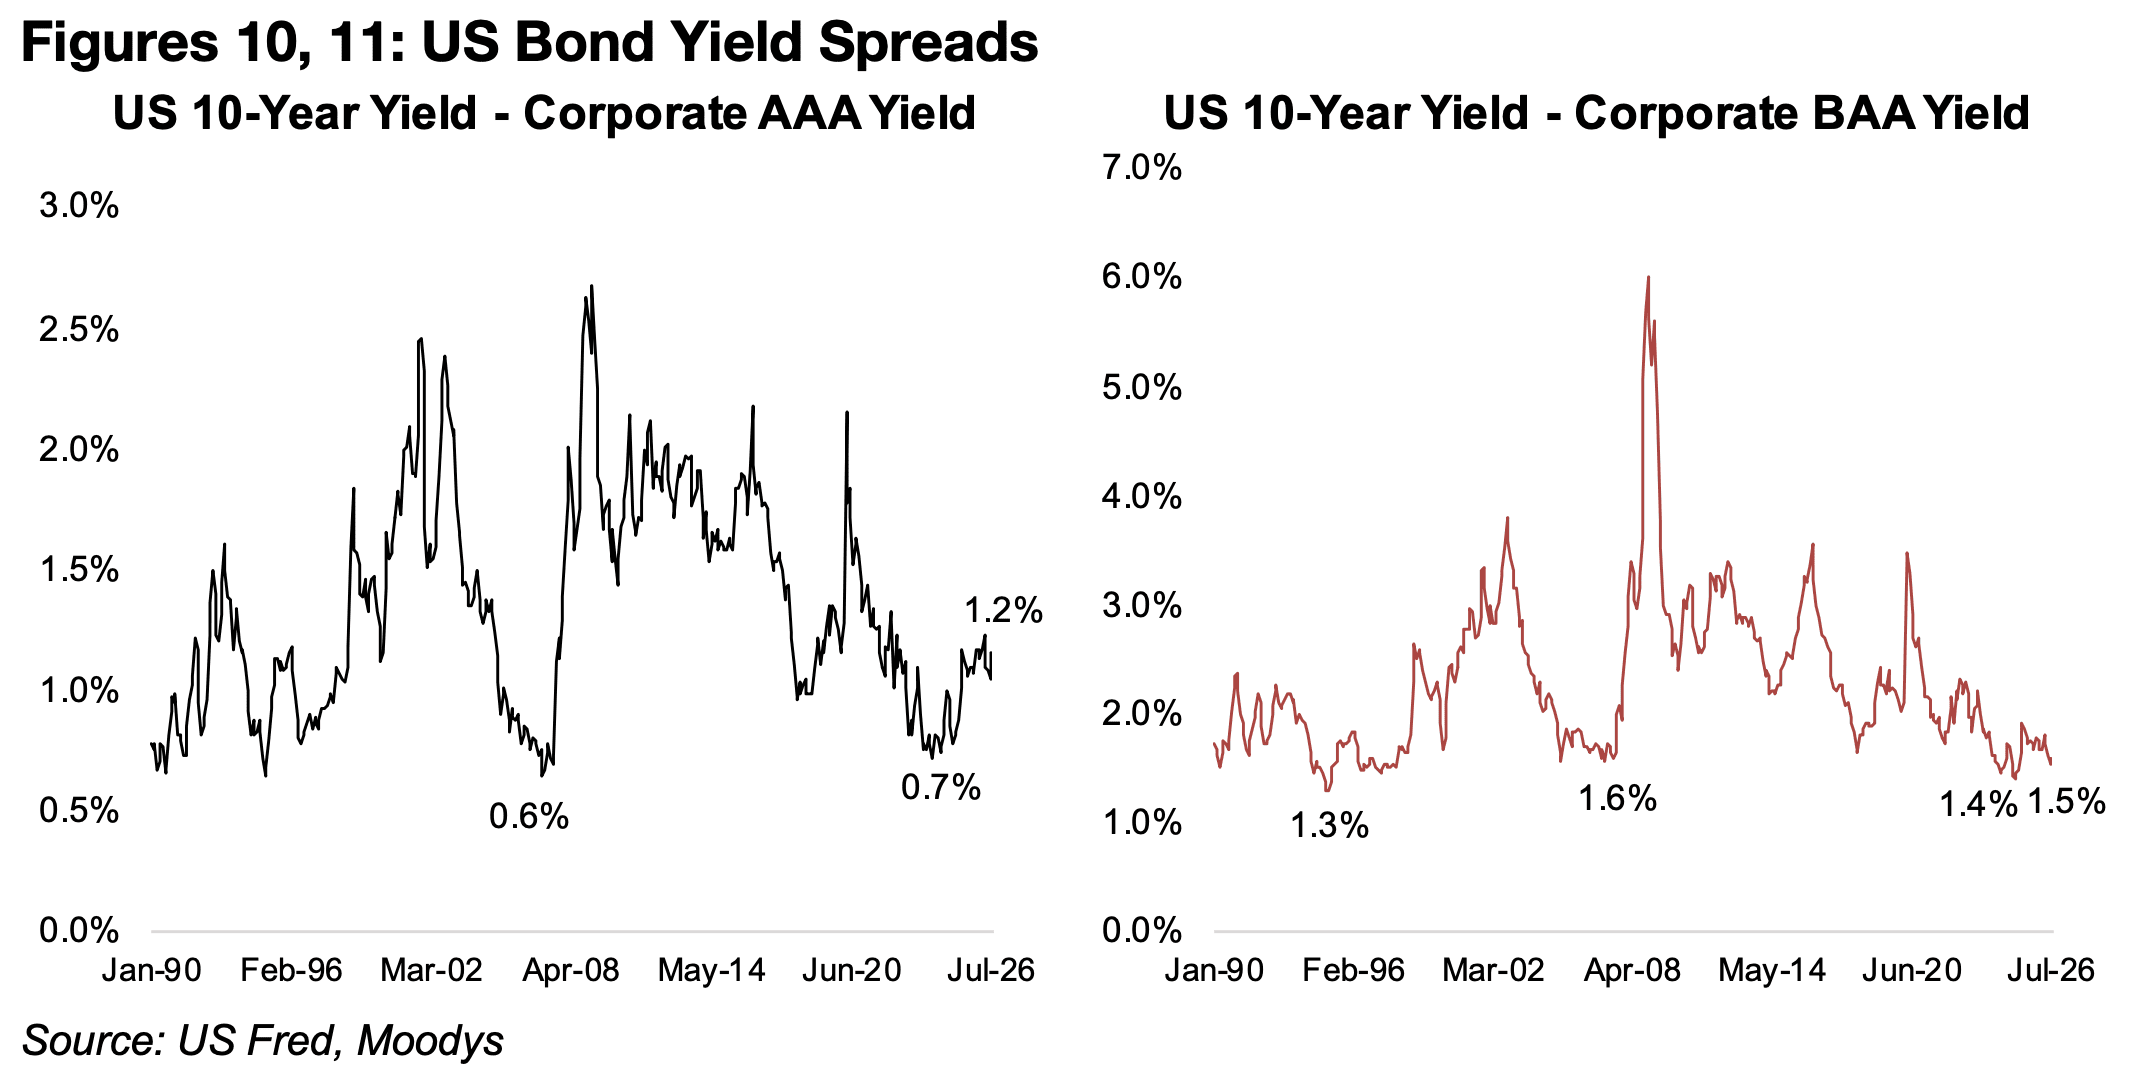
Another warning sign that markets may have not been pricing in enough risk is extremely low credit spreads. While the spread between Moodys AAA corporate bonds the US 10-year yield has risen from a trough of 0.7% in late 2024 to 1.2%, this is still very low versus the past four decades, and levels this low have often been followed by major surges (Figure 10). However, the spread between the riskier Moodys BAA corporate bonds versus the US 10-year at 1.5% is actually still near the lows of 1.4% in November 2024, which is the lows level since the mid-1990s (Figure 11). This may indicate that the market is assuming that the currently bullish market conditions will persist, which we view as increasingly risky, and against which gold is a hedge.
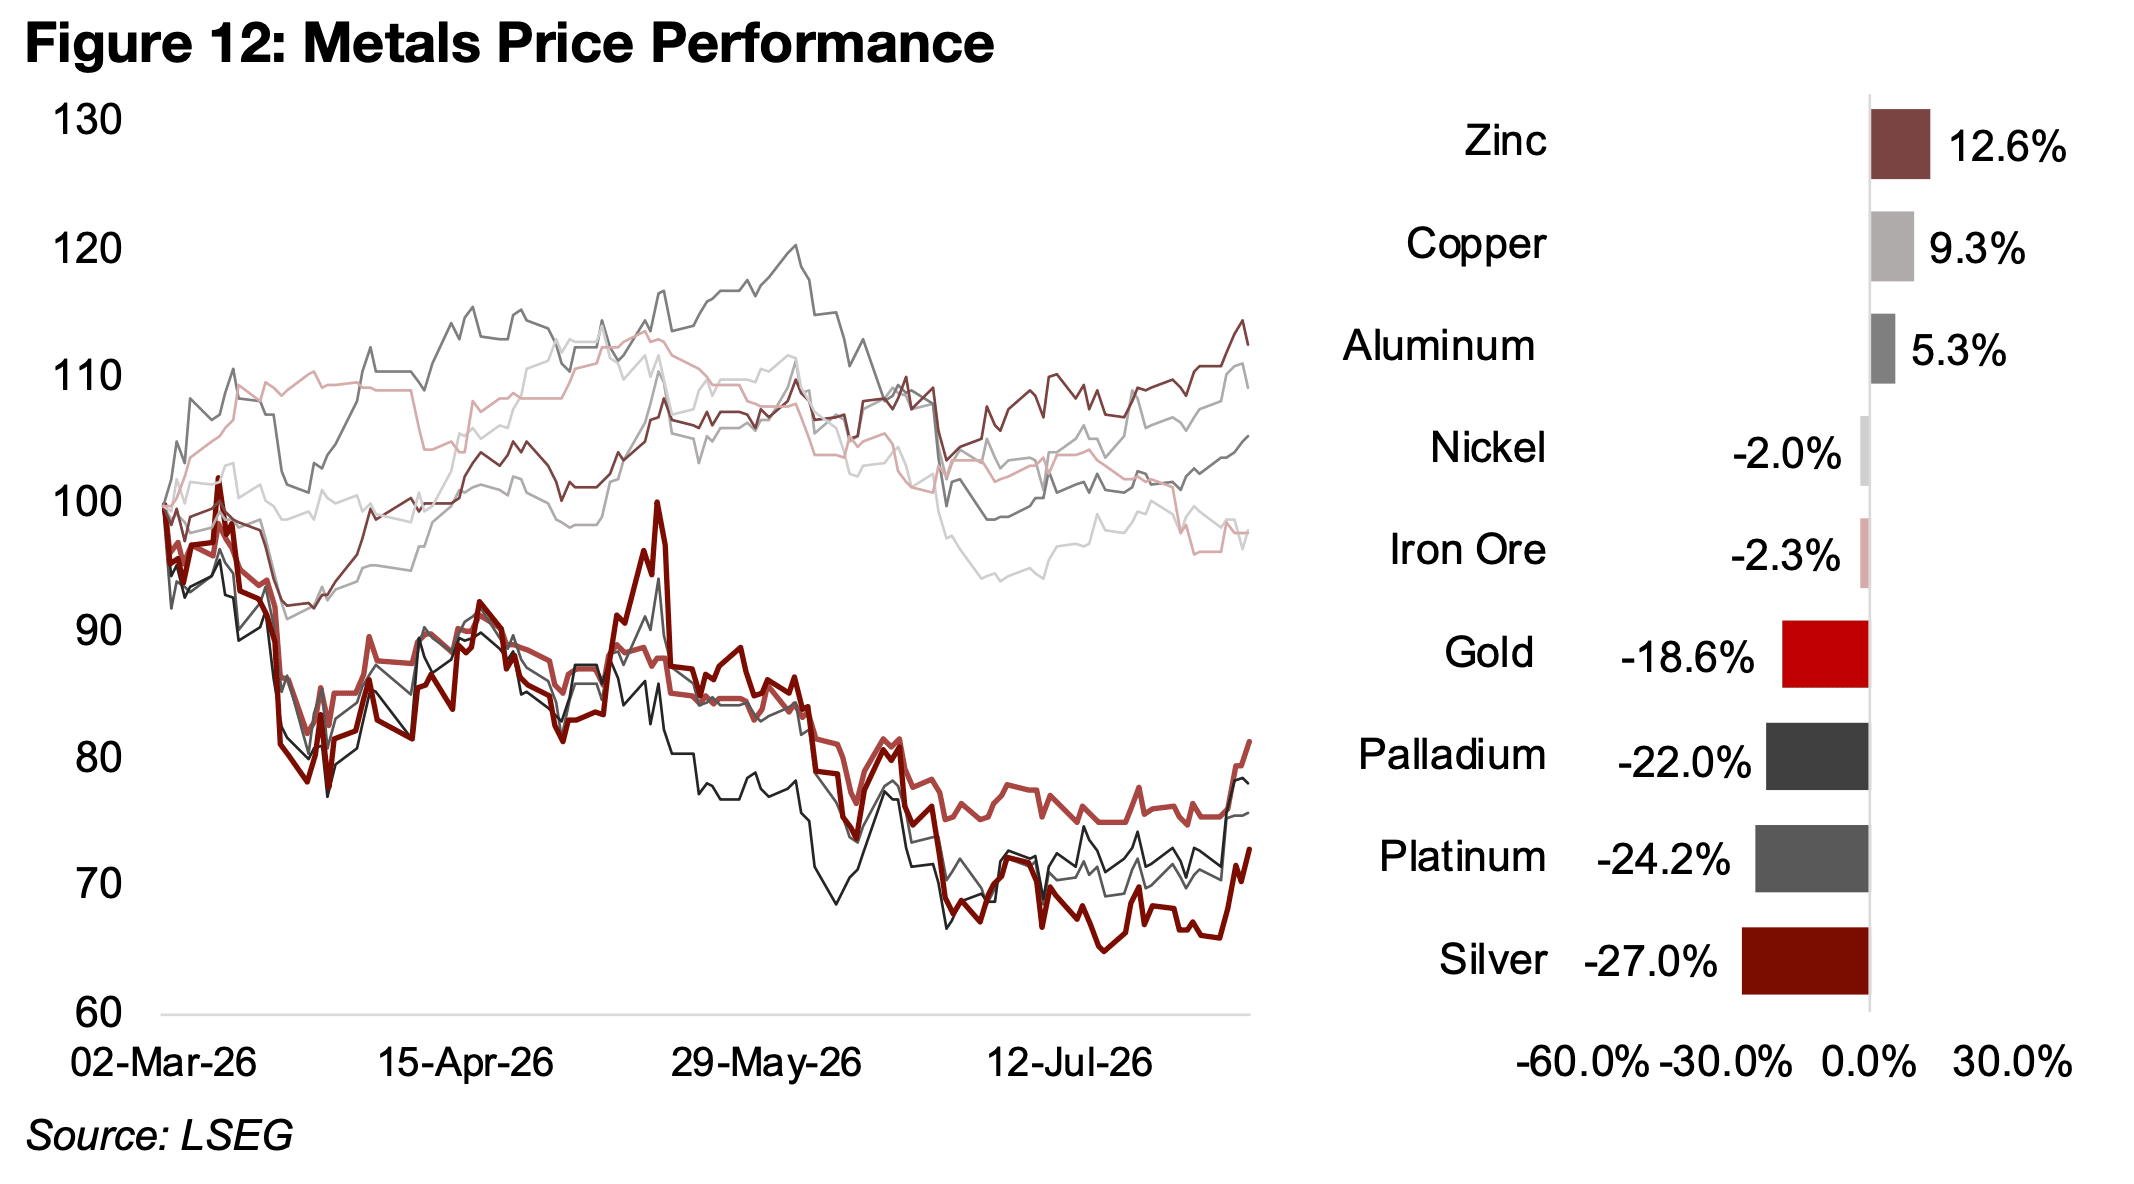
There was also a broader rebound in the precious metals, with major gains for silver, platinum and palladium. All three of these metals have underperformed gold’s -18.6% drop, declining -27.0%, -24.2% and -22.0%, respectively and the entire segment far below the gains for most of the base metals, with aluminum, copper and zinc up 5.3%, 9.3% and 12.6% (Figure 12). However, the rebound this week suggests that markets may be moving back into monetary-driven metals as a hedge.
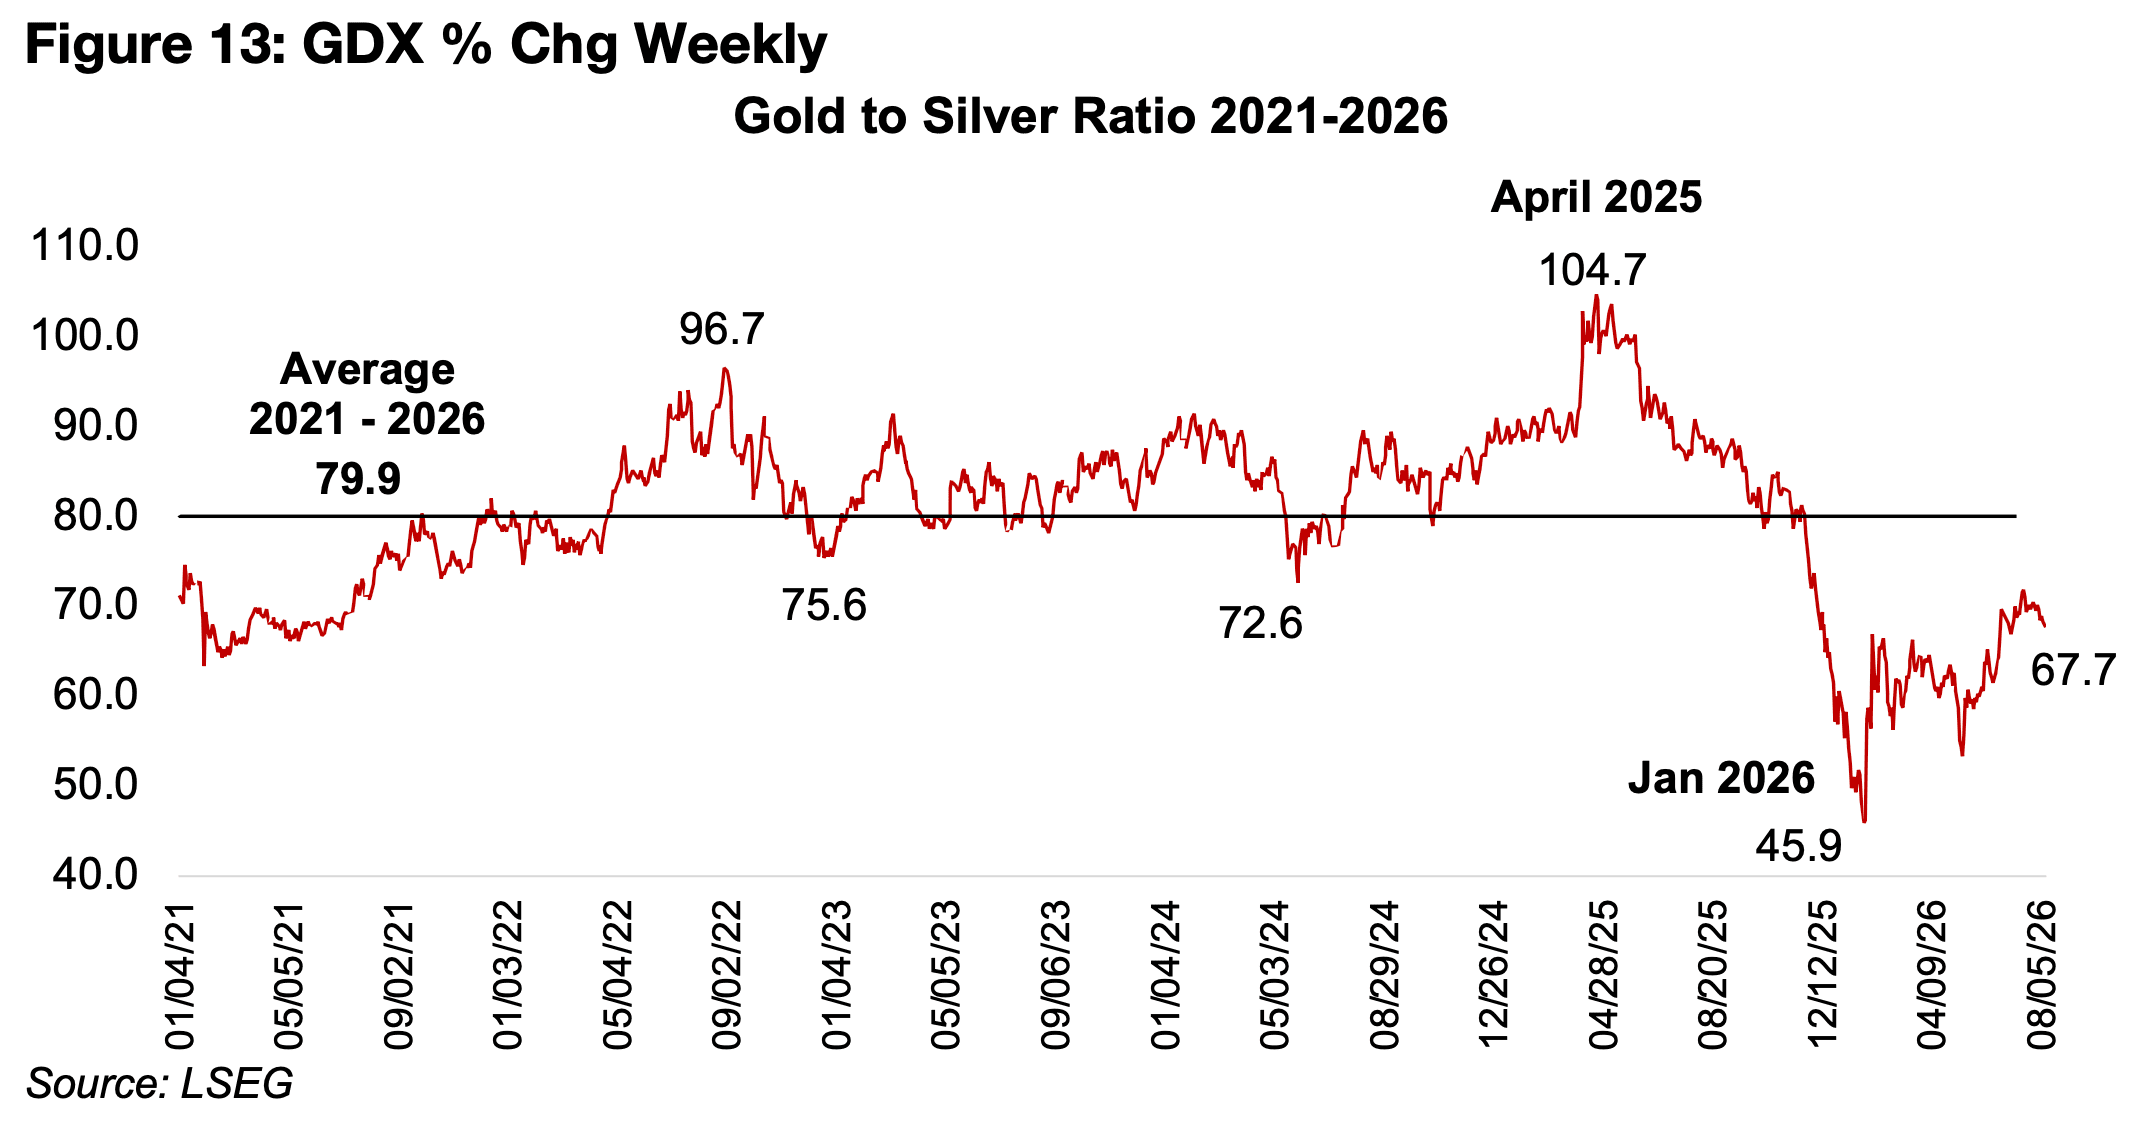
The relatively strong support for the silver price could be driven partly by its relatively
low ratio versus the gold price, at 67.7x, considerably below the average from 2021-
2026 of 79.9x (Figure 13). This ratio seems to have come more into balance this year
after huge swings up as high as 104.7x in April 2025 and then down to as low as
45.9x in January 2026.
The precious metals stocks have seen some of their strongest weekly gains in
decades on the surges in underlying metals prices. The GDX ETF of gold producers
rose 21.3% over the past week, by far the highest gains over the past decade, with
only the 19.2% rise in early 2025 coming close (Figure 14). There has been even
stronger gains for the GDXJ of gold juniors, up 23.3%, ahead of the previous highs,
also at 19.2% in early 2025, and at the highest level over the past ten years (Figure
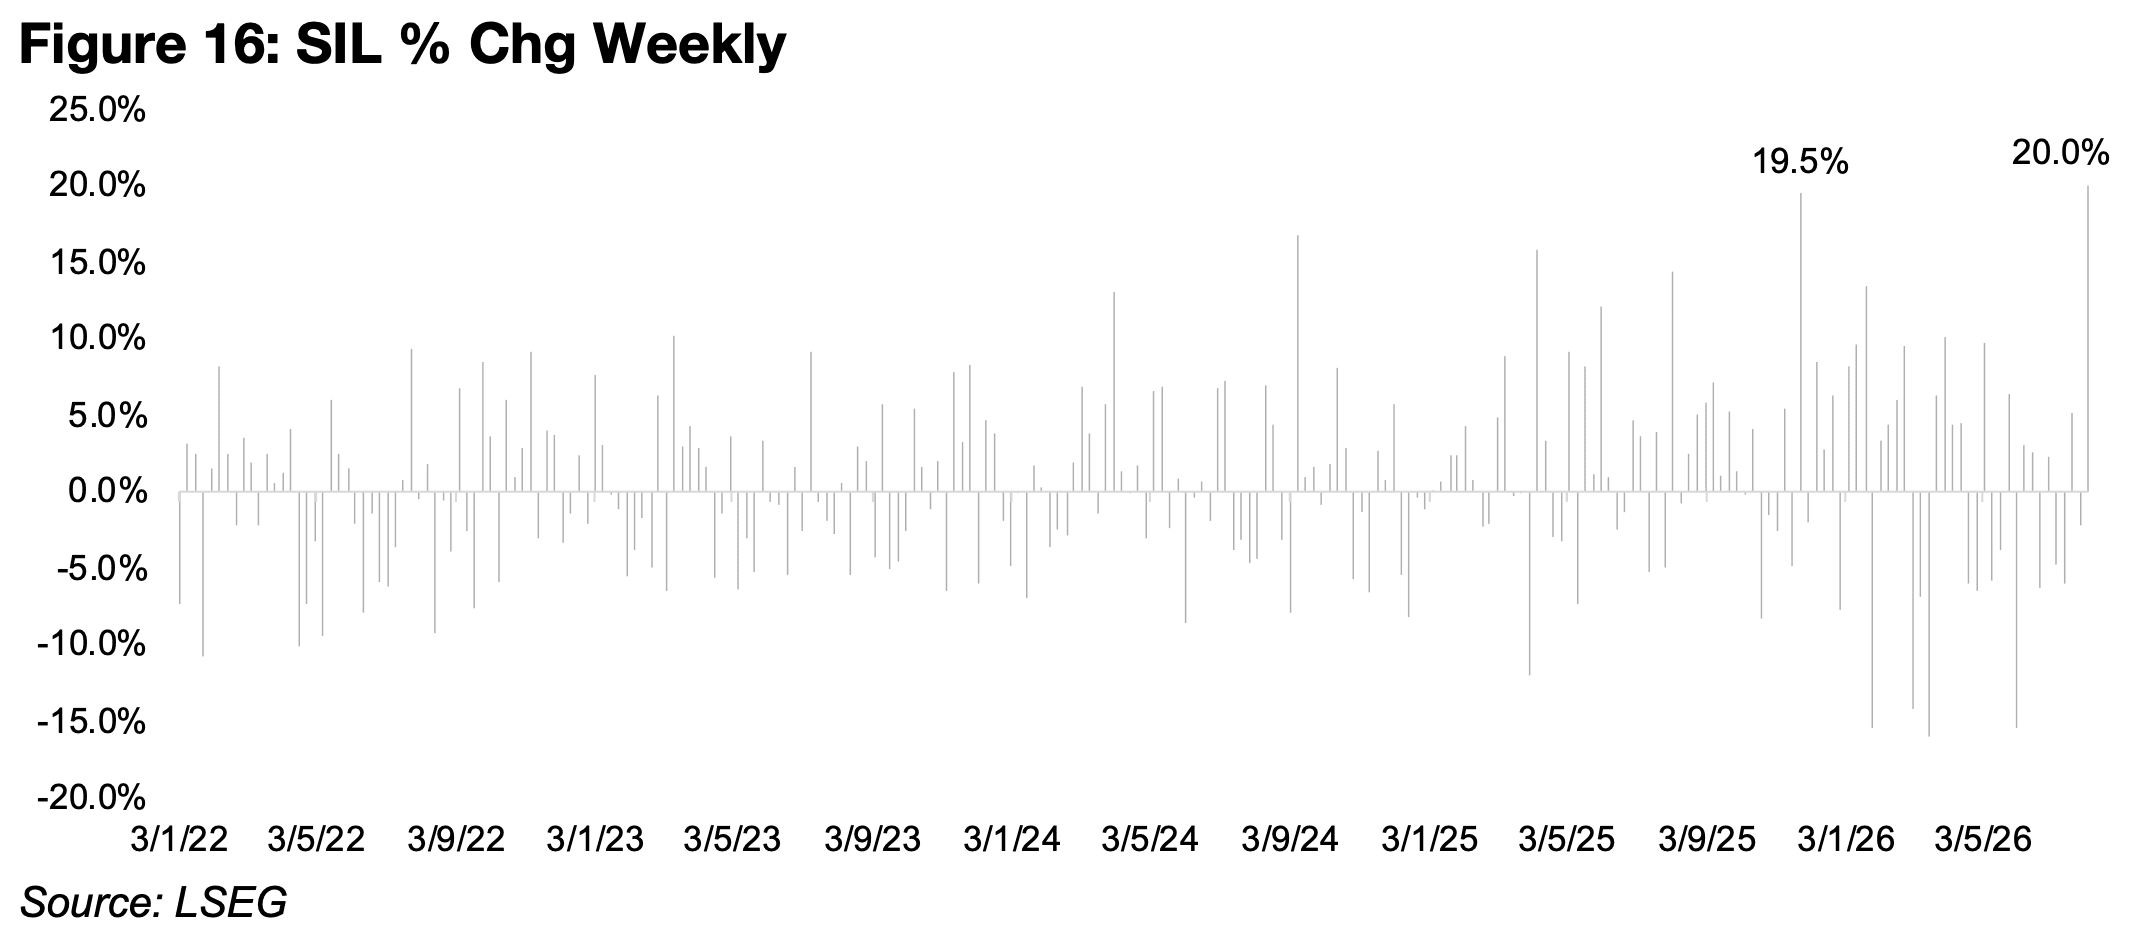
15). The SIL ETF of silver producers also saw its highest gains in over a decade, up
20.0%, just ahead of the most recent high of 19.5% in late 2025 (Figure 16).
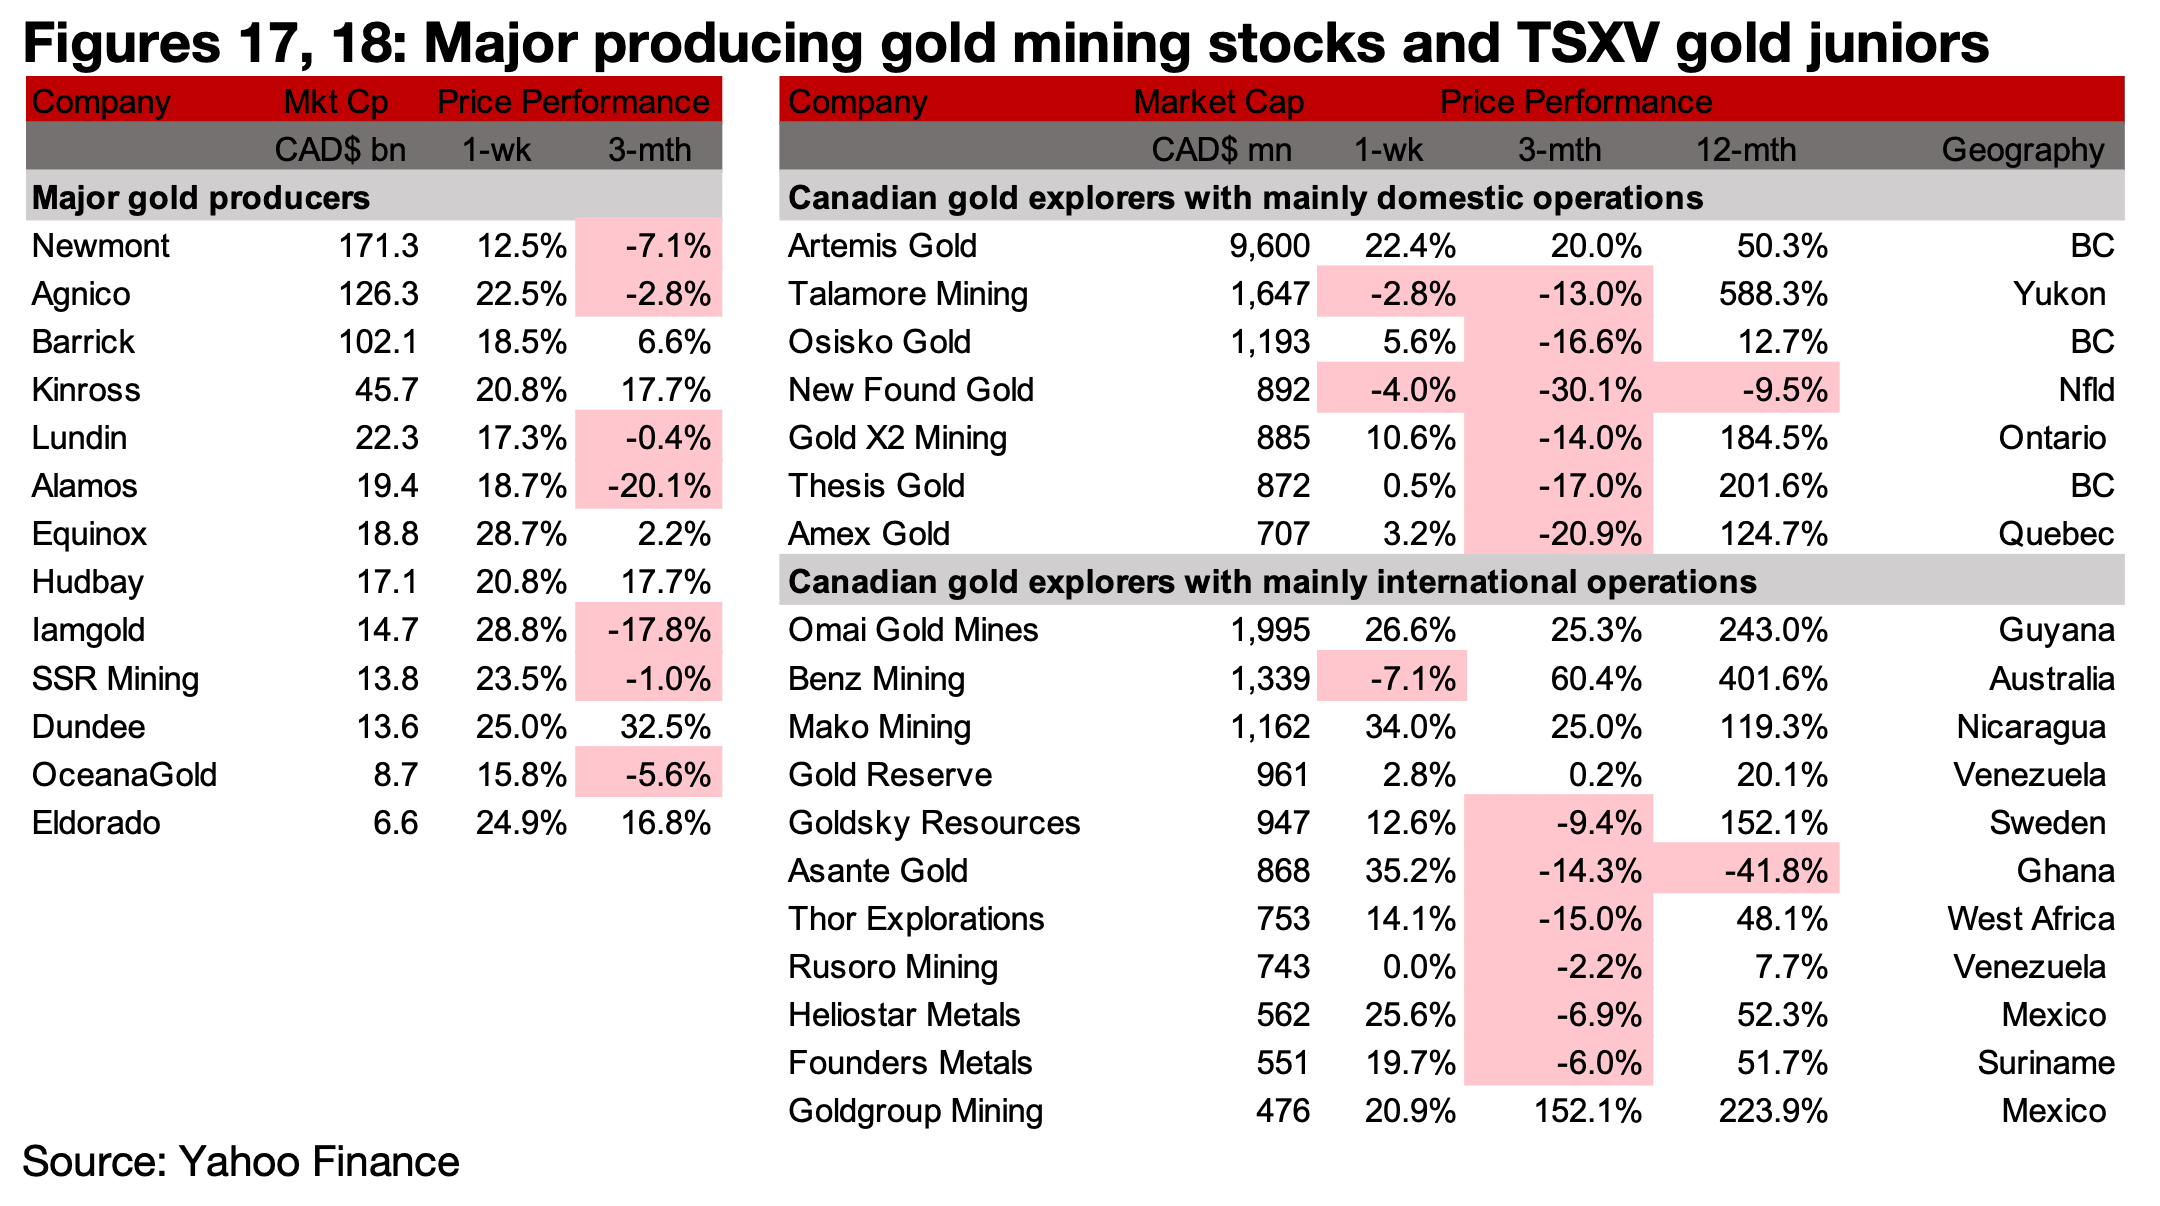
Many of the major producers saw their largest weekly gains in years, with the entire
group up over 10.0%, and about half gaining over 20.0%. Most of the TSXV gold
companies also jumped with Artemis, Omai, Heliostar, GoldGroup up over 20% and
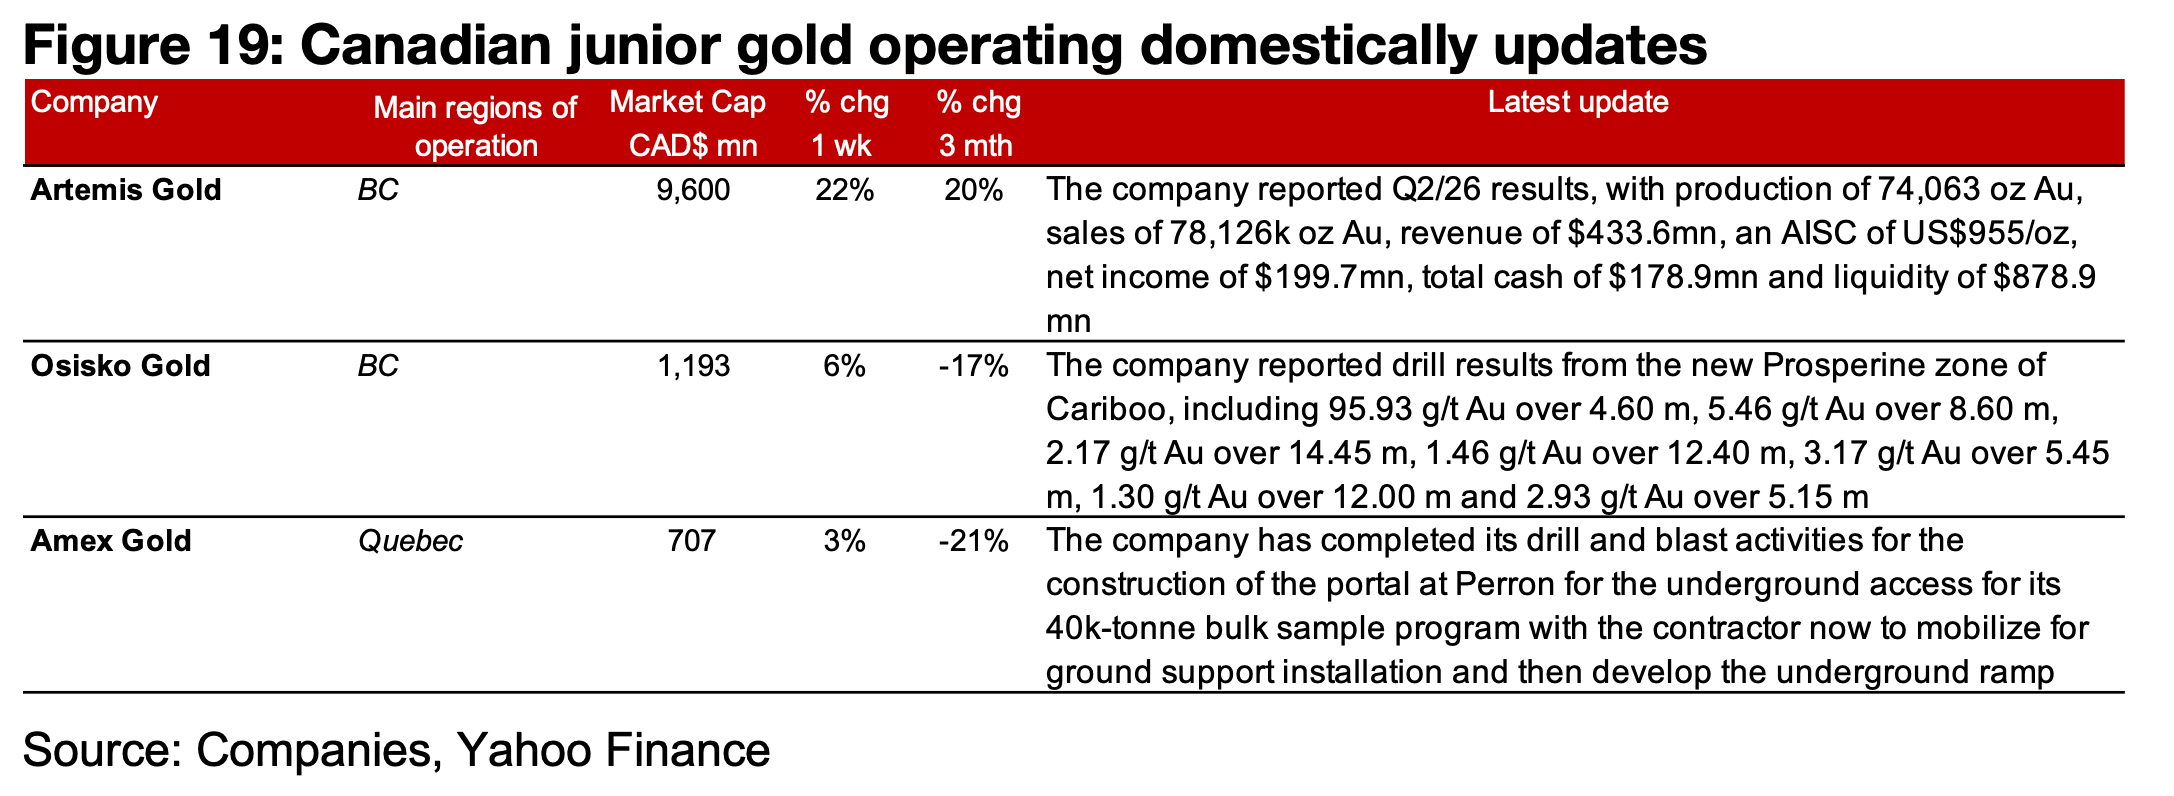
Mako and Asante rising over 30% (Figures 17, 18) For the TSXV gold companies
operating mainly domestically, Artemis Gold reported Q2/26 results with production
of 74,063 oz Au, revenue of $433.6mn and net income of $199.7mn. Osisko Gold
announced drill results from the Prosperine zone of the Cariboo project, and Amex
Gold completed its drill and blast activities for the construction of the portal at Perron
for the underground access for its 40,000-tonne bulk sample program (Figure 19).
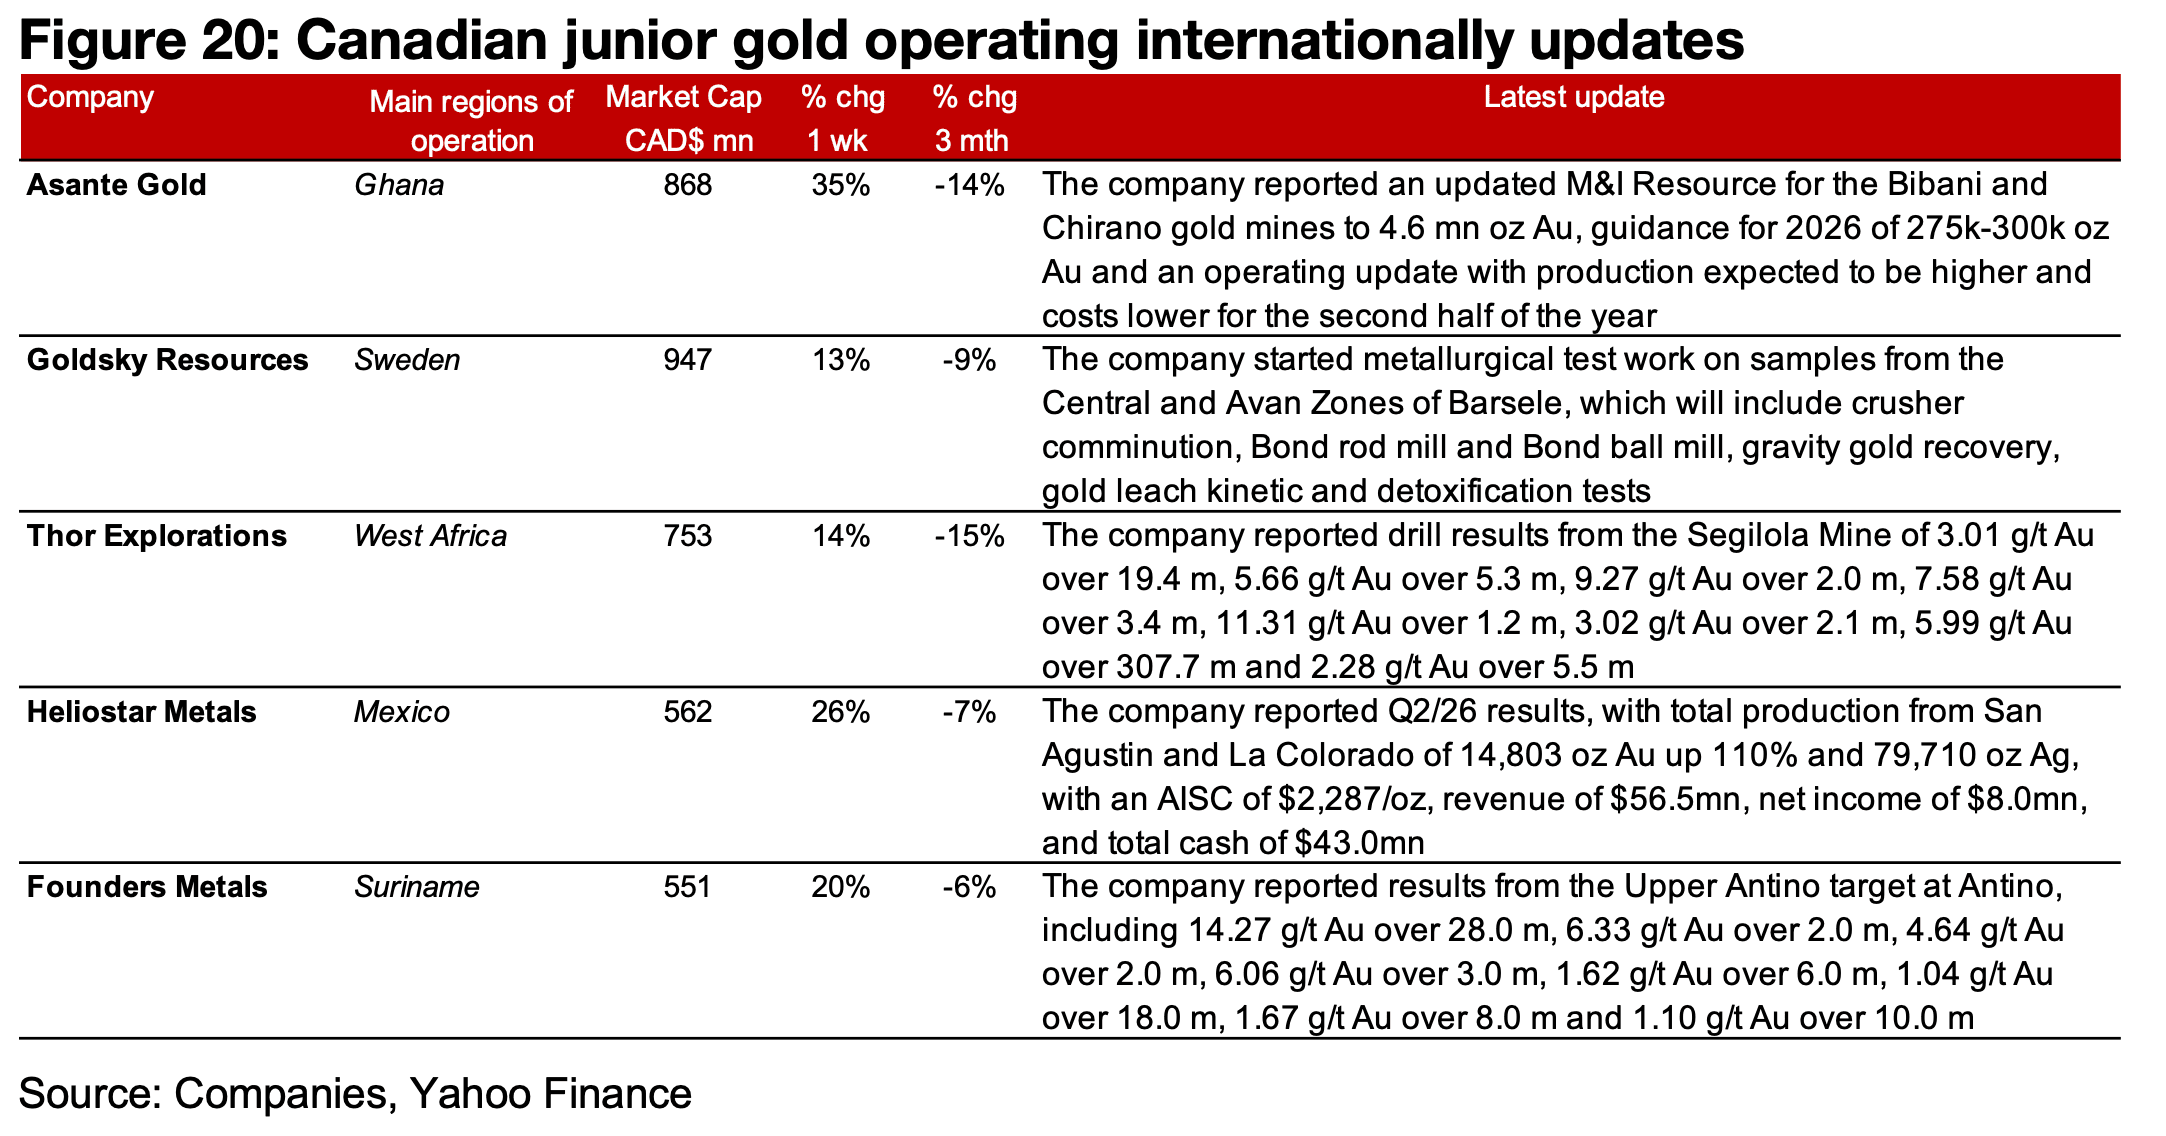
For the TSXV gold companies operating mainly internationally, Asante Gold reported
an updated resource estimate for the Bibani and Chirano gold mines, production
guidance for 2026 and an operating update. Goldsky started metallurgical work on
samples from Central and Avan Zones of Barsele. Thor Explorations reported drill
results from below the current Segilola Mine, Heliostar Metals reported Q2/26 results
with production from St. Agustin and La Colorado of 14,803 oz Au and 79,710 oz Ag,
revenue of $56.5m and net income of $43.0mn and Founders Metals reported drill
results from the Upper Antino target at Antino. (Figure 20).
Disclaimer: This report is for informational use only and should not be used an alternative to the financial and legal advice of a qualified professional in business planning and investment. We do not represent that forecasts in this report will lead to a specific outcome or result, and are not liable in the event of any business action taken in whole or in part as a result of the contents of this report.
Author
Ben McGregor authors the Weekly Roundup at CanadianMiningReport.com, providing sharp analysis of the metals and mining sector. With a talent for spotting trends, Ben distills complex market shifts into clear, engaging insights on TSXV junior miners. His weekly updates cover gold, copper, uranium, and more, blending data-driven perspectives with a knack for identifying opportunities. A vital resource for investors, Ben’s work navigates the dynamic junior mining landscape with precision.