
June 30, 2025
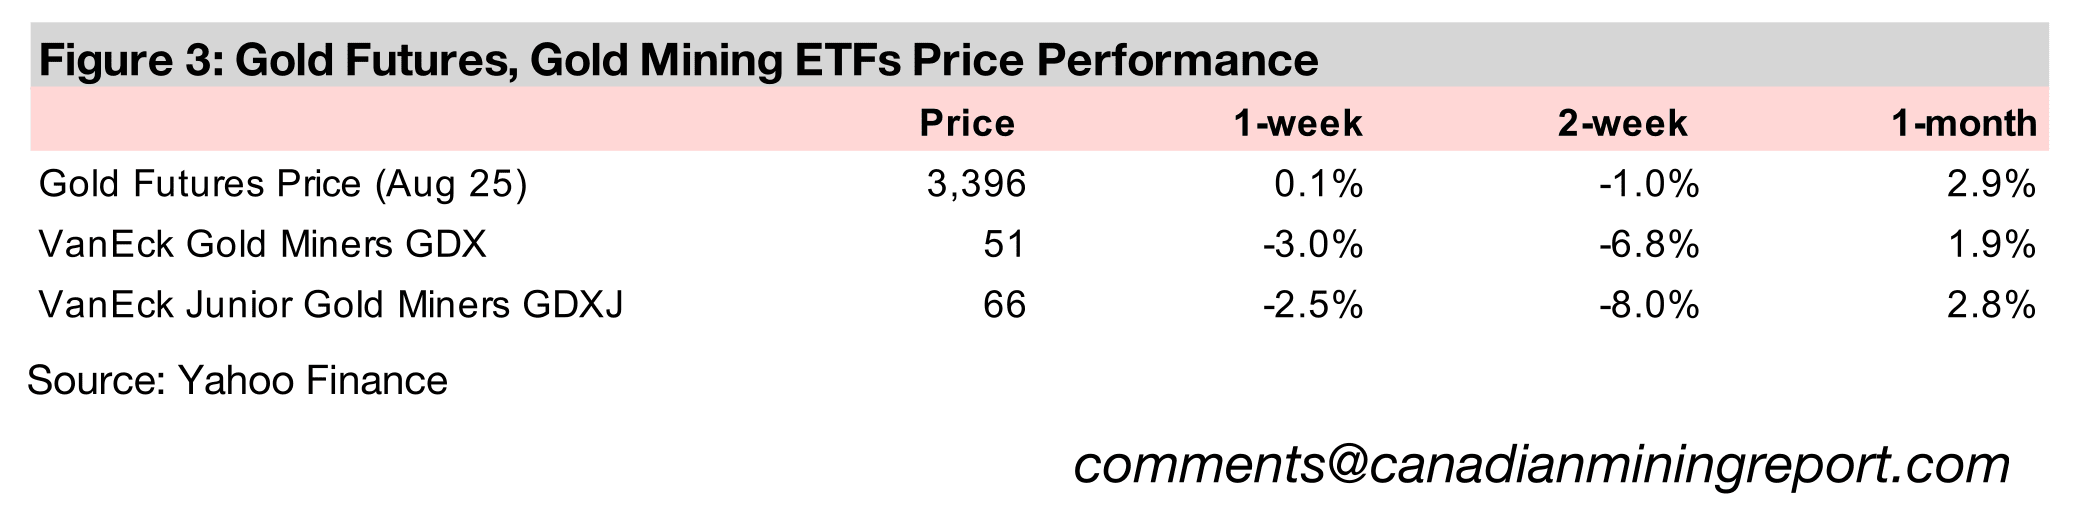
The gold price was near flat, up just 0.1% to US$3,396/oz, and towards the top of a US$3,200/oz-US$3,400/oz range holding for nearly three months, as markets resumed a risk-on move on the Israel-Iran ceasefire after a two-week pause.
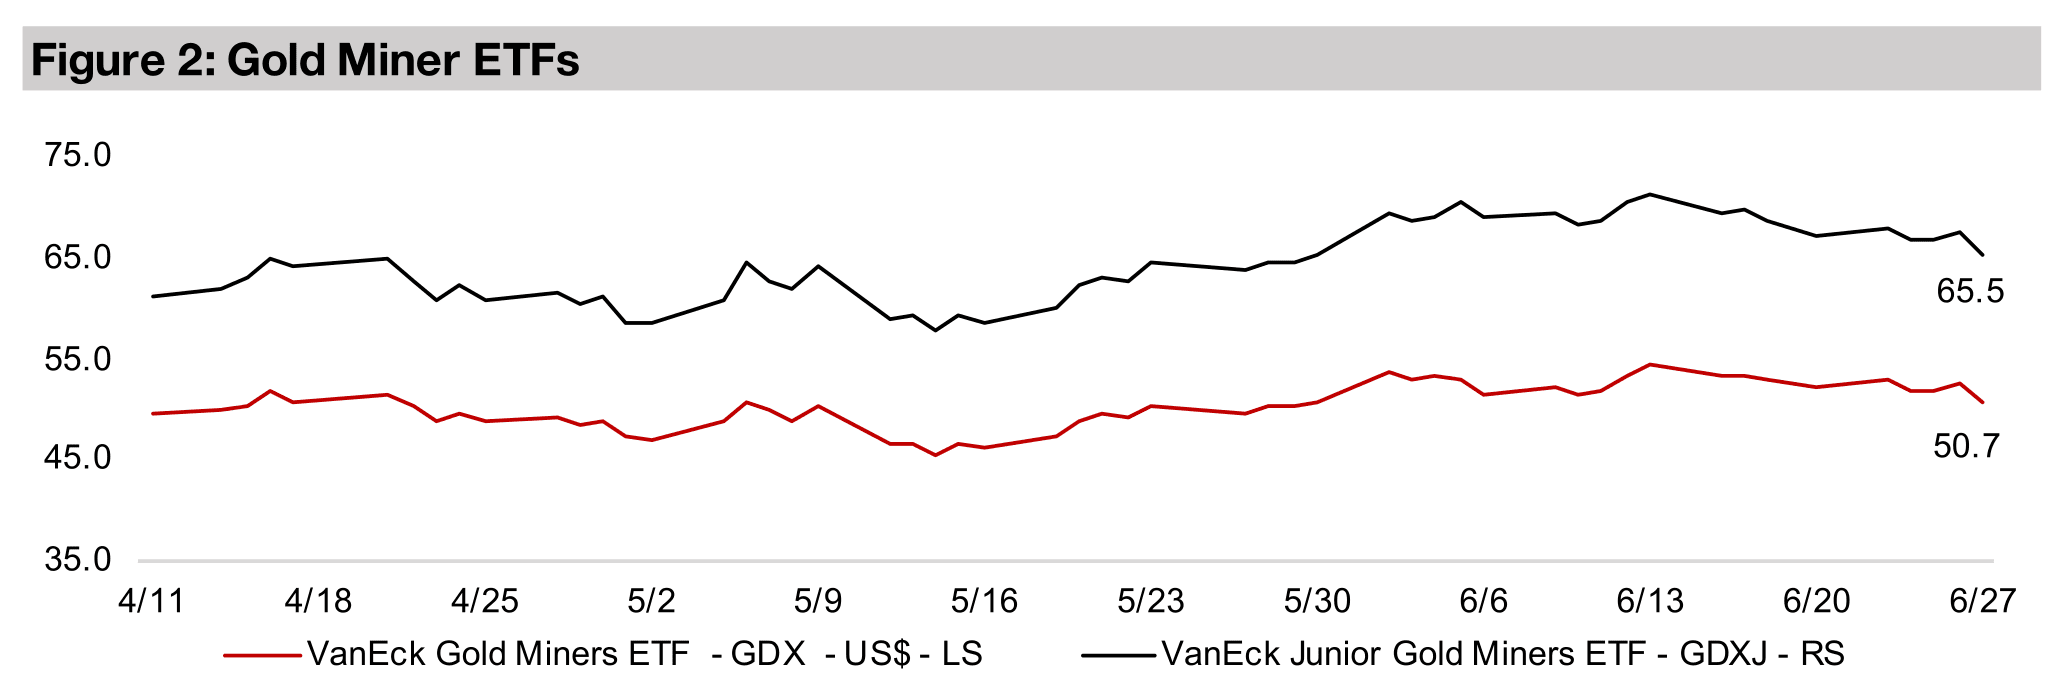
The gold stocks declined for a second week on the flat metal price, with the GDX down -3.0% and GDXJ losing -2.5%, underperforming the rebound in the equity markets, with the S&P 500 up 3.4%, Nasdaq gaining 4.4% and Russell 2000 up 3.2%.


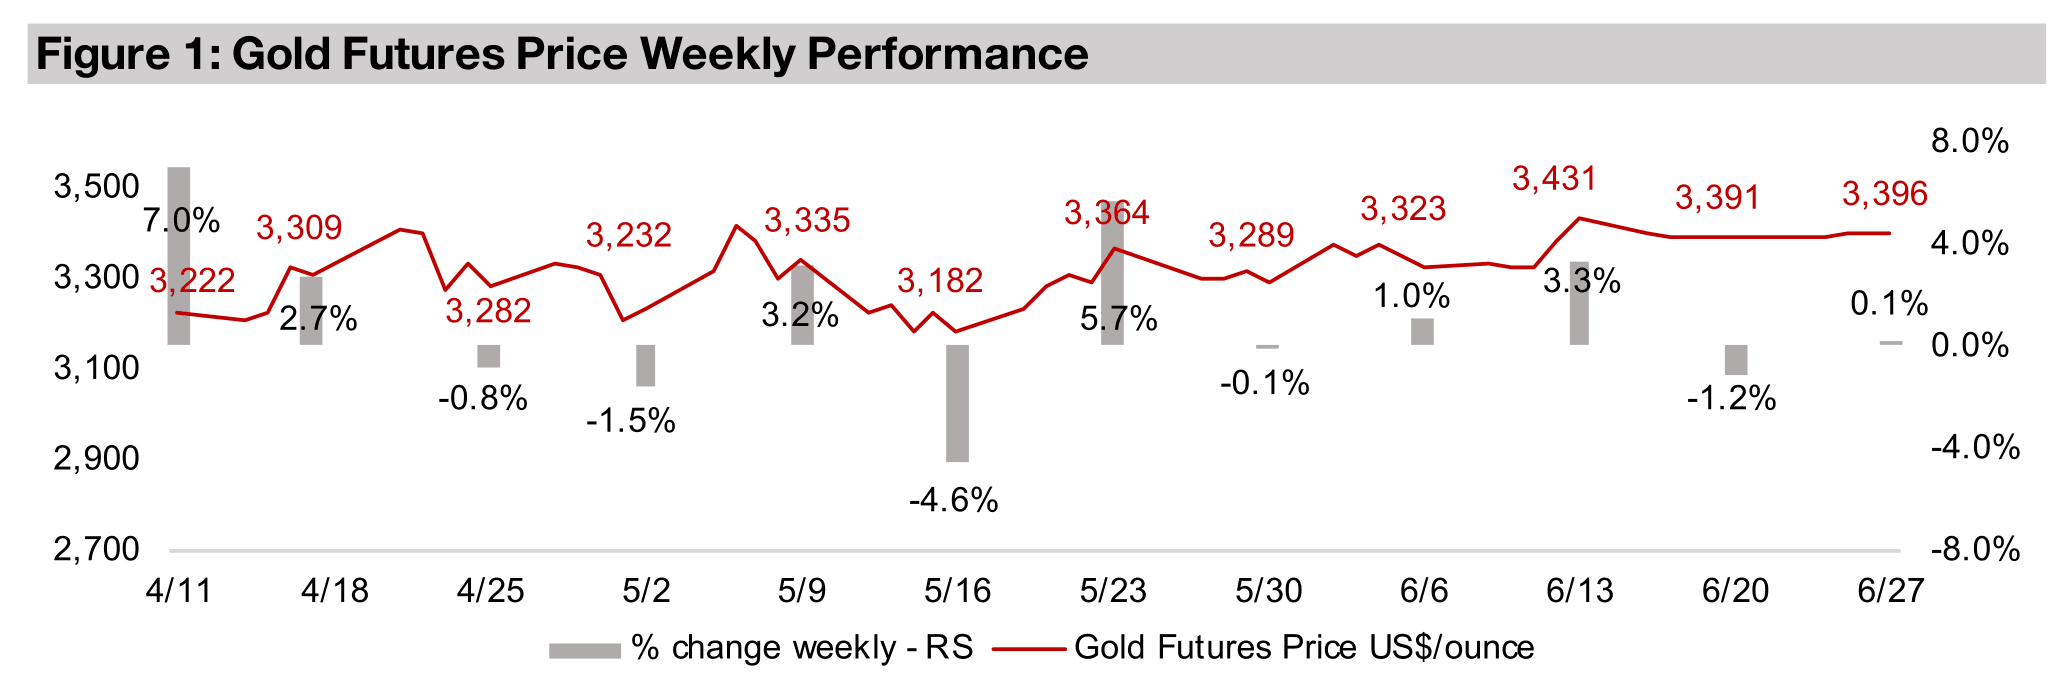
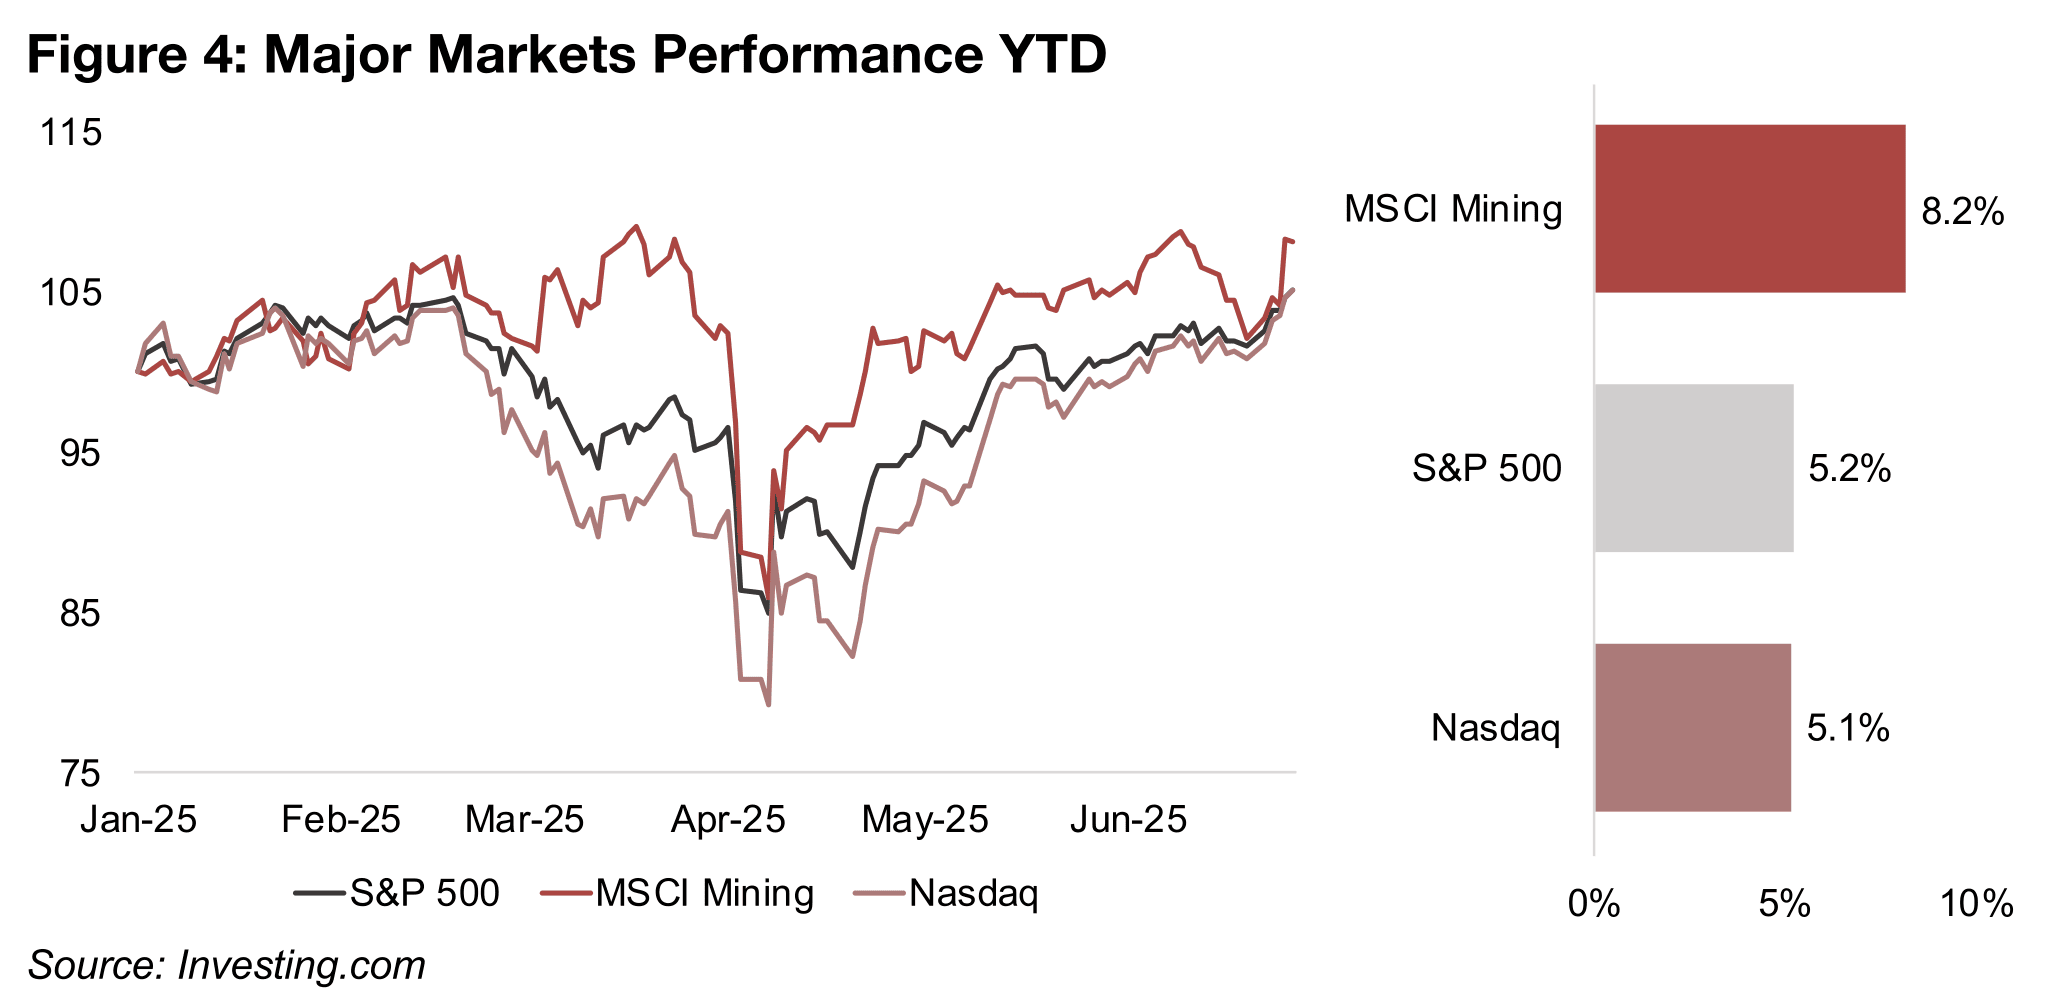
The gold price was near flat, up 0.1% to US$3,396/oz, towards the high end of a US$3,200/oz-US$3,400/oz range that has held for nearly three months, as the Iran- Israel ceasefire saw the markets shift back into risk-on after the post-crash rally had slowed in recent weeks. This sent the S&P 500 up 3.4%, back near its 2025 highs, and up 5.2% YTD, and the Nasdaq was up 4.4%, for a 5.1% gain YTD (Figure 4). Both have been outperformed by the MSCI Metals and Mining ETF, up 8.2% YTD, as the drag from a heavy weighting to companies with a high exposure to iron ore has been offset by companies with a large proportion of revenue from gold and copper.
While the markets have continued to move into safe haven sectors this year, including
gold, it has been balanced with investment in riskier sectors, which recently has
included other major metals, which may be diverting flows away from gold. This is
likely partly because the metal had started to look overvalued versus key comparable
assets, with its ratios versus precious metals, oil and commodities getting far above
recent averages. While over the past month gains in these assets have started to
bring down these ratios from excessive peaks, they still remain reasonably high.
While this may attenuate further upside gains for gold, there are still many major
factors that could see the price hold up in its recent range. One is an ongoing global
monetary expansion, as while the US Fed recently kept rates on hold, two cuts are
still expected for this year, and most other major central banks have been cutting
rates. Surging overall risk could support the gold price, with the geopolitical risk,
economic policy uncertainty and trade policy uncertainty indices having spiked in
recent months to by far their highest levels in years.
While the Israel-Iran ceasefire may bring down the geopolitical risk index, the markets
may not be entirely convinced the peace will hold and the Ukraine-Russia conflict
continues. The economic policy and trade uncertainty indices could certainly remain
elevated, given the current US administration’s tendency towards sudden changes.
The latest surprise was a halting of US-Canada trade negotiations, which is a major
issue as the US is Canada’s largest trading partner and Canada the second largest
for the US. While high ongoing uncertainty could now be expected by markets and
priced into gold, it still suggests that the metal could hold up at current levels until
this disruption is substantially reduced, which does not seem likely anytime soon.
While the US$ remains weak, which has supported gold as it moves inversely to the
dollar, we see a risk for the metal from a rebound in the currency, which could be a
surprise to the market as dollar negativity has become a widespread view. The gap
between rates in the US, which are now the highest of any major country, and the
rest of the world, has widened significantly. While theoretically this should drive
inflows into the US$, so far tariff and other concerns have kept the dollar under
pressure, although this may not last, and could be a negative driver for gold.
Another risk for gold is the market euphoria over the metal this year, with gold ETF
inflows surging to their highest in years and the trade becoming heavily mainstream
for the first time since 2020, and retail driven surges are prone to reverse quickly.
While central banks have continued to make significant net gold purchases, these
have declined from last year, and this shift towards more support from retail inflows
over longer-term institutional holders is likely a risk for the metal. Overall, we see the
situation for gold as roughly balanced, and it could remain range bound.
While gold’s ascent has slowed over the past two months, the rise of the ‘other’
precious metals, silver, platinum and palladium has started. Partly this has been from
the market looking for metals that are also monetary substitutes and act as a store of
value similarly to gold. This has been seen particularly in China, where platinum
jewellery purchases have surged as a substitute for increasingly expensive gold.
Platinum is also expected to face a major deficit this year on rising demand, but also
supply limitations, with a production drop in South Africa, which accounts for over
80% of global output, sending the price up 35% from April 9, 2025 (Figure 5).
Even though the palladium market is expected to be balanced this year, and its
largest driver, autocatalysts, comprising over 80% of demand, is expected to weaken
on a slow auto industry, it is still up 19% this year. This suggests that its role as a
monetary substitute may be a major factor in driving up the price, given less
compelling drivers than platinum overall. Silver is up 7%, also partly backed by its
role as a monetary metal, and while it is also expected to have a deficit this year, it is
estimated to narrow from last year, which could partly explain its limited gains.
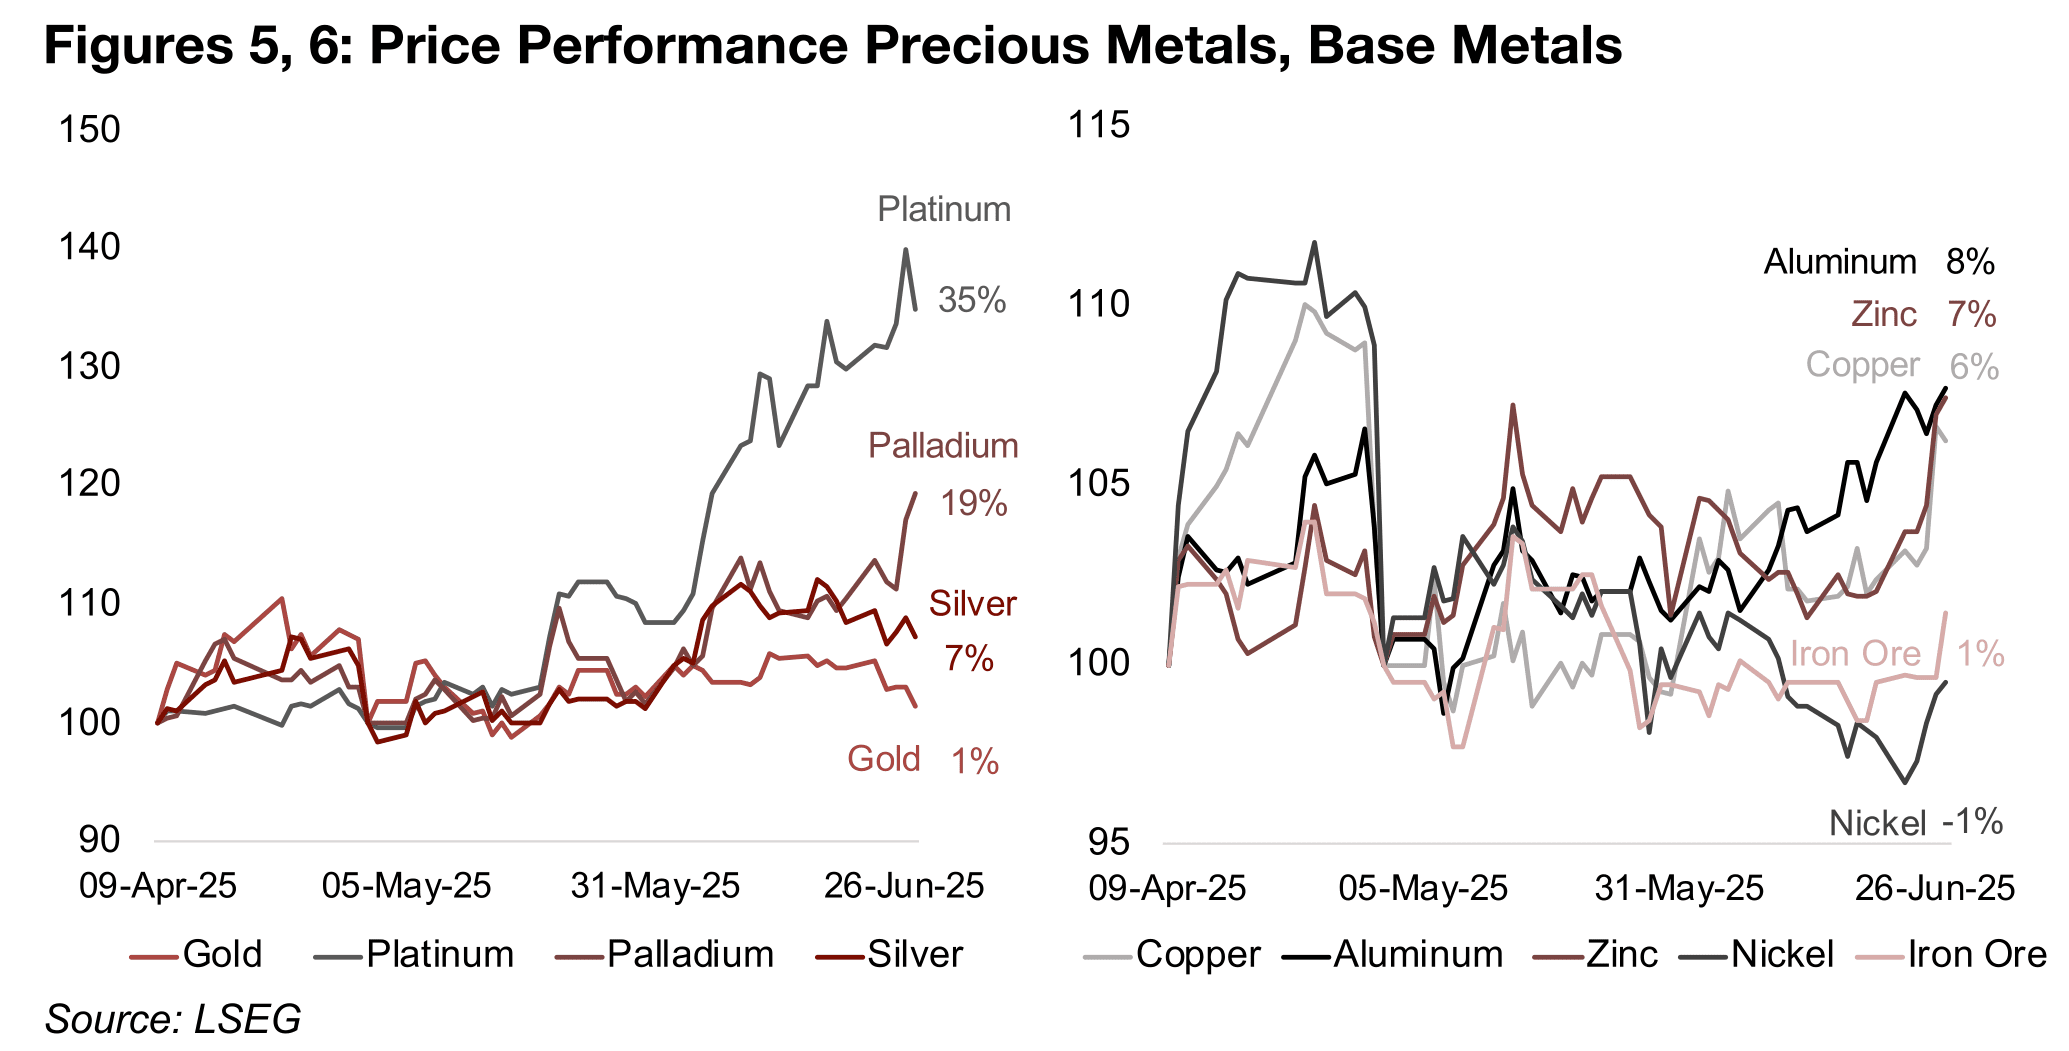
Several of the base metals have picked up in the past month, although by far less
than the rise in platinum and palladium. Copper has risen 6% from early April 2025,
with especially consistent gains over the past few weeks (Figure 6). This has been
driven by US proposals to consider tariffs on the metal, which led to large inflows of
the metal into the country in advance of any such changes. This reduced inventories
in the rest of the world and has driven up the price of the metal.
This situation could persist for the next two months as the final decision on copper
tariffs is expected by September 2025. However, beyond this likely short-term bottle
neck the outlook for copper may not be as bullish, as the market is actually expected
to be in surplus this year. The current annual price estimates for the metals from the
World Bank and Australia’s Office of the Chief Economist (AOCE) also imply a
substantial decline in the copper price for the second half of 2025.
Other major base metals have also rebounded since early April 2025, with aluminum
up 8% and zinc rising 7%, which especially for the former may also have been driven
by concerns of rising US tariffs. However, it seems that there could also be a
component of these increases arising from expectations for strong economic growth
than at the depths of April 2025 crash. However, both the aluminum and zinc markets
are forecast to be in surplus this year, and if demand is lower than expected, there is
a risk of pullback for both of these metals. The IMF estimates for global economic
growth in 2025 still imply a slowdown in global economic growth in 2025, and the WB
and AOCE 2025 forecasts for these metals would indicate a significant decline in
H2/25, similar to the copper price.
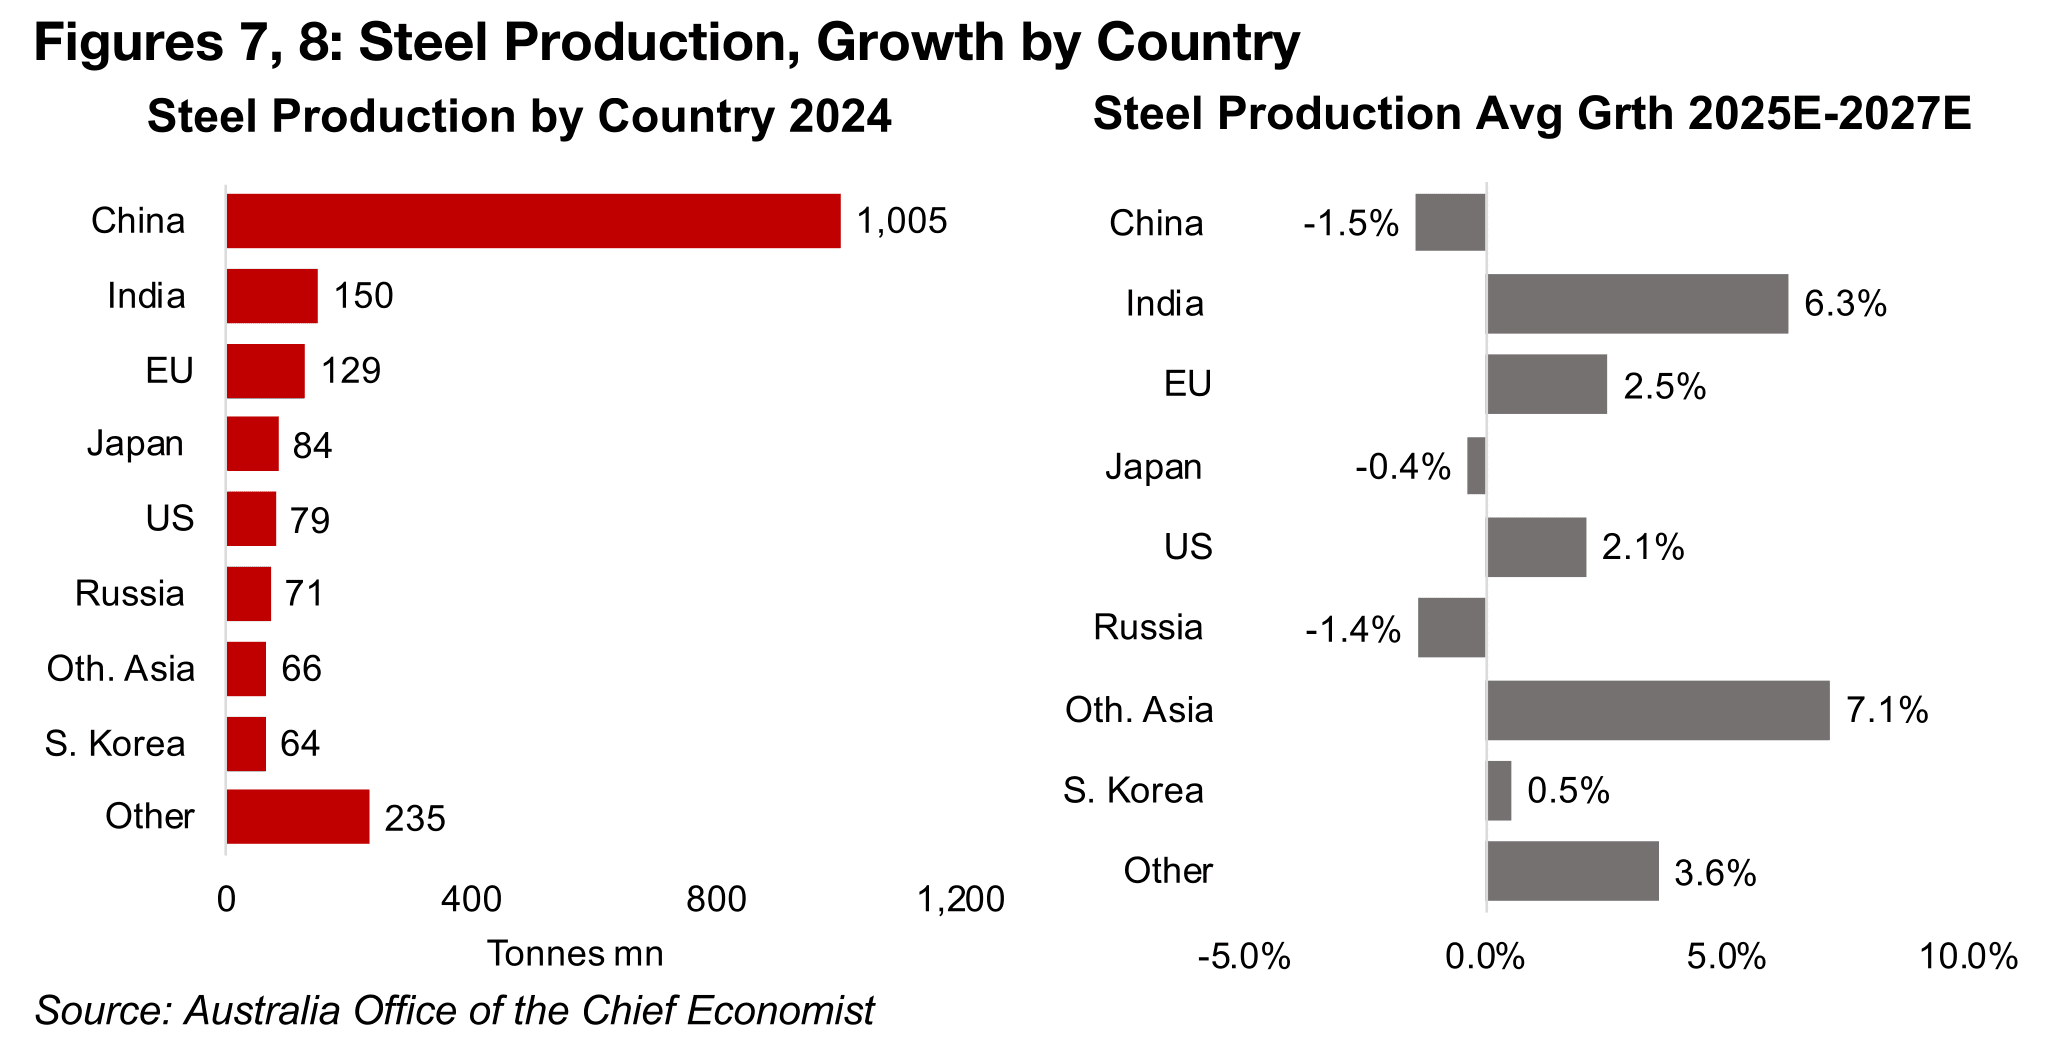
While iron price continues to struggle, up just 1.4% since April 9, 2025, with the metal less driven by broader global demand and far more by growth in China. China accounted for 53% of global steel demand in 2024 and has been the main growth driver for this industry for the past three decades, and nearly all of iron ore demand is from this sector (Figure 7). The AOCE forecasts that China steel production growth will decline -1.5% on average from 2025E to 2027E, which will only be partly offset by 6.3% growth from India, given the latter’s much smaller proportion of total global production (Figure 8).
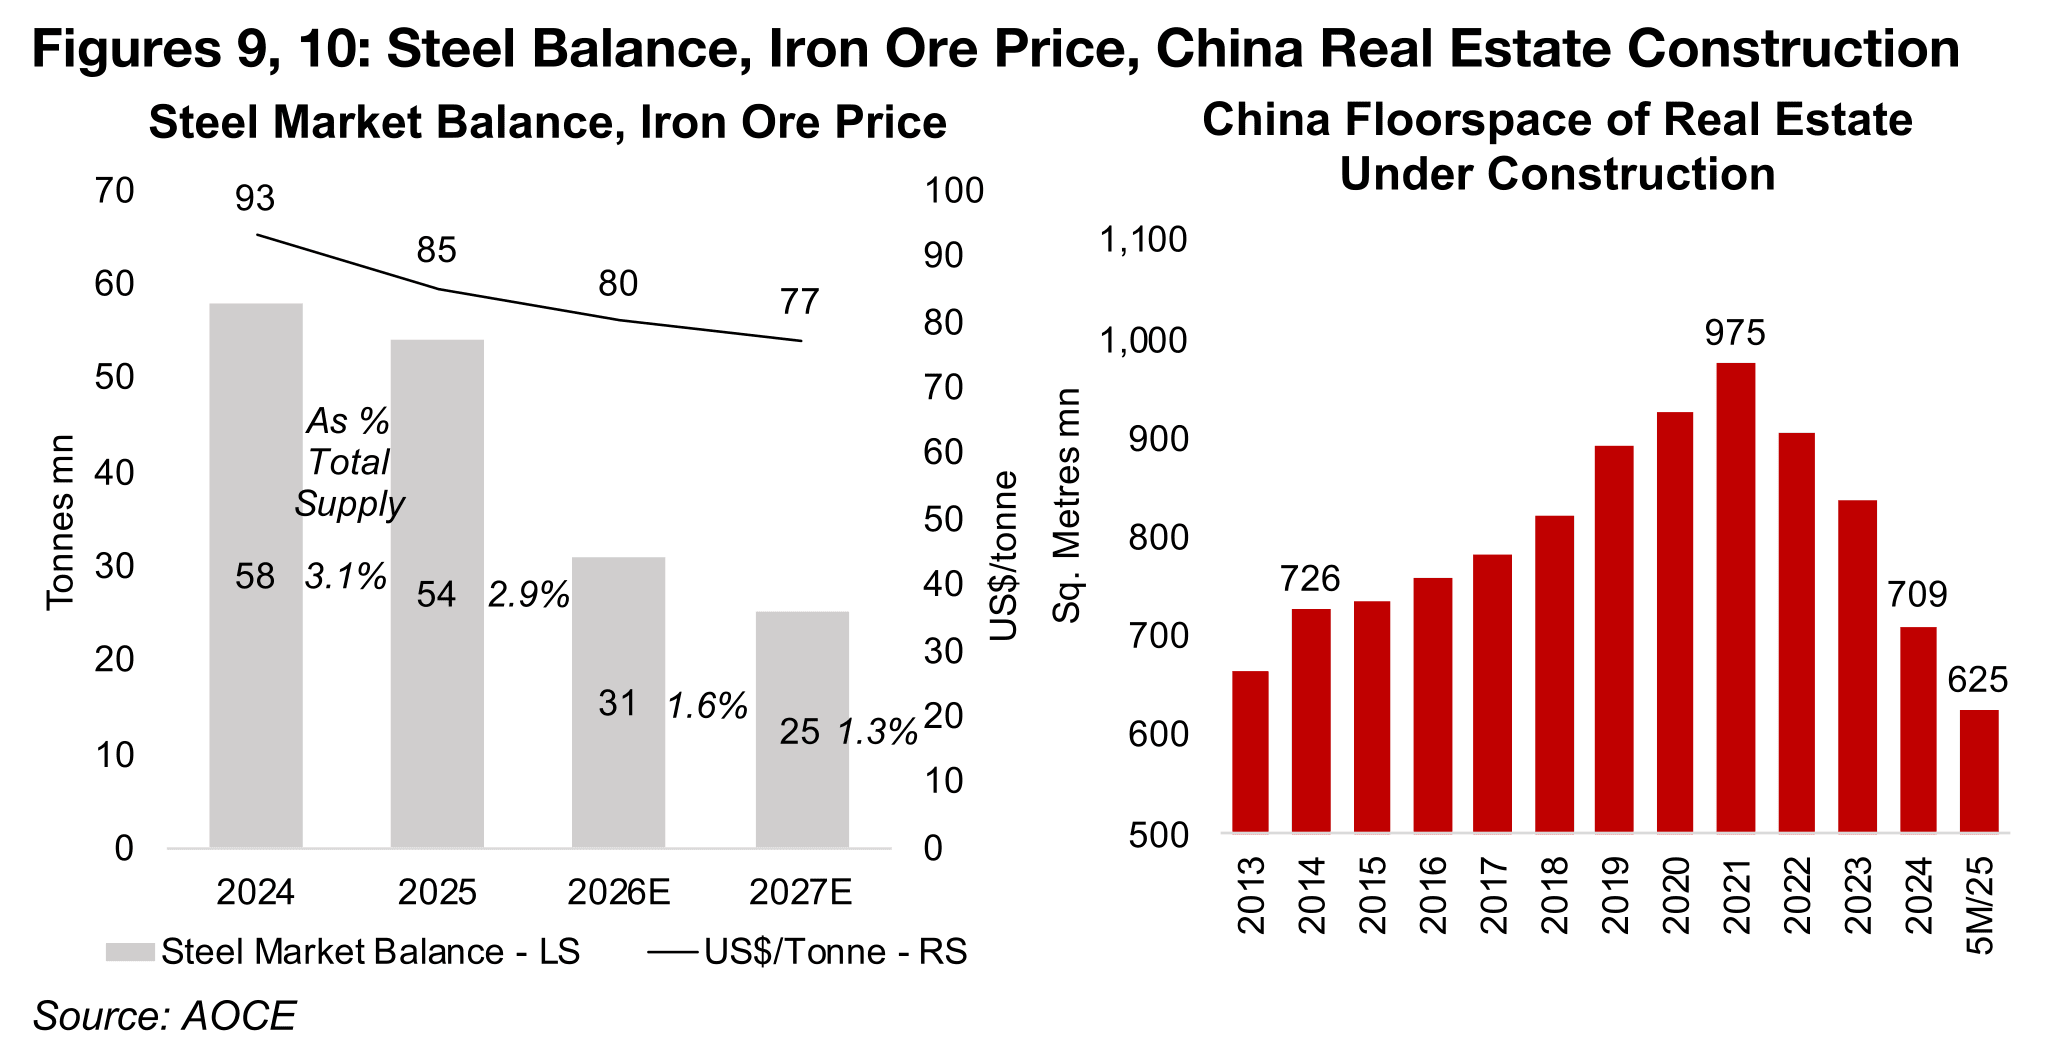
The AOCE forecasts that the steel market will remain in a reasonably large surplus of 2.9% of total supply this year, after 3.1% in 2024, declining to 1.6% in 2026E and 1.3% in 2027E (Figure 90. This is expected to pull the iron ore price down from US$93/tonne in 2024 to US$85/tonne in 2025, US$80/tonne in 2026E and US$77/tonne in 2027E. The most recent construction data from China, which is the major driver of the steel, and therefore iron ore, markets, shows that the industry has continued to slow. The floorspace of real estate under construction declined to 625mn square metres as of May 2025, from a peak of 975 square metres as of the end of 2021, back below the 726mn square metres of 2014 (Figure 10).
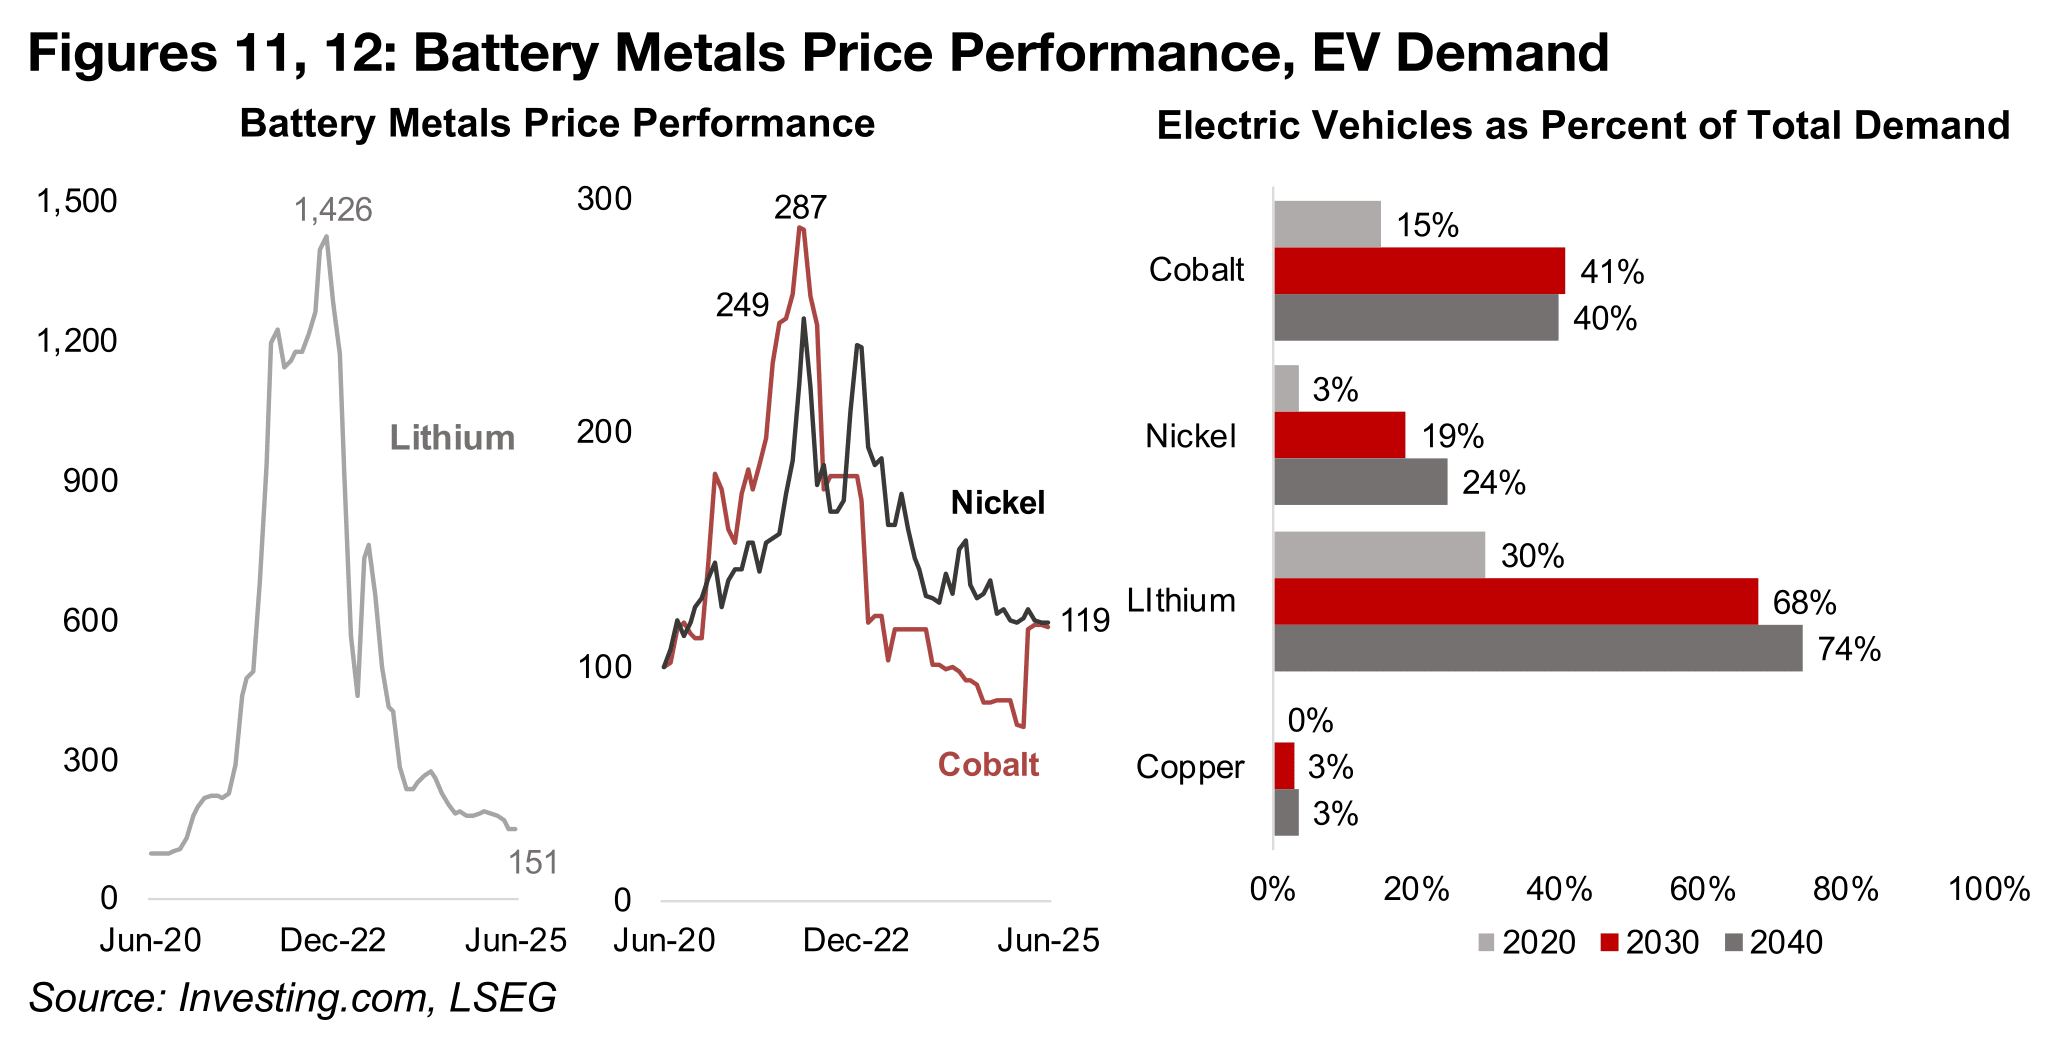
While two of the major battery metals, lithium and nickel, have continued an extended
downtrend from their 2021 highs, cobalt has actually had a significant rebound
(Figure 11). This has been driven mainly by an export ban from the Congo, which
comprises over 80% of the total global production, starting in February 2025 and
then extended for another three months in June 2025. A huge increase in supply from
the country, and weakening demand from a slowing electric vehicle sector, had driven
the major price decline prior to the ban.
Lithium, which is expected to have by far the largest exposure to the electric vehicle
sector by 2030, at 68% of its total demand, has been hit by a slowdown in global EV
sales (Figure 12). The supply of lithium chemicals in China, the world’s largest
producer at over 80% of output, has also surged, with significant new capacity
operating from the middle of 2024. The proportion of nickel’s demand from EVs is
relatively low compared to these other two battery metals, estimated at just 19% by
2030. However, the rest of its demand its mainly from the steel sector, where growth
is expected to be weak medium-term, and its price is down -1% from early April 2025.
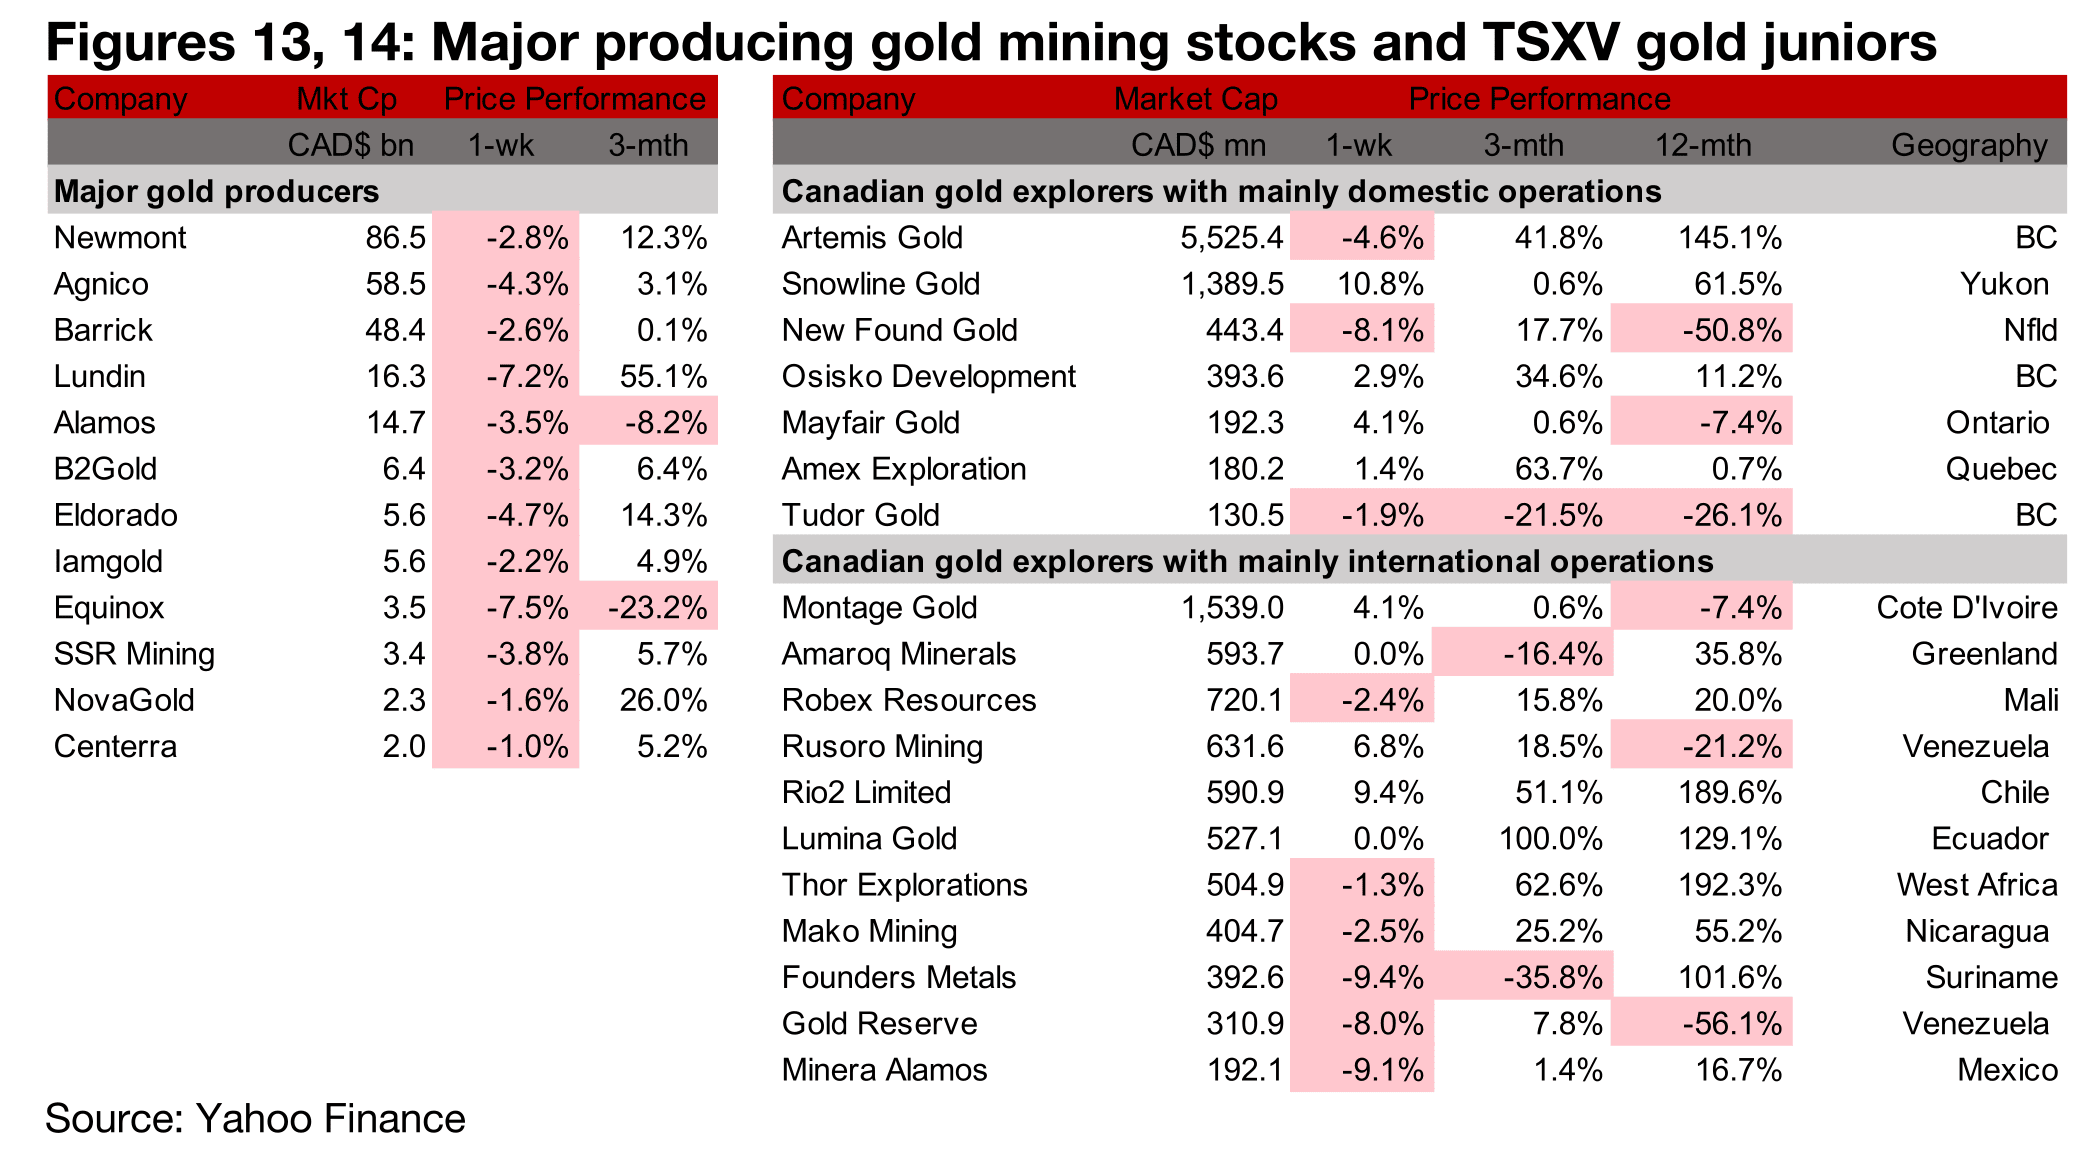
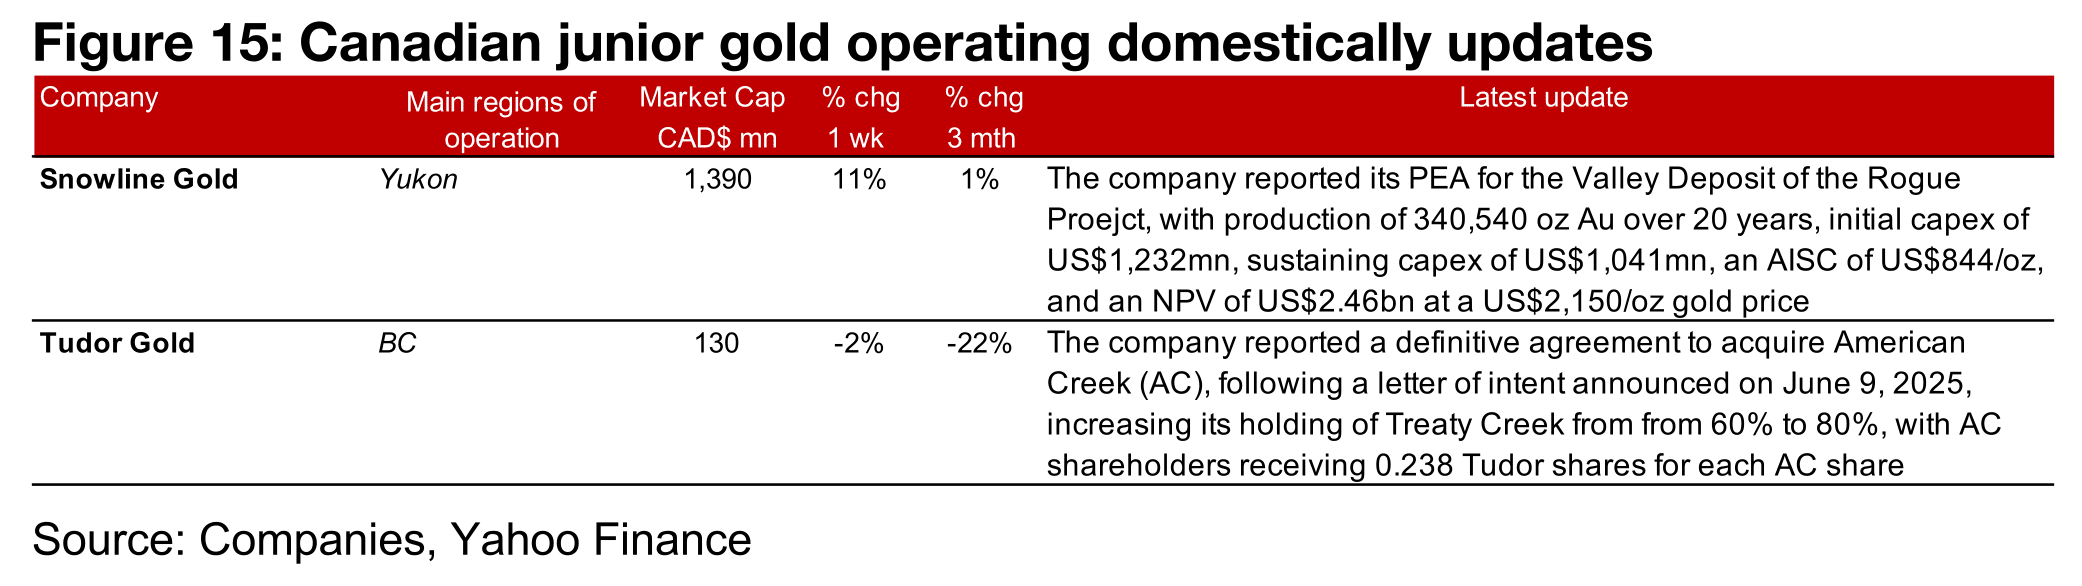
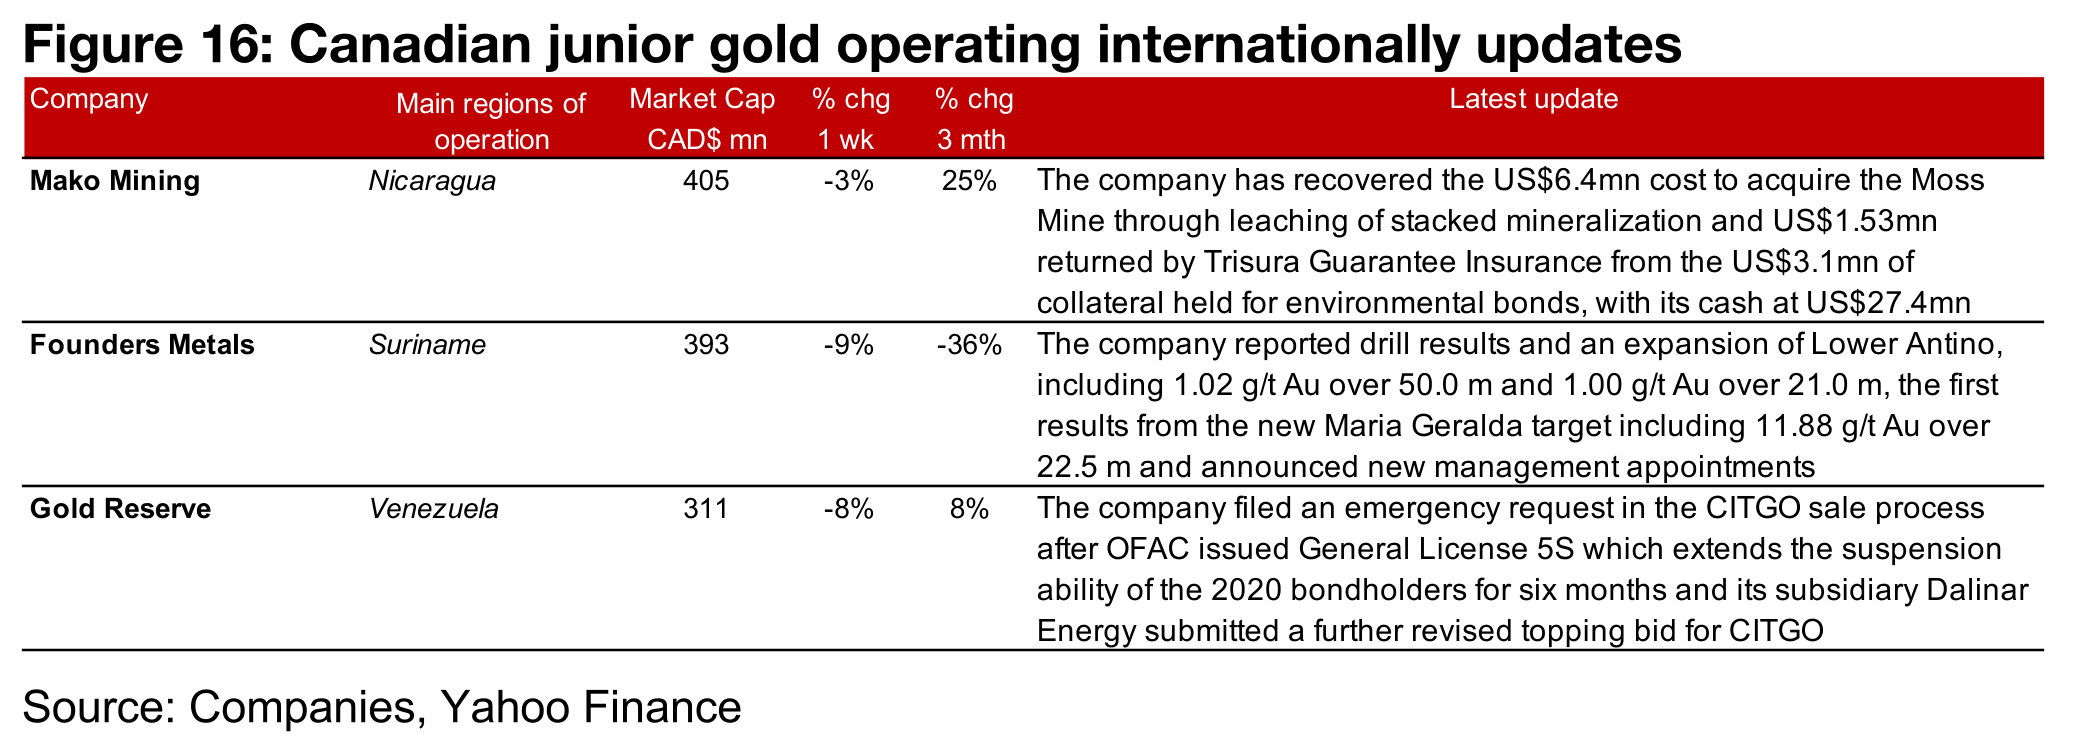
While all the major gold producers declined, TSXV large gold was mixed (Figures 13, 14). For the TSXV gold companies operating mainly domestically, Snowline reported a PEA for the Valley deposit of the Rogue Project and Tudor Gold announced a definitive agreement to acquire American Creek (Figure 15). For the TSXV gold companies operating mainly internationally, Mako announced it had recovered the acquisition cost of the Moss Mine through processing stacked mineralization and a return of some collateral held for bonds. Founders Metals announced drill results from the Antino project and management appointments and Gold Reserve provided updates on its bidding in the sales process of CITGO shares (Figure 16).
Snowline’s PEA for the Valley Deposit at the Rogue Project has given it the largest
project of the major TSXV developers. Lumina, which previously had the largest
project, Cangrejos, has been acquired by China’s CMOC, with the deal closing this
week. Artemis, which had the second largest project with Blackwater, shifted from
out of development this year with the start of commercial production in May 2025.
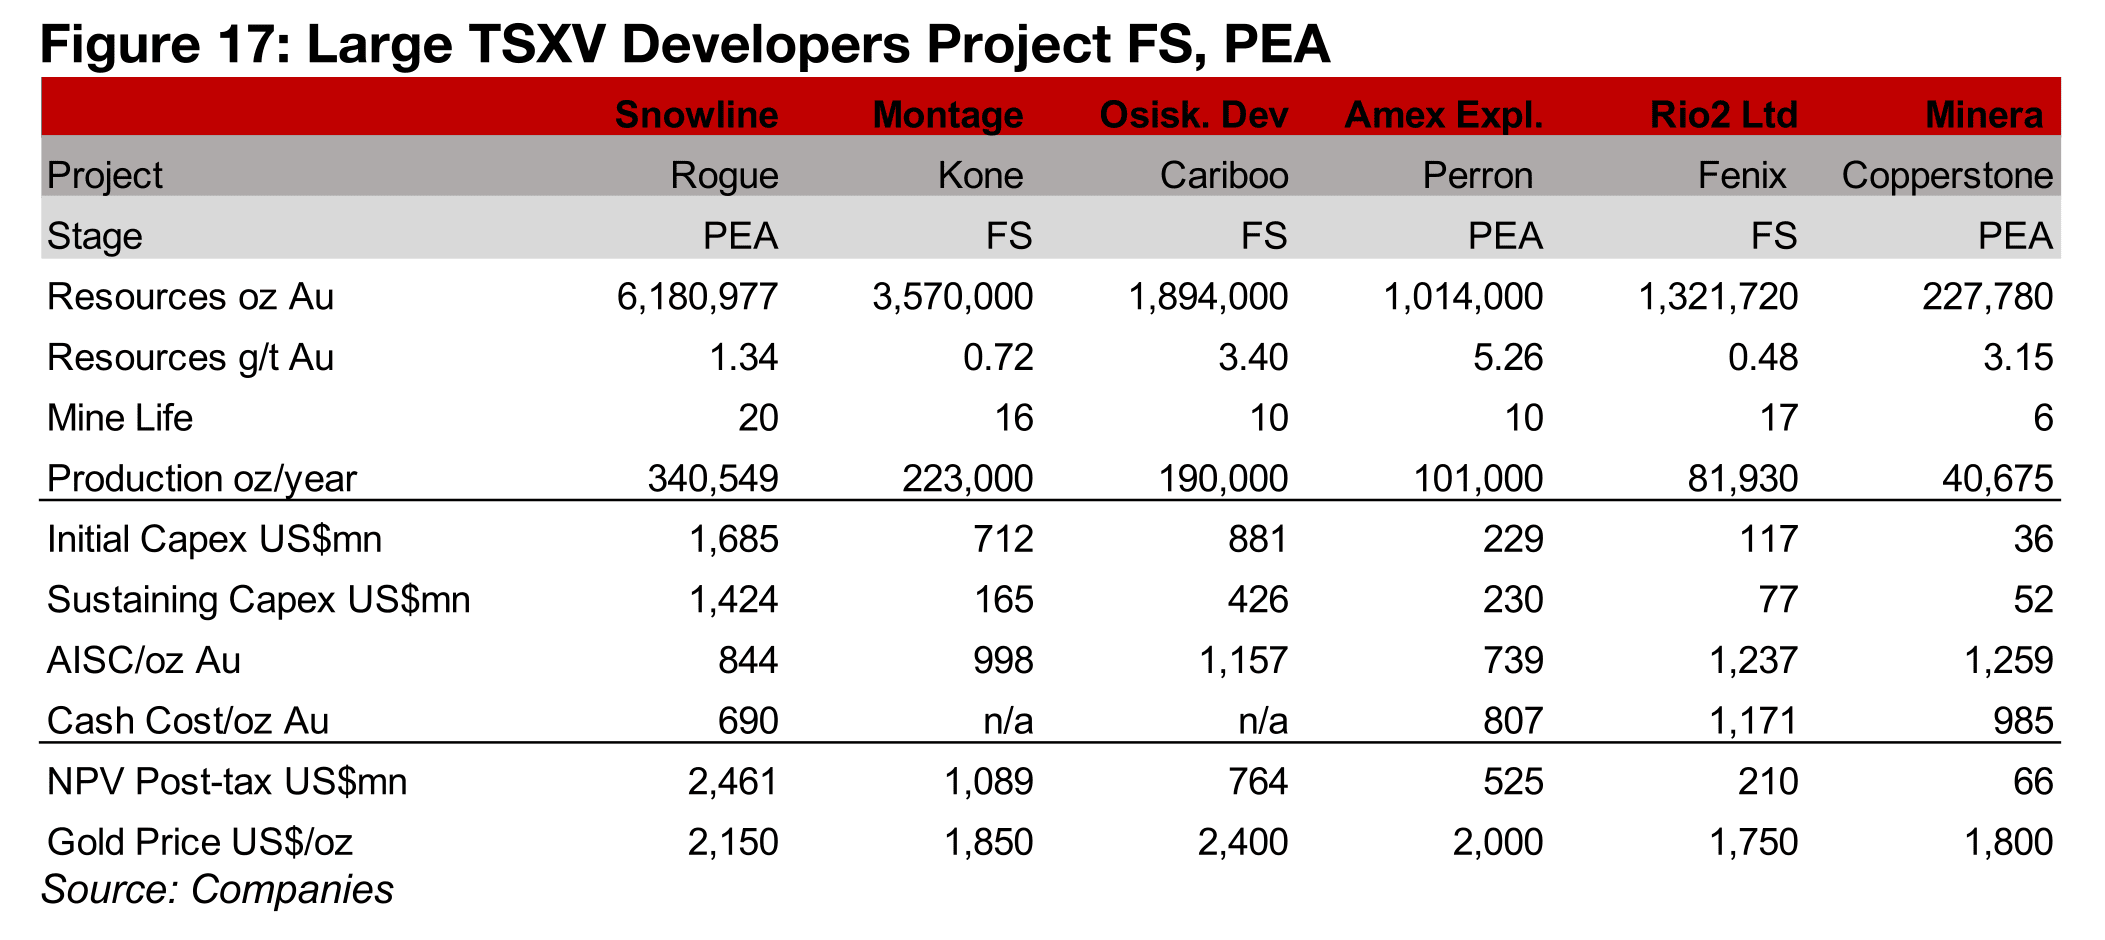
Snowline estimates 6.2mn oz Au of total production over 20 years for Valley,
substantially ahead of Montage’s Kone, at 3.6mn oz Au over 16 years, with the other
projects below 2.0mn oz Au (Figure 17). The initial and sustaining capex is a
reasonably high US$3.1bn, about three times the US$0.9bn for Kone. The AISC is
relatively low at US$844/oz, with only Amex’s Perron project below this, at
US$739/oz. While the post-tax NPV of US$2.46bn is the highest, this is not entirely
comparable across company, as they have applied a range of gold price estimates.
Disclaimer: This report is for informational use only and should not be used an alternative to the financial and legal advice of a qualified professional in business planning and investment. We do not represent that forecasts in this report will lead to a specific outcome or result, and are not liable in the event of any business action taken in whole or in part as a result of the contents of this report.
Author
Ben McGregor authors the Weekly Roundup at CanadianMiningReport.com, providing sharp analysis of the metals and mining sector. With a talent for spotting trends, Ben distills complex market shifts into clear, engaging insights on TSXV junior miners. His weekly updates cover gold, copper, uranium, and more, blending data-driven perspectives with a knack for identifying opportunities. A vital resource for investors, Ben’s work navigates the dynamic junior mining landscape with precision.