
April 10, 2023
Gold traded above US$2,000/oz for four days straight this week, its third time above this benchmark level in three years, and ending the week at $2,024/oz, is now in sight of its all-time high closing daily spot price at US$2,067/oz in August 2020.
This week we look at the recent silver price rebound, related moves in the gold to silver price ratio and the recent performance, drivers and valuation of the largest TSXV silver companies, which have seen mixed gains even as the metal has surged.
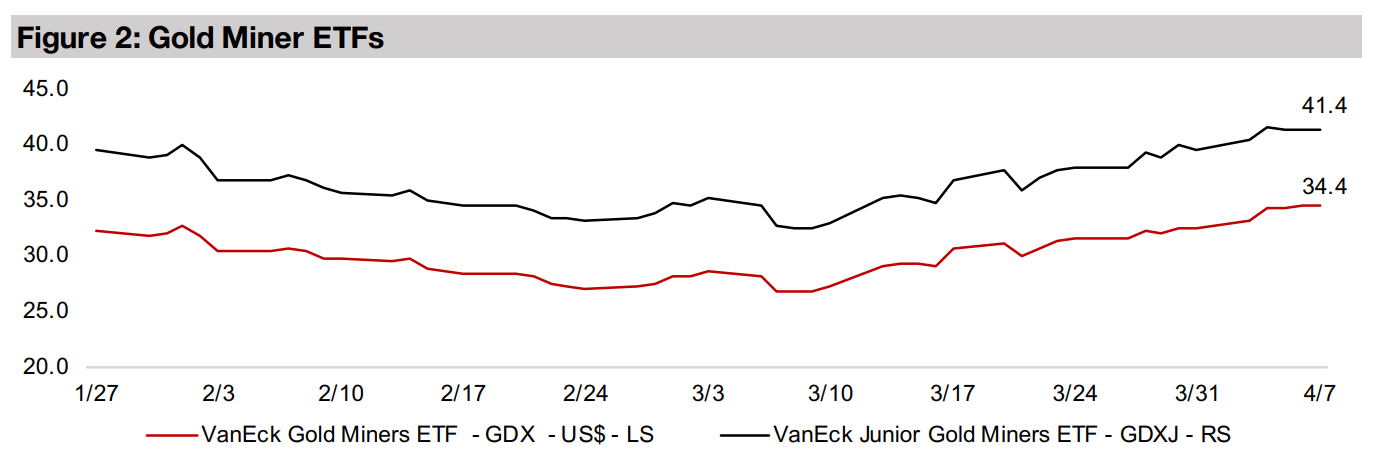
Gold stocks continued to rise, with the GDX up 6.4% and the GDXJ gaining 4.7%, and the TSXV gold stocks were nearly all up as the metal price headed towards record highs on global economic and political risk and equity markets edged up.


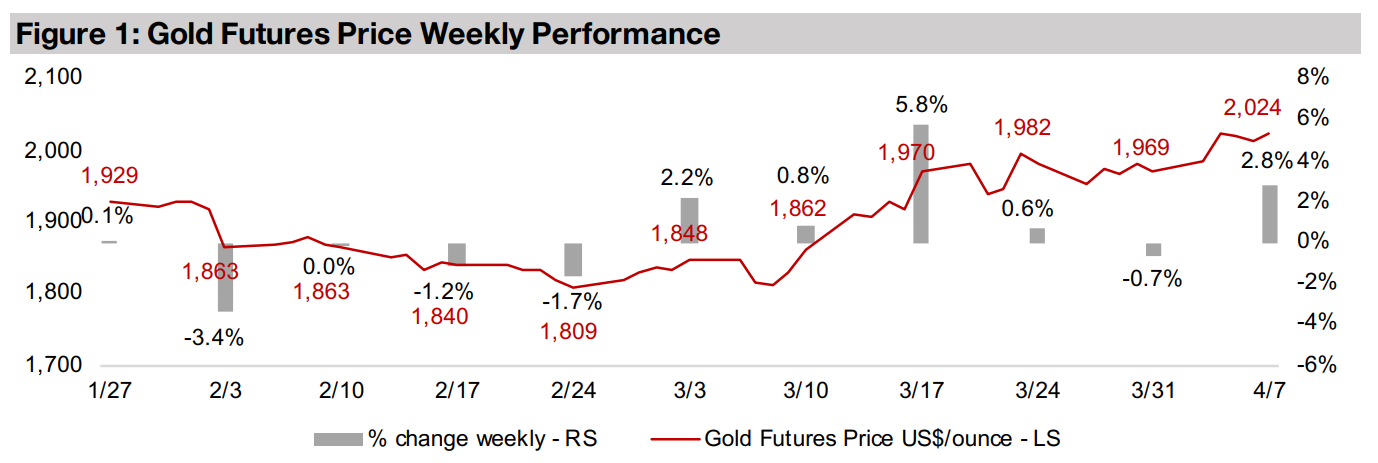
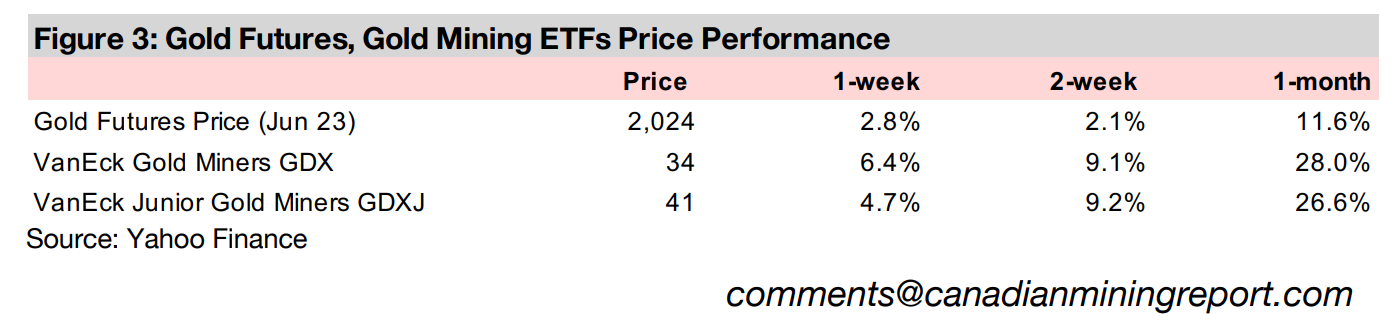
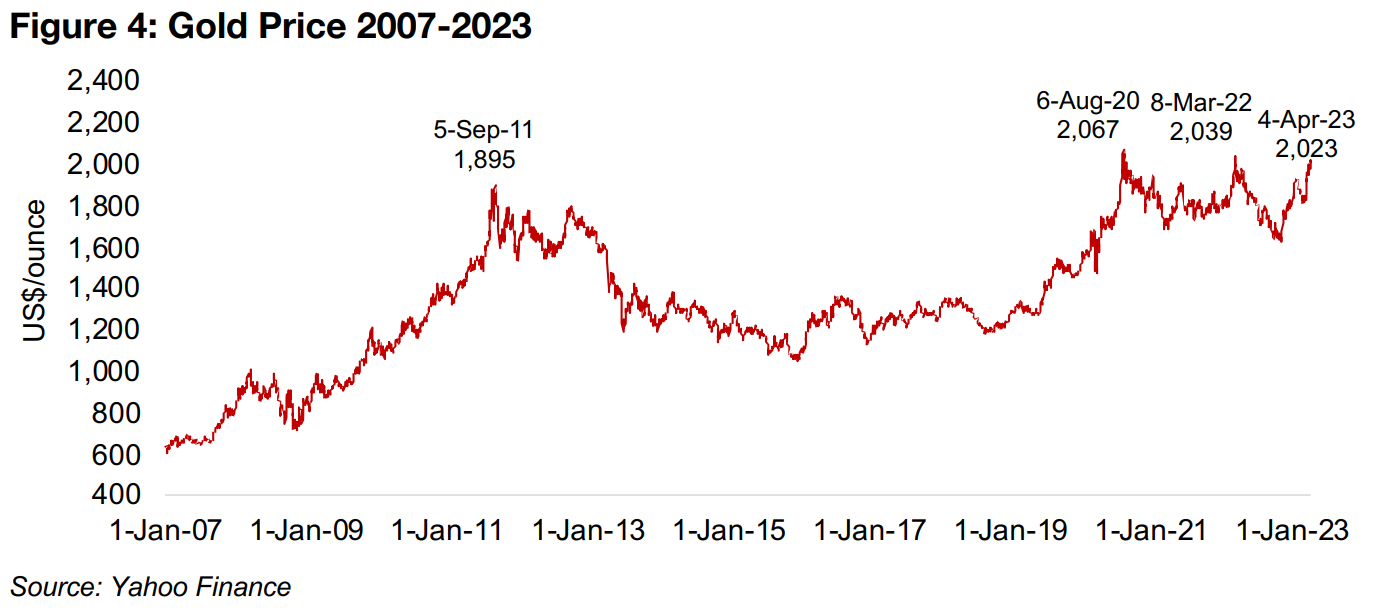
Gold rose 2.8% this week to US$2,024/oz and is heading for the all-time high for the
daily closing spot price of US$2,067/oz reached on August 6, 2020, at the peak of
fear over the global health crisis (Figure 4). Since then it made another run back up
to near those levels on March 8, 2022, on a spike in geopolitical risk especially, but
also economic concerns, as equity markets were falling. Prior to that, the gold price
had peaked at US$1,895/oz on September 5, 2011, before a long gold bear market
driven by a rare period of low inflation strong economic growth and low political risk.
A repeat of the situation from 2013 to 2018 that was extremely bearish for gold seems
unlikely this time around. Interest rates were extremely low throughout the bear
market, but are now at very high levels versus their average over the past thirty years.
Also, during this period the global economy was rebounding rapidly from the 2008-
2009 crash and awash with money that surprisingly did not drive inflation. In contrast,
central banks have far less room for stimulus with inflation at multi-decade highs and
employment levels robust. While there have been some stimulus measures for the
banking sector in the US and Europe after the recent crisis, this is being offset
substantially by continued rate hikes.
There has also been a spike in geopolitical risks, which tend to support gold, the most
major being the ongoing war between Russia and the Ukraine. However, more
recently there have also been rising tensions with China over Taiwan, and a move by
the BRICs economies to create a potentially gold-backed substitute currency as a
competitor to the US$ in trade. This is bearish for the US$, and as it tends to move
inversely to gold, is bullish for the metal. All of these factors combined seem to us
extremely supportive of gold and the probability that several of them reverse and turn
out of gold's favour, especially over the next year or so, seems quite low.
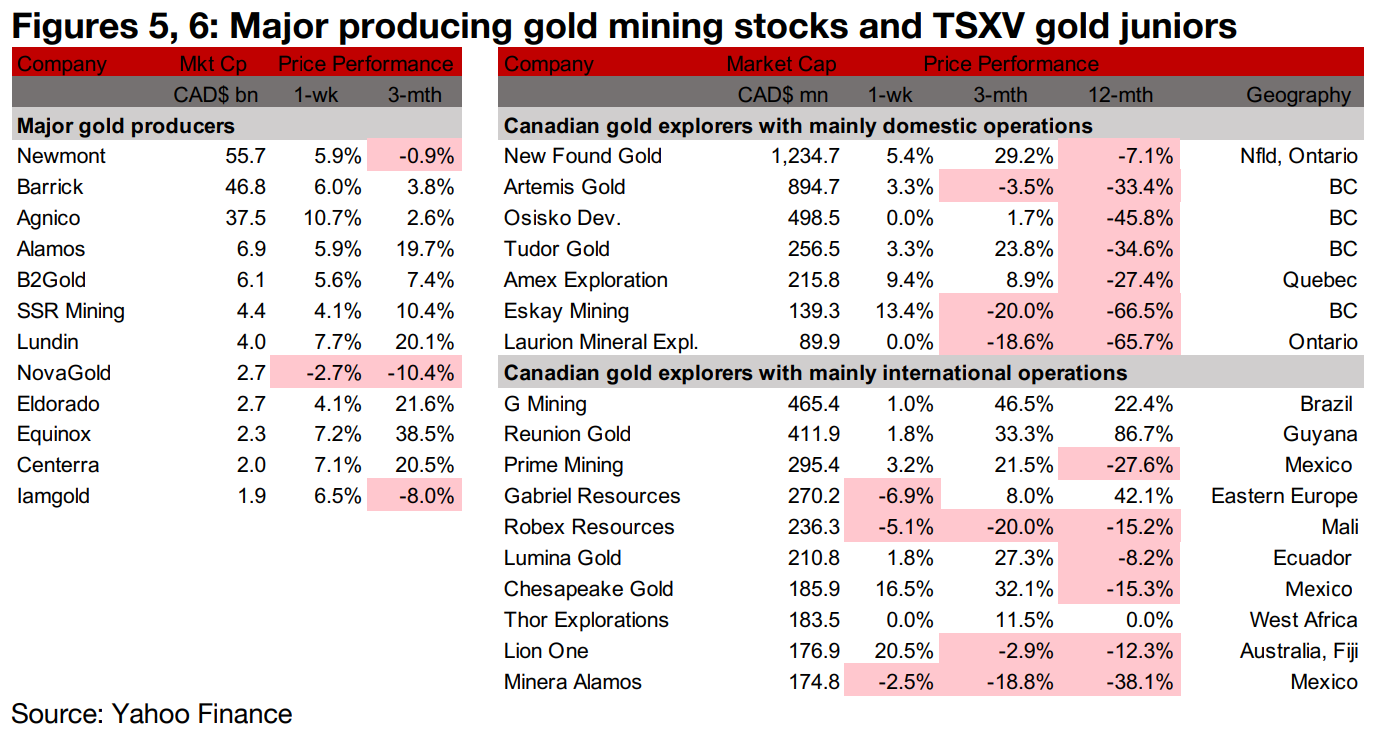
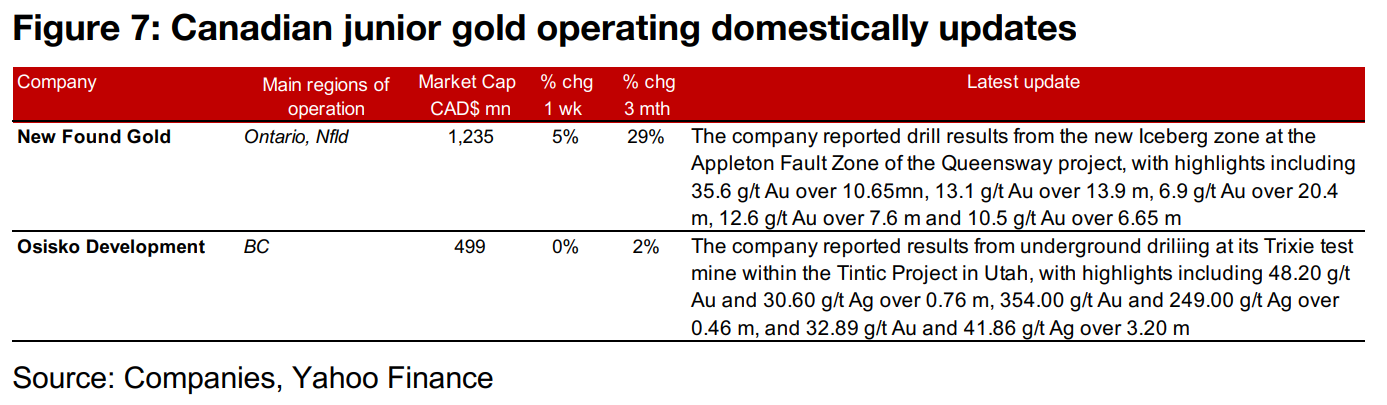
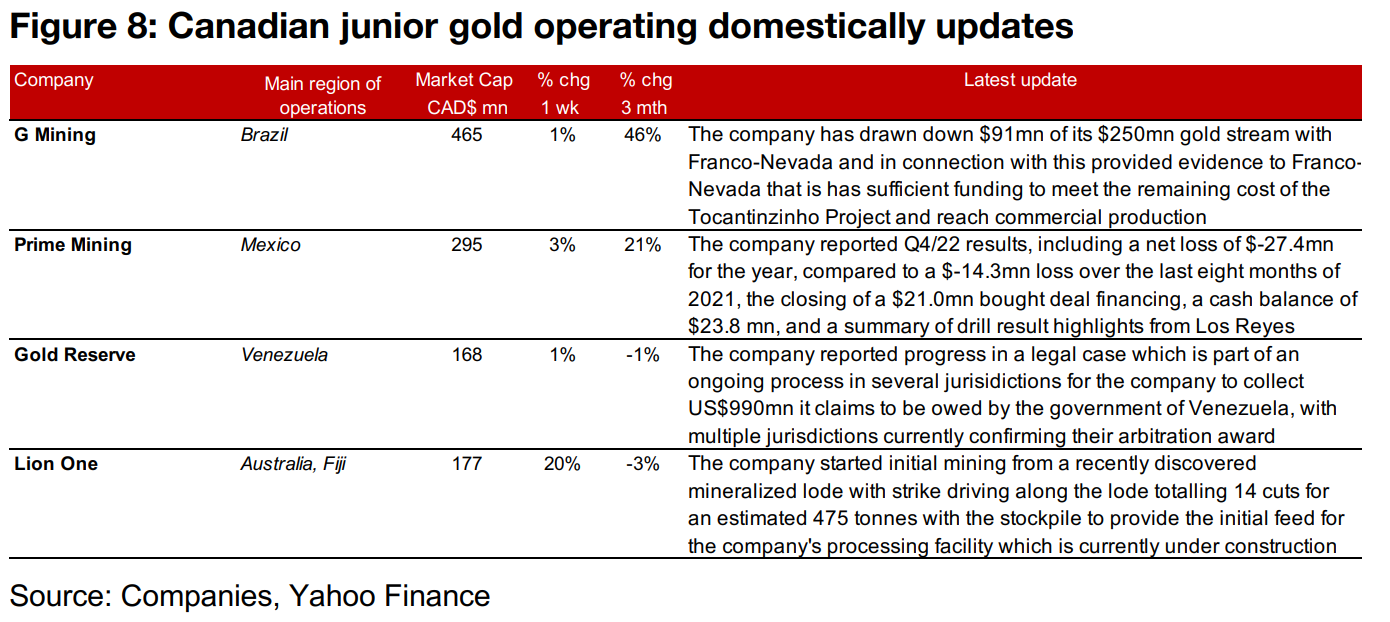
The producing gold miners and TSXV large gold stocks mostly all gained as the gold price rose and the equity markets edged up (Figures 5, 6). For the TSXV gold companies operating mainly domestically, New Found Gold reported results from the new Iceberg Zone at Queensway and Osisko Development released results from the Trixie test mine at the Tintic project (Figure 7). For the TSXV gold companies operating mainly internationally, G Mining has drawn down $91mn of its $250mn gold stream with Franco Nevada, Prime Mining reported Q4/22 results, Gold Reserve announced progress in its process to collect $990mn it claims to be owed by the Venezuelan government and Lion One started mining a stockpile to provide the initial feed for its processing facility which is currently under construction (Figure 8).
Silver outpacing other metals over the past nine months
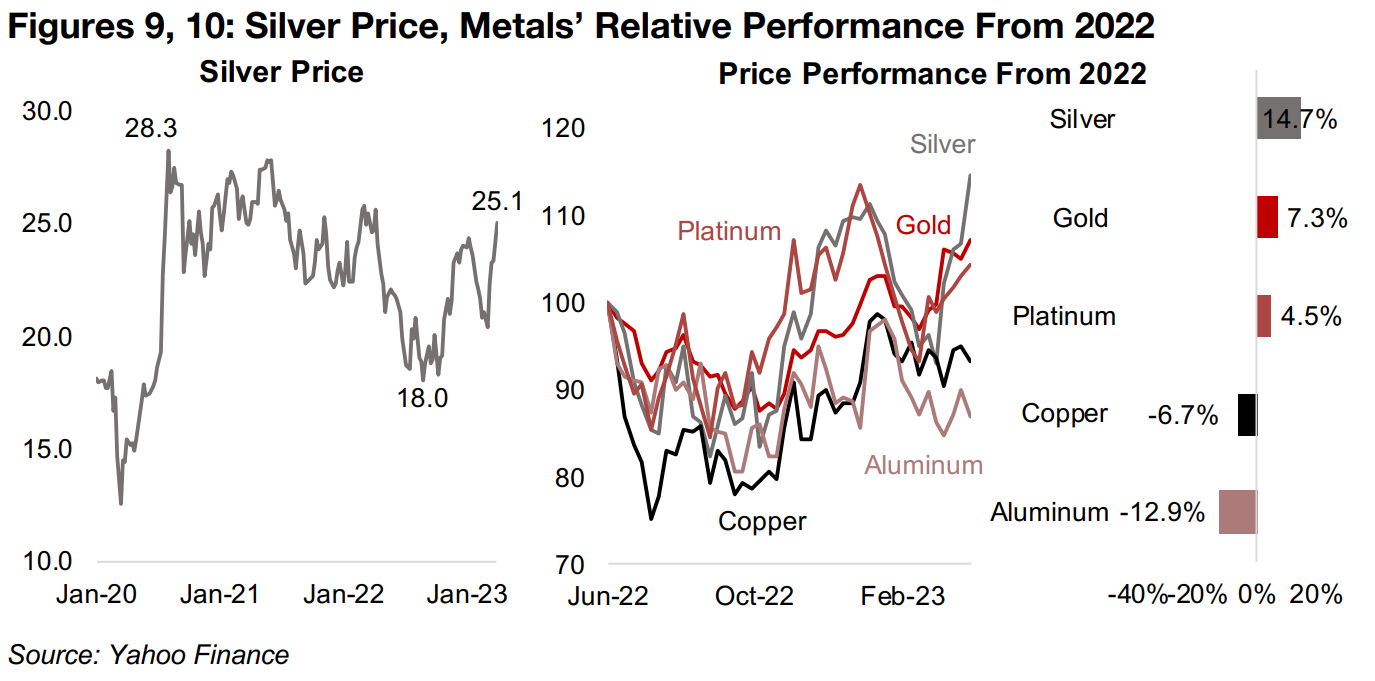
While gold has been storming ahead over the past few months, it has actually been
significantly outpaced by silver, which has rebounded off lows of US$18.0/oz in late
August 2022 to US$25.1/oz currently (Figure 9) Gaining 14.7% over the past nine
months, silver has doubled the 7.3% rise in gold, and more than tripled the 4.5% rise
in platinum. It looks particularly strong versus other base metals including copper,
which is down -6.7%, and aluminum, which has declined -12.9%, over nine months
(Figure 10).
While we expected gold to rise with the current macro backdrop, given that it is mainly driven by monetary and broader risk factors, we had been less sure on silver, which while having similar drivers as gold, also has a large industrially-driven component, similar to other base metals. Given increasing expectations by the market for a global recession, as evidenced by severely inverted yield curves, it was unclear whether the 'gold-like' drivers for silver or the 'base-metals-like' drivers would dominate. The spike in silver over past two months at a time when base metals are declining indicate that the 'gold-like' drivers are clearly winning, with the market moving into silver as a safe haven, similar to what we see for gold.
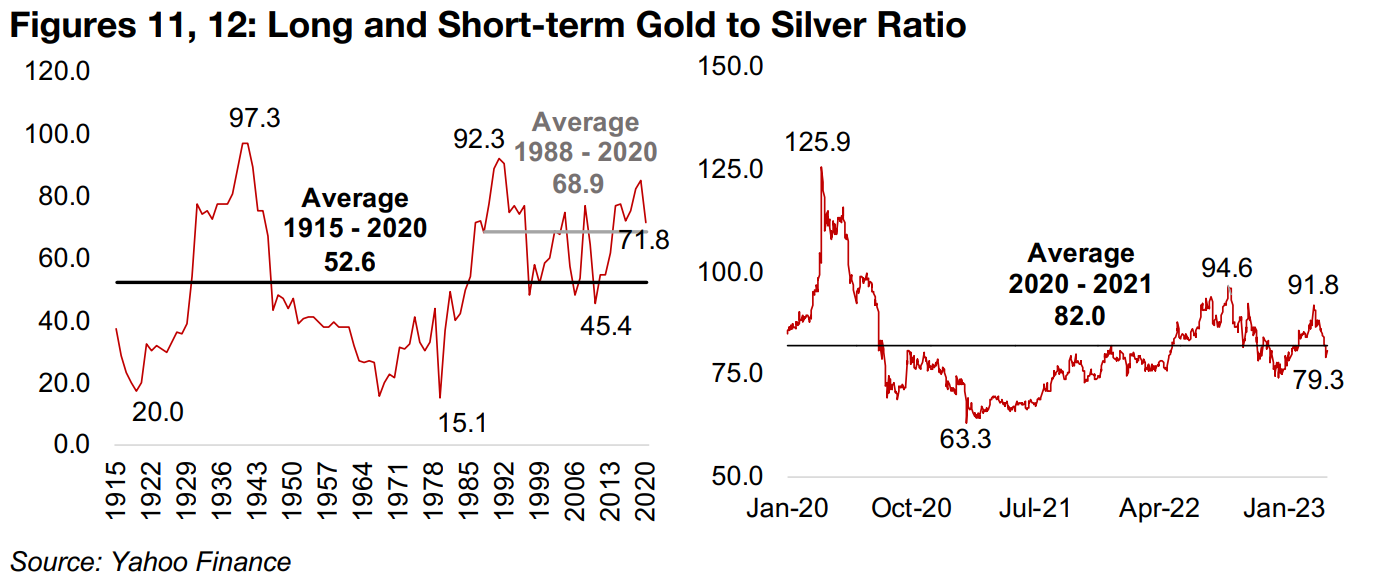
The relative strength in silver versus gold in recent months has pulled down the ratio between the two prices to 79.3x (Figure 12), down from a peak of 91.8x on March 7, 2023, after gold had outpaced silver since December 2022 (Figure 11). The ratio is quite close to the average of 82.0x from 2021 to 2023, suggesting some balance in the relative pricing of the two in the medium term. However, the longer-term average for the gold to silver ratio from 1990-2020 was 68.9x, and from 1915-2020 it was 52.6x. Given structural changes to markets over time the latter average may not be applicable now, but using thirty-year average indicates that silver could still see some relative gains to gold (Figure 12).
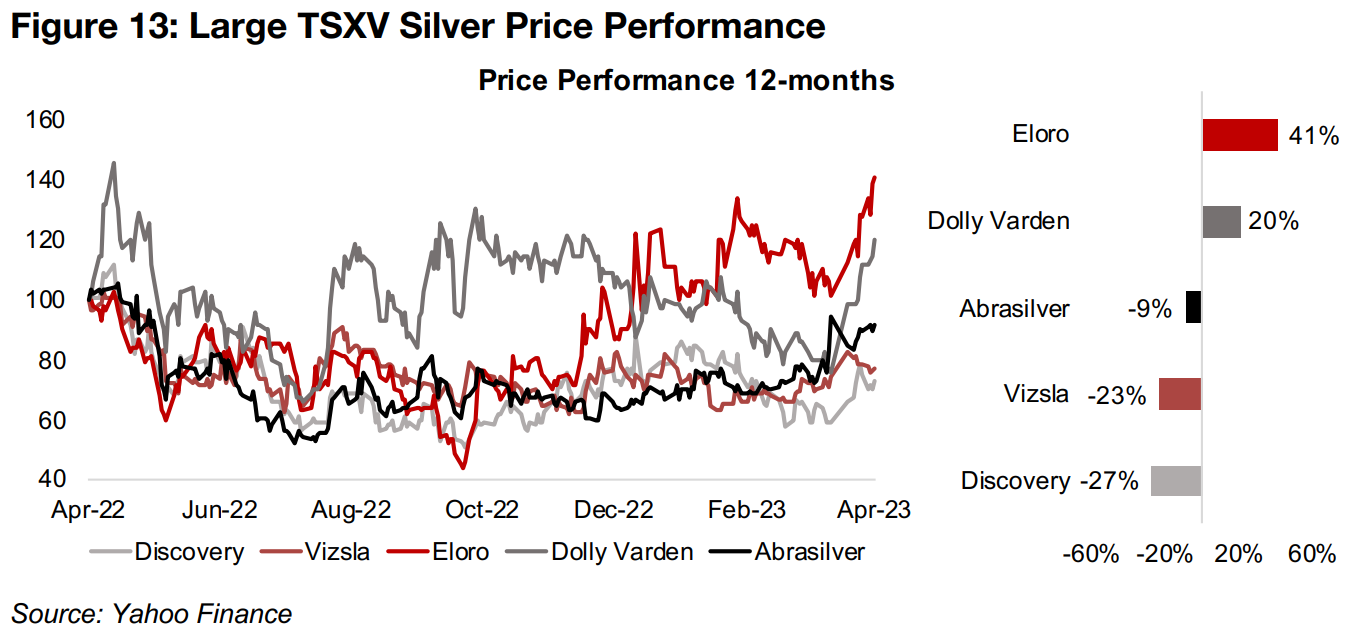
The recent jump in silver has not been a universal driver for the five largest TSXV silver companies. Eloro Resources and Dolly Varden Silver have gained 41% and 20% respectively, over the past year, with both having major rebounds over just the past month (Figure 13). However, the other three are still down over 12-months, with Abrasilver easing -9%, and Vizsla and Discovery down a substantial -23% and -27%, respectively.
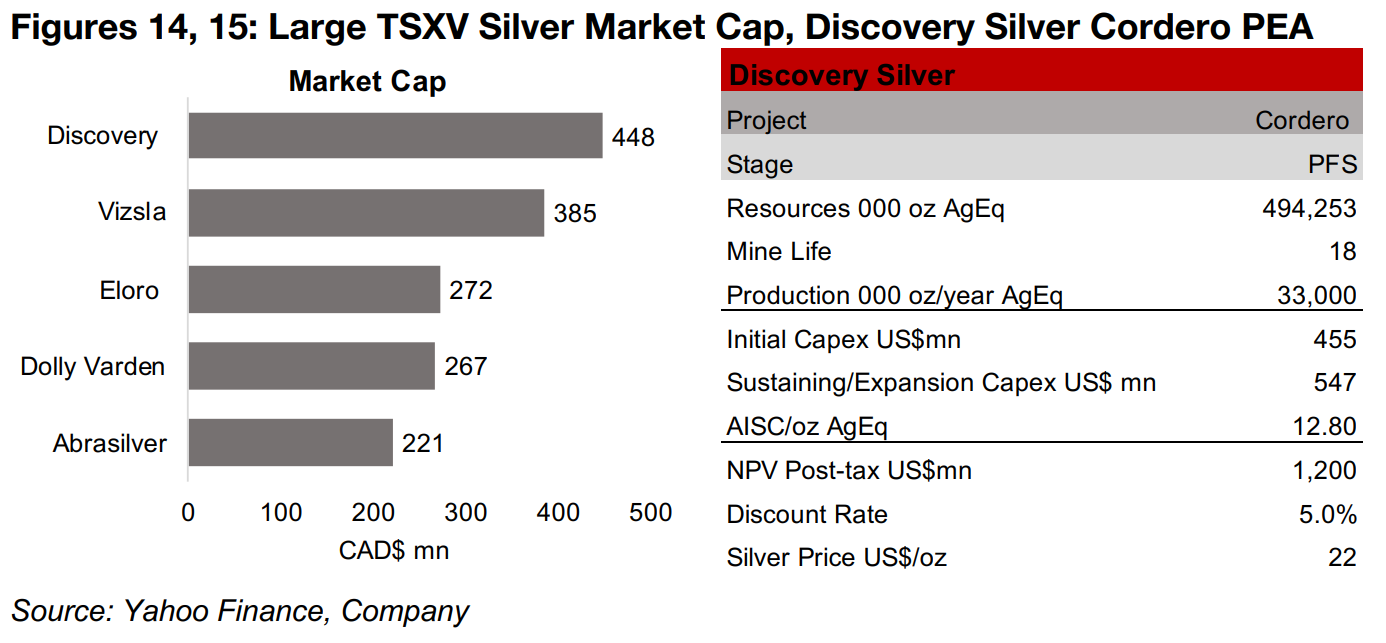
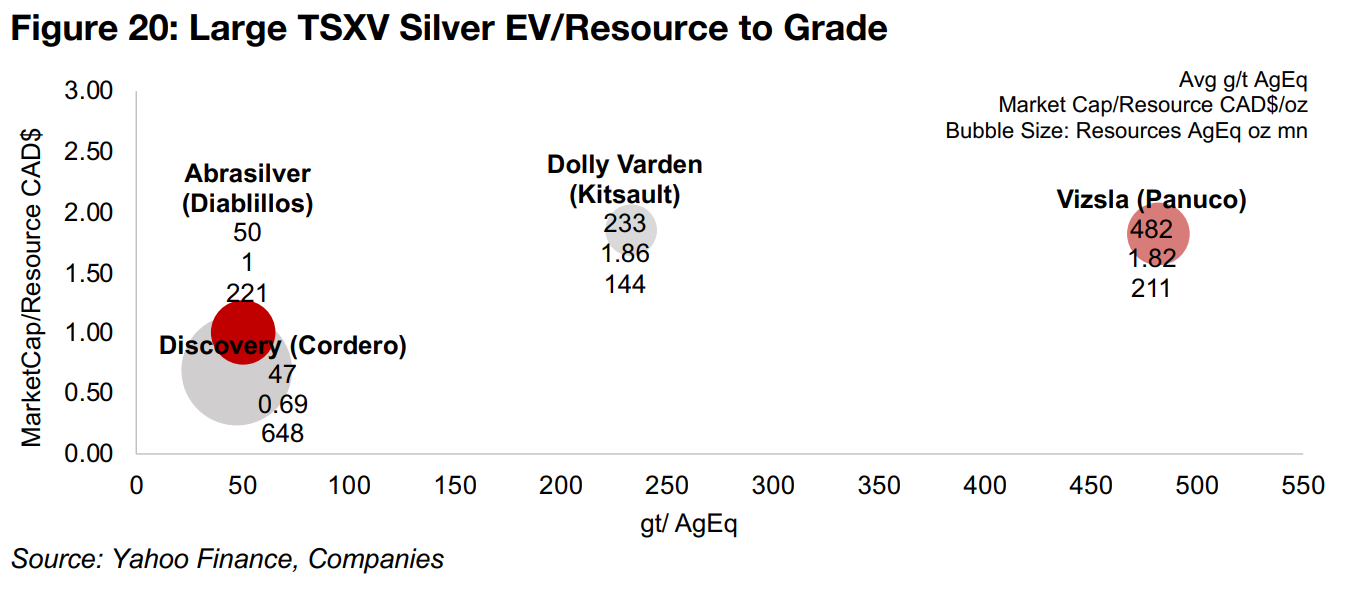
Discovery Silver is the largest of the group by market cap, at $448mn (Figure 14), and the most advanced, having reached the PFS-stage for its Cordero project, with a Feasibility Study now planned. The PFS outlines an 18-year mine life with an average 33.0 mn oz AgEq production, initial capex of $455mn, sustaining capex of $547mn, an AISC of $12.80/oz AgEq and an NPV of $US1,200 mn at a discount rate of 5.0% and silver price of US$22/oz (Figure 15). While Discovery has the largest total resources of the group by far, at 648 mn AgEq (Figure 16), its average grade is also the lowest, at 47 g/t AgEq (Figure 17). This has afforded it the lowest Market Cap/Resource of the group, at $0.69/oz (Figure 18), and places in similar territory to Abrasilver in Figure 20, showing Market Cap/Resource versus Average Grade and total Resources. However, analysts still remain bullish on stock with the current target price indicating 180% upside, the second highest of the group (Figure 19).
The second largest by market cap is Vizla Silver, which released an updated Resource Estimate for its Panuco project in January 2023. Total Indicated and Inferred Resources in the new estimate were 211 mn oz AgEq, at by far the highest average grade of the group, of 482 g/t AgEq. This has given it a relatively high Market Cap/Resource versus the group of $1.82/oz, and the market is targeting 52% upside to its target price. Dolly Varden's Kitsault Valley Project, where drilling will continue through 2023, has M&I and Inferred Resources of 144 mn oz AgEq, with the second highest average grade of the group, at 233 g/t AgEq. However, even with a grade substantially lower than Vizsla, it trades at a slightly higher level on a Market Cap/Resource of $1.86/oz AgEq, which could explain to some degree the only 30% upside to Dolly Varden's target, the lowest expected gain for the group.
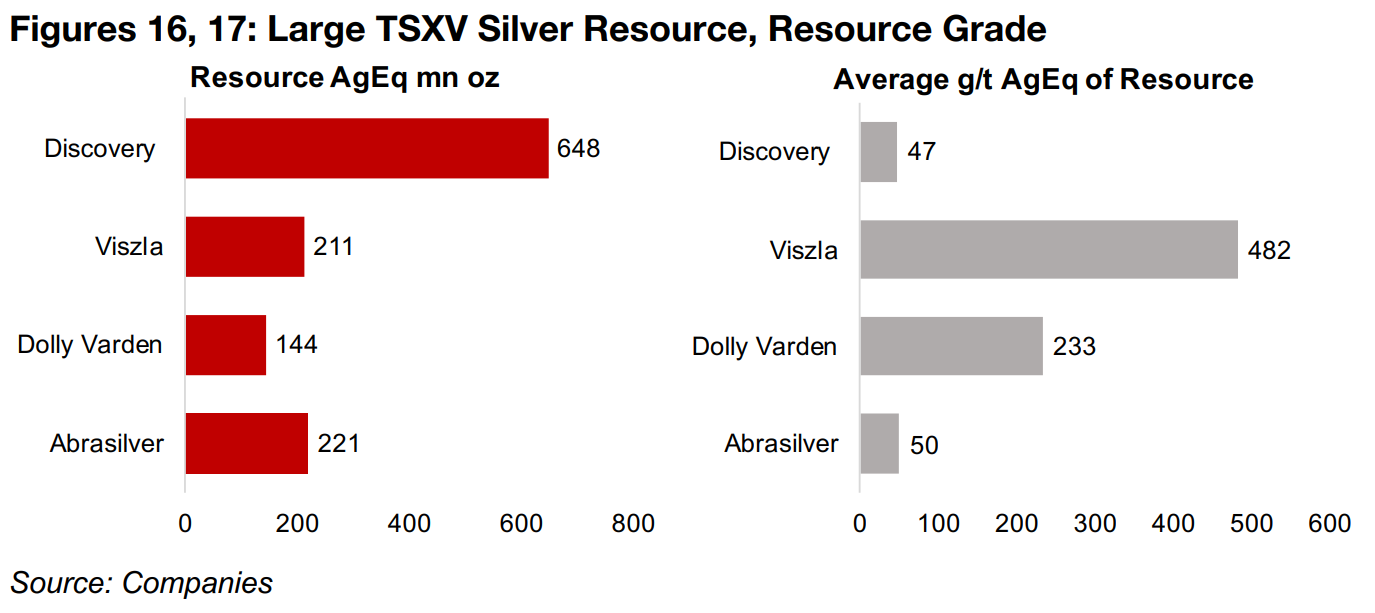
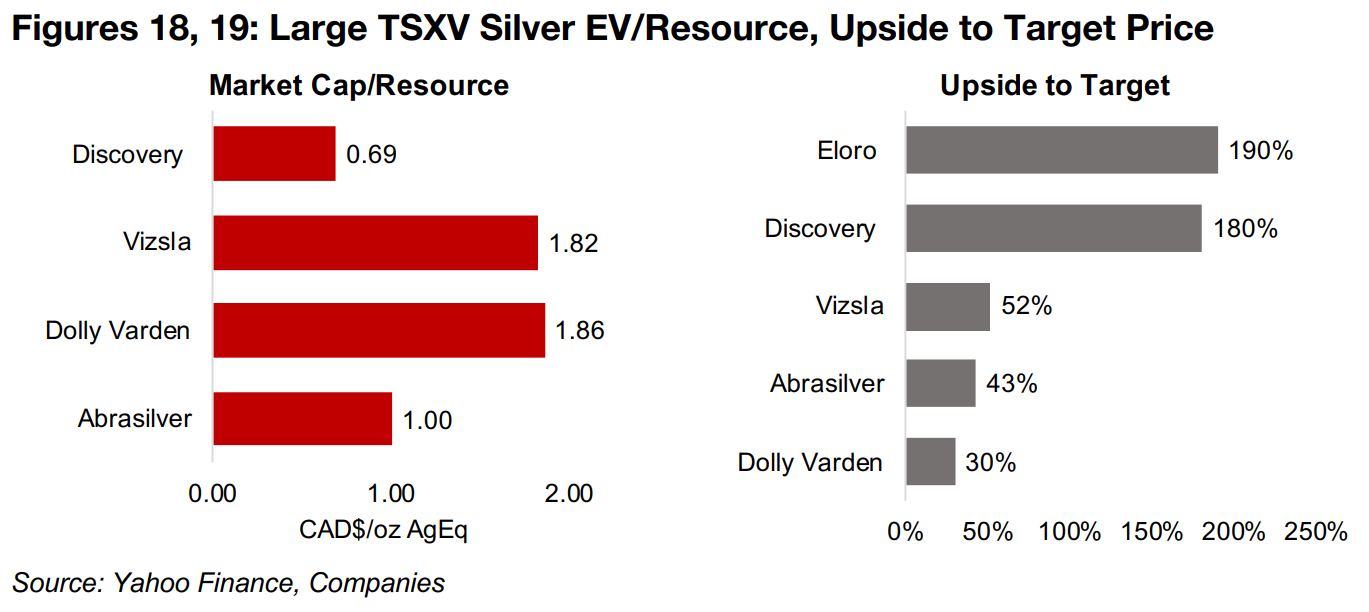
Abrasilver, operating the Diabillos project, has M&I and Inferred Resources of 221 mn oz AgEq at a grade of 50 g/t AgEq, similar in size to Vizsla, but similar in grade to Discovery. Drilling continues at the project to support a PFS, which is targeted by end 2023. Its Market Cap/Resource is $1.00/oz AgEq, above Discovery, but well below Vizsla or Dolly Varden, and the market sees 43% upside to its target price. Eloro Resources has seen continued strong drill results from its Iska Iksa project which has driven the strongest stock price performance of the group over the past year. However, with an initial mineral estimate not yet released, there is no data for the company to calculate the metrics used for the other four. It has the highest upside to its target of the group, at 190%, with the market apparently expecting continued strong drill results and an eventual robust Resource Estimate.
Disclaimer: This report is for informational use only and should not be used an alternative to the financial and legal advice of a qualified professional in business planning and investment. We do not represent that forecasts in this report will lead to a specific outcome or result, and are not liable in the event of any business action taken in whole or in part as a result of the contents of this report.
Author
Ben McGregor authors the Weekly Roundup at CanadianMiningReport.com, providing sharp analysis of the metals and mining sector. With a talent for spotting trends, Ben distills complex market shifts into clear, engaging insights on TSXV junior miners. His weekly updates cover gold, copper, uranium, and more, blending data-driven perspectives with a knack for identifying opportunities. A vital resource for investors, Ben’s work navigates the dynamic junior mining landscape with precision.