
October 27, 2025
Gold declined -1.7% to US$4,118/oz, the first weekly pullback in over two months, while the other precious metals also fell substantially, outperformed by the base metals and equity markets, which gained on expectations for a Fed rate cut this week.
Gold and silver may have shifted to the later stages, more parabolic and unbalanced, of their long ongoing bull markets, while platinum and palladium have only seen major gains in recent months and the base metals have been subdued over the past year.
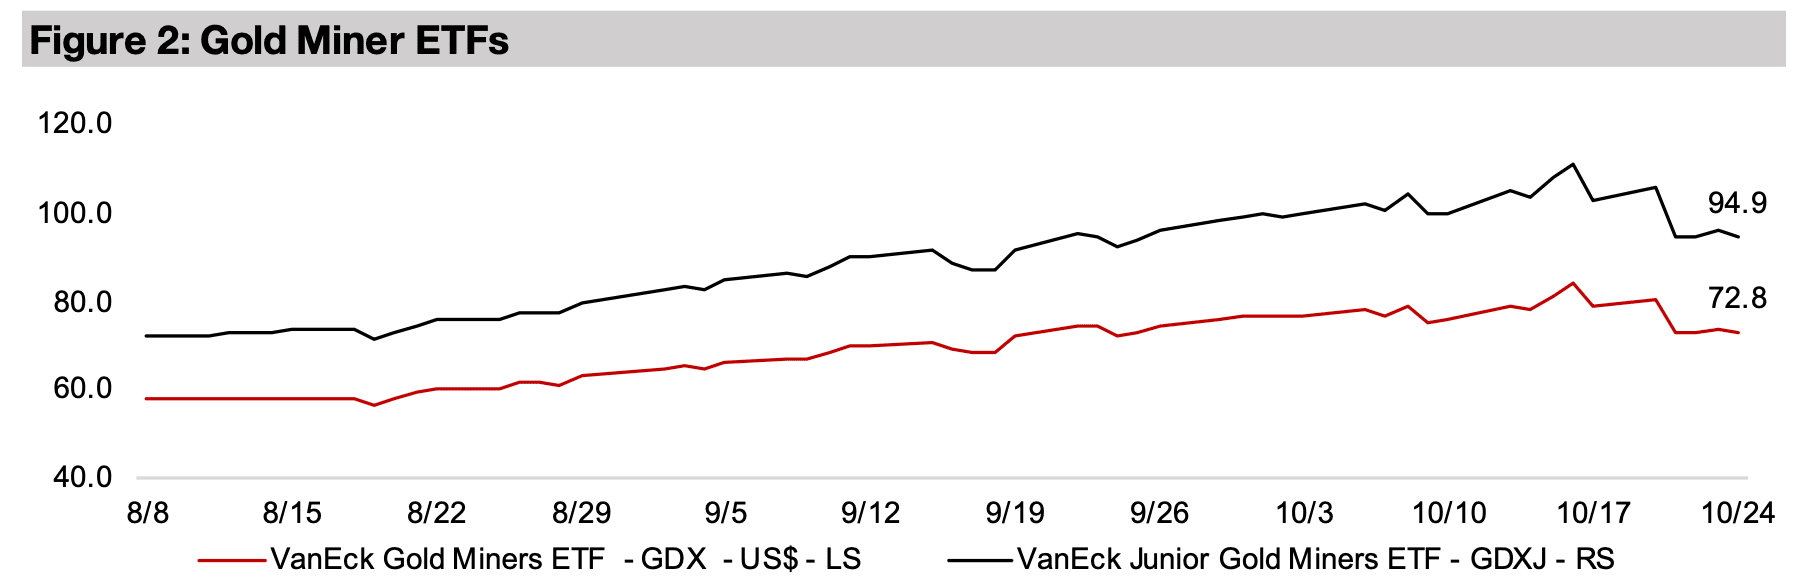
The gold stocks plunged, with GDX down -7.5% and the GDXJ losing -8.5% on the pullback in the metal price, far underperforming the rise overall equities, with the S&P 500 up 1.5%, the Nasdaq gaining 1.6% and Russell 2000 increasing 1.7%.


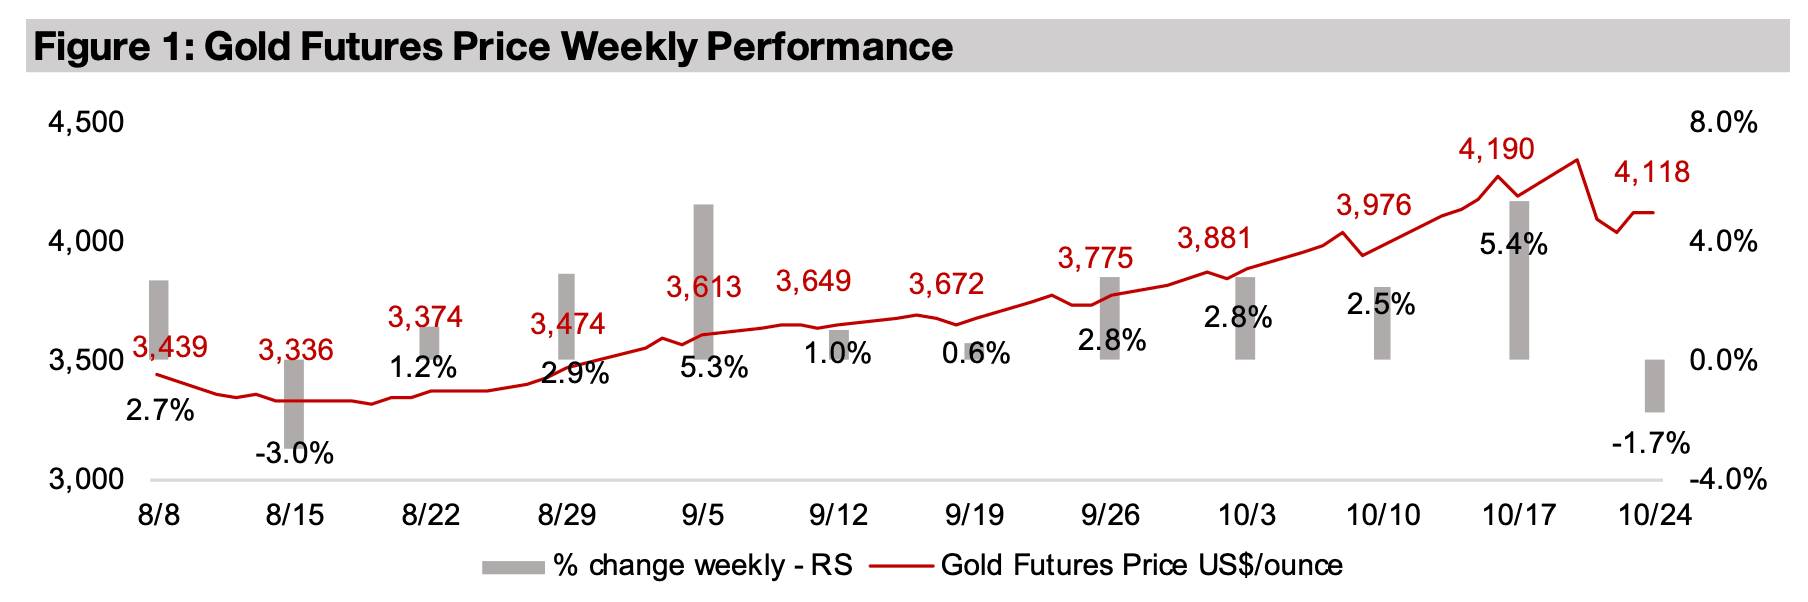
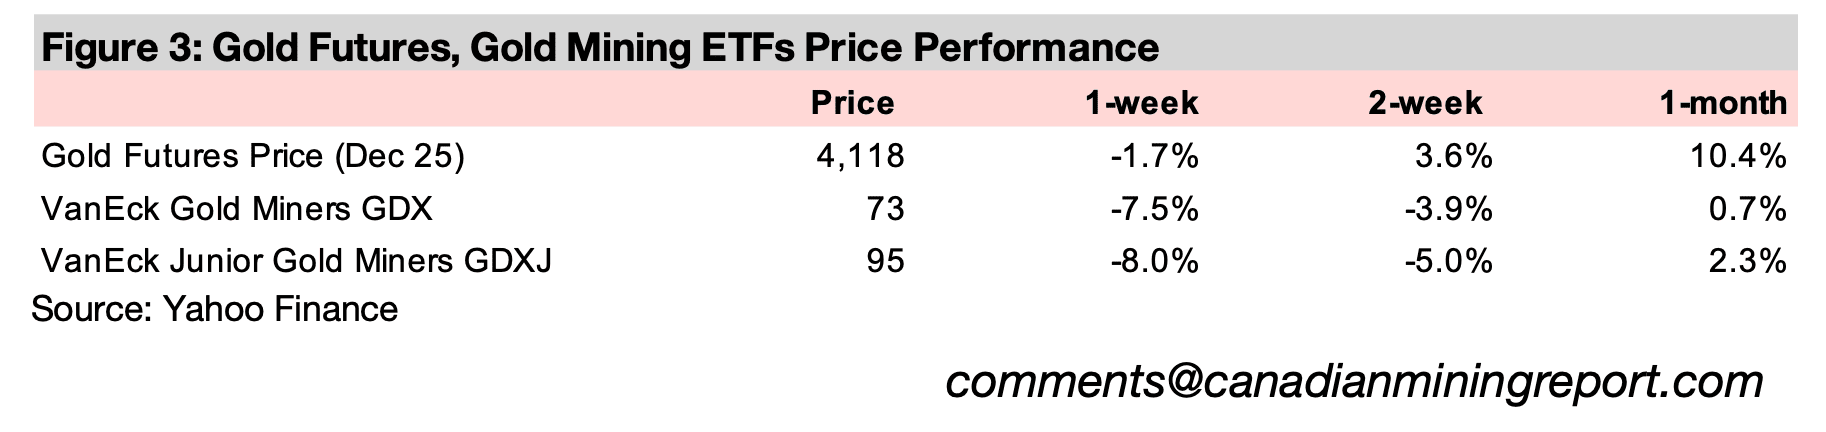
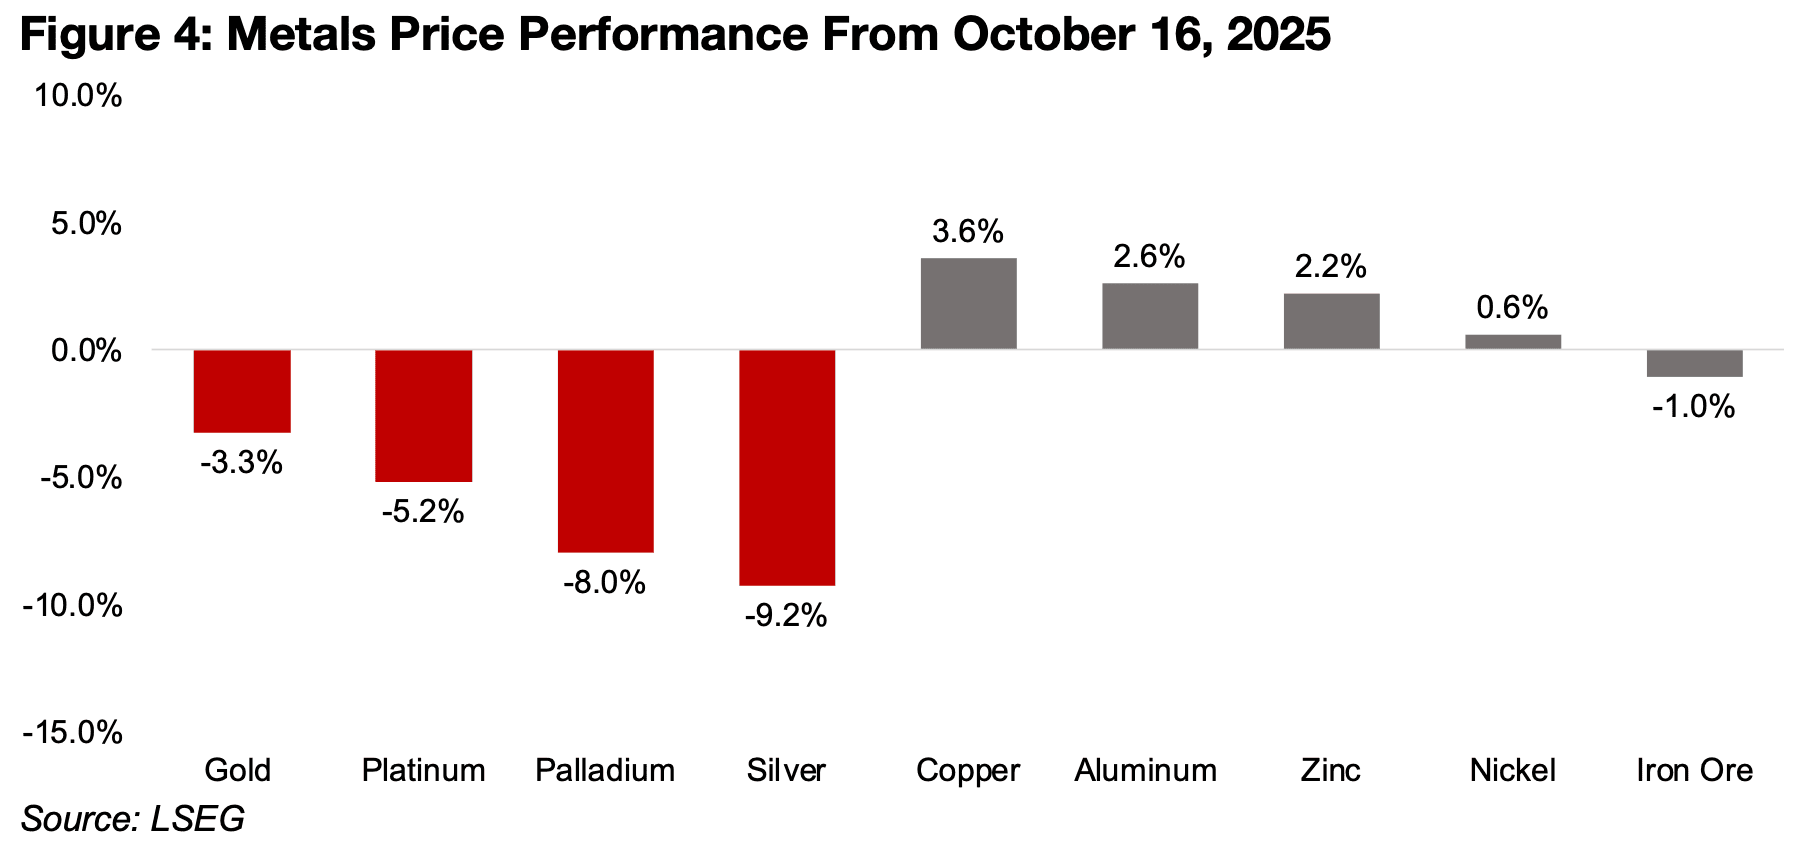
The gold price dropped -1.7% to US$4,118/oz, its first weekly decline in over two months, as all the precious metals slumped, with the ETCs of silver, palladium and platinum down -9.2%, -8.0%, and -5.2% from their peaks on October 16, 2025 (Figure 4). While the gold ETC is down -3.3% from October 16, 2025, it peaked slightly later, on October 20, 2025, and is down -4.9% since. The base metals outperformed, with the copper, aluminum, zinc, nickel and iron ore ETCs up 3.6%, 2.6%, 2.2% and 0.6%, and down -1.0%, respectively. The precious metals slump did not appear to have had a major macro driver justifying the degree of the move and was likely just the typical volatility expected from assets after an extended parabolic move.
The key macroeconomic release this week was US CPI inflation for September 2025,
which came in under expectations, and gave further backing for market expectations
that the Fed would cut rates for the second time this year at its October 28-29 meeting.
The expectations for lower rates drove up equity markets, with the S&P gaining 1.5%,
the Nasdaq rising 1.6% and Russell 2000 increasing 1.7%. The gold and silver stocks
plunged, as would be expected given the decline in the metals, with the GDX down -
7.5%, the GDXJ losing -8.5%, and the SIL ETF of silver producers declining -10.4%.
While US CPI inflation was below estimates, it has risen consistently for half a year to
3.0% in September 2025, up from lows of 2.3% in April 2025. With this figure
relatively volatile given that it includes food and energy prices, the Fed tends to focus
more on core inflation, although this number has also been rising. Core inflation had
declined from a peak for the year in February 2025 at 3.3% to 2.8% in June 2025,
but has picked back up over the past two months to 3.1% in September. With this
still above the Fed’s 2.0% target, and now increasing for the first time in three years,
it could limit the central bank’s scope for further rate cuts.
The expected rate cut on lower inflation was unlikely a major cause of the precious
metals decline, and would have been more likely an upward driver. A cut would imply
lower real bond yields, and these tend to move inversely to the gold price, as they
reduce the opportunity cost of holding the yield-less metal. The effect of lower real
yields could have also affected the other precious metals to a degree, given that they
are driven partly by monetary factors, similar to gold. The large part of their demand
from industrial factors would also been expected to be supported by a rate cut. This
would tend to boost overall economic demand, which could drive up silver given its
broad industrials uses, and the automotive industry, which is key for both platinum
and palladium, but especially the latter, where the sector is the majority of its demand.
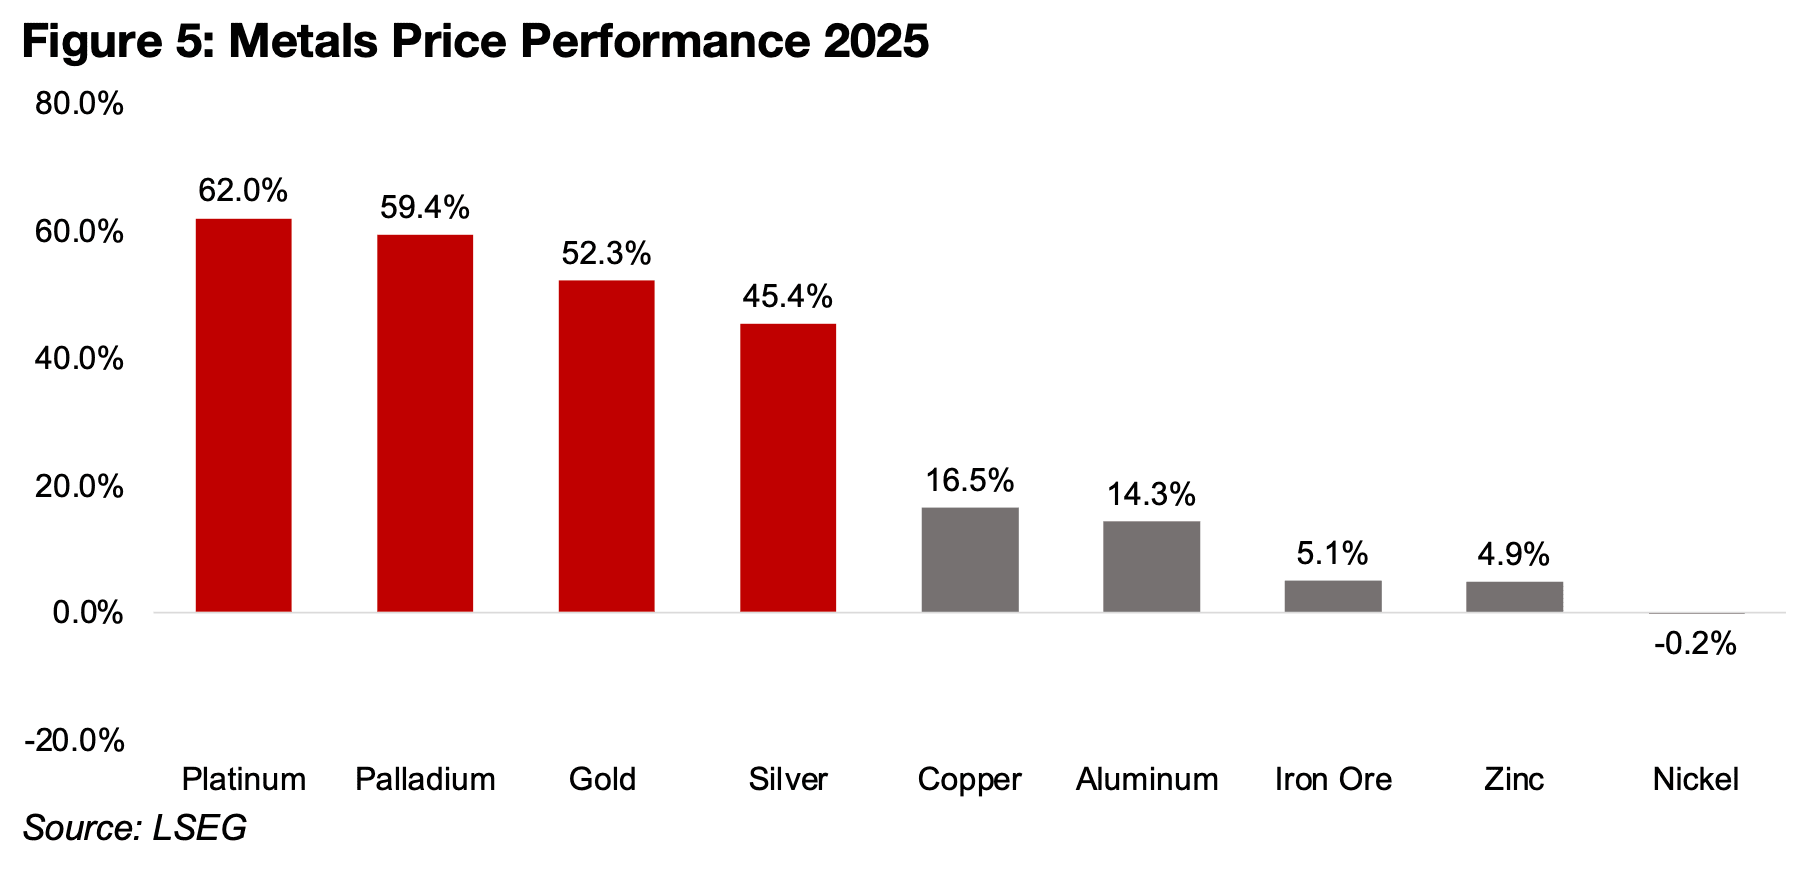
The pullback in precious metals was actually looking increasingly likely after a major three-month run, which saw platinum, palladium, gold and silver up 62.0%, 59.4%, 52.3% and 45.4% for the year (Figure 5). The rise in the base metals this year has been much more subdued, with copper, aluminum, iron, zinc and nickel up 16.5%, 14.3%, 5.1% and 4.9%, and down -0.2% respectively. This seems to indicate the market is expecting stagflation, with the precious metals driven up by a monetary expansion, but this not necessarily translating to strong economic growth and propelling the base metals.
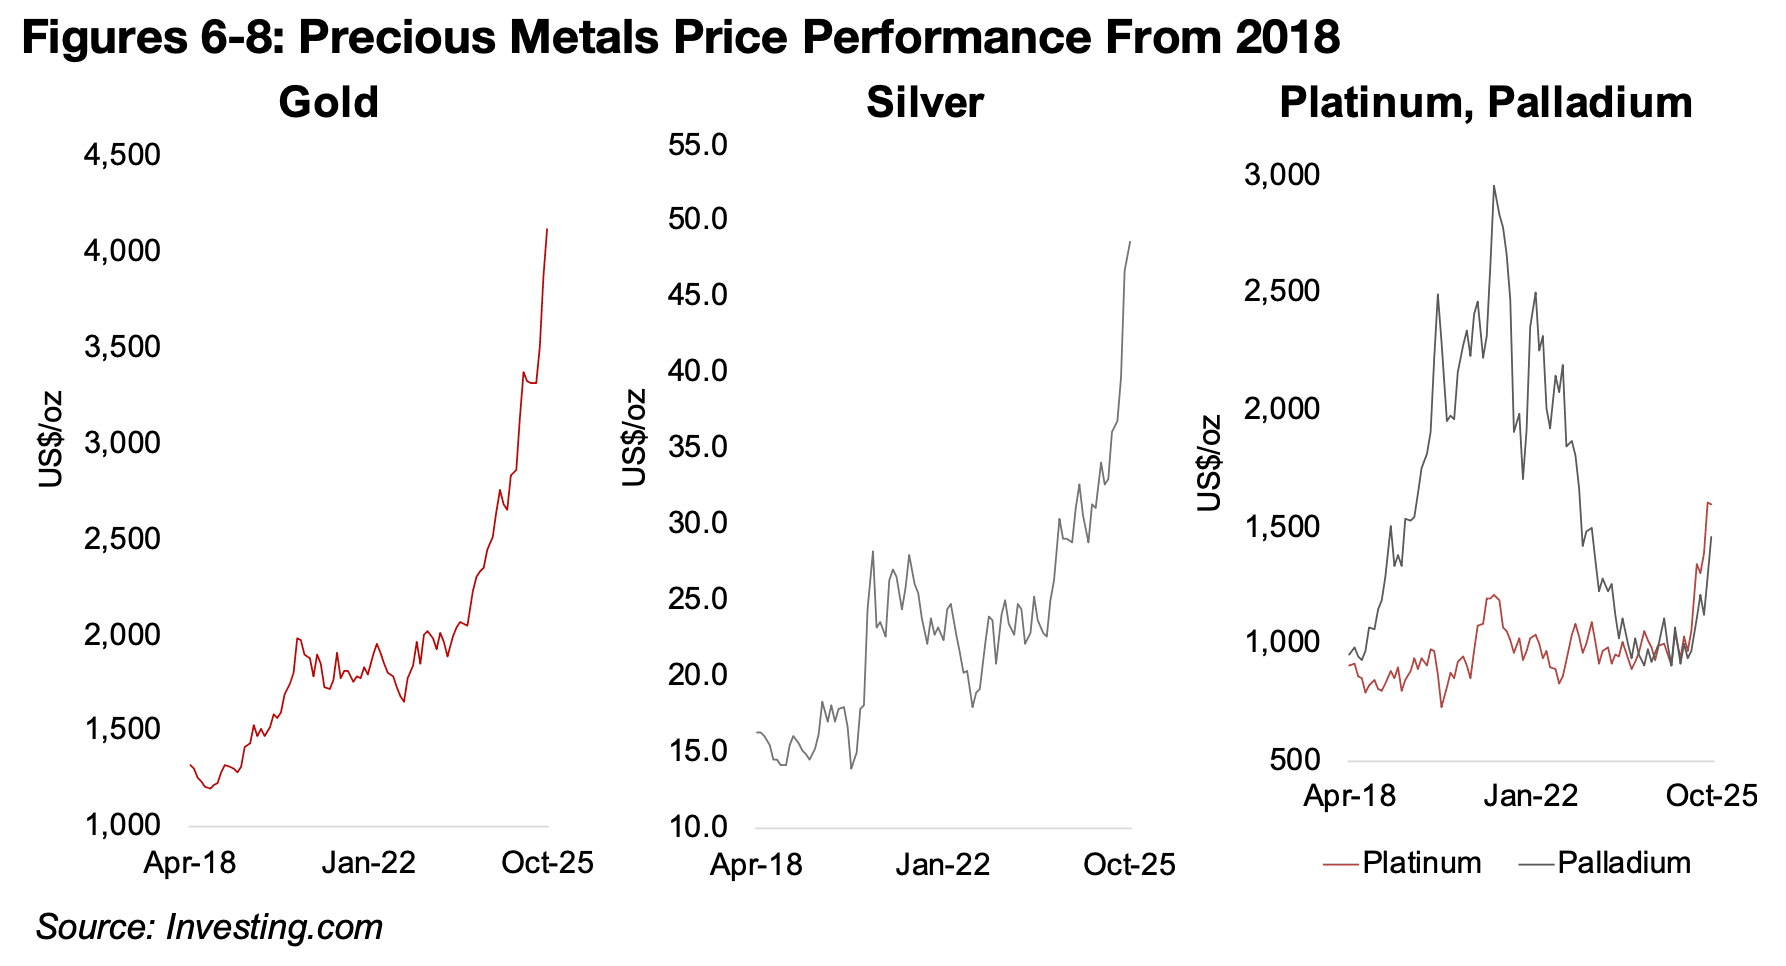
The recent volatile moves in gold and silver could indicate a shift to less balanced,
mature phases of their bull markets with Figures 6 and 7 showing just how parabolic
the prices of these metals have become. There is certainly fundamental support for a
major gain in these metals from an ongoing global monetary expansion and heighted
overall geopolitical tensions. However, the rise of the past three months does not look
like the steady gains of a fundamentally well grounded, early-stage bull market.
It looks more like a later stage bull market where the trade has become an increasingly
consensus, and therefore more risky. The pullback over the past week shows just
how quickly these types of gains can reverse, even with no significant fundamental
drivers. After long bear markets from 2013 to 2018, both gold and silver saw major
gains from 2019 to 2020, then a stagnation from 2021 through 2023, before starting
the current parabolic move around the middle of 2024. While both platinum and
palladium have also gone parabolic, this started much more recently, around mid-
2025, with far different trends from 2018 to 2024 (Figure 8).
The platinum price was relatively low through much of this period, apart from a brief
rise in 2021, while the palladium price almost tripled from 2018 to 2022, before
converging back towards the platinum price by 2024. The palladium price surged on
concerns of supply constraints and from on a substitution towards the metal from
platinum for use in autocatalysts by the auto industry. However, the huge increase in
palladium’s price eventually drove a substitution back towards platinum, with the
prices moving largely in tandem since 2024, including the recent parabolic surge.
The major base metals have clearly not been in bull markets over the past year like
gold and silver. Copper has general trended up, but the movement has been very
volatile, with many large pullbacks, and it is still just 7.7% above its previous highs in
March 2022. The price was recently boosted by the shutdown of Grasberg in
Indonesia, the world’s second largest copper producer, after a huge mudslide. This
is expected to reduce global copper supply into 2026, with the industry now
estimated to have roughly balanced supply and demand, where previously a
moderate surplus was expected. The gains for the metal may also be truncated by
muted expectations for overall global demand heading into next year.
The iron ore price has been in an extended decline and has lost most of the gains
after a doubling of the price from mid-2020 to mid-2021. The price has dropped
especially on low demand from China’s property and infrastructure segment, which
has cut steel demand. The country accounts for about half of global steel
consumption, with almost all iron ore used in producing steel. The aluminum price
has actually seen some recent parabolic action, up 19% from April 2025, but it is still
well off its highs from mid-2022, after it more than doubled from early-2020.
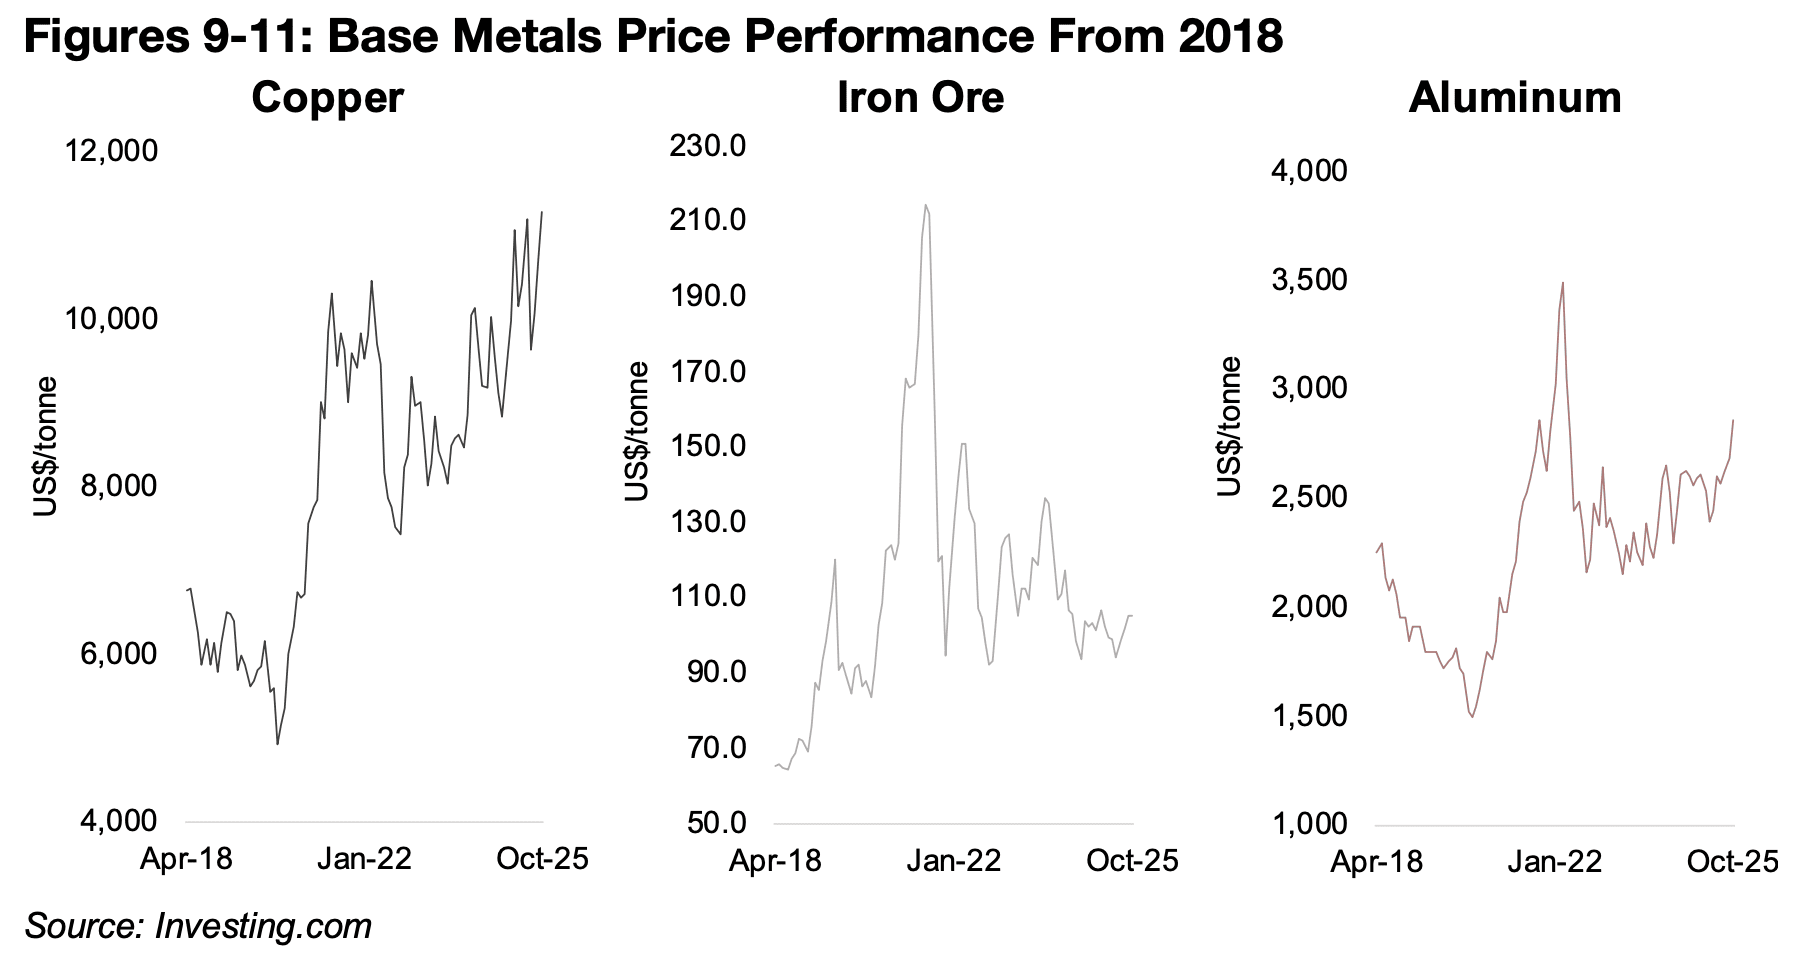
While iron ore is mainly a function of property and infrastructure demand from China,
as well as India, which is also seeing significant growth of these sectors boosting
steel demand, copper and aluminum are broader indicators of global demand. The
metals could actually suggest that world economic activity may have been relatively
muted recently, as their gains seem to have been more supply side driven. For the
copper, without the supply cuts from Grasberg, the price might not have risen above
the previous 2022 highs. For aluminum, China’s production is near its 45 mn ton
annual cap, and this supply constraint could be a main factor behind the recent jump.
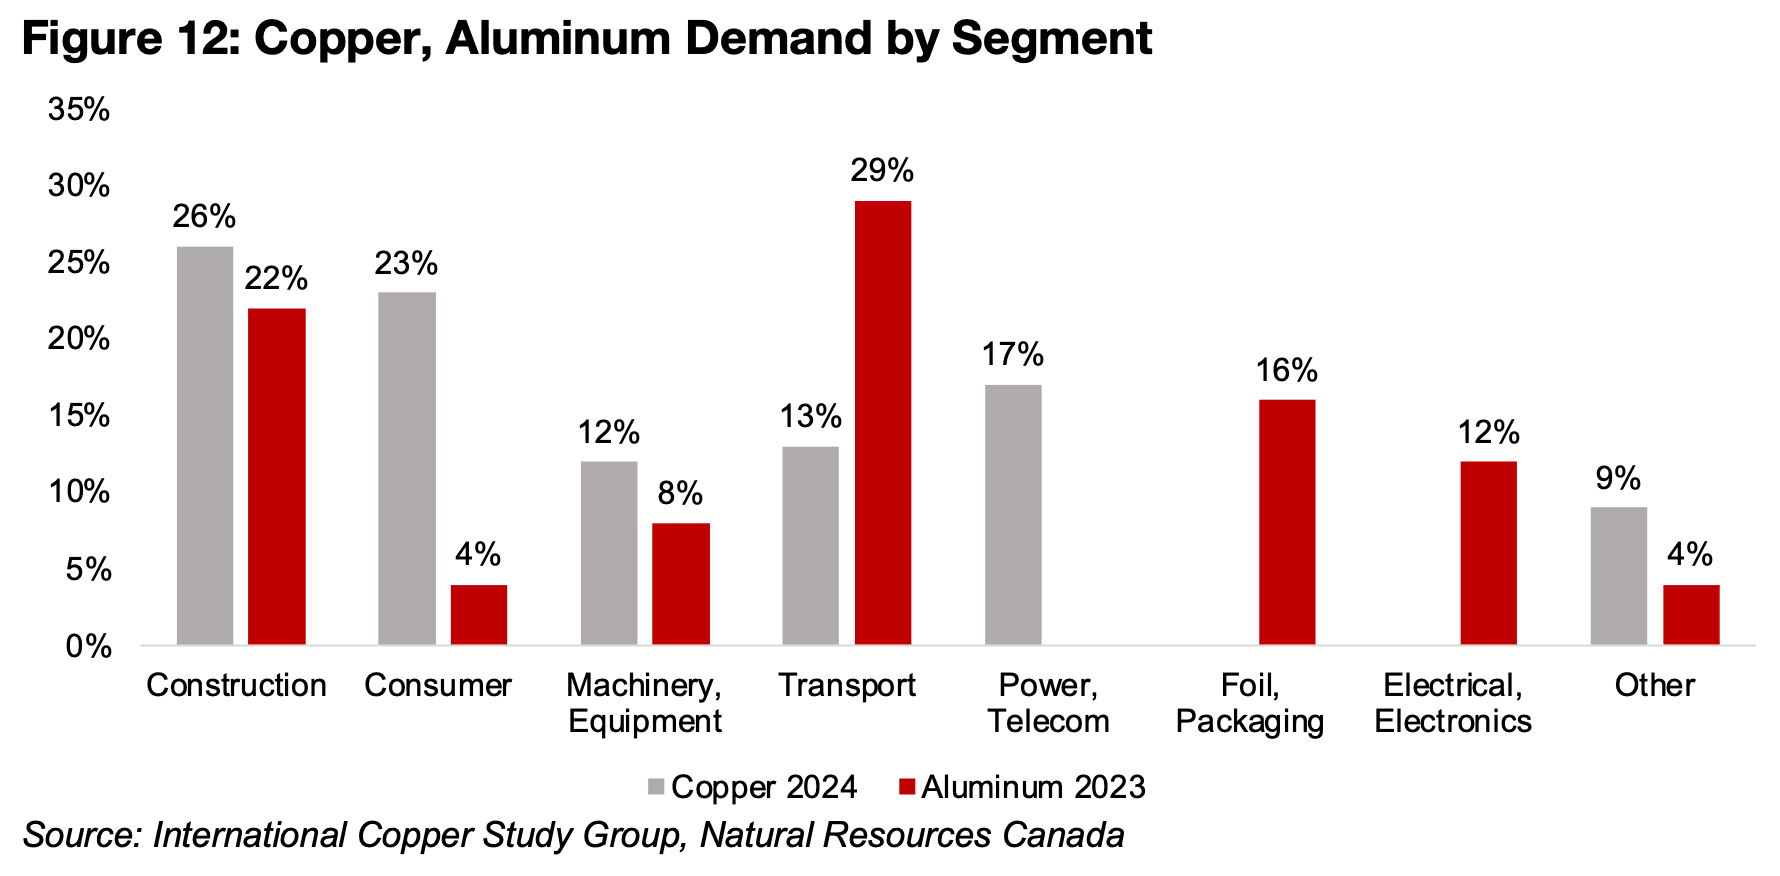
The two metals reflect a wide scope of global industrial demand. They have similar
proportions of their consumption in the construction and machinery and equipment
segments (Figure 12). Both have a high proportion of demand from transport, but it
is about twice as high for aluminum, while copper’s use in the consumer segment is
far higher. Copper has significant demand from the power and telecom segment and
aluminum from electrical and electronics segment. However, these may overlap with
other categories, and the definitions from the two sources used here may not be
exactly comparable. Aluminum has a large use in foil and packaging, with the use of
copper in packaging comparably limited.
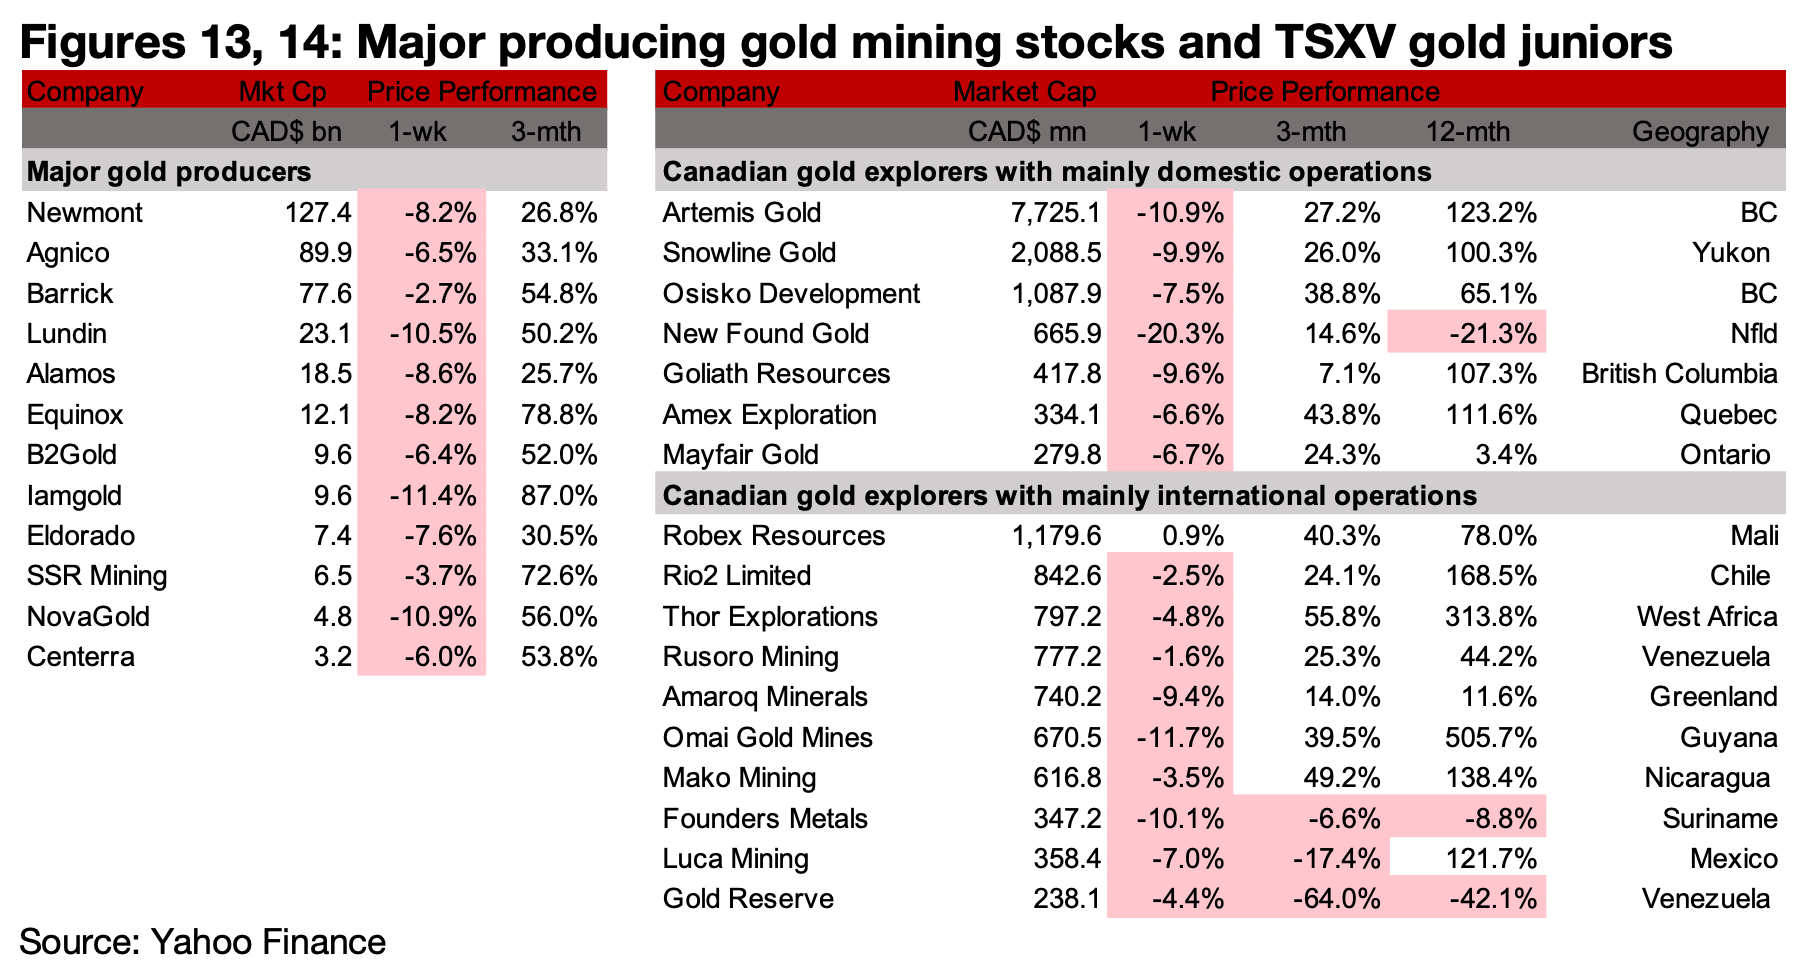
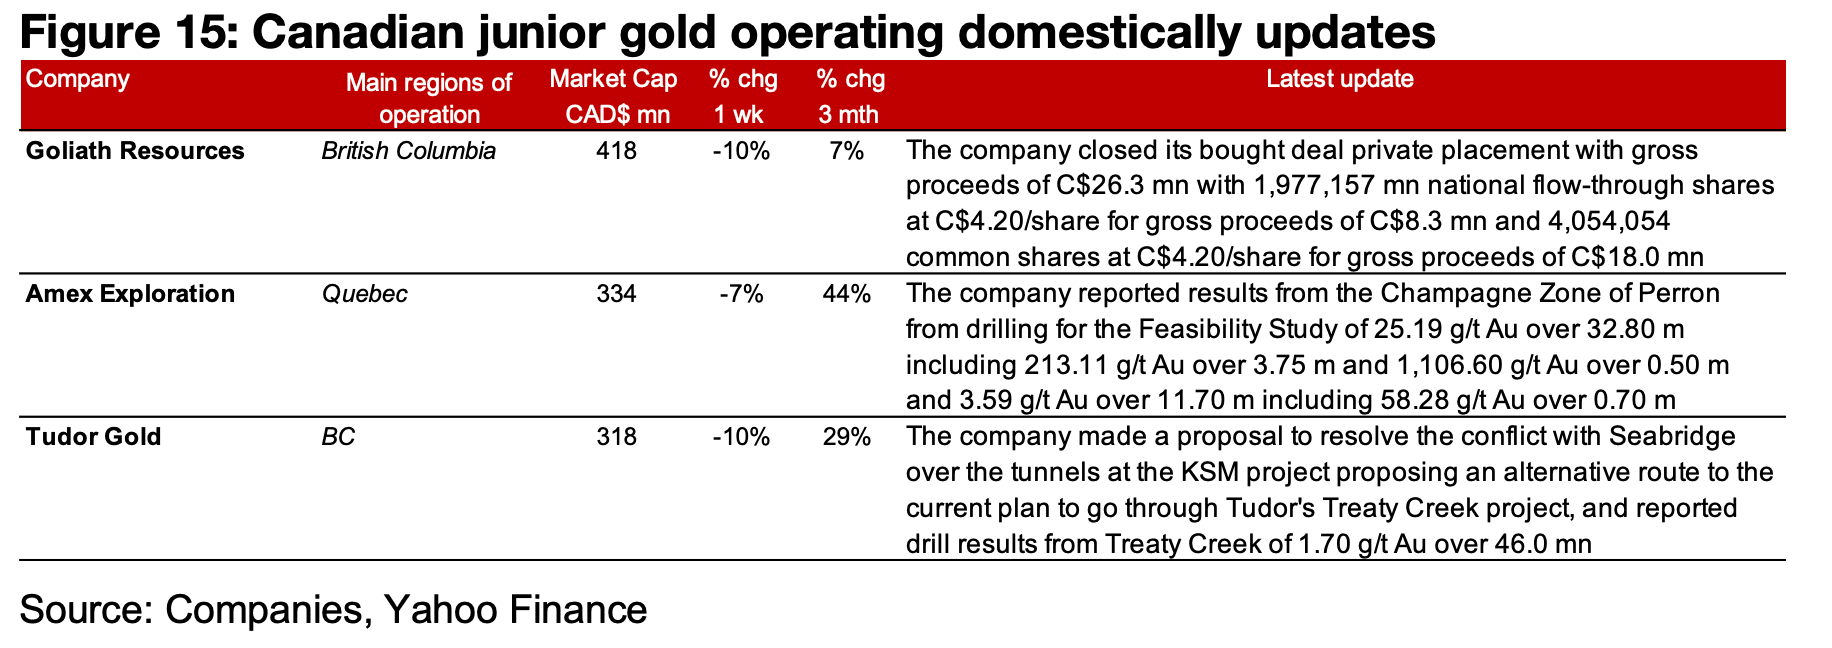
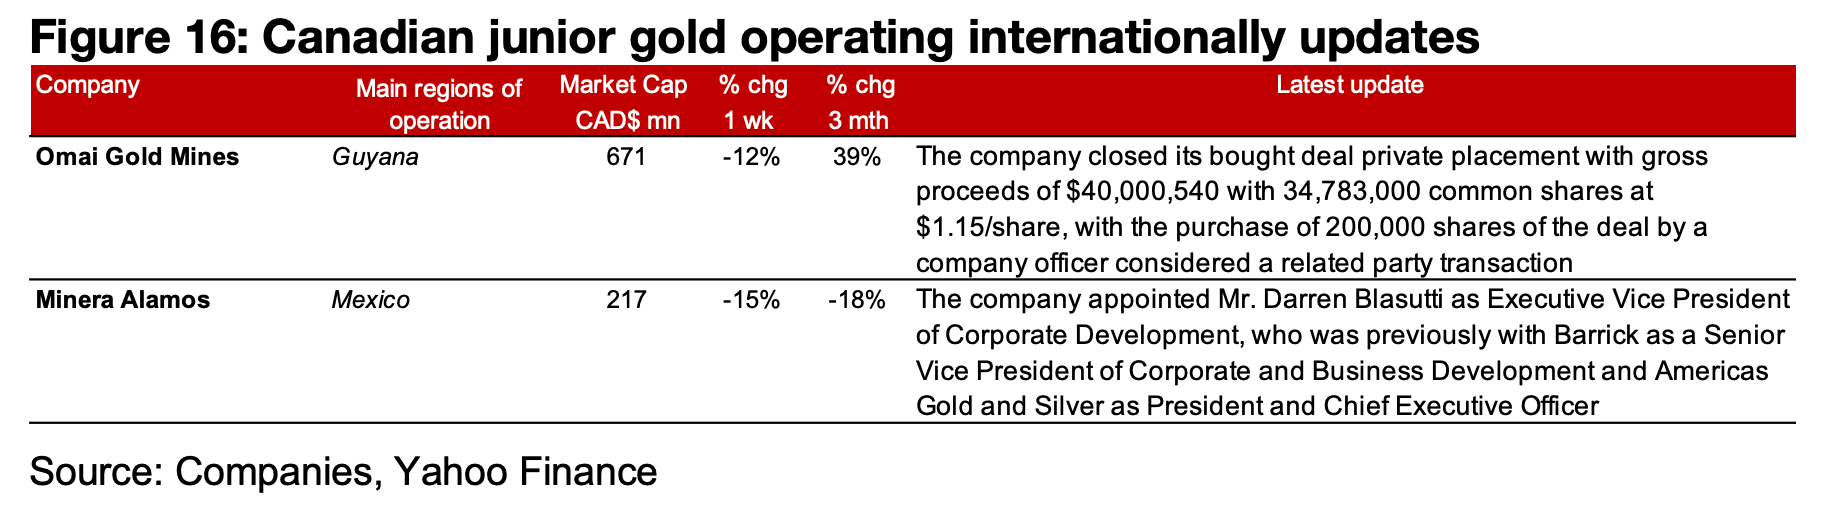
All the major gold producers and all of large TSXV gold except for Robex Resources declined significantly on the drop in the metal price (Figures 13, 14) For the TSXV gold companies operating mainly domestically, Goliath closed its private placement, Amex reported drill results from the Champagne Zone of Perron and Tudor made a proposal to resolve the conflict with Seabridge over the tunnels at KSM that would go through Treaty Creek, indicating an alternative route (Figure 15). For the TSXV gold companies operating mainly internationally, Omai closed its private placement and Minera Alamos appointed Mr. Darren Blasutti as Executive Vice President of Corporate Development (Figure 16).
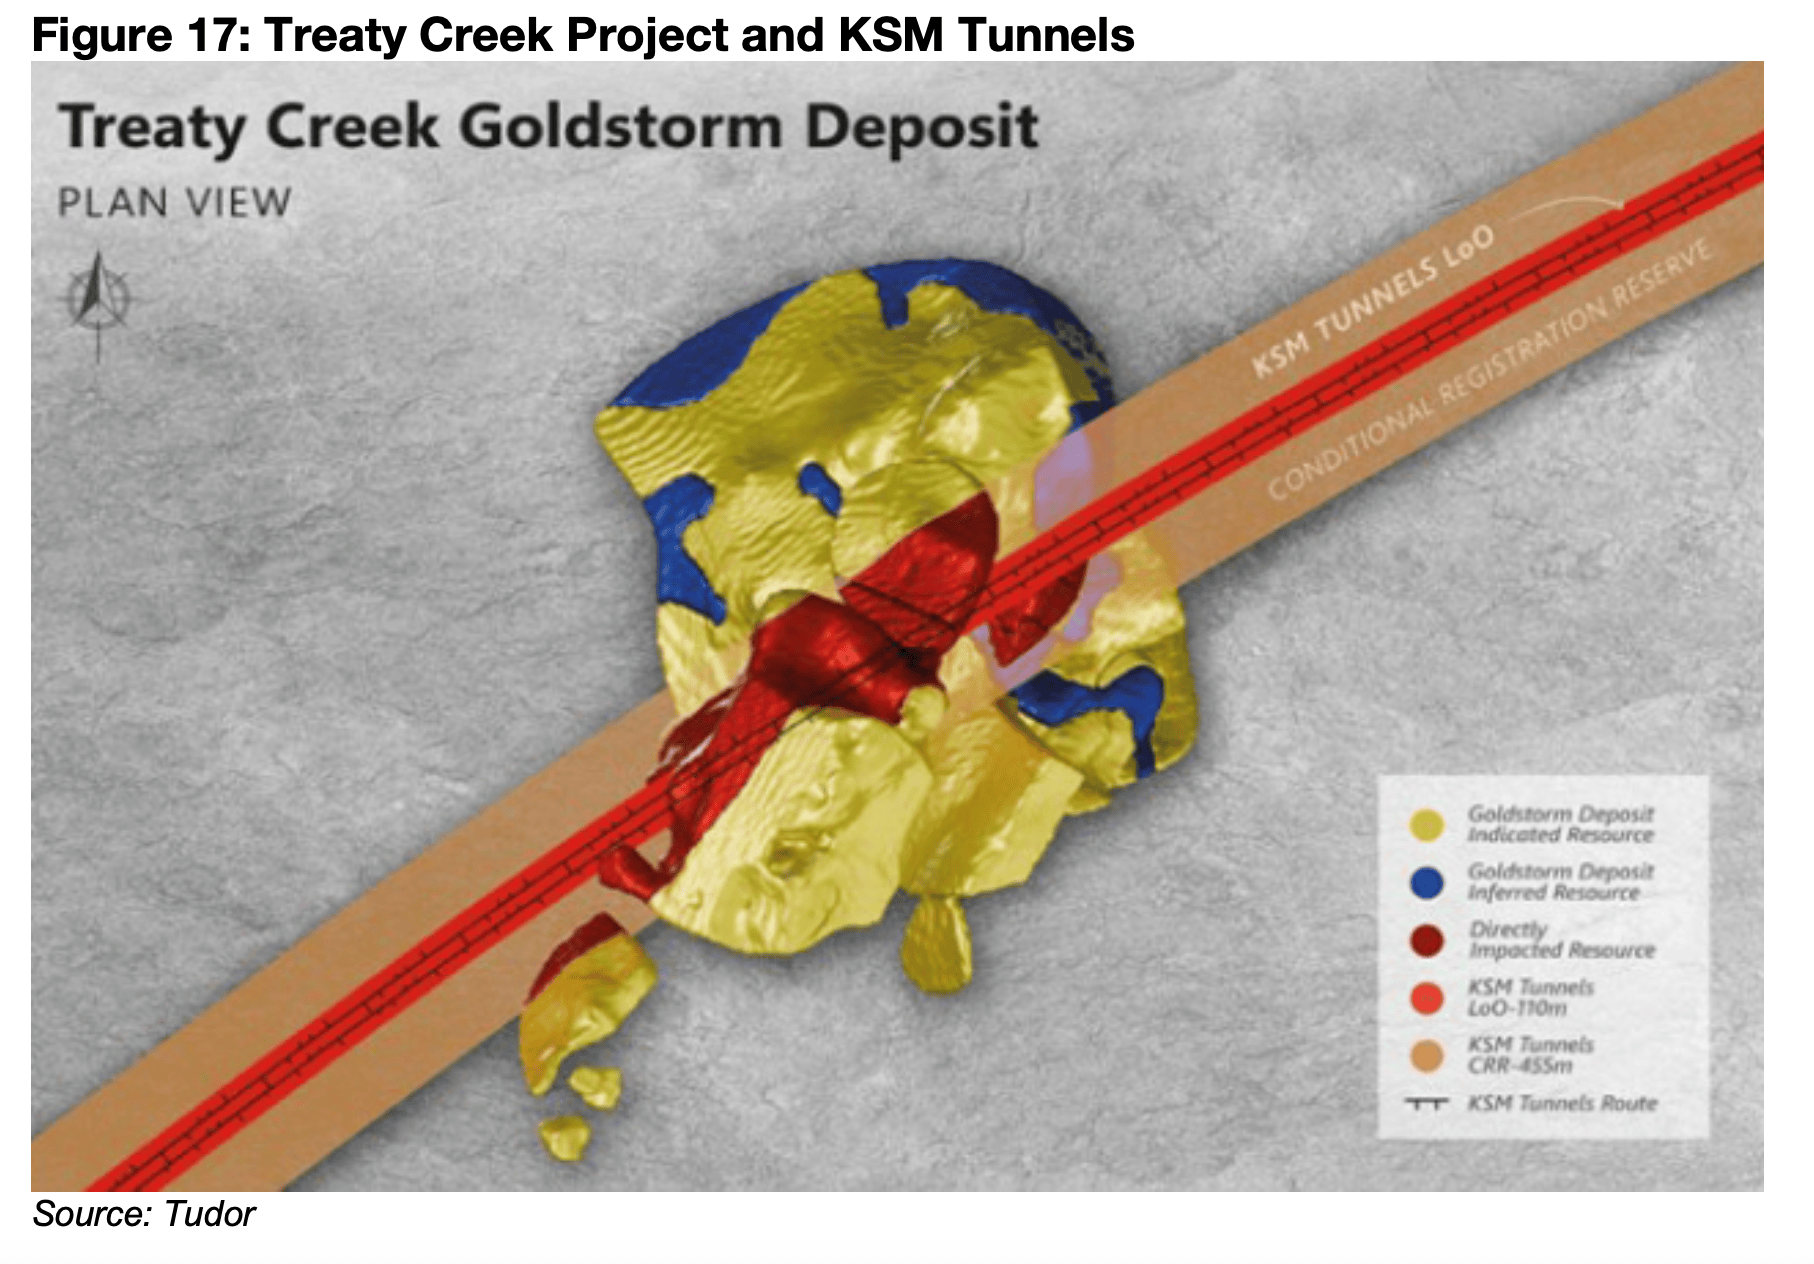
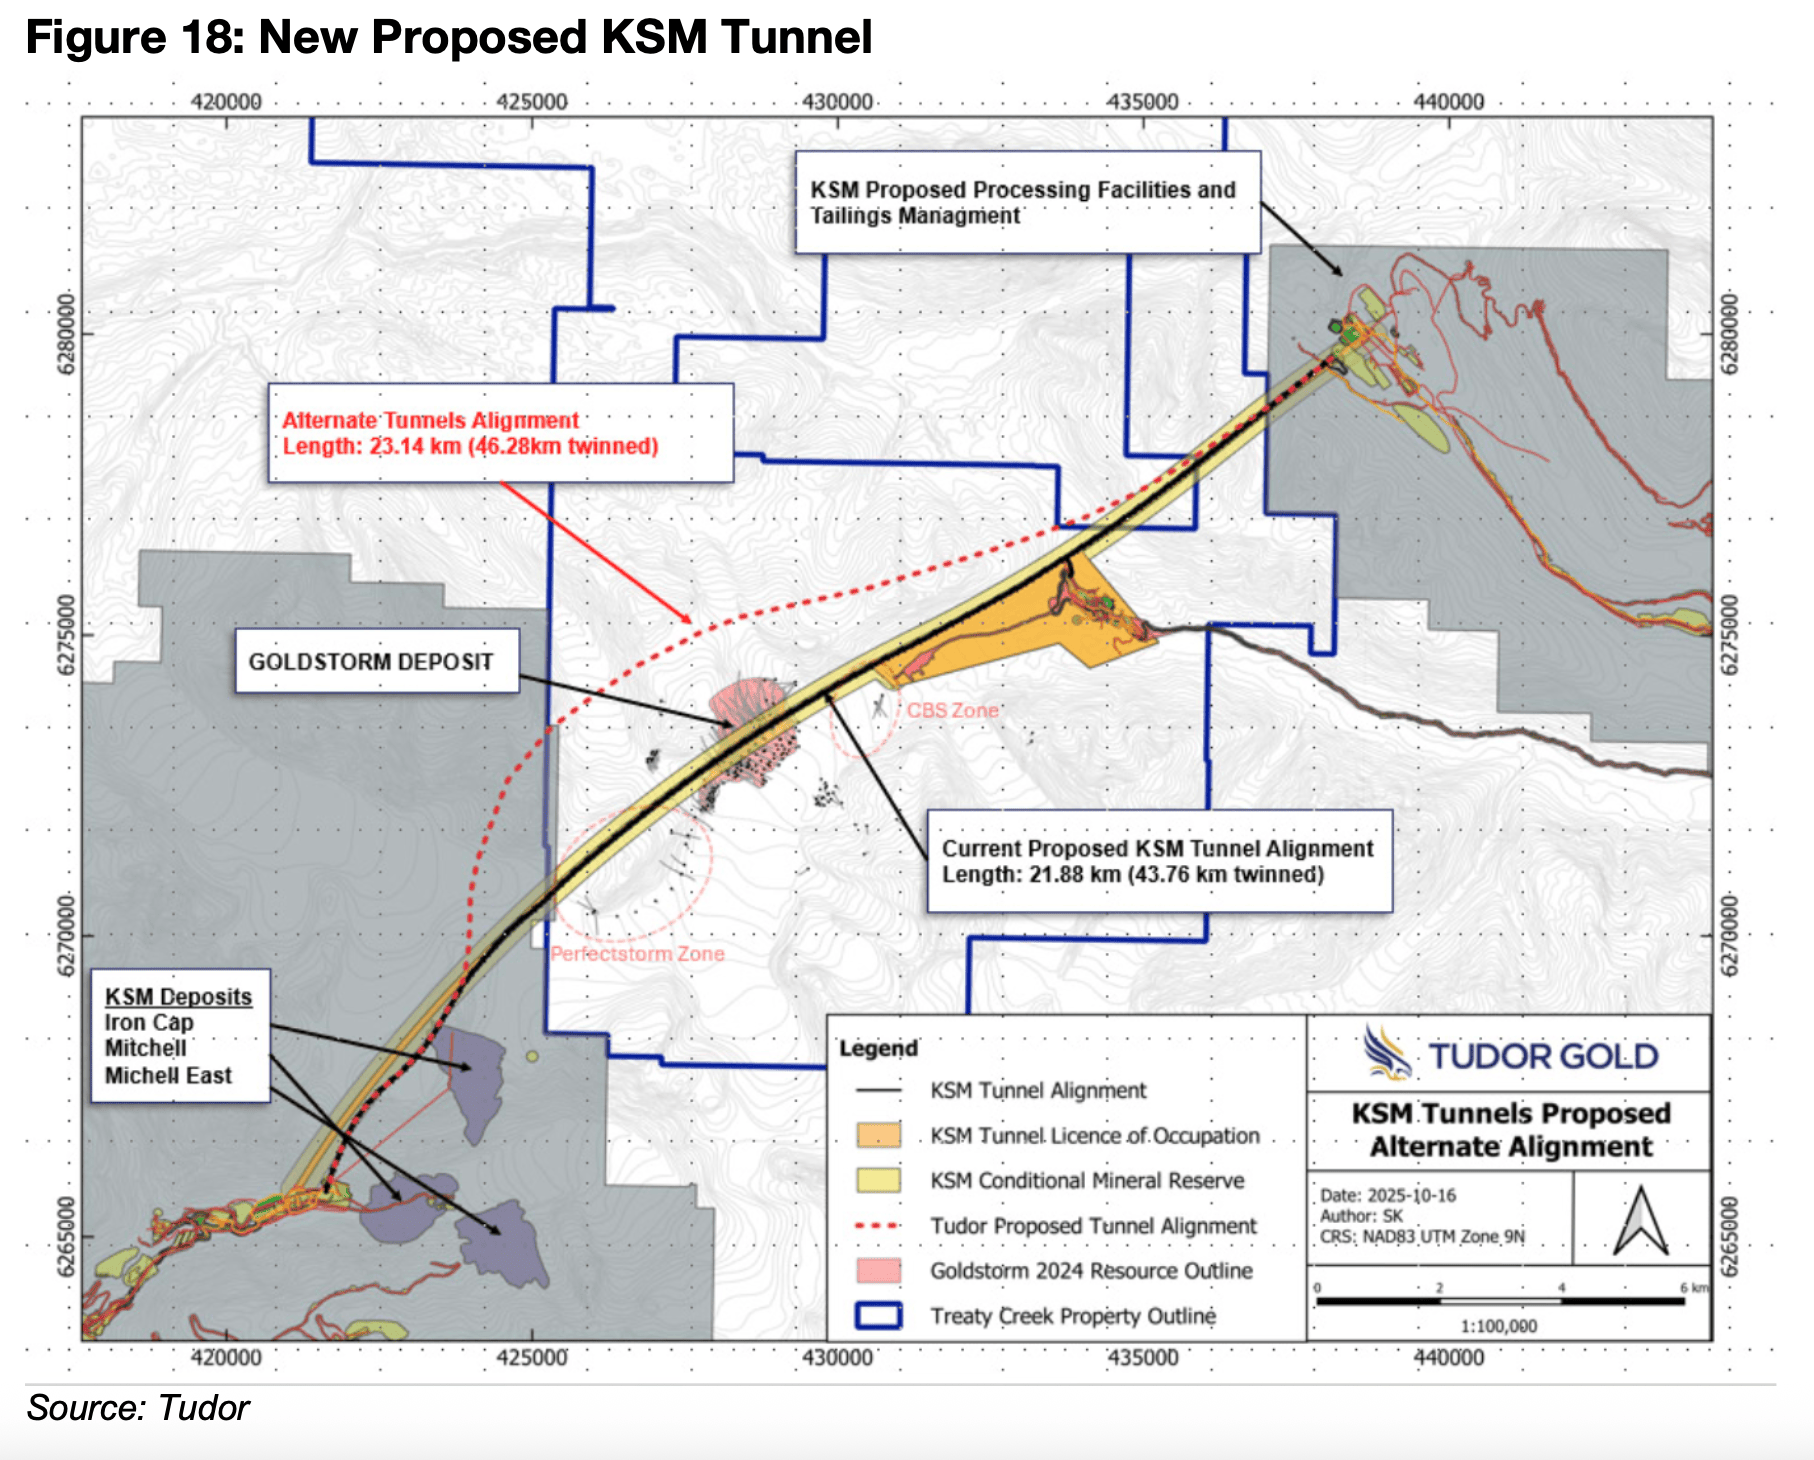
The reason for Tudor’s objection to Seabridge’s KSM tunnel is shown clearly by Figure 17, with it running almost directly through the middle of the Treaty Creek project in British Columbia (B.C.), with a direct effect on a large part of the Goldstorm Deposit’s Indicated Resource. The company has previously filed claims with the B.C. government objecting to Seabridge being granted the ability to develop these tunnels through its property. While the outcome from these claims are unclear as they are still in process, Tudor had additionally proposed a new path for the tunnels that does not pass through Goldstorm to Seabridge and the B.C. government in May 2025. The new route would be 23.14 km, or 46.28 km twinned, only moderately higher than the currently proposed tunnel of 21.88 km, or 43.76 km twinned (Figure 18). Seabridge’s most recent response to the issue was a press release from October 7, 2025.
Disclaimer: This report is for informational use only and should not be used an alternative to the financial and legal advice of a qualified professional in business planning and investment. We do not represent that forecasts in this report will lead to a specific outcome or result, and are not liable in the event of any business action taken in whole or in part as a result of the contents of this report.
Author
Ben McGregor authors the Weekly Roundup at CanadianMiningReport.com, providing sharp analysis of the metals and mining sector. With a talent for spotting trends, Ben distills complex market shifts into clear, engaging insights on TSXV junior miners. His weekly updates cover gold, copper, uranium, and more, blending data-driven perspectives with a knack for identifying opportunities. A vital resource for investors, Ben’s work navigates the dynamic junior mining landscape with precision.