
May 11, 2026
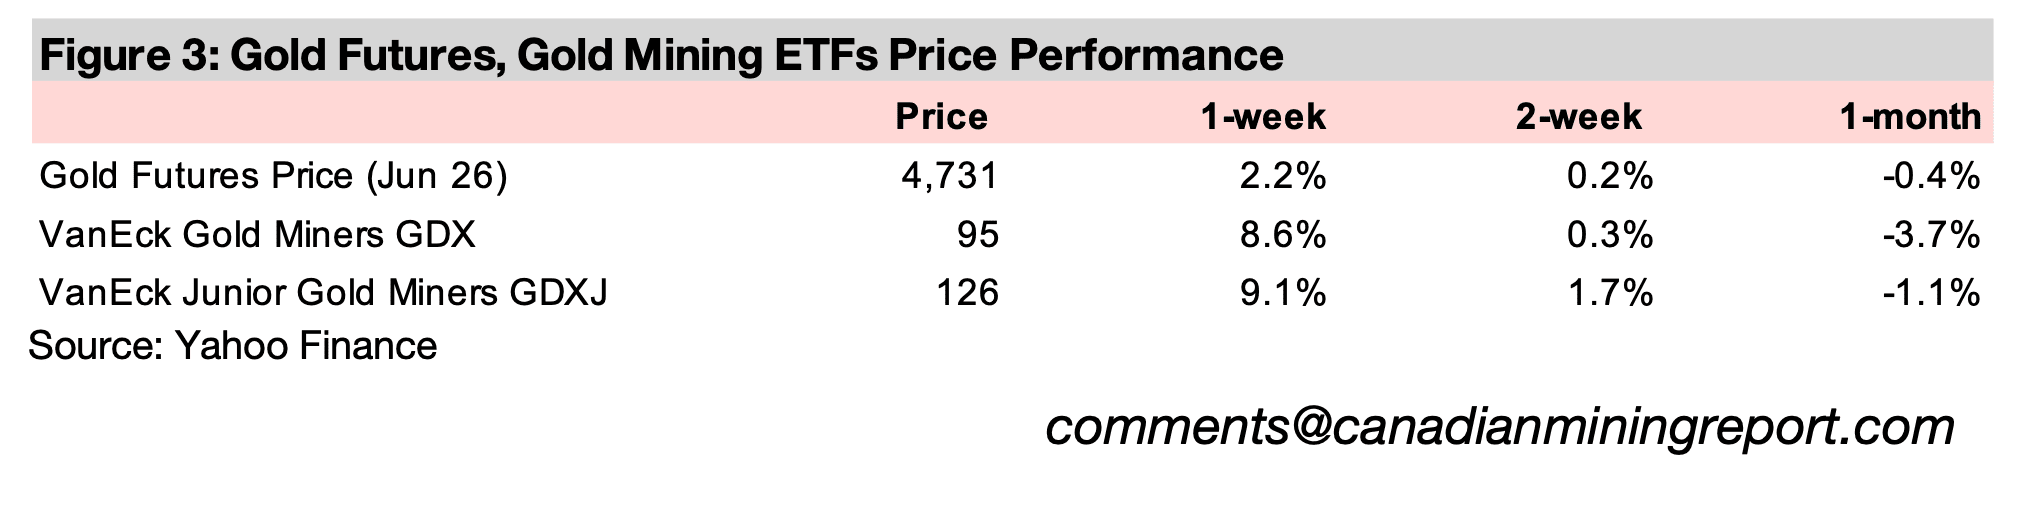
Gold rose 2.2% to US$4,731/oz, as the US$ and yields declined and US employment data remained relatively weak, and the market hedged a continued surge in global tech, even given extreme valuations, and high geopolitical and economic risk.
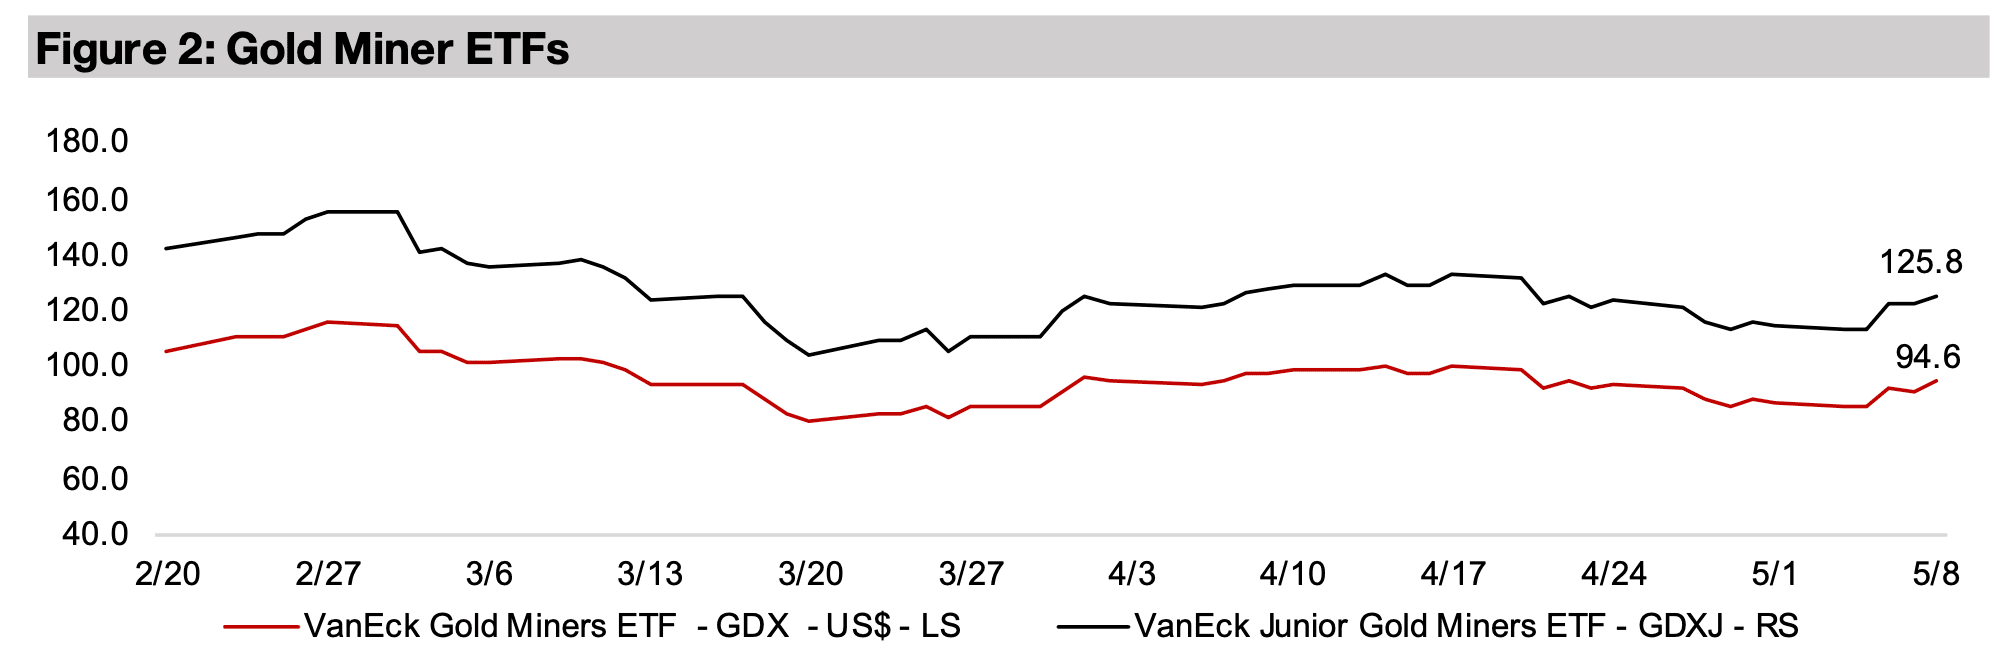
The gold stocks rose on the gain in the metal price, with the GDX up 8.6% and GDXJ increasing 9.1%, beating even the 4.5% surge in the Nasdaq and significantly ahead of the 2.4% rise in the S&P 500 and 1.8% gain in the Russell 2000 Index.


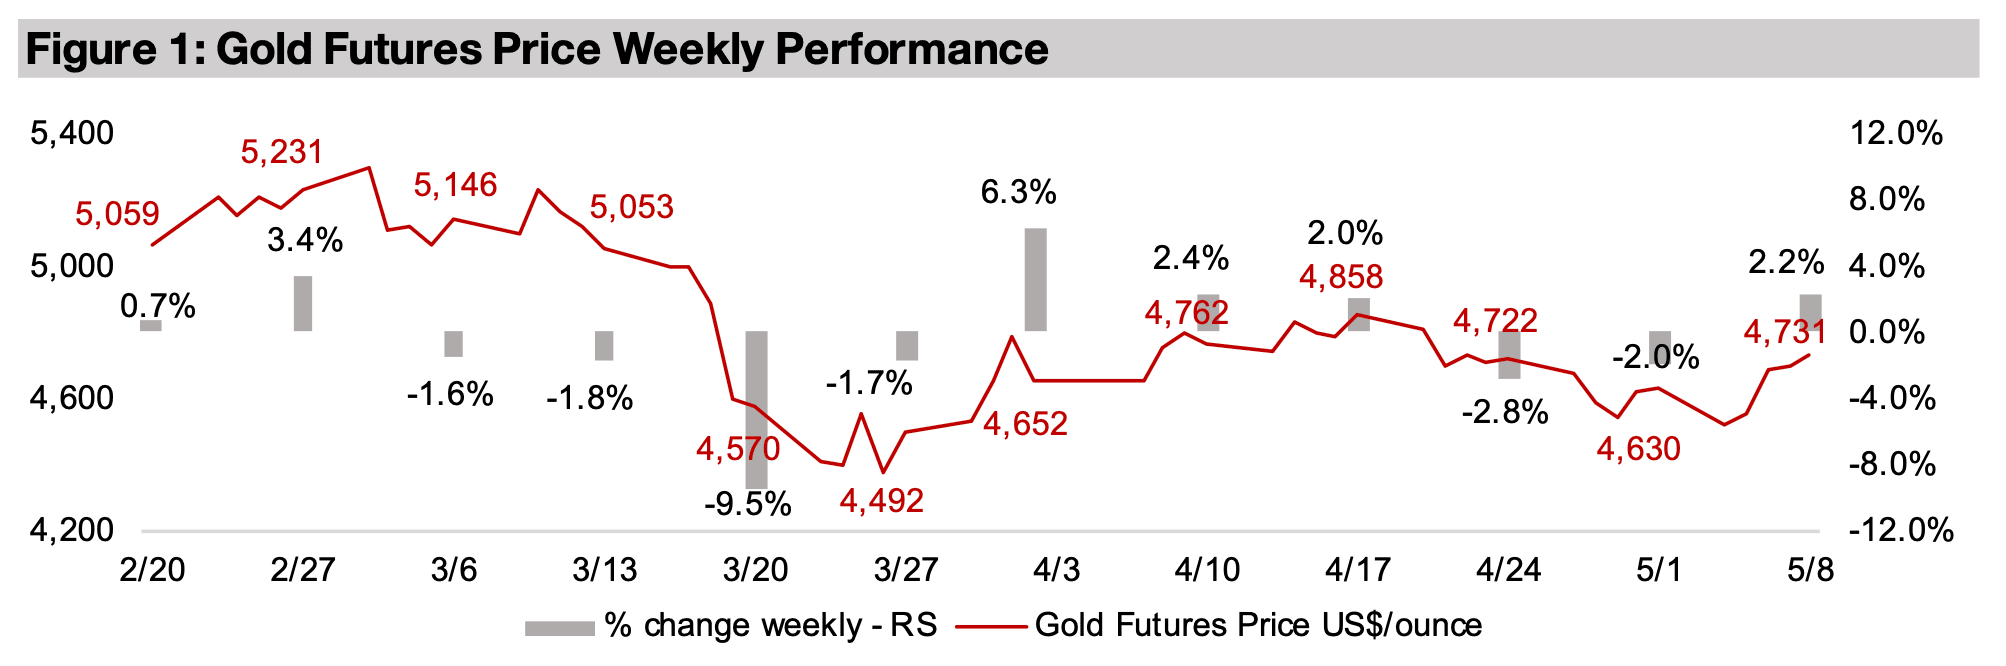
The gold price rose 2.2% to US$4,731/oz as the US$ and yields declined, which both
tend to move inversely to the metal. This was driven partly by US jobs data, which
while beating expectations, continued to show a weakening of the overall
unemployment situation in the country in recent months. While the markets seemed
to see this as giving the Fed some support for rate cuts this year, and a major risk-on
move into equities continued, there was still some hedging with gold, as the degree
of any cuts could still be heavily offset by potential inflation pressures from high oil.
The tech sector led the equity gains, with Nasdaq surging 4.5%, significantly
outperforming the already strong 2.4% gain in the S&P 500 and 1.8% rise in the
Russell 2000 small cap index. However, the gold stocks outperformed the rise in the
broader markets, with the GDX up 8.6% and GDXJ gaining 9.1%. Copper was also
strong for the week, with the tech surge implying strong demand for the metal, which
rose 7.6%, while iron ore gained 2.6% and aluminum increased just 0.3% after a
substantial outperformance over the past three months.
Global tech is now up 25.6% for the year, and has now even edged ahead of the 23.9% gain in the energy sector, even though the former trades at extreme multiples and the valuations for the latter sector are still quite subdued (Figure 4). While there are increasing concerns that tech could be in a severe bubble, with the sustainability of the AI sector requiring huge continued capex and the potential for profitability still very opaque, the markets continue to ignore these risks. The gold stocks have still performed reasonably well so far this year, up 10.3%, but they still have lagged tech, along with other defensive sectors, with consumer staples up 6.2% and healthcare down -6.3%.
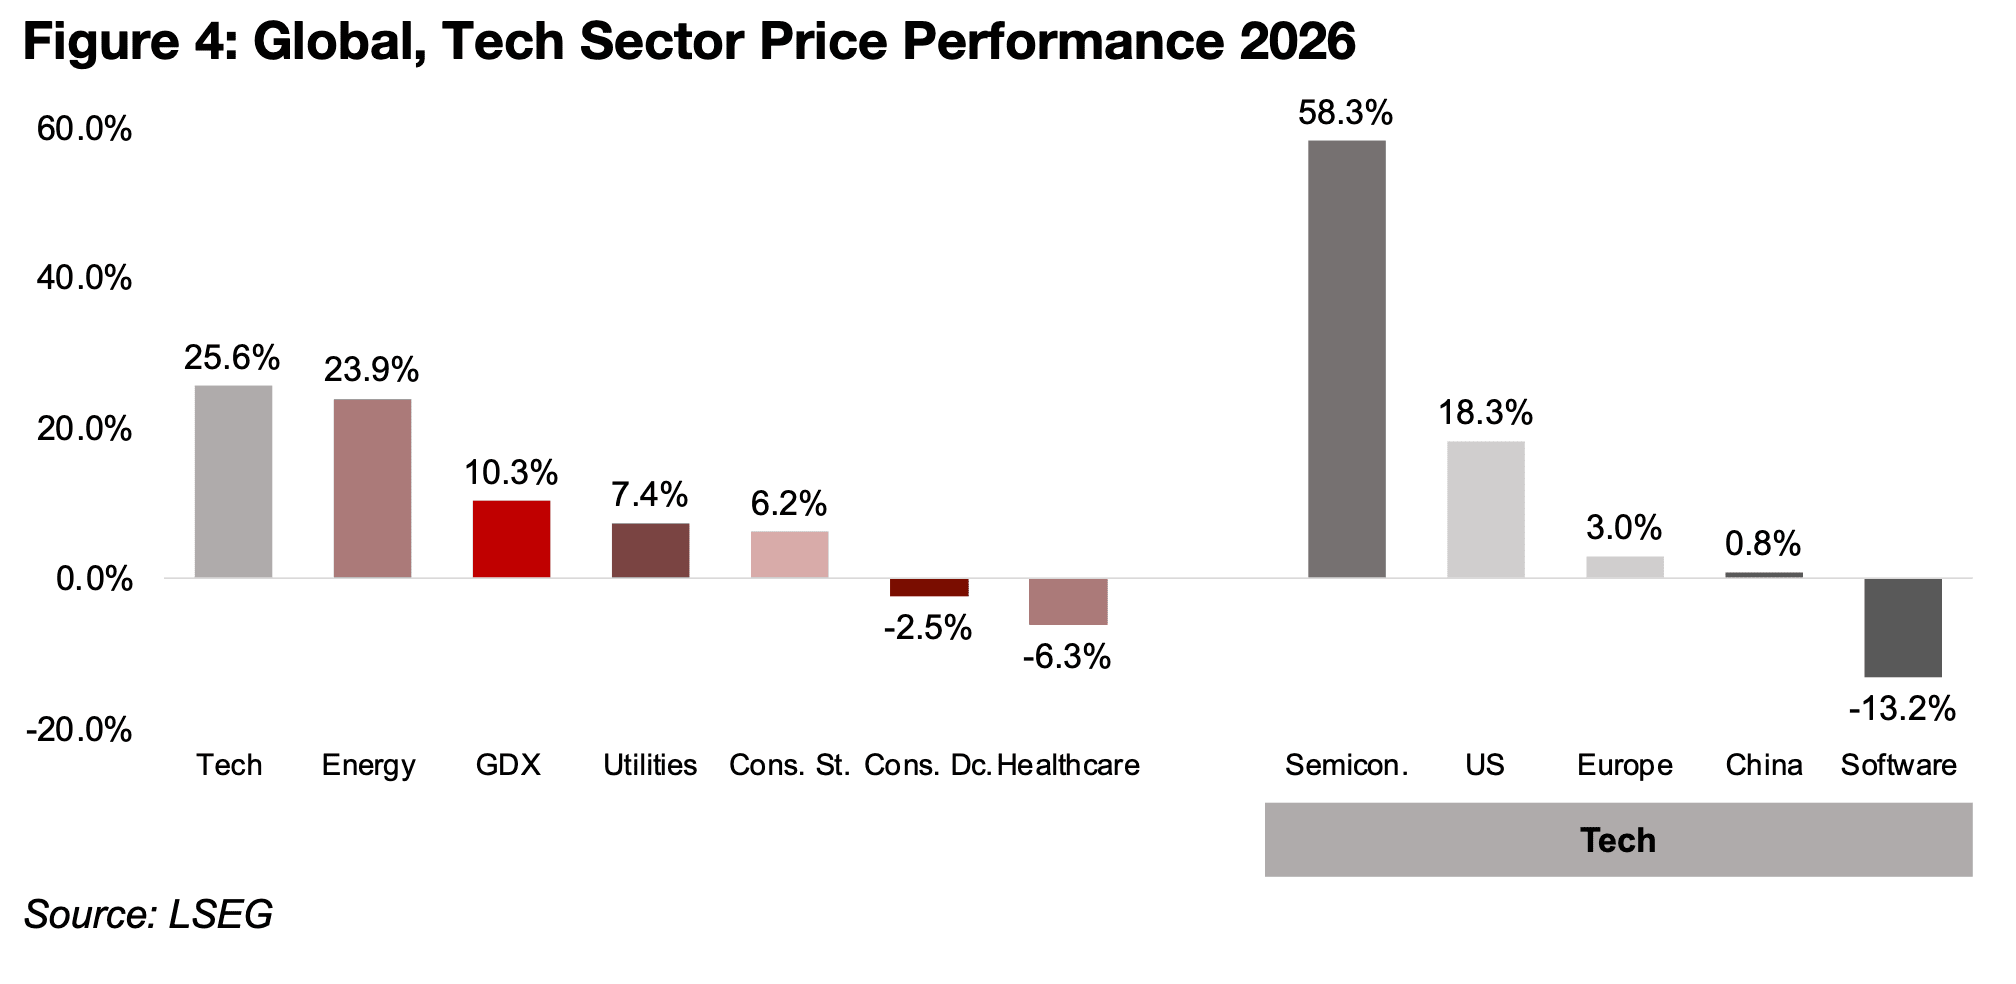
While utilities, up 7.4%, would generally also be considered defensive, it has actually
become somewhat of a growth sector on the demand for electricity from tech. The
decline in the consumer discretionary sector by -2.5% could be considered a warning
signal for the economy, indicating some pressure on broader buying power.
In another significant shift versus recent years, the gains for global tech have not been
only driven by the US tech, which is up 18.3% for 2026, below the rise for the global
tech sector. This is because the surge this year has been mainly from semiconductors,
especially companies based in Taiwan, with the sector up 58.3%, while the software
sector has declined -13.2%. Tech in other regions has also been weak this year, with
Europe up just 3.0% and China only 0.8%.
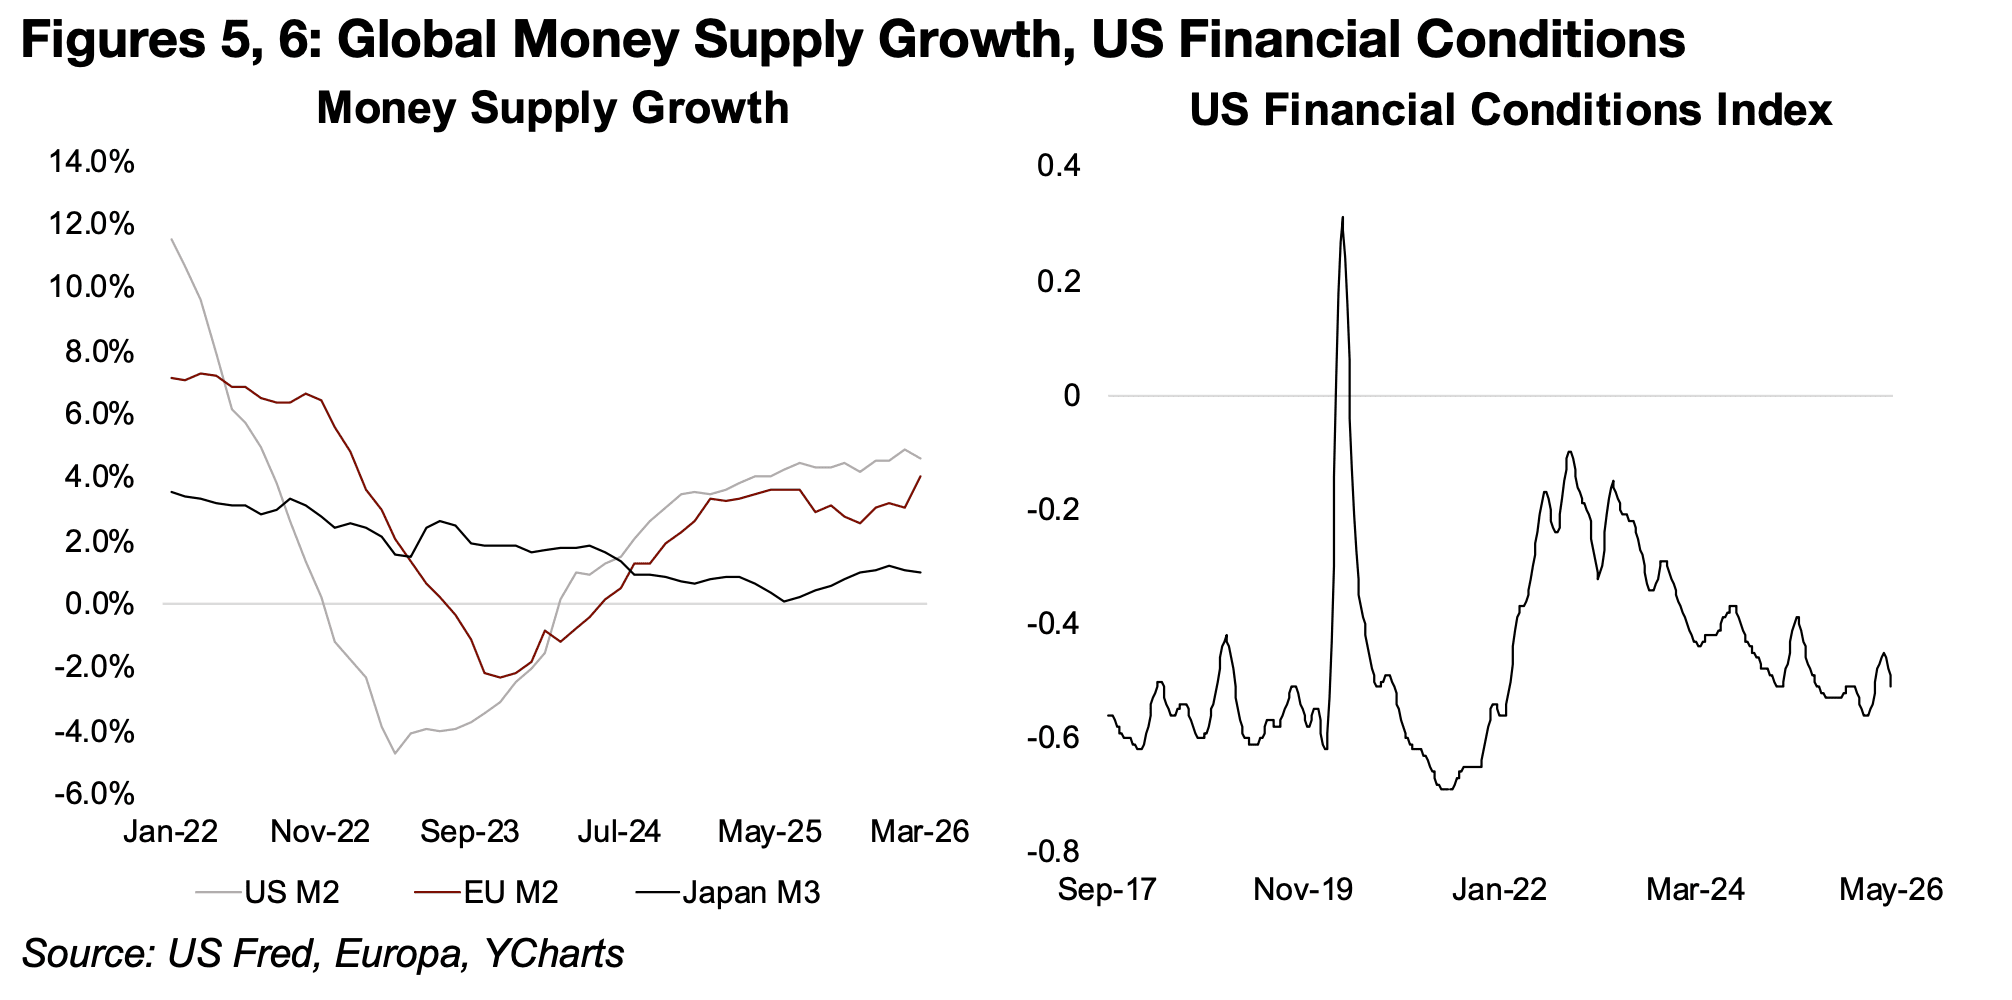
The market boom has likely been largely driven by a continued rise in global liquidity,
with the money supply for the US and EU rising this year, and only dipping for Japan
(Figure 5). The US Financial Conditions index also shows liquidity continuing a trend
of improvement over the past several years, with measures above zero showing
tightening and below zero indicating easing (Figure 6).
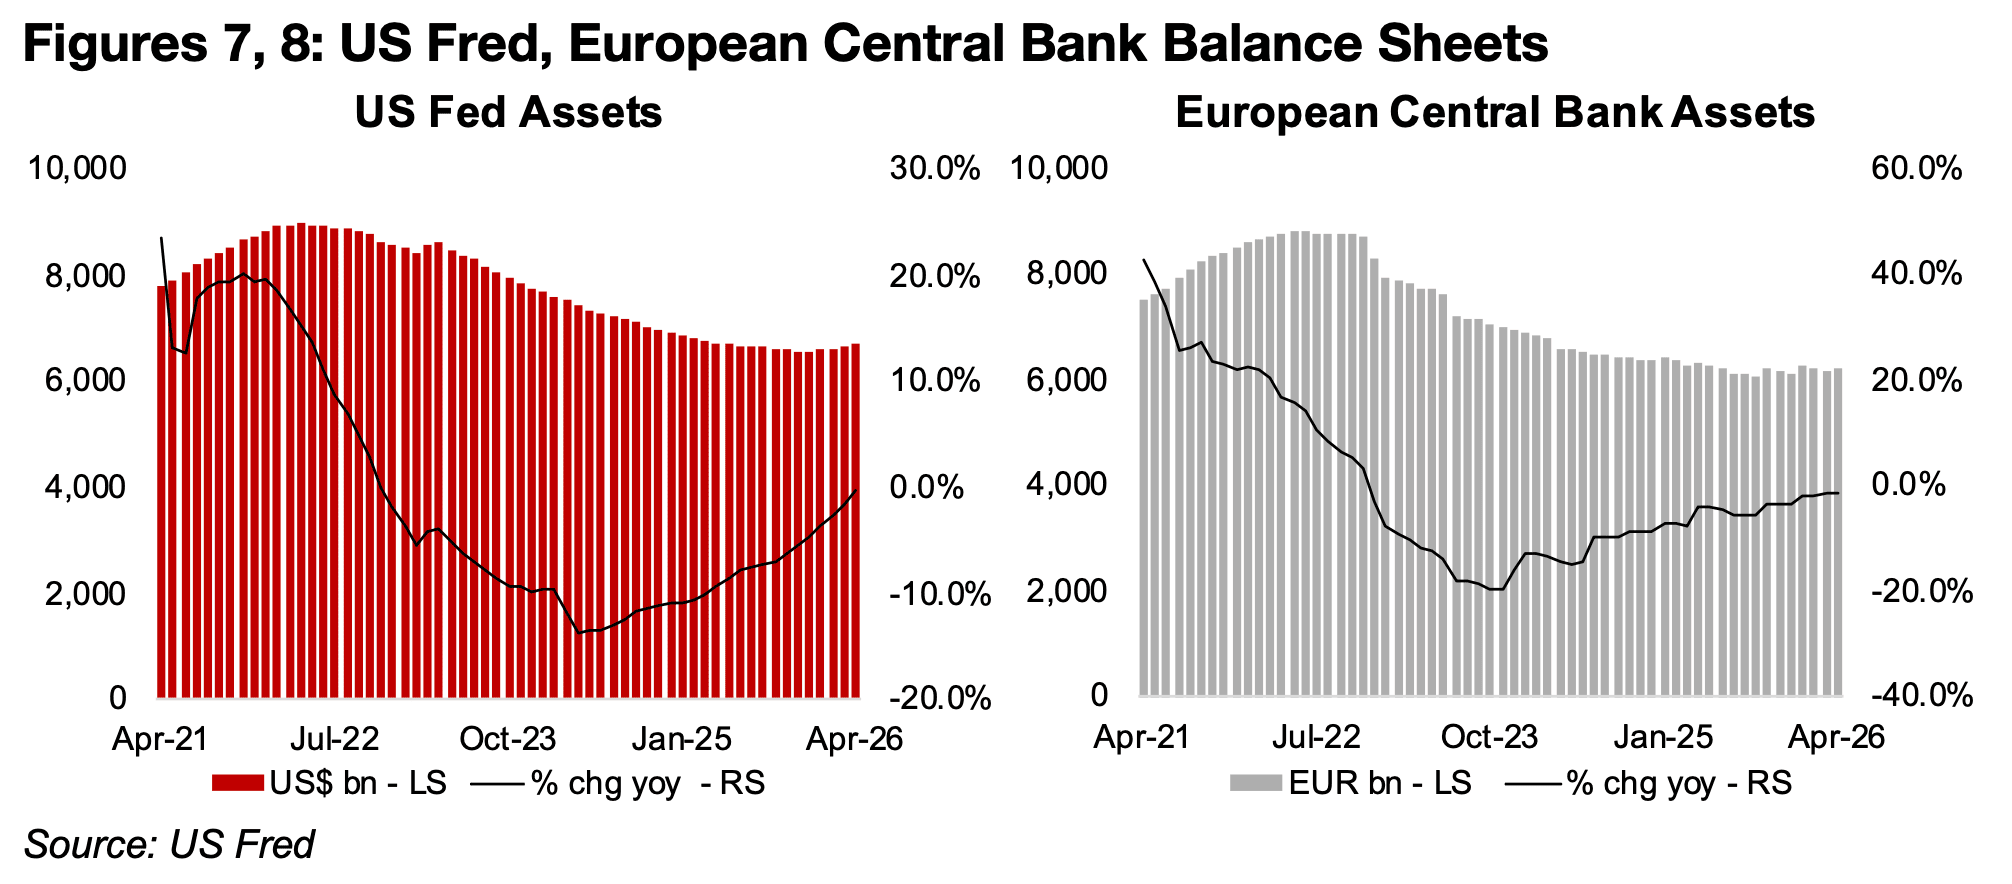
This in turn has been driven by major central banks, with the US Fed’s balance sheet
nearly flat yoy in recent months, after a contraction for several years, and the
European Central Bank asset growth also nearing zero after an extended decline
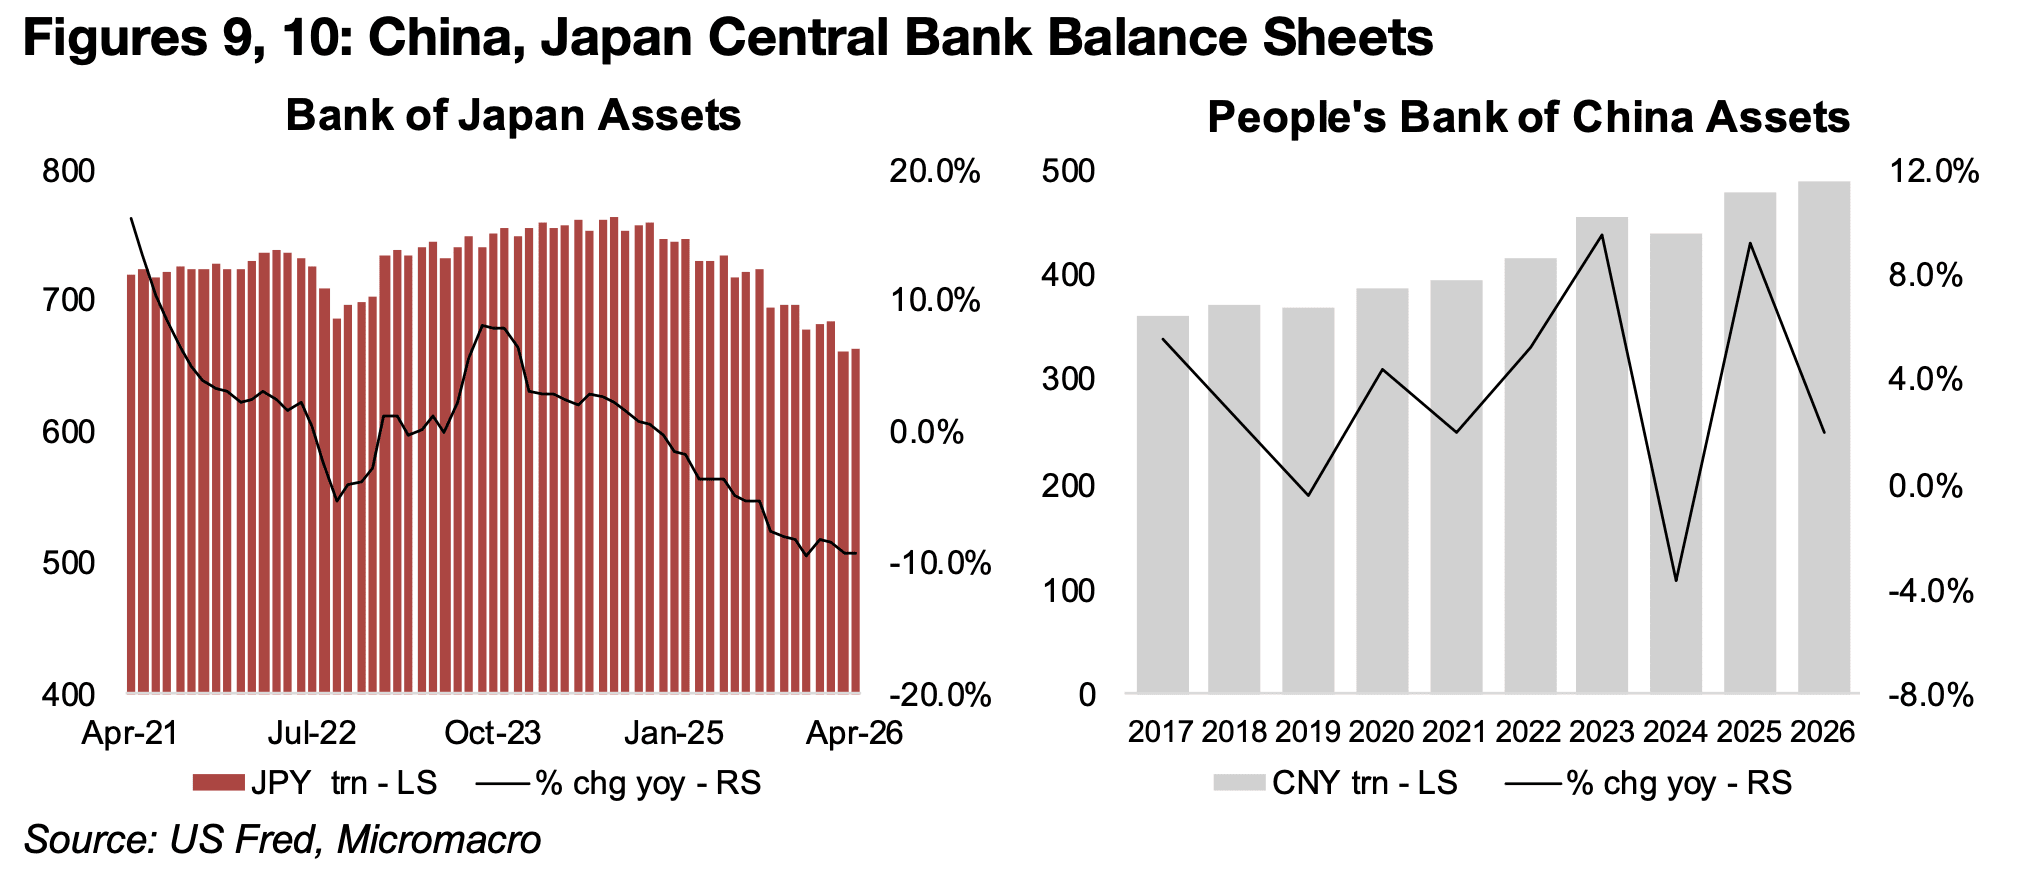
(Figures 7, 8). Only the Bank of Japan Bank has seen its assets substantially reduced,
and China has been significantly expanding its central bank’s balance sheet over the
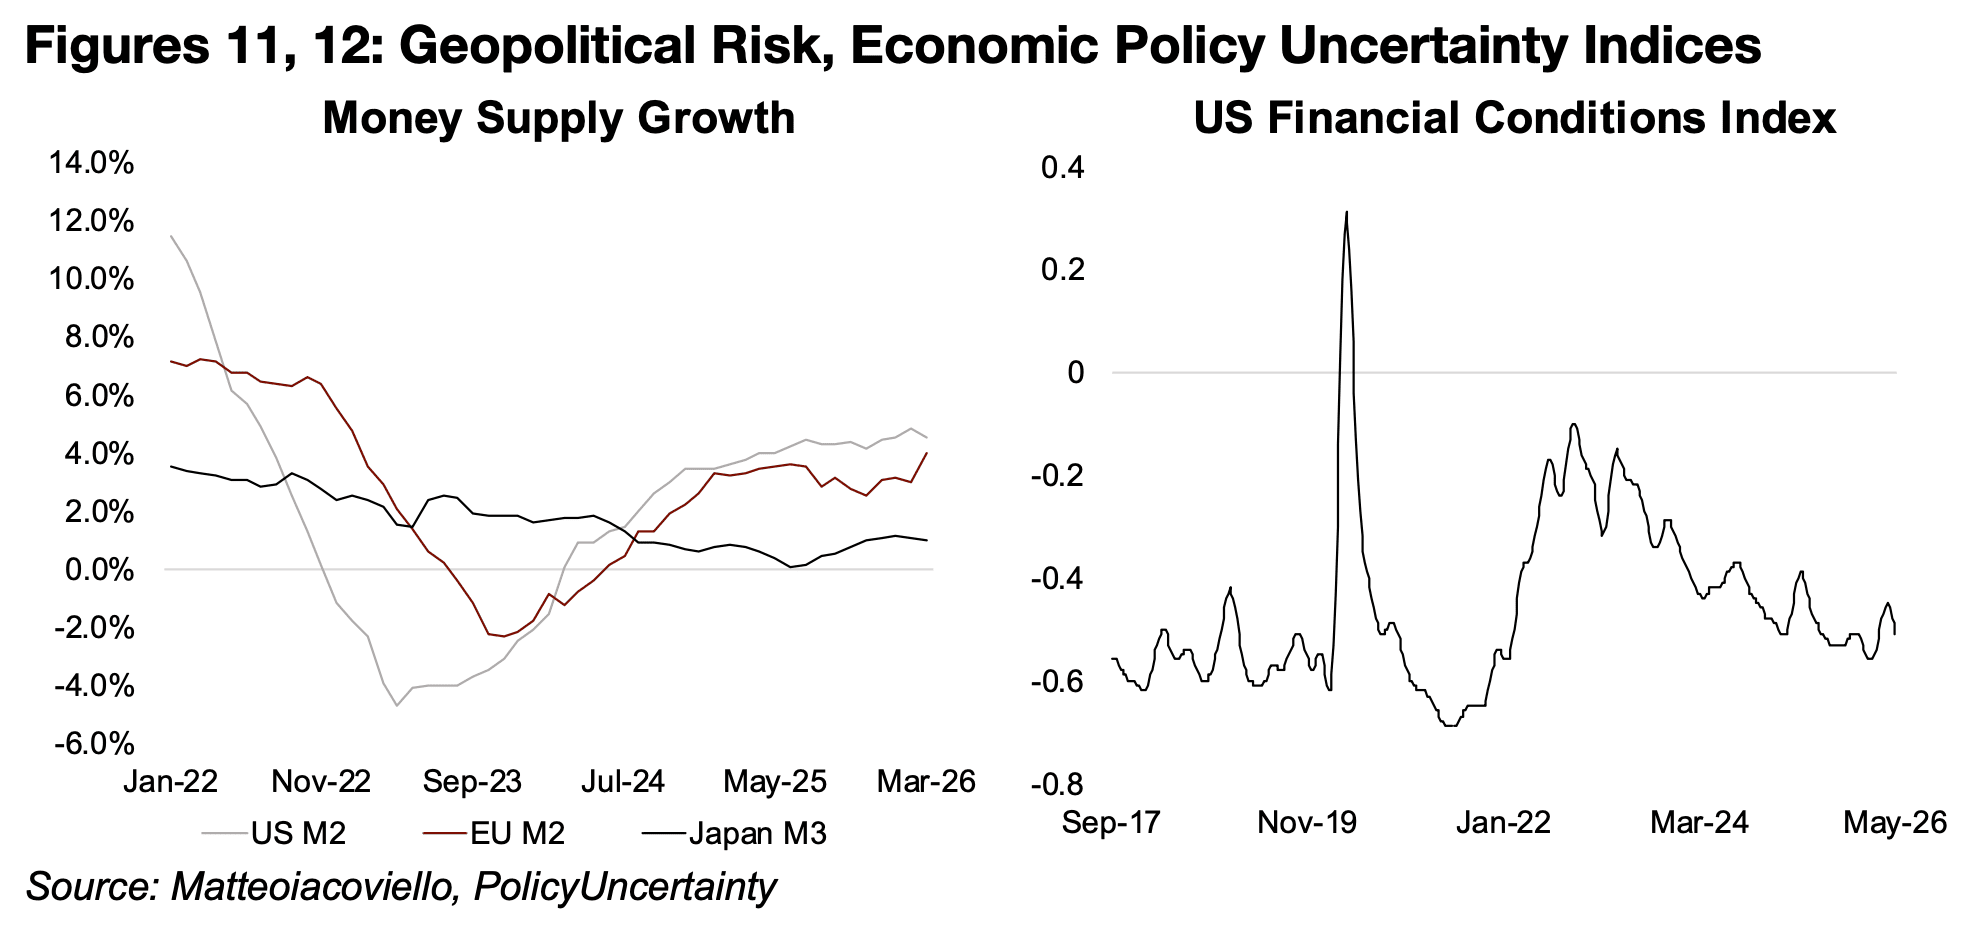
past two years. This increased liquidity, combined with extreme global risk, with the
geopolitical and world trade uncertainty risks having spiked far above the average of
recent years, have also been key supports for gold prices (Figures 9, 10).
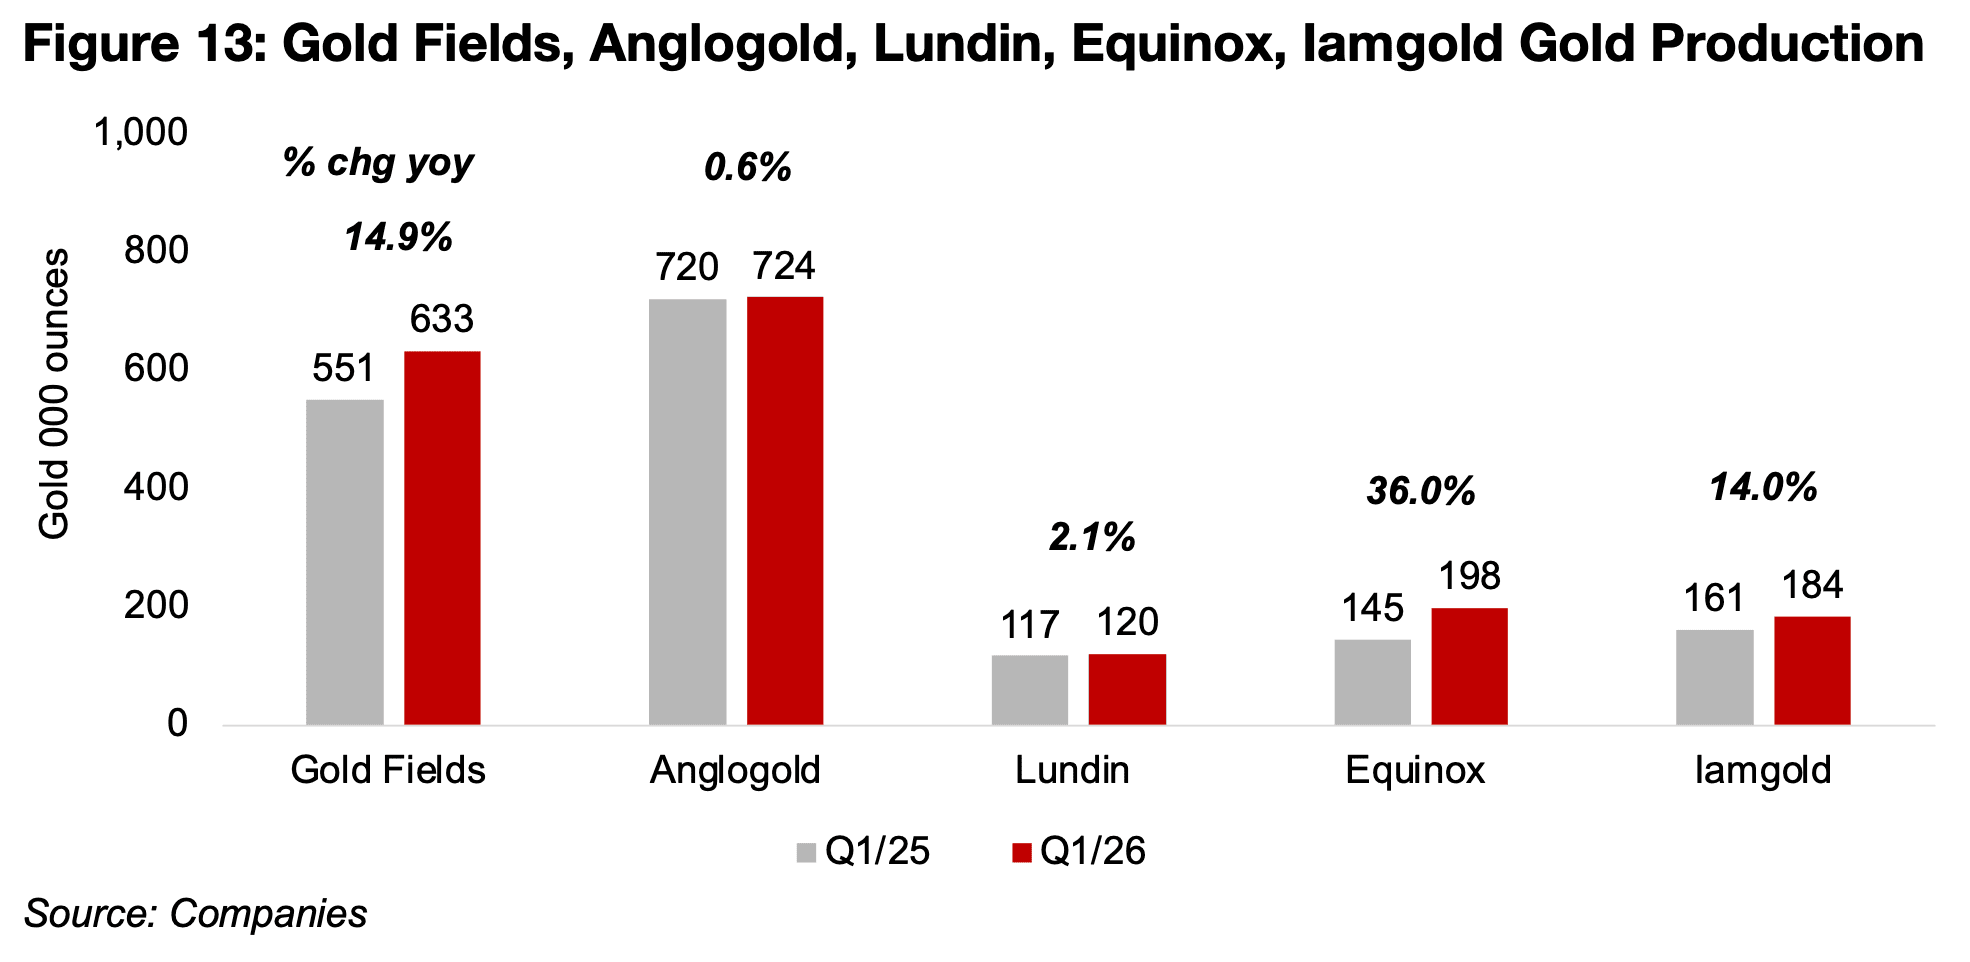
The Q1/26 results of the big gold companies continued, with Gold Fields, Anglogold, Lundin, Equinox and Iamgold reporting, although Gold Fields only releases production quarterly, and report full-year results for the half. The only gold major still left to report is Barrick, which will have a release over the next week. While gold production growth for several companies that already reported over the past two weeks, including Newmont, Agnico, Kinross and Alamos declined, the group reporting this week all saw increases in output. Gold Fields’ gold production rose 14.9% yoy, Anglogold was near flat, with a 0.6% increase, Lundin was up 2.1%, Equinox saw the strongest gain of 36.0% and Iamgold rose 14.0% (Figure 13).
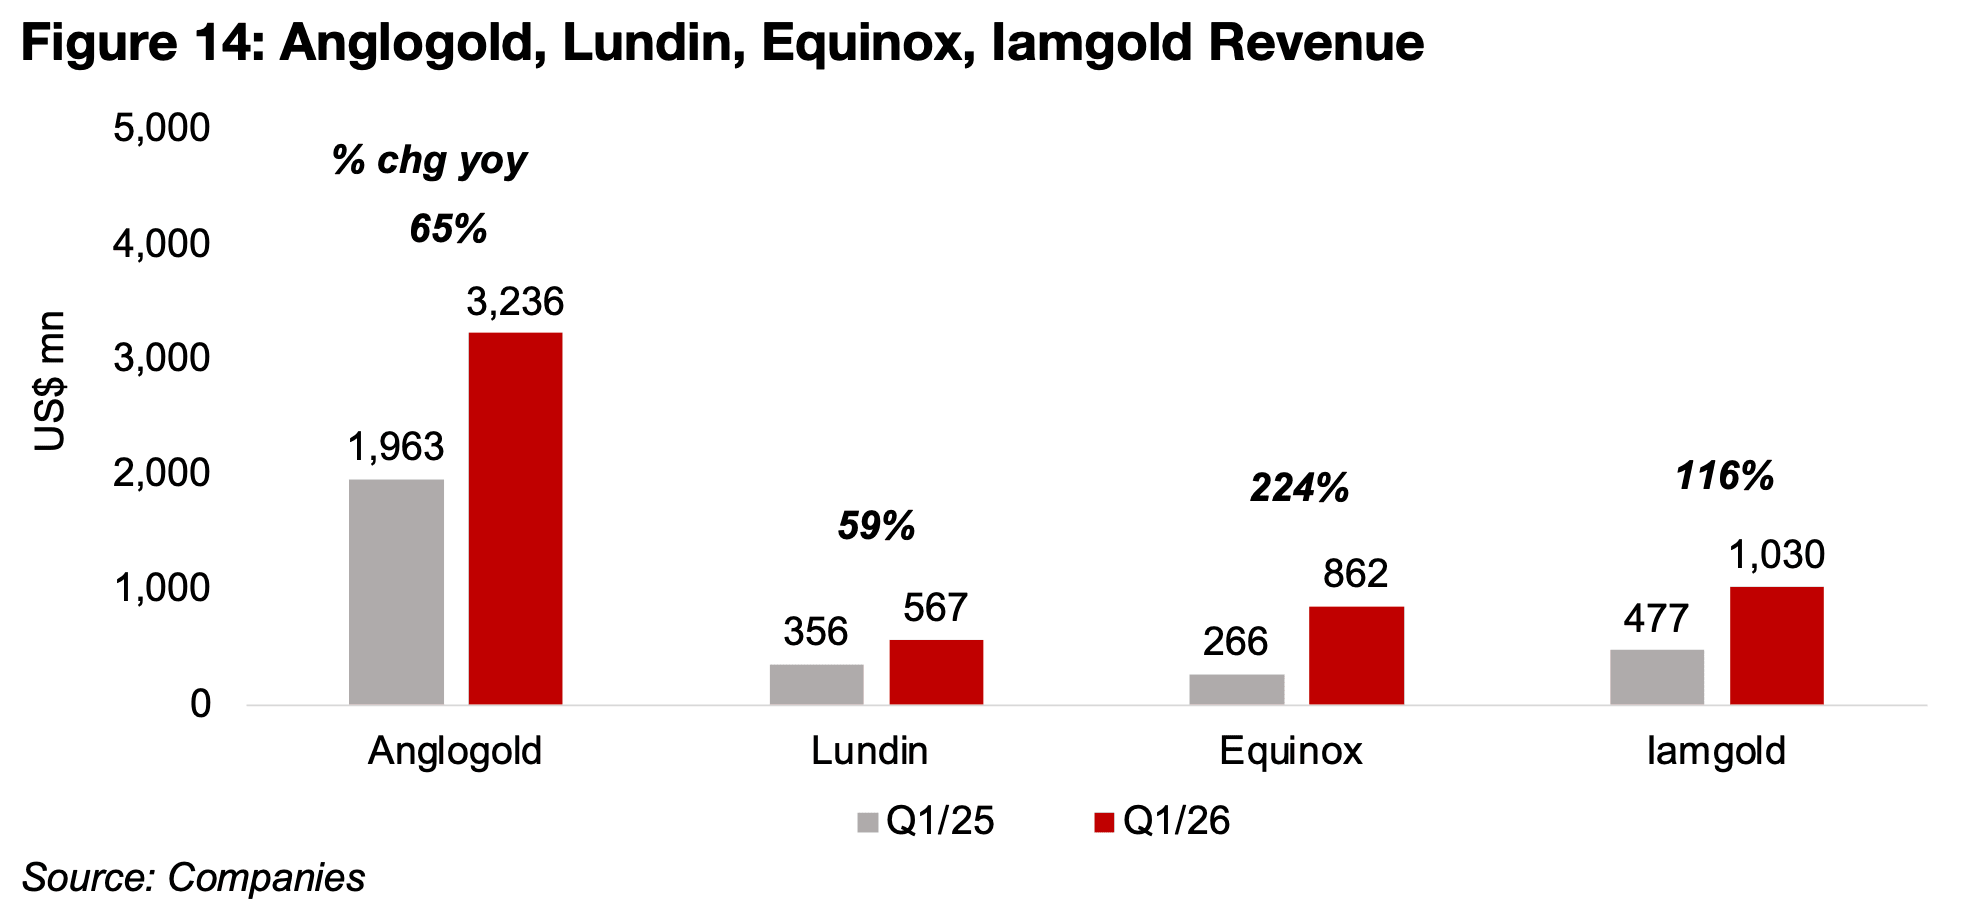
Combined with the jump in the gold price, this drove strong revenue growth for the
group, with Anglogold rising 65% yoy, Lundin 59%, Equinox, 224% and Iamgold 116%
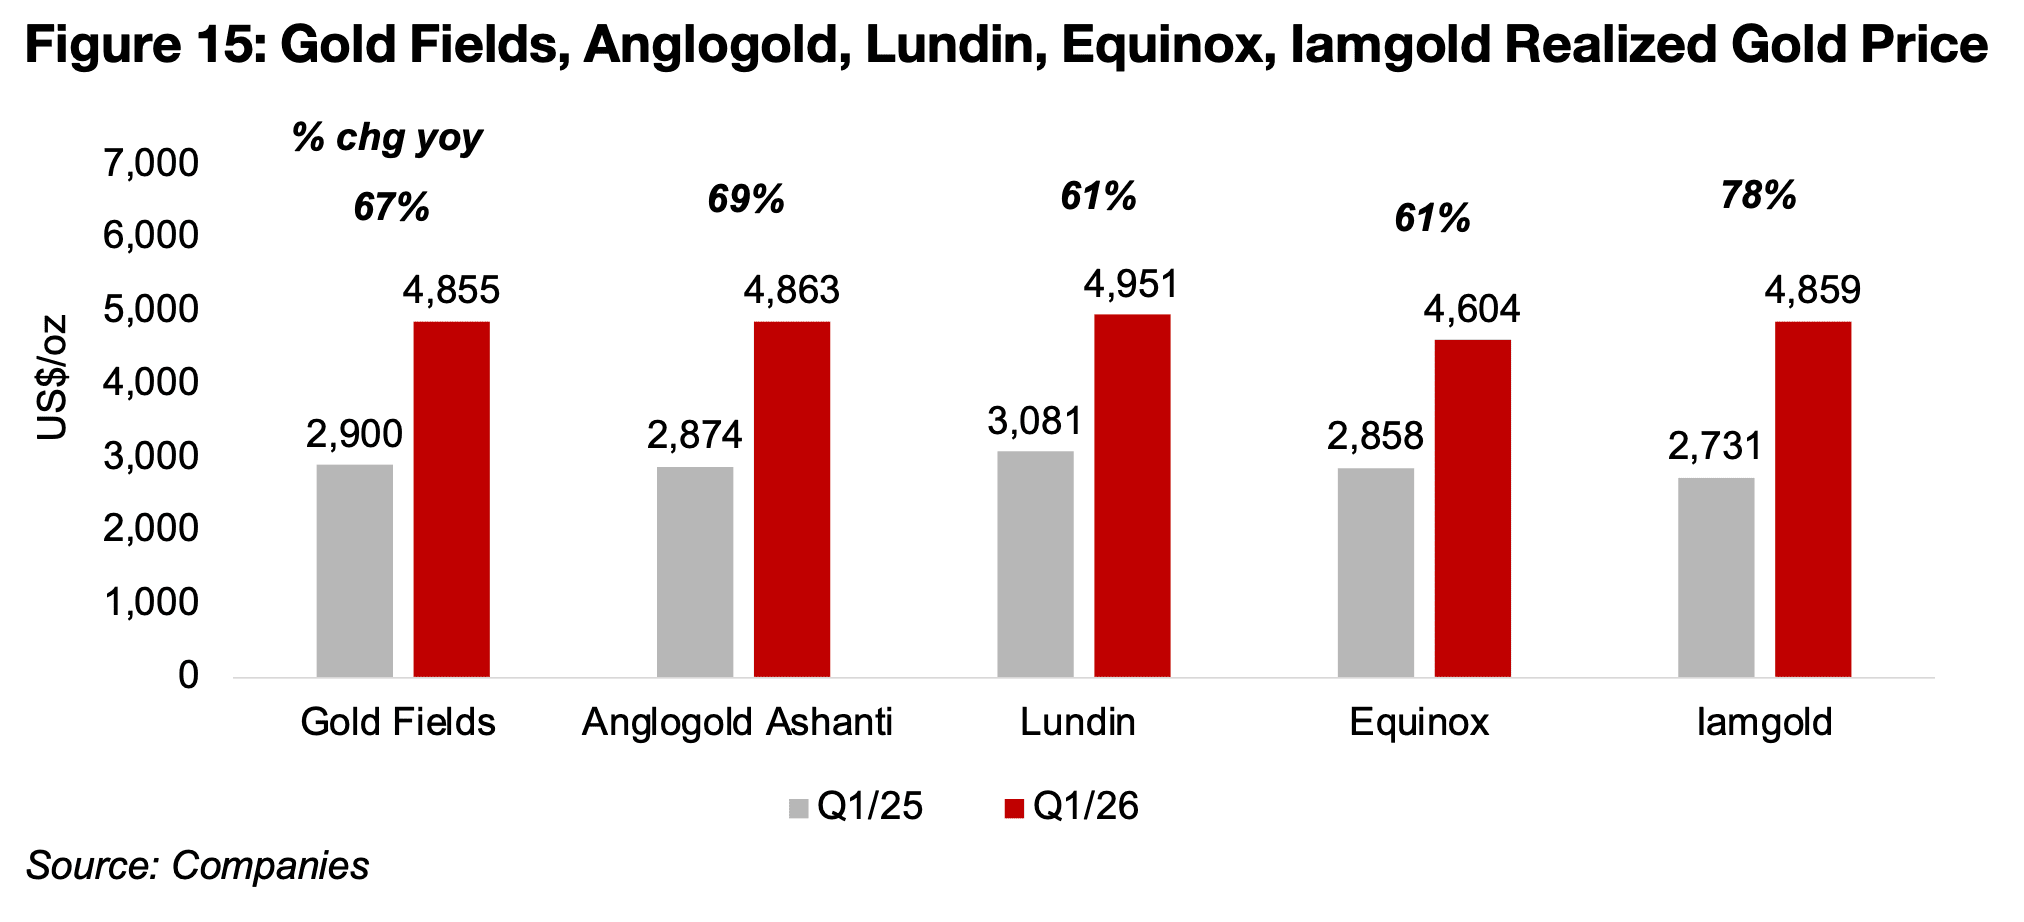
(Figure 14). The realized gold price jumped to US$4,604/oz-US$4,951/oz in Q1/26
from a range of US$2,858/oz-US$3,081/oz in Q1/25, or an average increase over
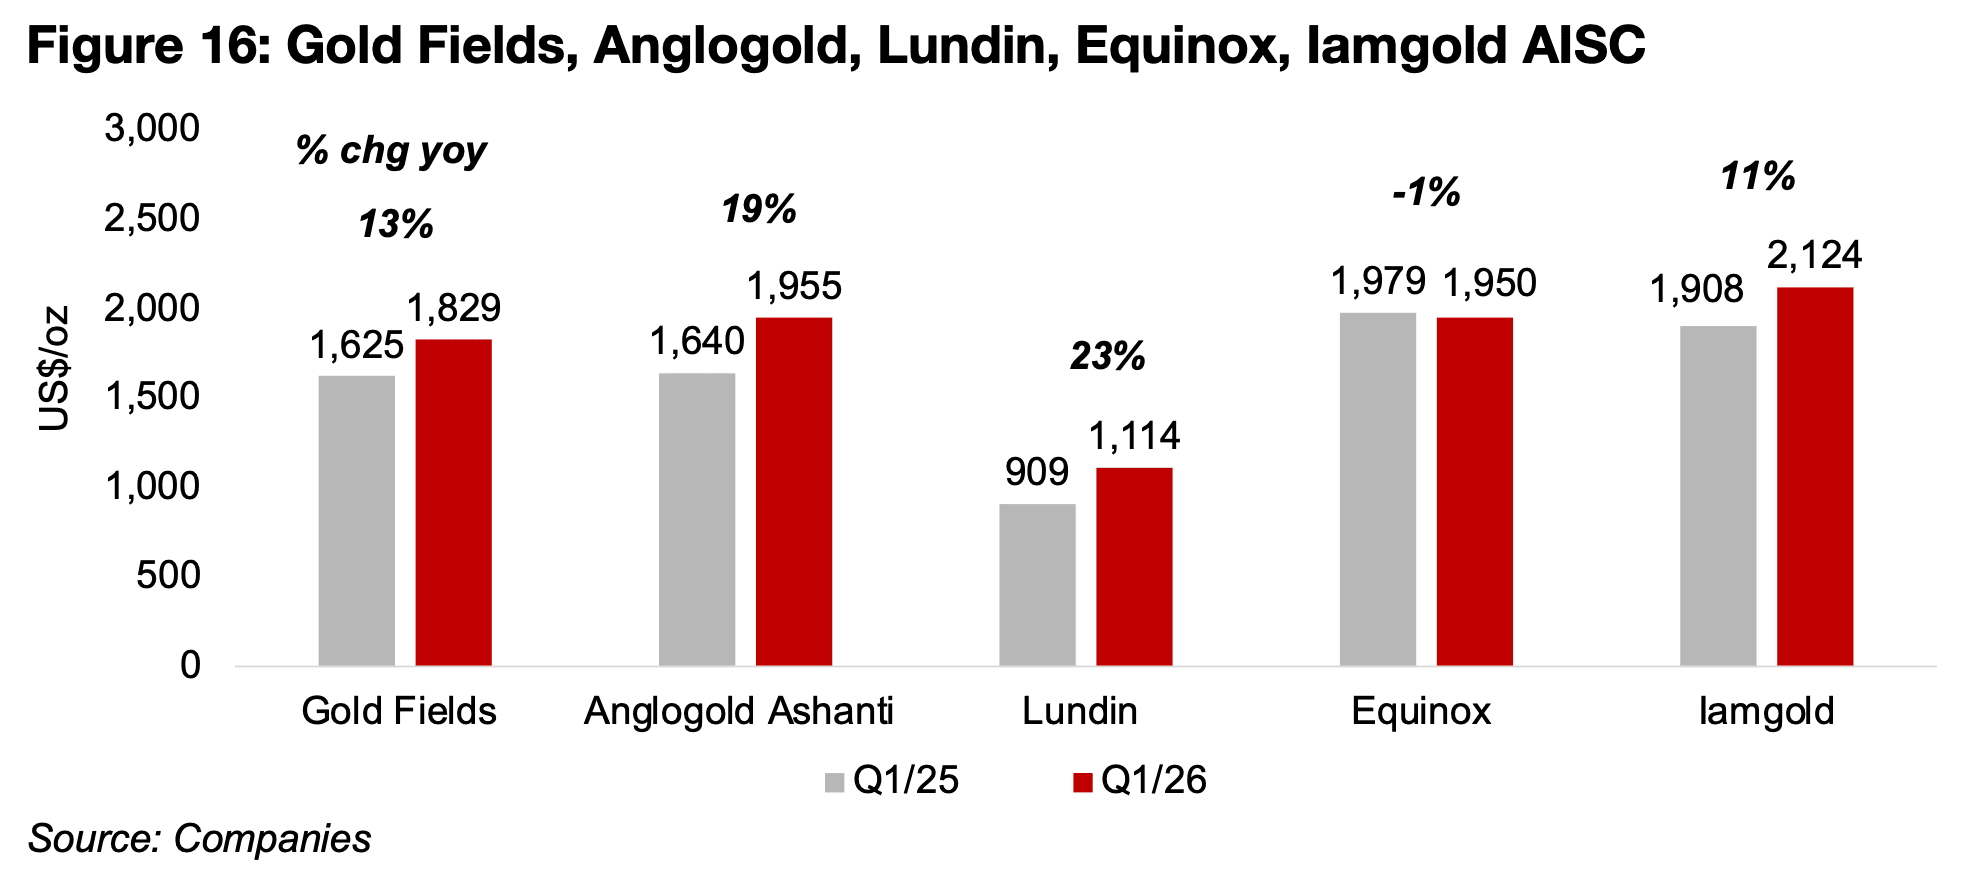
US$1,900/oz (Figure 15). There was substantial cost inflation overall for the group, as
Q1/25 had a month of higher oil costs, with Q2/25 to be the first full quarter with much
higher energy costs. The AISC for Gold Fields rose 13%, for Anglogold, 19%, Lundin,
23% and Iamgold 11%, and only Equinox saw costs decline, by -1% (Figure 16).
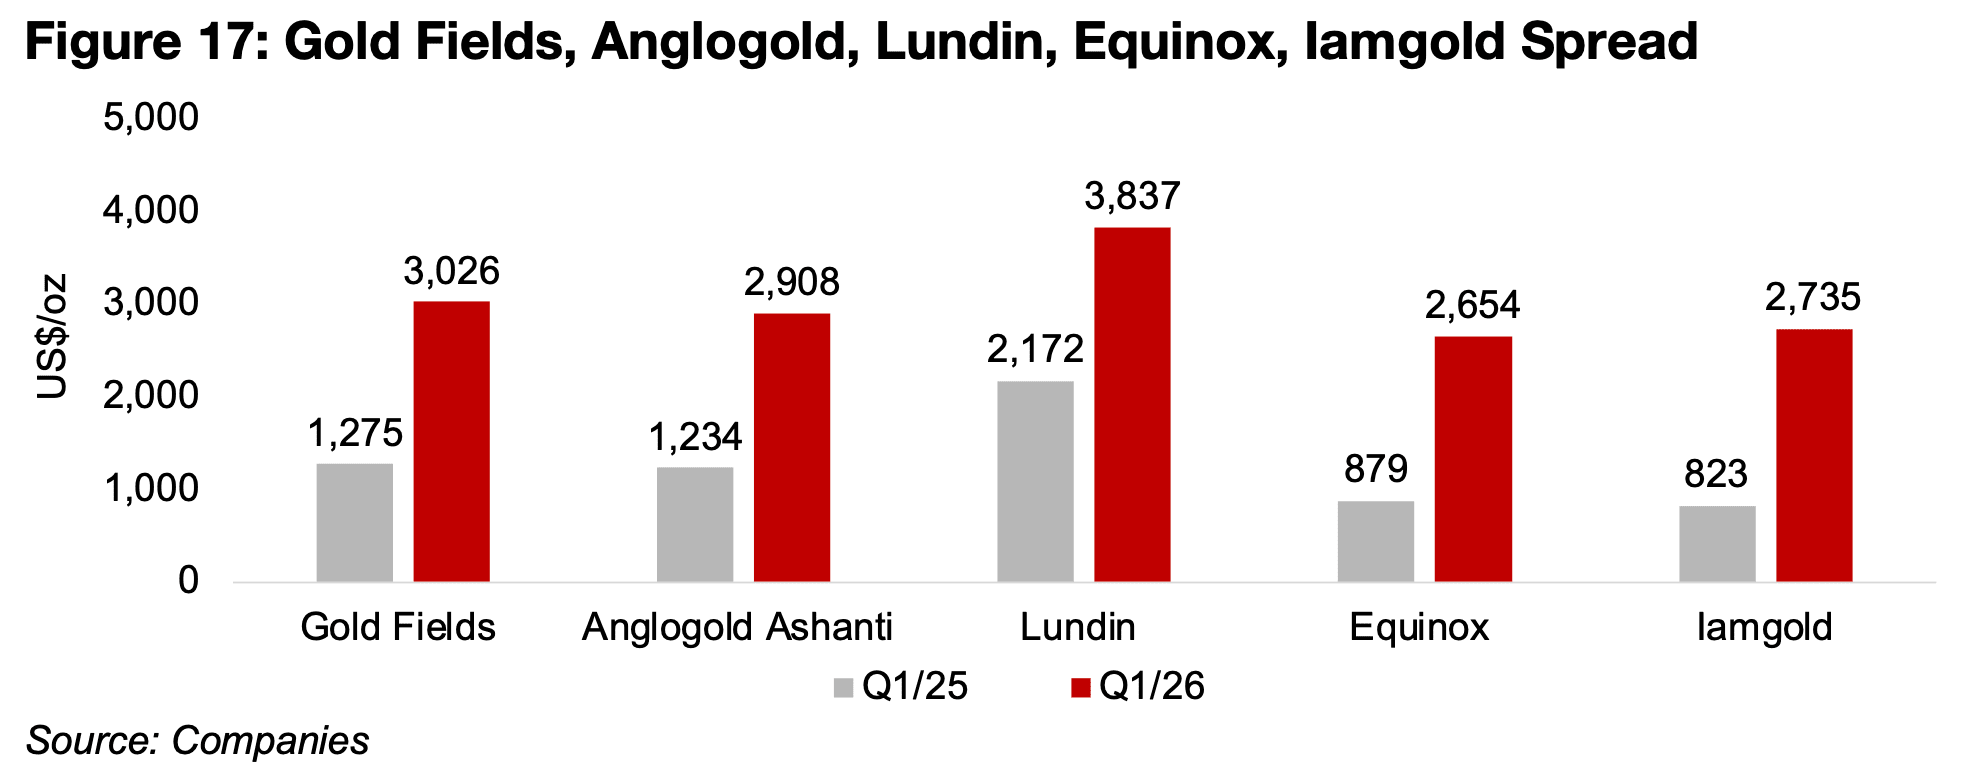
However, this increase in costs was far outpaced by the rise in gold, with the realized
price to AISC spread increasing to a range of US$2,654/oz-US$3,026/oz in Q1/16
from US$823/oz-US$1,276/oz in Q1/25, except for Lundin, which jumped to
US$3,837/oz, from US$2,170/oz, by far the highest of the group, given its very low
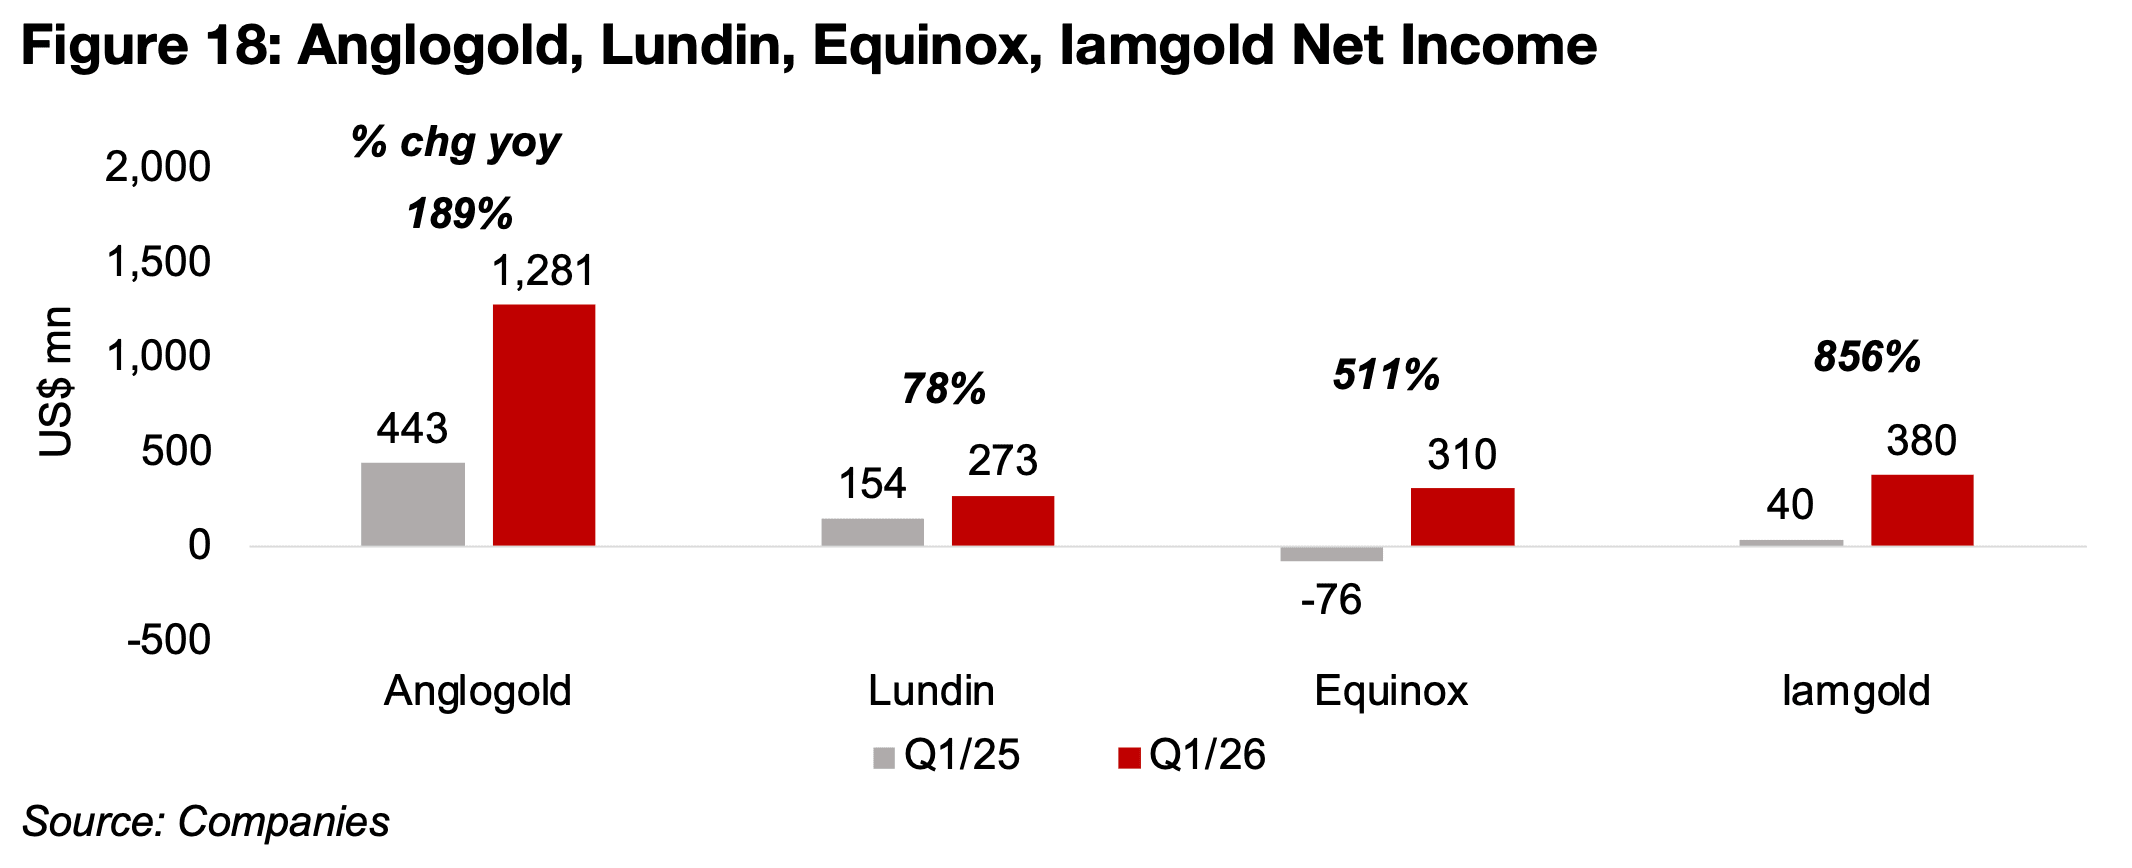
AISC (Figure 17). The surge in the operational spread lead to major gains in net
income, with Anglogold up 189%, Lundin rising 78%, Equinox jumping 511% and
Iamgold surging 856% (Figure 18).
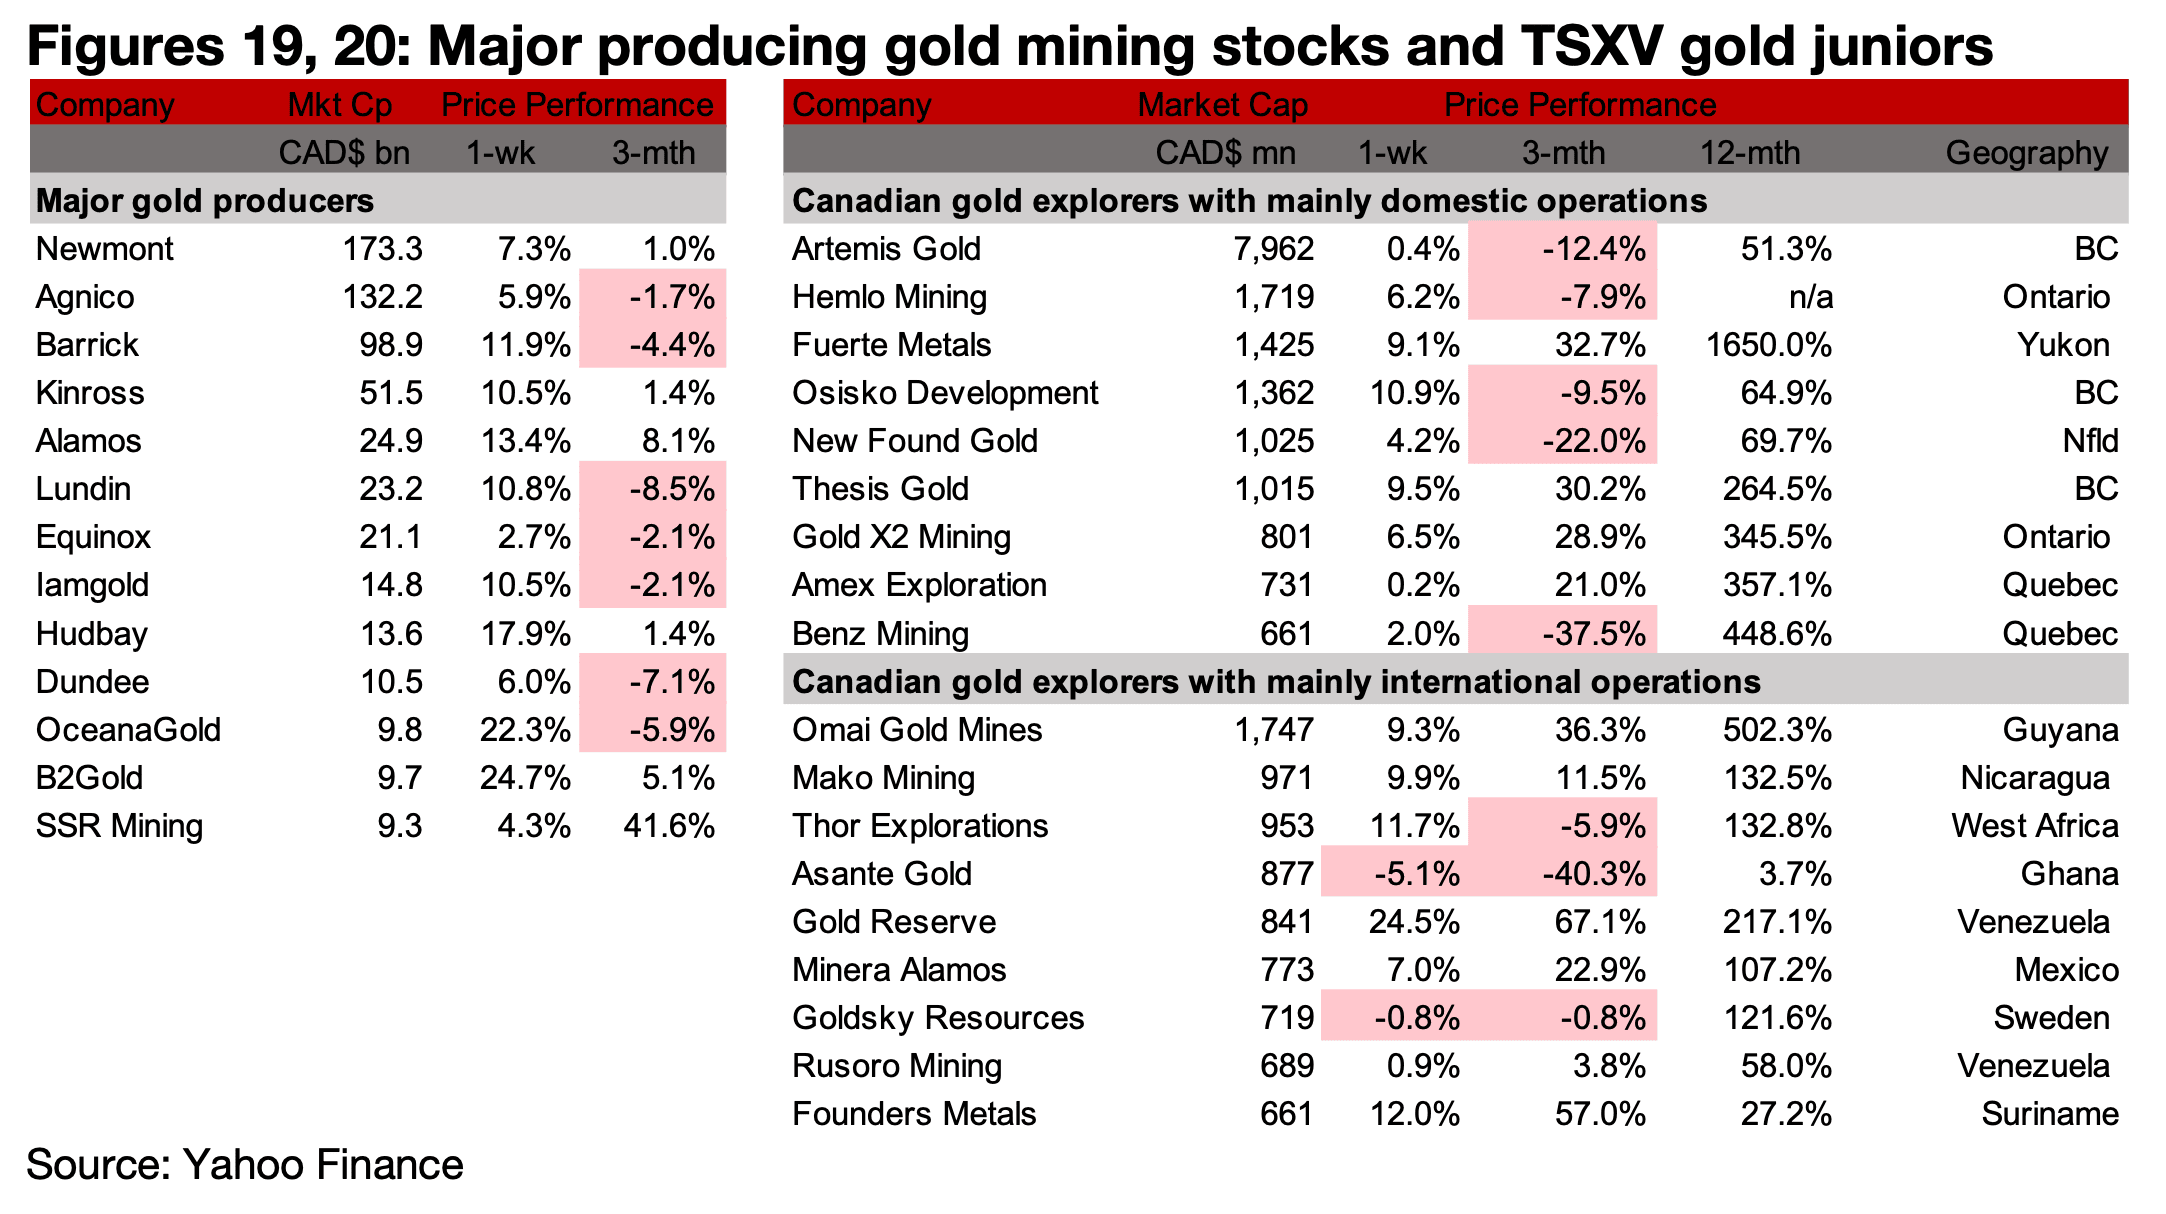
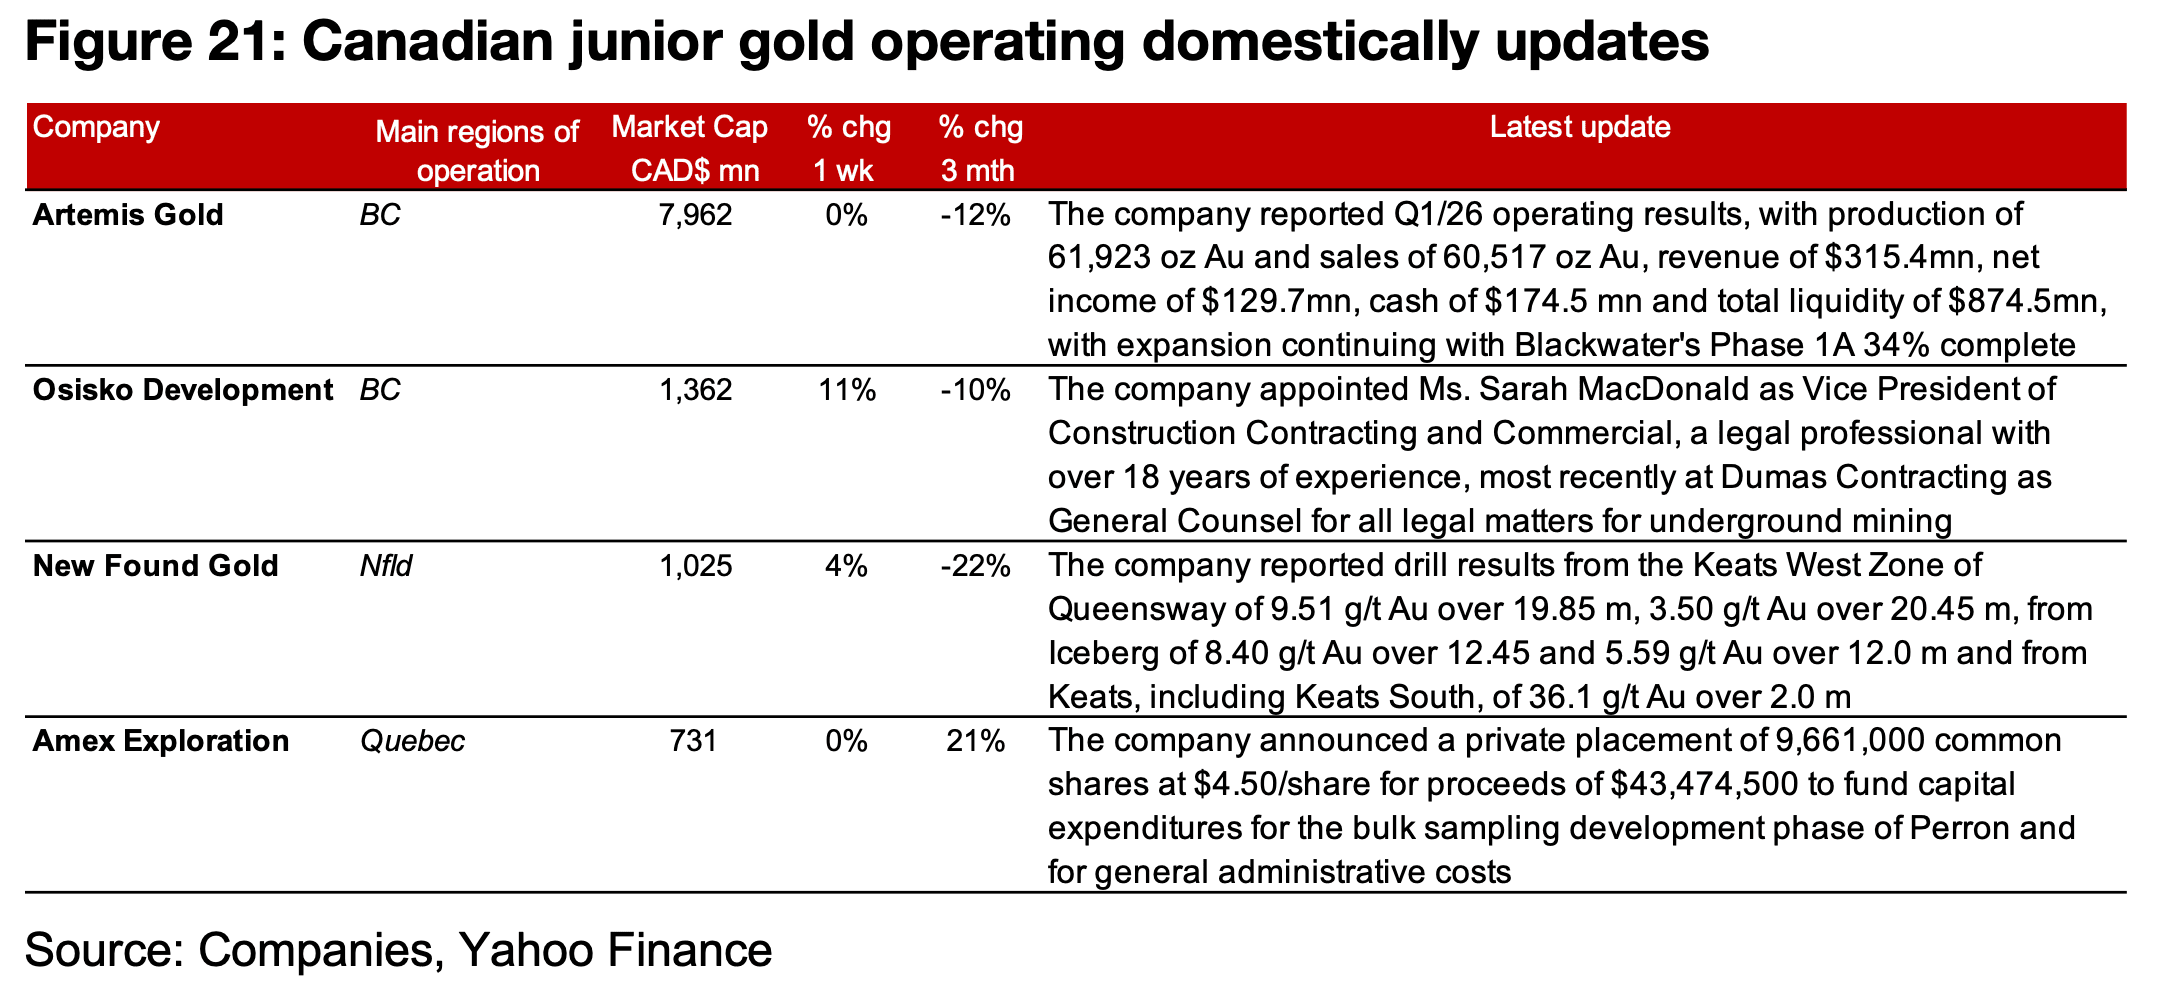
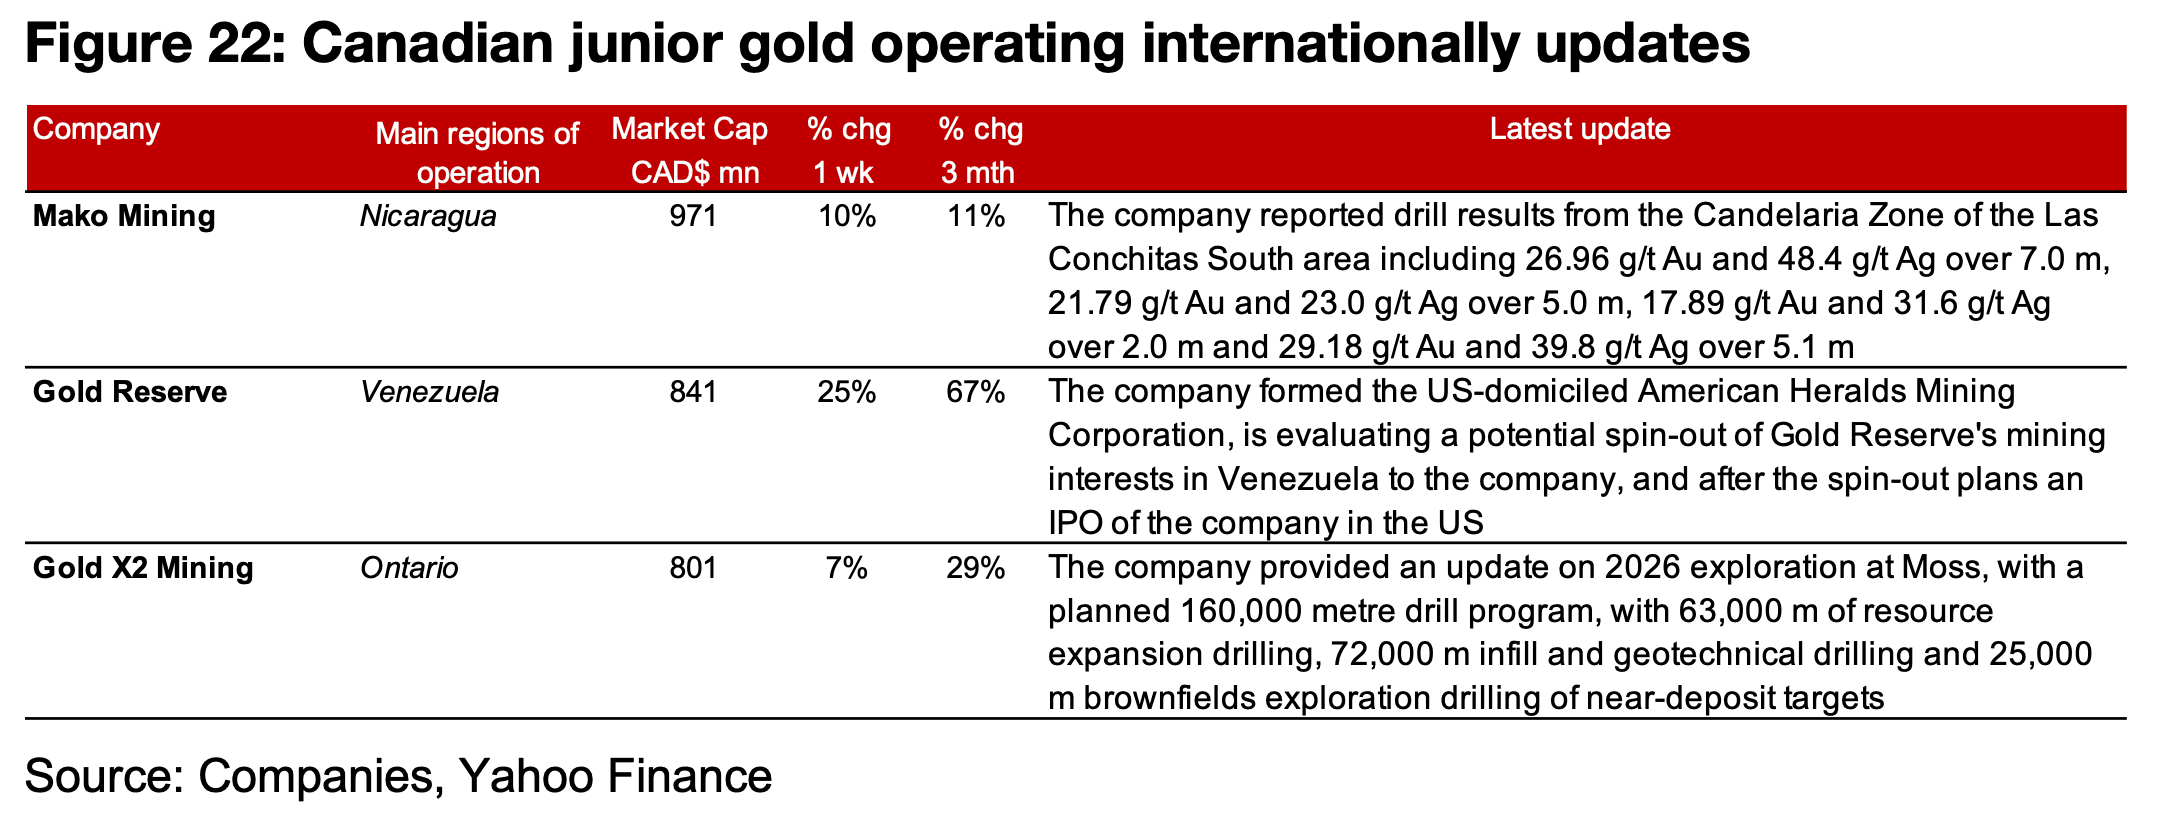
The major producers and most of TSXV gold rose on the gain in the gold price (Figures 19, 20). For the TSXV gold companies operating mainly domestically, Artemis reported Q1/26 operational results, Osisko Dev. appointed a new VP, New Found reported drill results from Queensway and Amex announced a private placement (Figure 21). For the TSXV gold companies operating mainly internationally, Mako reported drill results from the Candelaria Zone of Las Conchitas South, Gold Reserve formed the American Heralds Mining Company to potentially spin-out its Venezuela assets and Gold X2 provided an update on its planned 160,000k exploration program at Moss (Figure 22).
Disclaimer: This report is for informational use only and should not be used an alternative to the financial and legal advice of a qualified professional in business planning and investment. We do not represent that forecasts in this report will lead to a specific outcome or result, and are not liable in the event of any business action taken in whole or in part as a result of the contents of this report.
Author
Ben McGregor authors the Weekly Roundup at CanadianMiningReport.com, providing sharp analysis of the metals and mining sector. With a talent for spotting trends, Ben distills complex market shifts into clear, engaging insights on TSXV junior miners. His weekly updates cover gold, copper, uranium, and more, blending data-driven perspectives with a knack for identifying opportunities. A vital resource for investors, Ben’s work navigates the dynamic junior mining landscape with precision.