

October 26, 2026
The gold price slumped -4.1% to US$4,008/oz, even as key drivers moved in its favor, with yields and the US$ down and a flight to safety on geopolitical risk and the recent tech crash, although the latter may have driven forced liquidations of the metal.
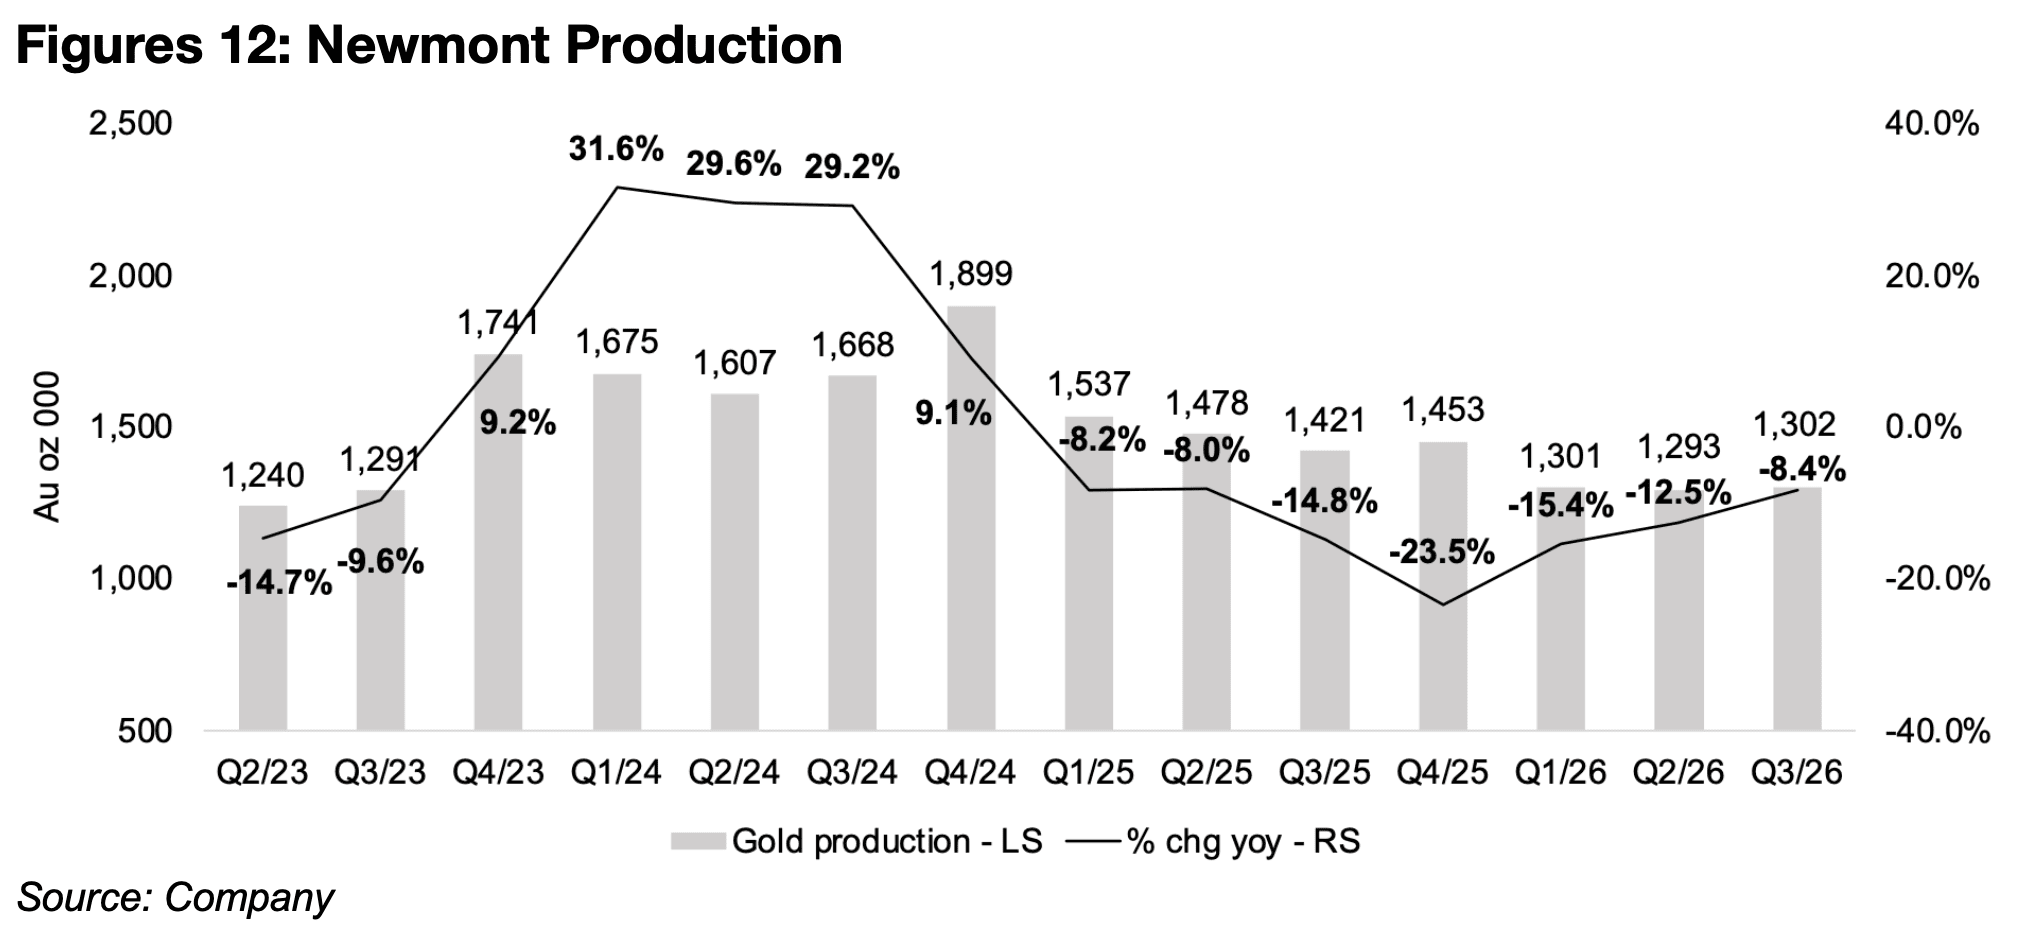
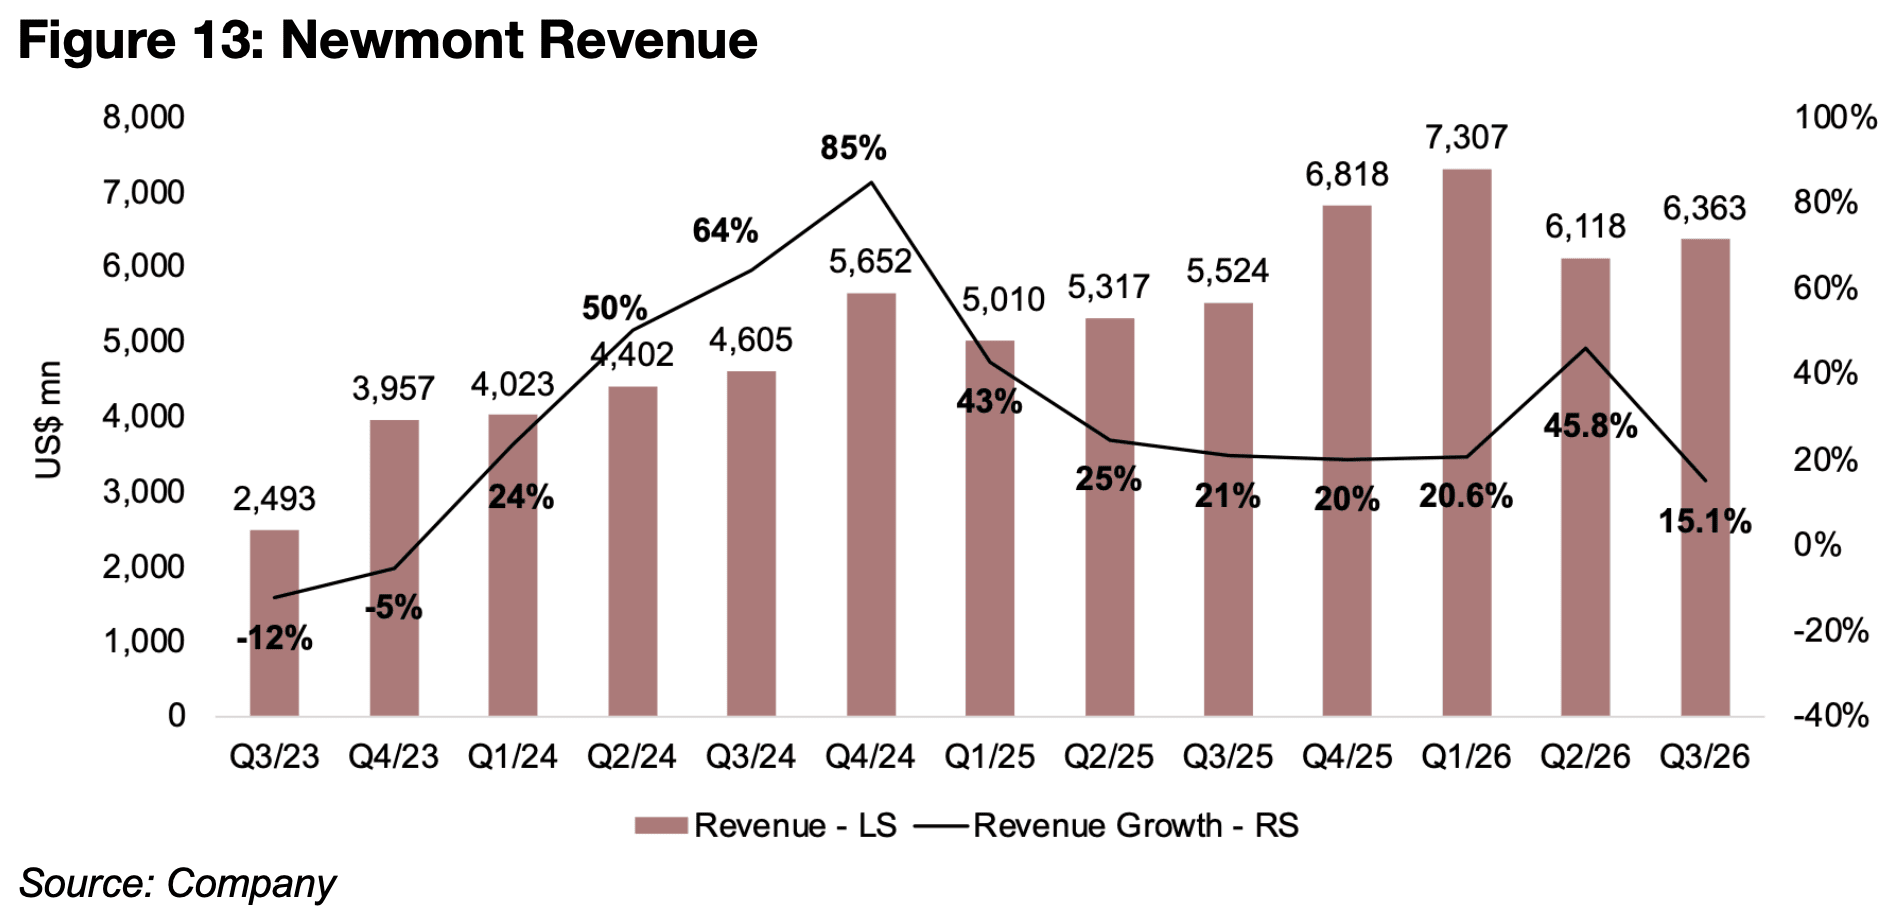
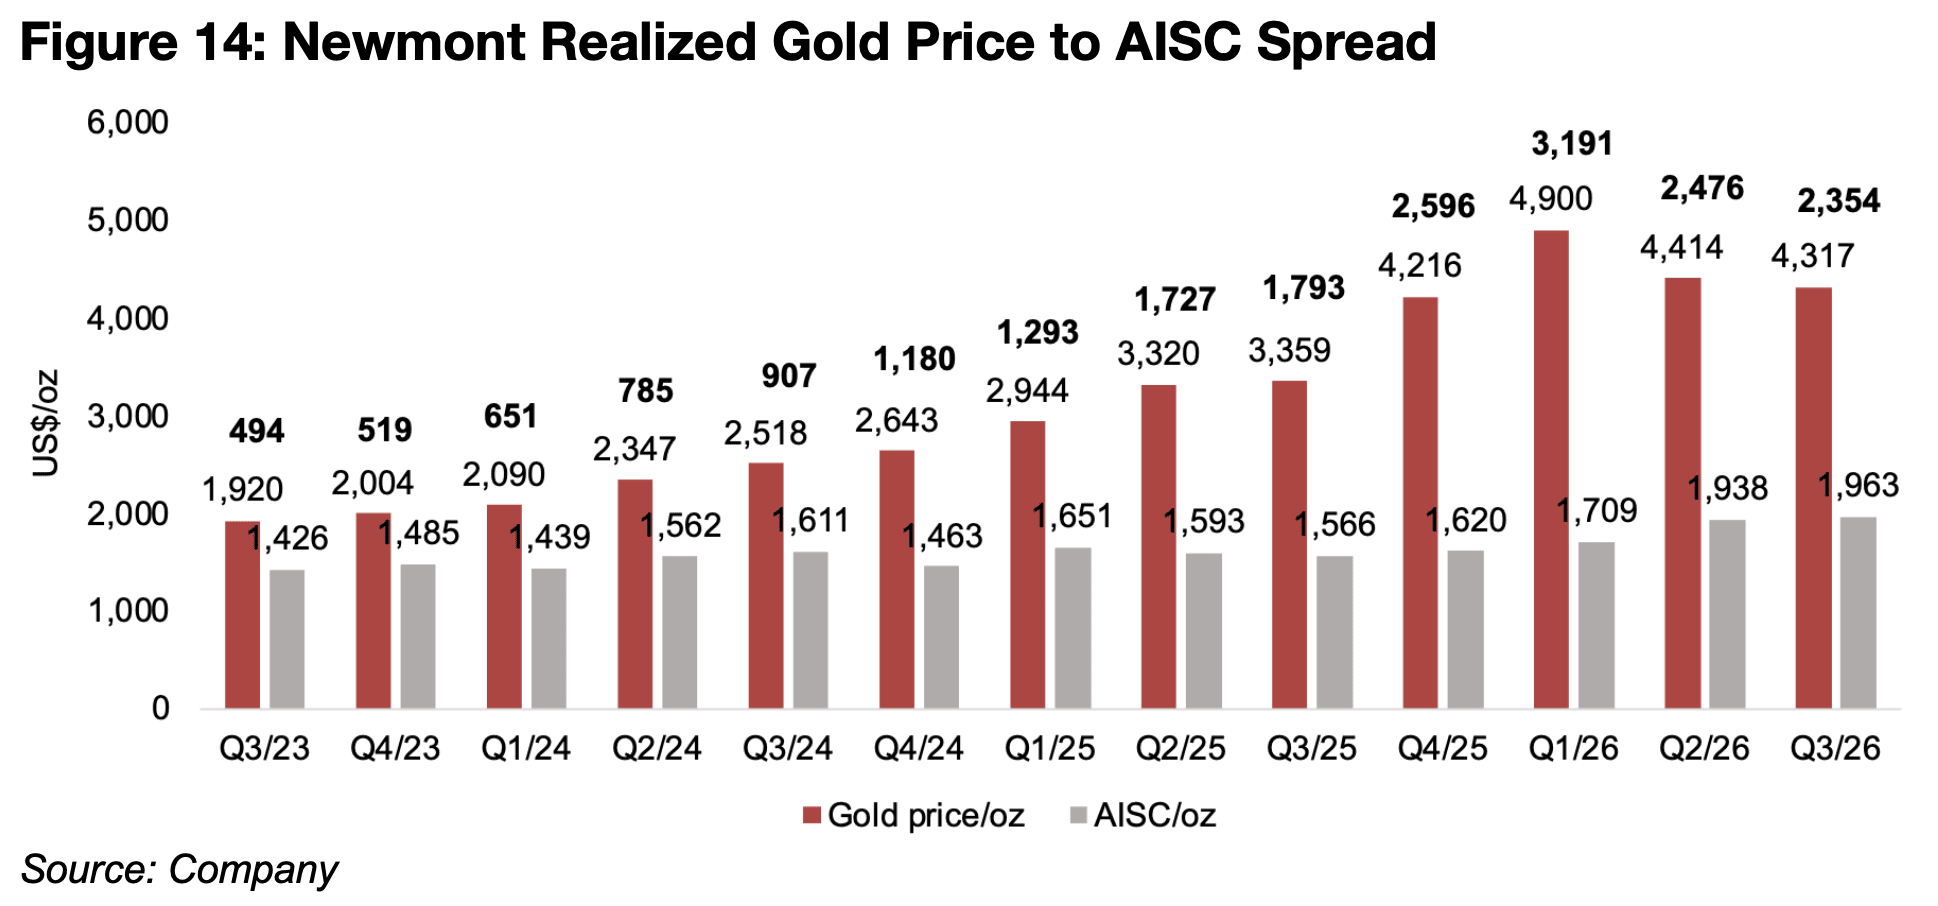
Newmont was the first Big Gold company to release Q3/26 results, starting off the reporting season strong with revenue and income up substantially yoy, but still down from the Q1/26 peak as a declining gold price and surging costs lowered margins.
The gold stocks dropped significantly with the GDX down -8.6% and the GDXJ losing -9.6% on the decline in the metal price and a sector rotation towards other defensives as funds mandated to hold almost entirely equities may have sold off gold.


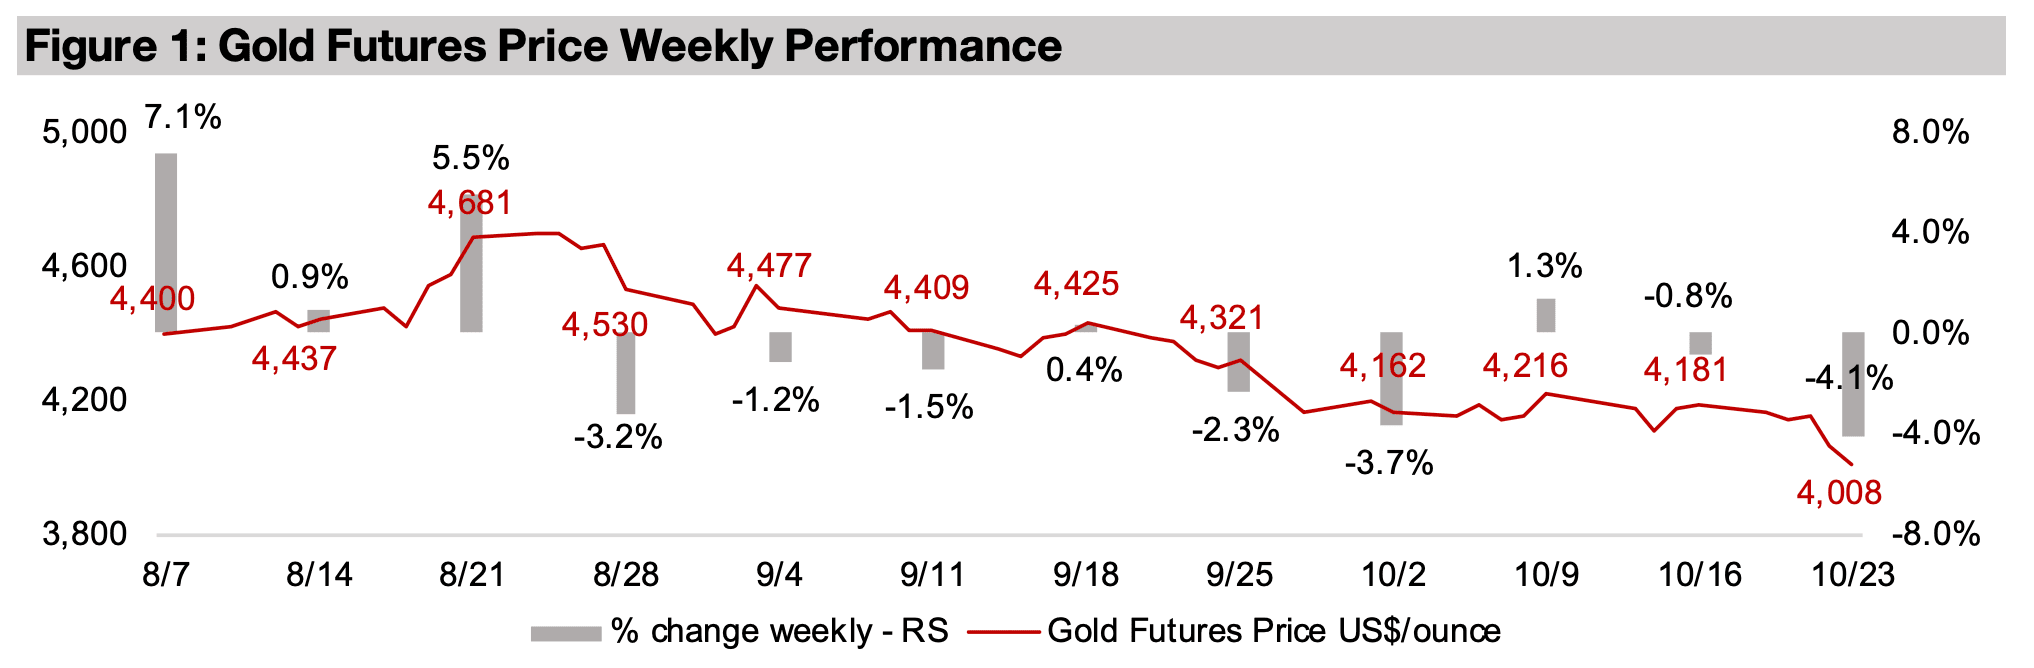
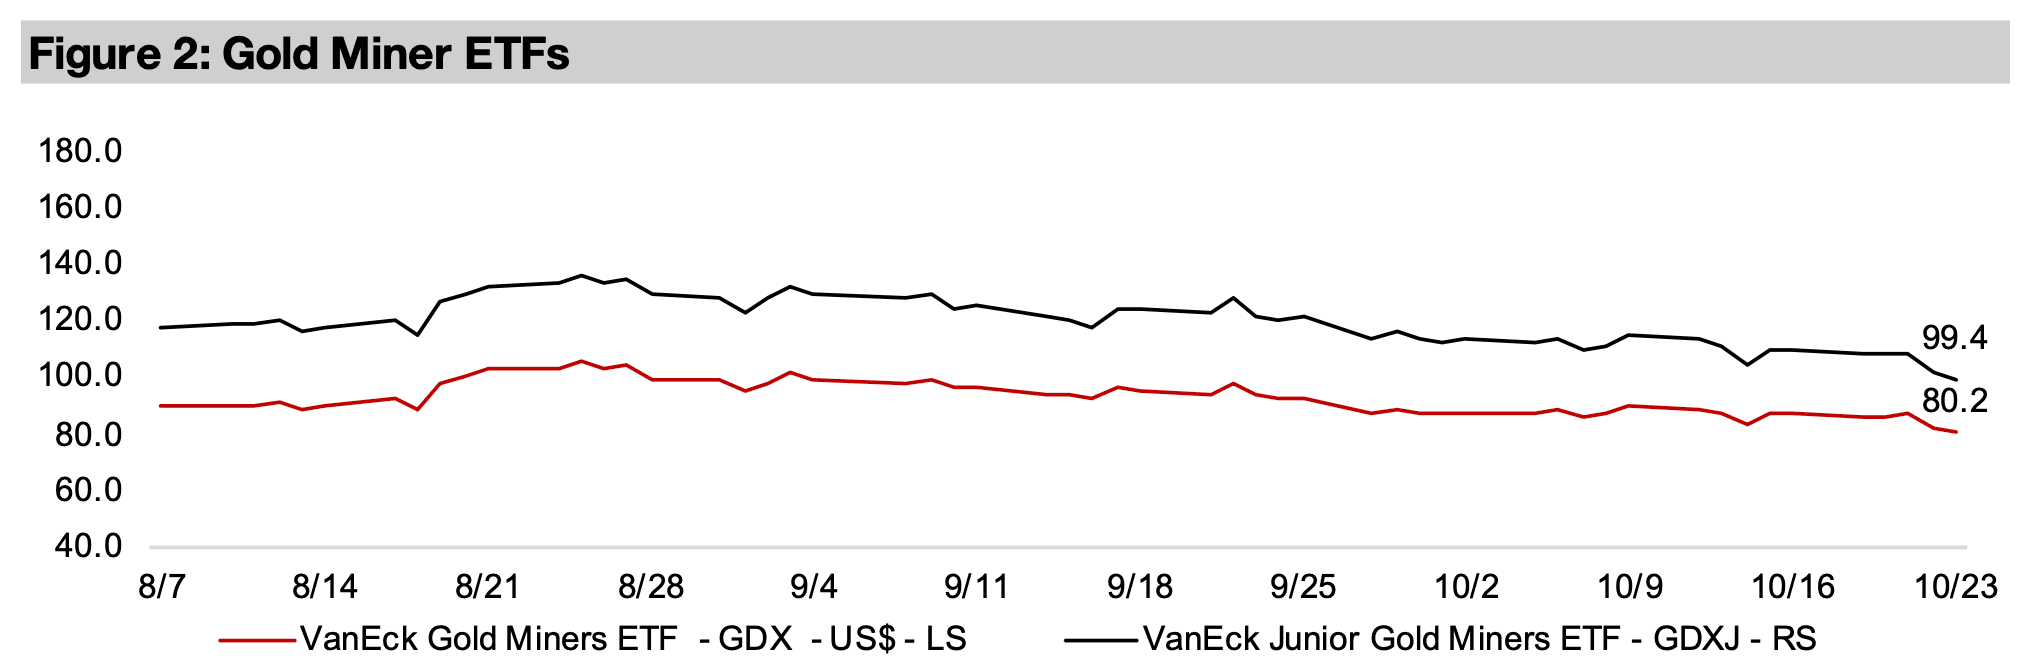
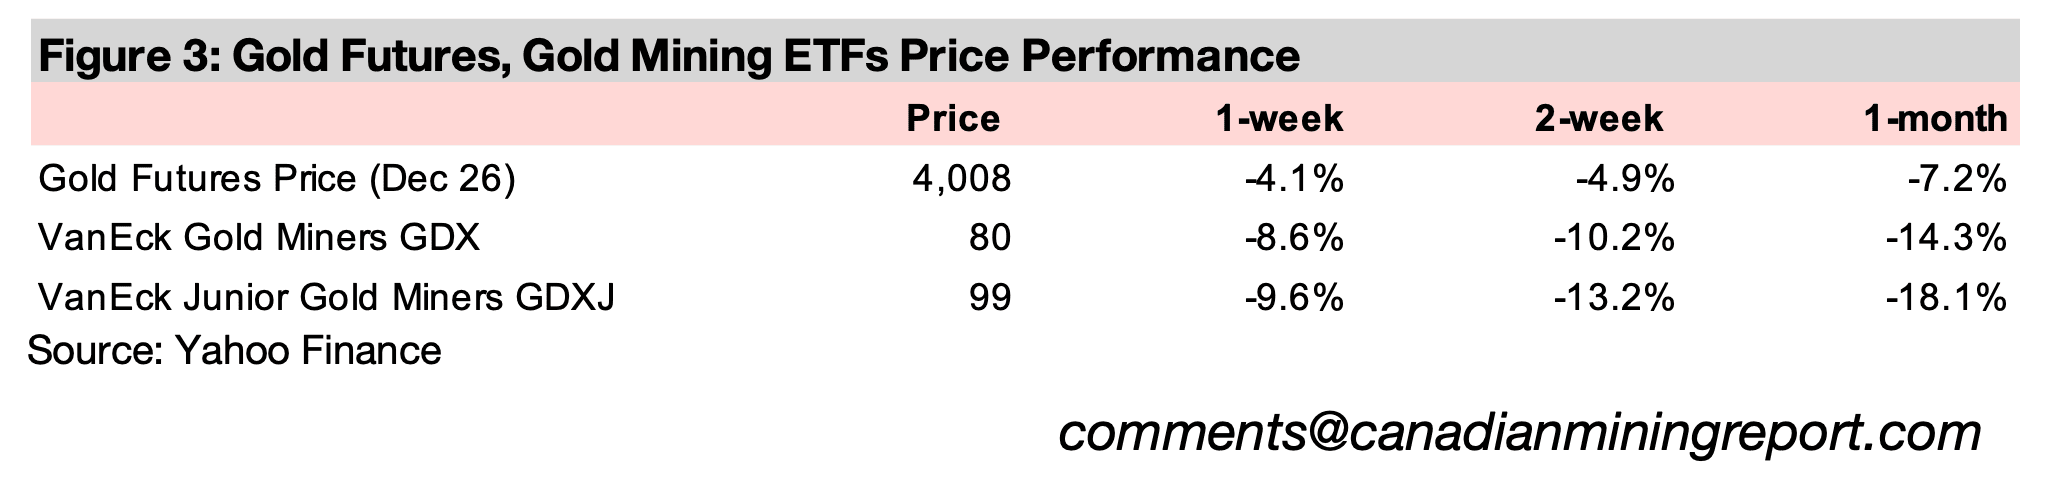
The gold price plunged -4.1% to US$4,008/oz, even as several drivers seemed to
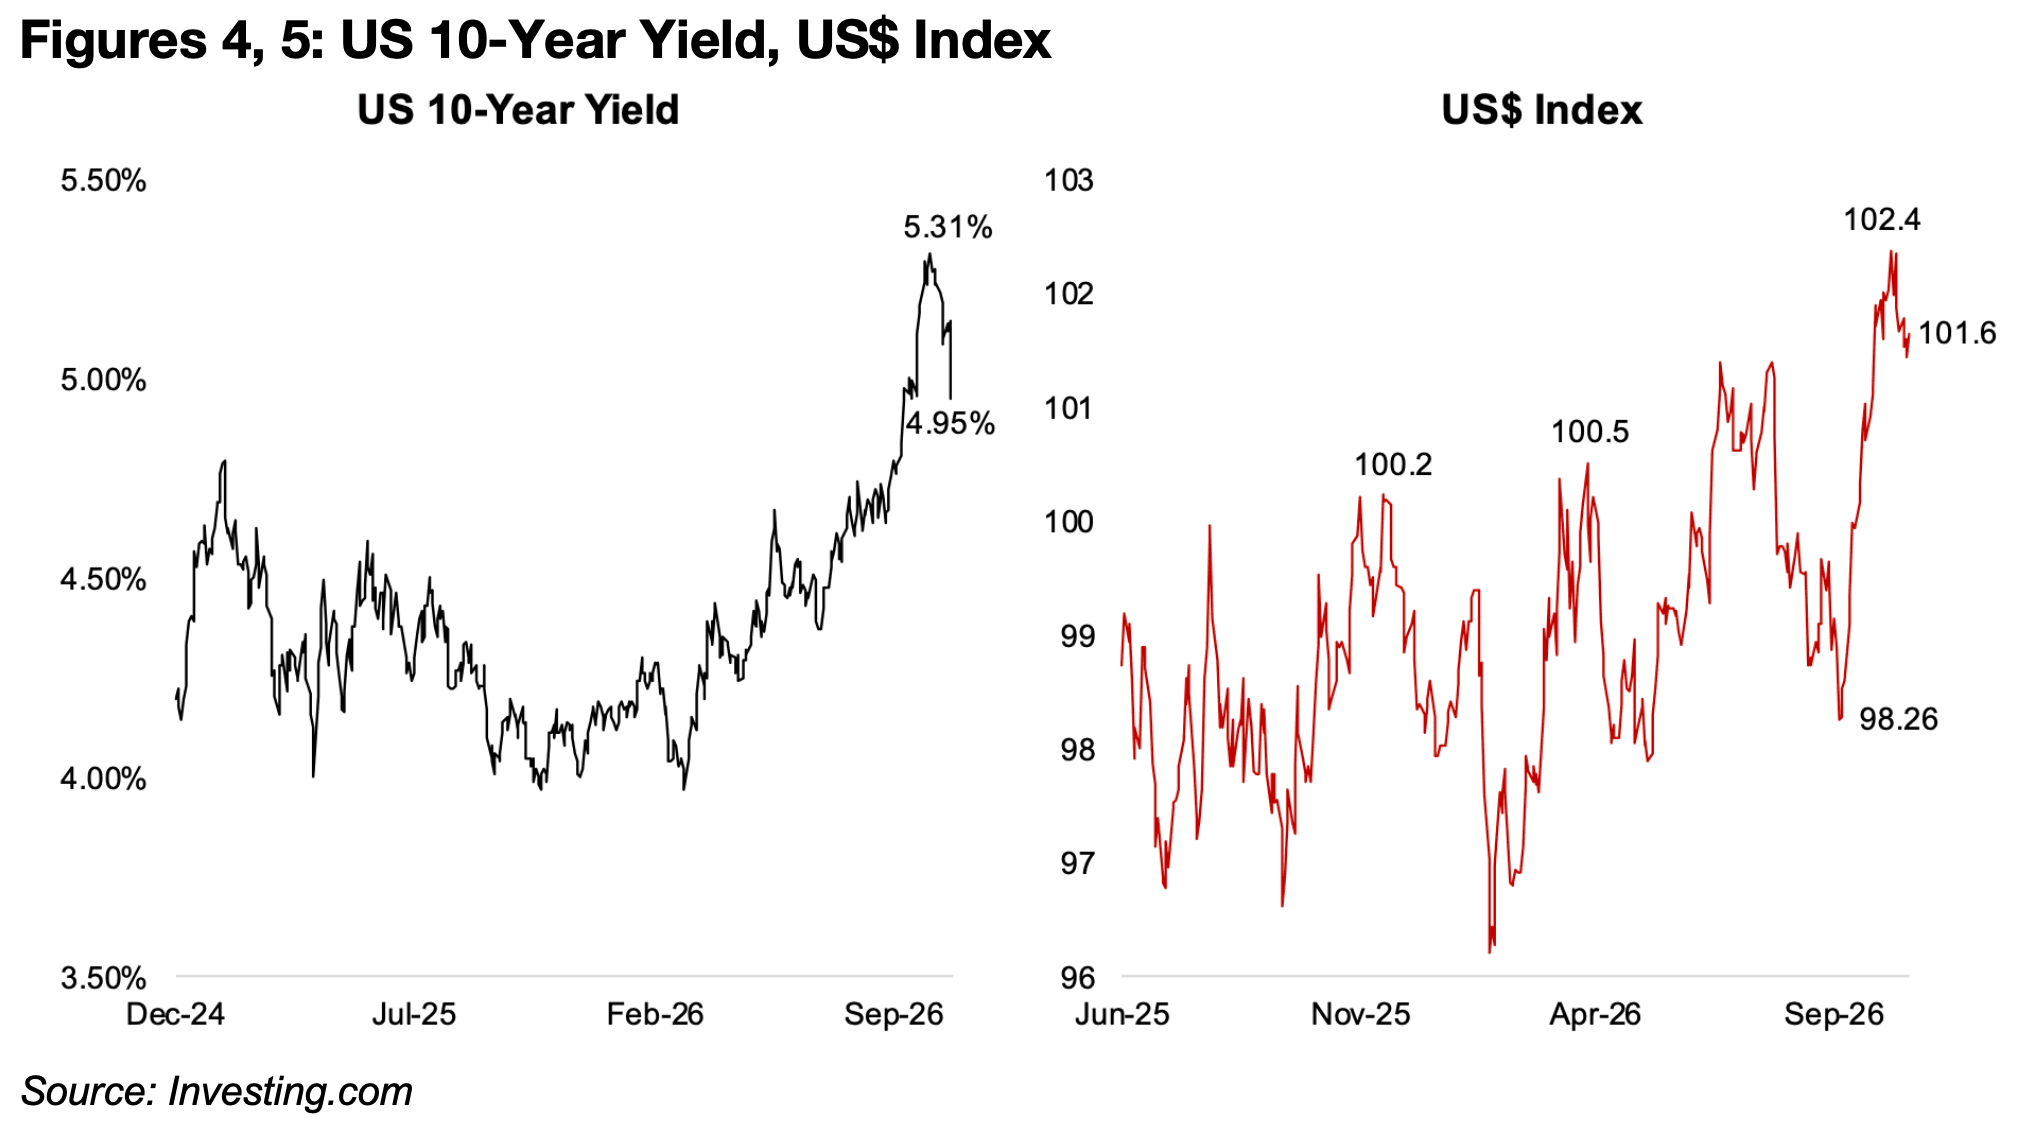
move significantly in its favour, including a decline in bond yields and the US$, which
both tend to move inversely to the metal. The US 10-year crashed to 4.95%, just
below the critical 5.00% level, which has historically often preceded major economic
and equities market declines, down from 5.31% at its peak at the start of October
2026 (Figure 4) The US$ Index dropped to 101.6 from its highs of 102.4 in midOctober 2026 (Figure 5).
There has also been a significant flight to safety over the past two weeks on the
plunge in the tech sector and surging geopolitical risk, with attacks rising in the
Middle East. With these factors also tending to support gold, we would certainly not
have expected to see such a major slump in the metal under the scenario that erupted
last week. We suspect that much of the decline may have been driven by markets
forced into the liquidation of assets to cover leveraged bets in tech. This could include
gold, which while struggling with gains this year, is still up significantly for buyers from
mid-2025 or earlier.
There was a jump in the oil price on the Middle East conflict, which would imply higher
inflation and therefore a potential rake hike and increased real yields, which would be
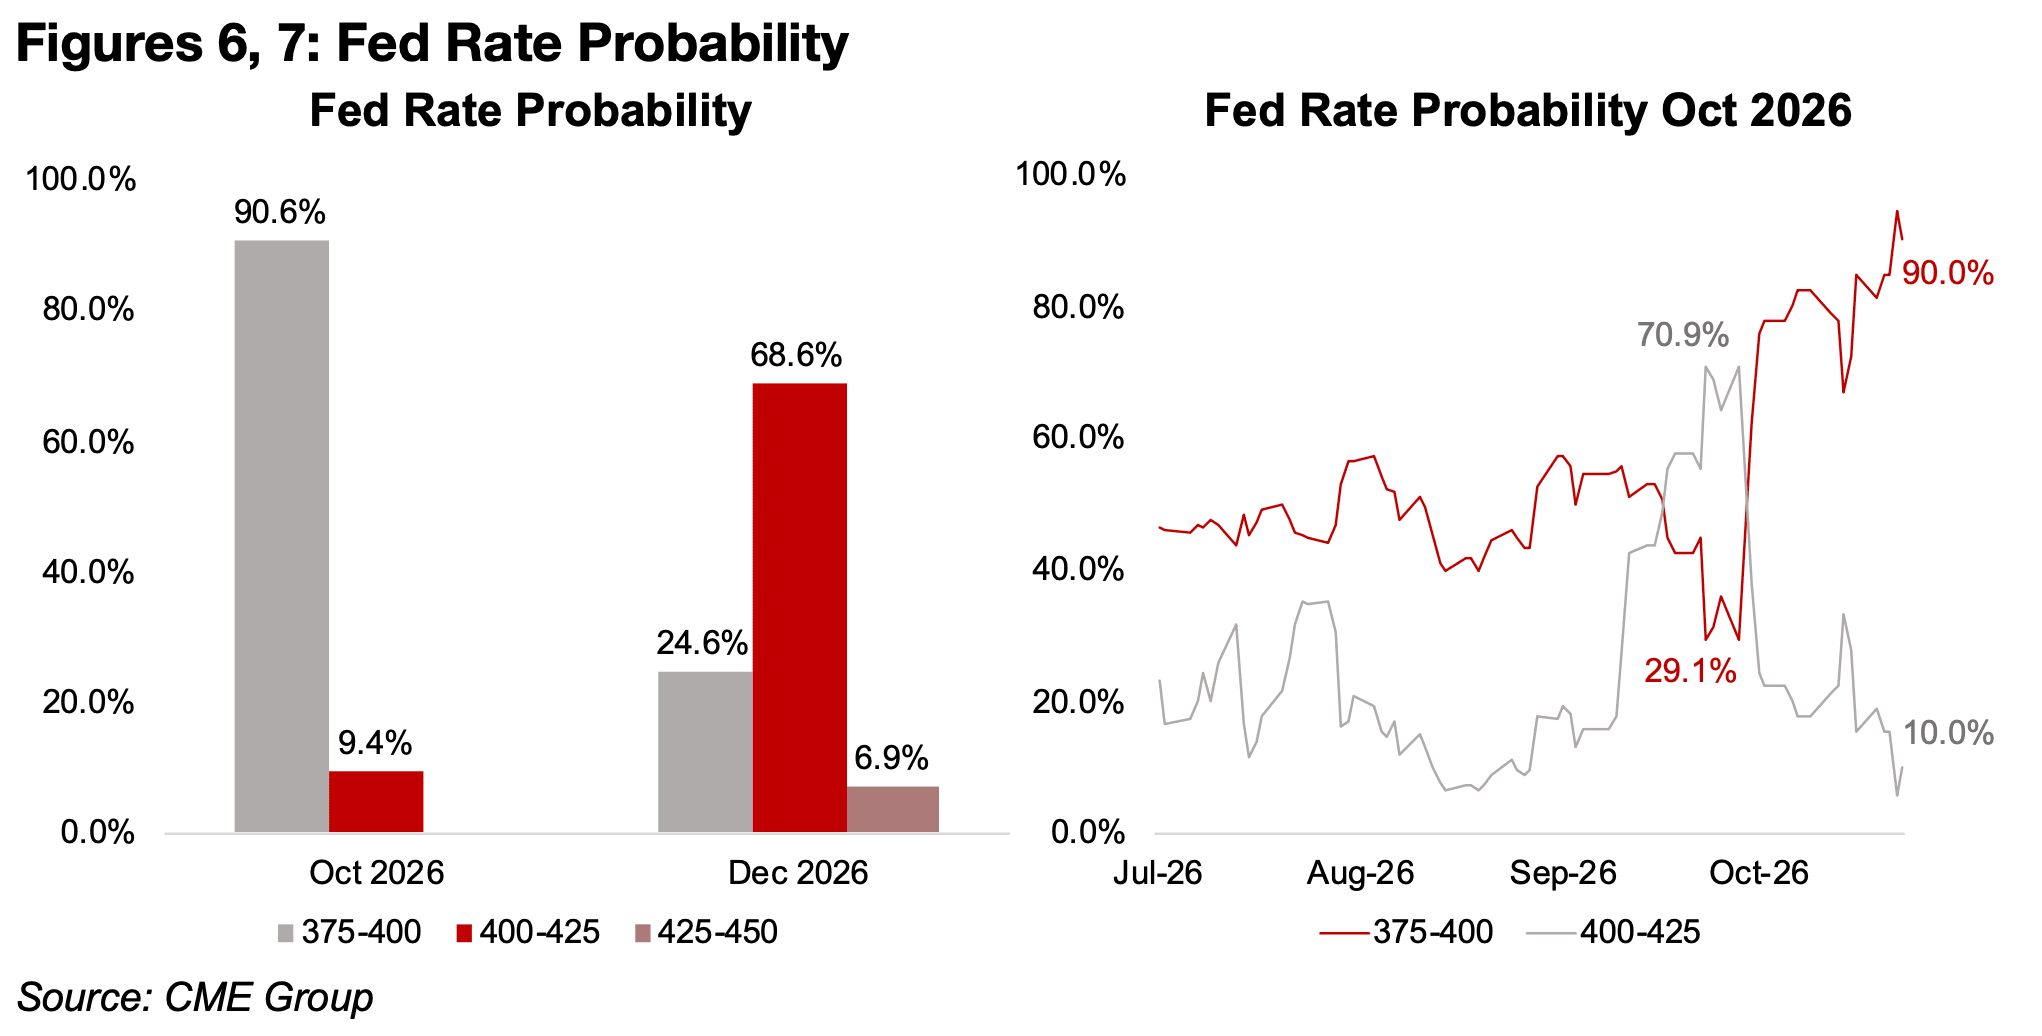
negative for gold. However, the probability of a rate hike at the October 2026 Fed is
just 9.4% and it is not a complete certainty even for December 2026 at 75.5% (Figure
6). The expectation of a hike this week has also plunged from a peak of 70.9% in late
September 2026 (Figure 7).
Combined with the decline in yields and the US$ this week, this implies that concerns
over higher rates may have not been the major driver of the decline in gold. However,
even after the pullback in yields and the US$, both do remain near their highs for the
past two years, which could be hitting sentiment for the metal, even if not being the
immediate cause of the recent selloff. Offsetting this somewhat may be rising
expectations that high oil prices will cause demand destruction, effectively correcting
themselves by causing slowing consumption and investment.
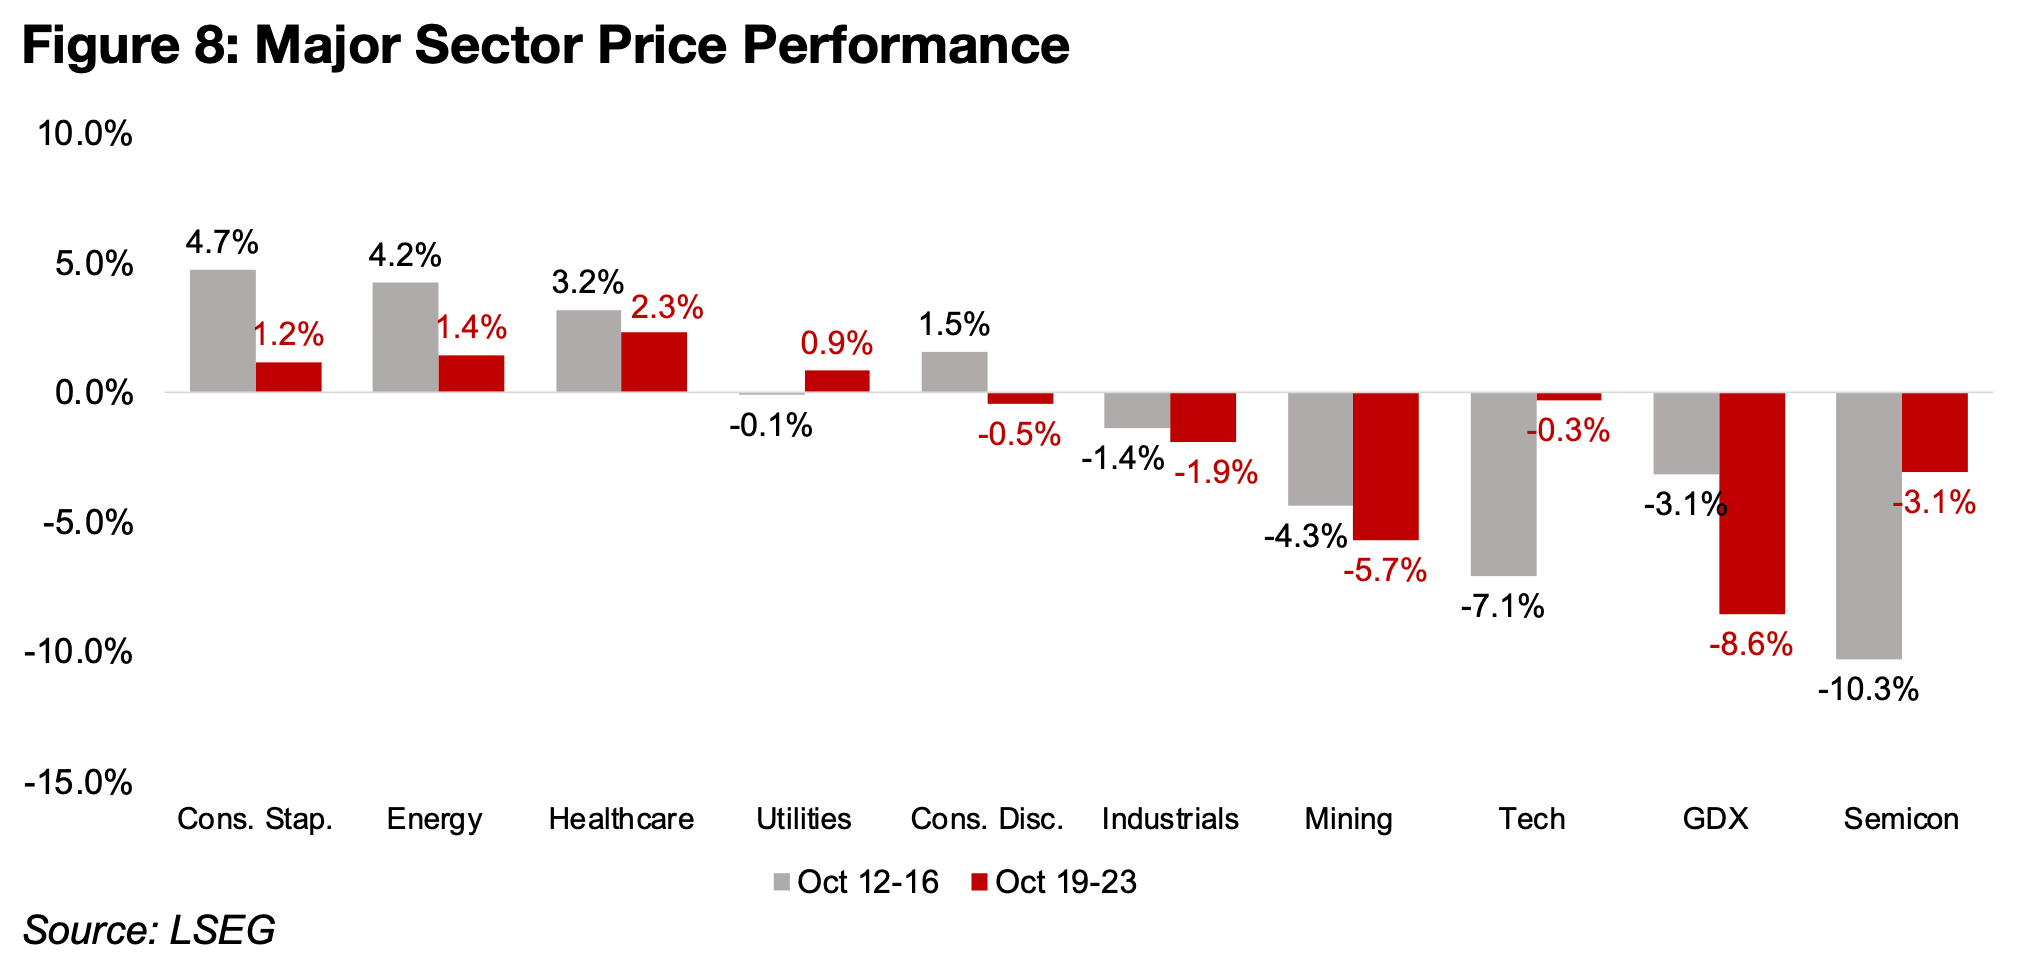
There has certainly been a shift within global equities towards more defensive sectors,
with consumer staples up 4.7% in the week of October 12-16, 2026, and 1.2% from
October 19-23, 2026, healthcare rising 3.2% and 3.3% and utilities down -0.1% and
then up 0.9% (Figure 8). This far outperformed the -7.1% and -0.3% declines in global
tech, especially driven by a -10.3% and -3.1% drop in semiconductors. However, the
gold sector, also considered a safe haven, was still down, with the GDX ETF of
producers down -3.1% and -8.6% over the past two weeks. This may have partly
been because many funds have mandates requiring near full equity investment, but
no requirements to hold the metal, which could have led to selling of both gold and
stocks in the sector and the rotation to other lower volatility sectors.
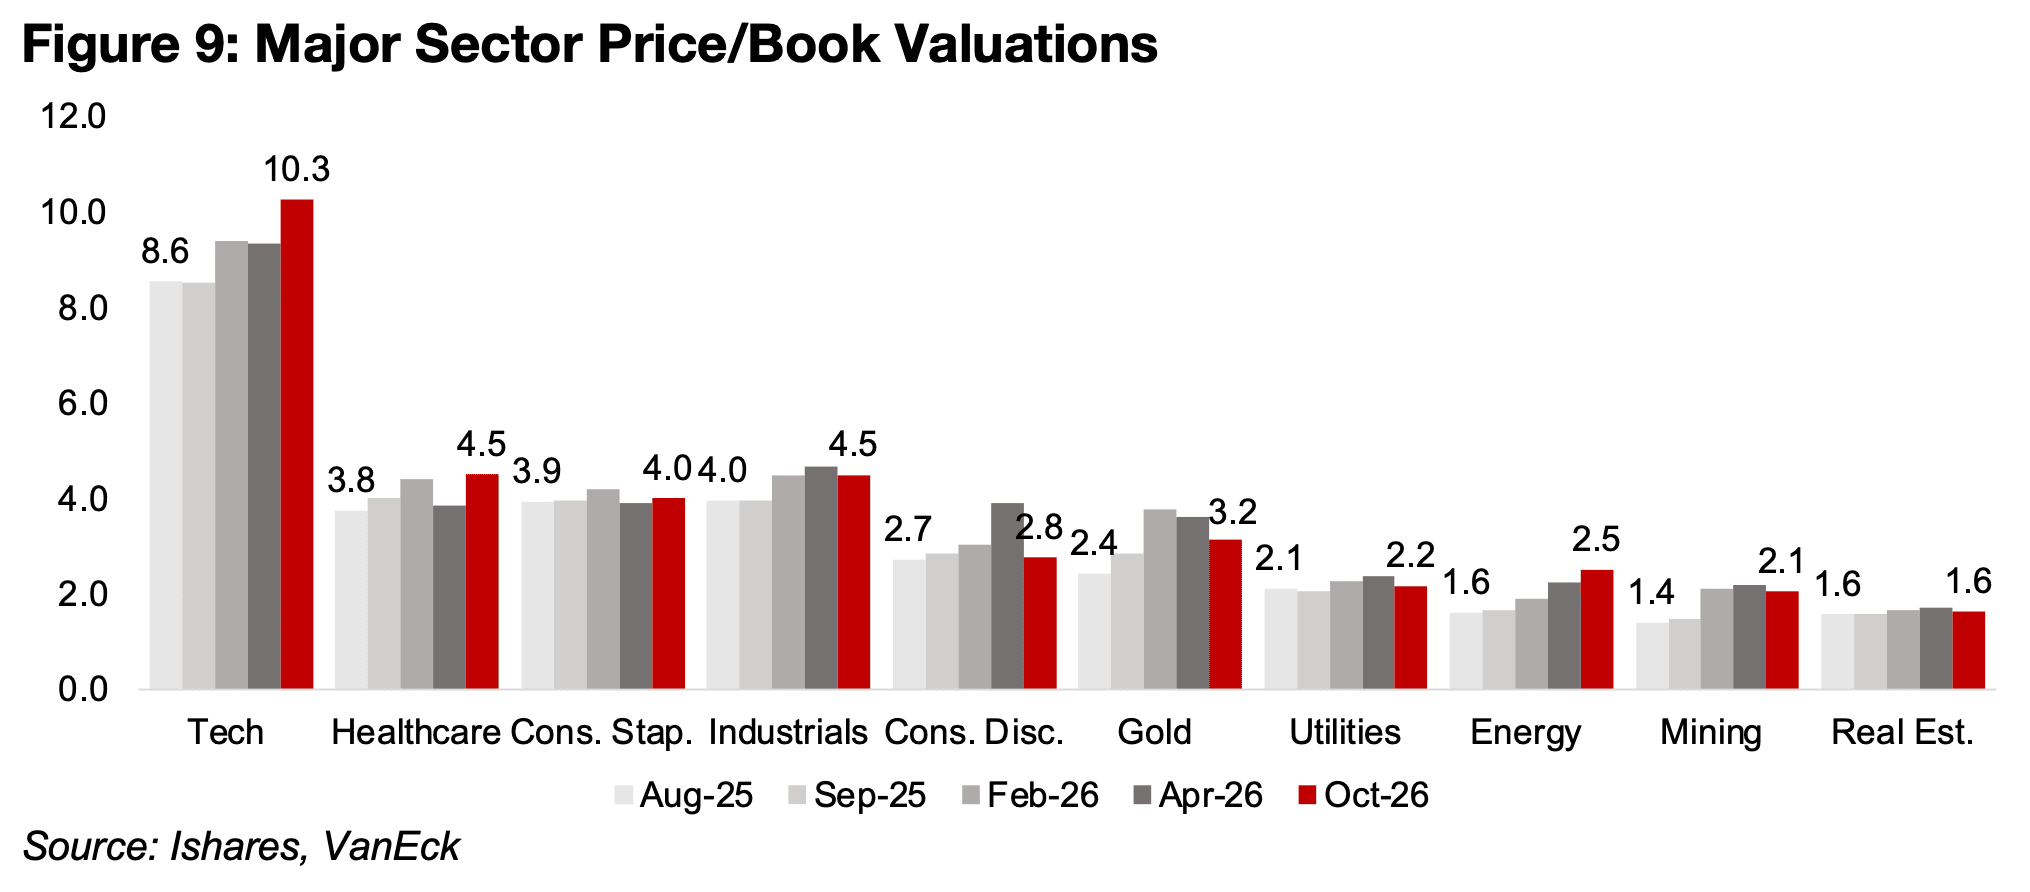
The global tech sector has seen valuations rise even given the crash, suggesting that
the market cut earnings estimates by a higher rate than the stocks declined, leaving
the price to book ratio of 10.3x still over twice the level of the other major sectors.
The P/B for the gold sector has declined from highs in early 2026 to a moderate 3.2x
and the MSCI metals and mining multiple has edged down to 2.1x.
There is an argument sometime proposed that tech companies will structurally have
a far higher P/B multiple, as the book in this equation can be low given smaller asset
bases compared to many other sectors. However, this is mainly based on software
companies and isn’t the case for many of the tech majors now, which are chip
companies and providers of AI infrastructure which also have large asset bases.
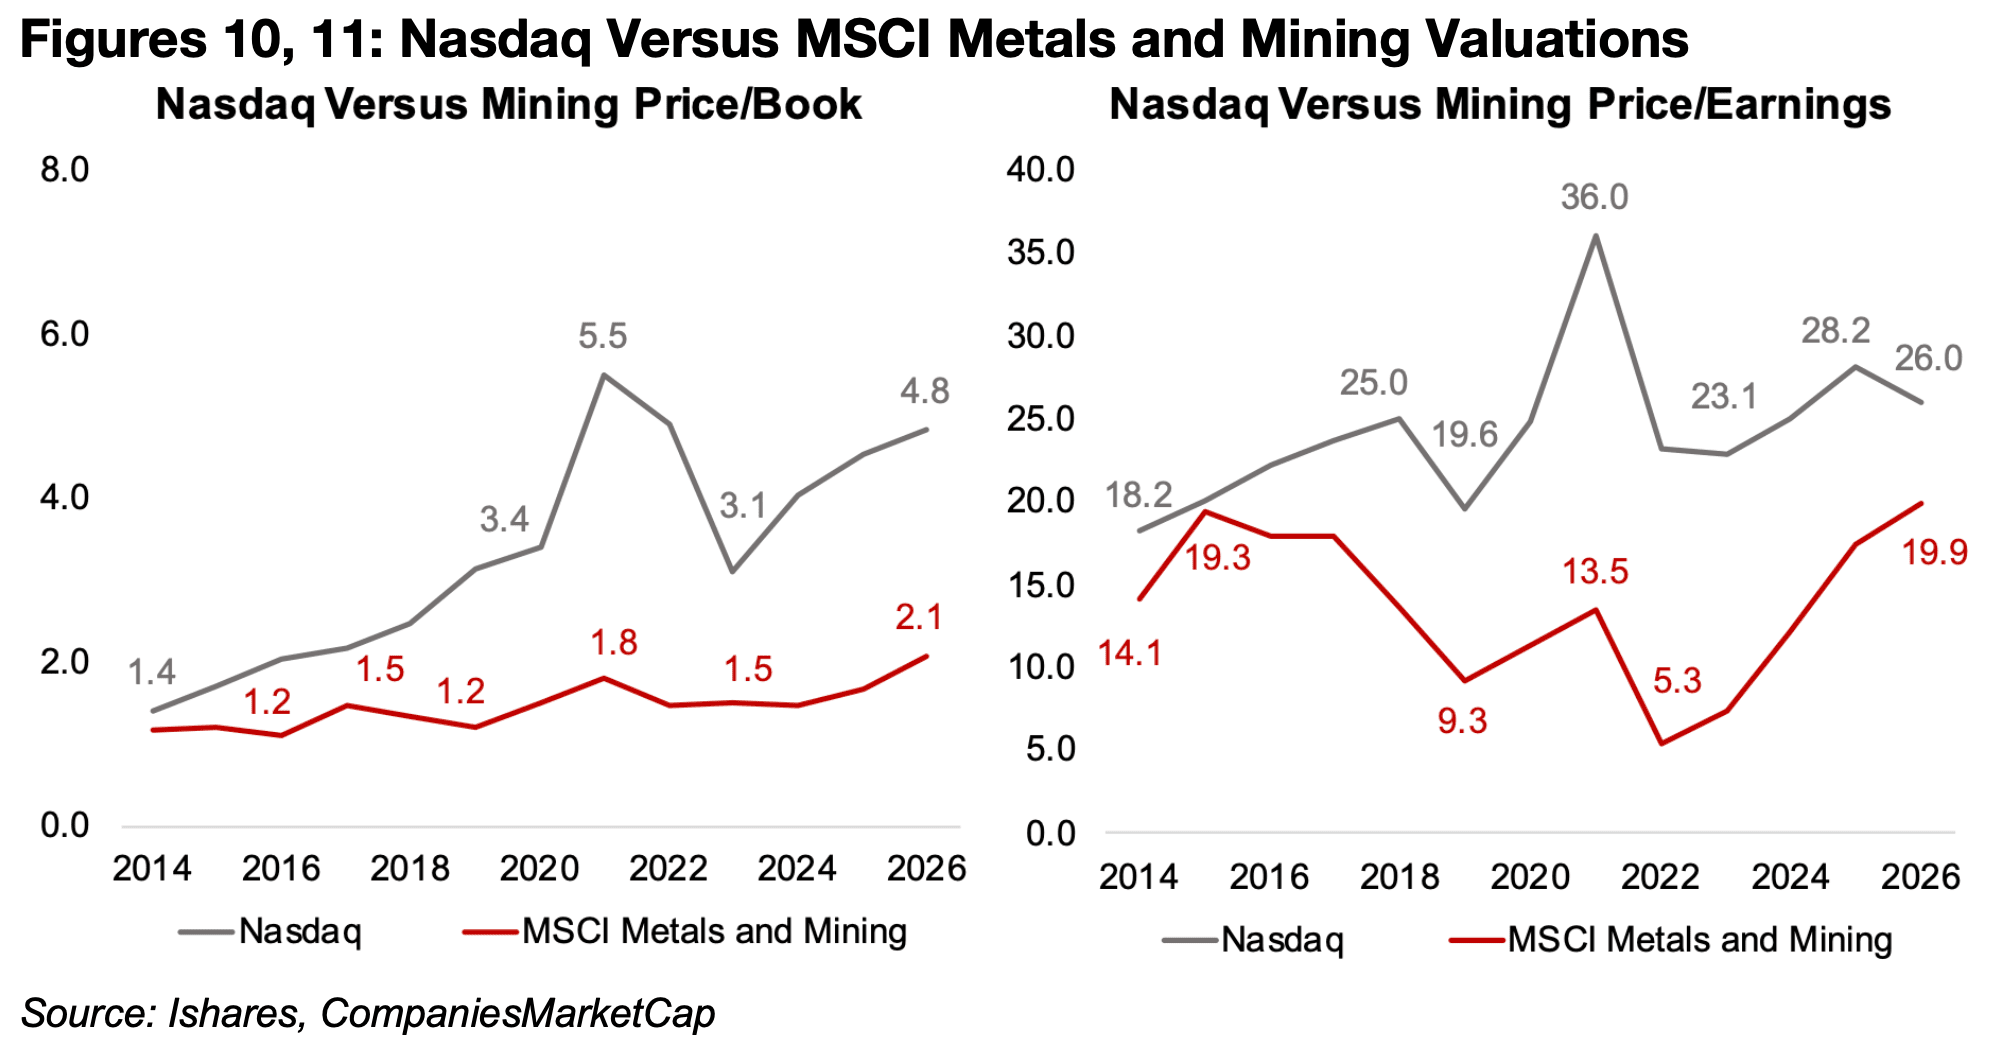
Also, historically there have been periods when the tech sector has not had much of
a price to book premium to the mining sector, including 2014 and 2015, indicating if
this is a persistent structural spread, that it may only be marginal. It would not entirely
explain the huge rise in this gap especially since 2020, peaking in 2021, with tech at
5.5x and mining at 1.8x (Figure 10). This year it has reached near these levels again,
with tech at 4.8x and mining rising only to 2.1x. The price to earnings spread is more
narrow, but tech is still far ahead at 26.0x versus 19.9x for tech (Figure 11).
Newmont was the first of the Big Gold companies to report Q3/26 results, with another strong quarter overall, although the decline in the metal price and rising costs yoy have squeezed the extremely wide margins of earlier this year. While production growth yoy has contracted for nearly two years, the rate of decline has eased to -8.4% in Q3/26, up from lows of -23.5% in Q4/25 (Figure 12). This decline along with the drop in the realized gold price to US$4,317/oz from US$4,900/oz over the past two quarters saw revenue growth decline to 15.1% yoy, strong in absolute terms, but the lowest level since Q4/23 (Figure 13). The realized gold price to AISC spread contracted to US$2,354/oz from a peak of US$3,191/oz on the drop in metal but also a jump in costs to US$1,963/oz from US$1,566/oz in Q3/25 (Figure 14).
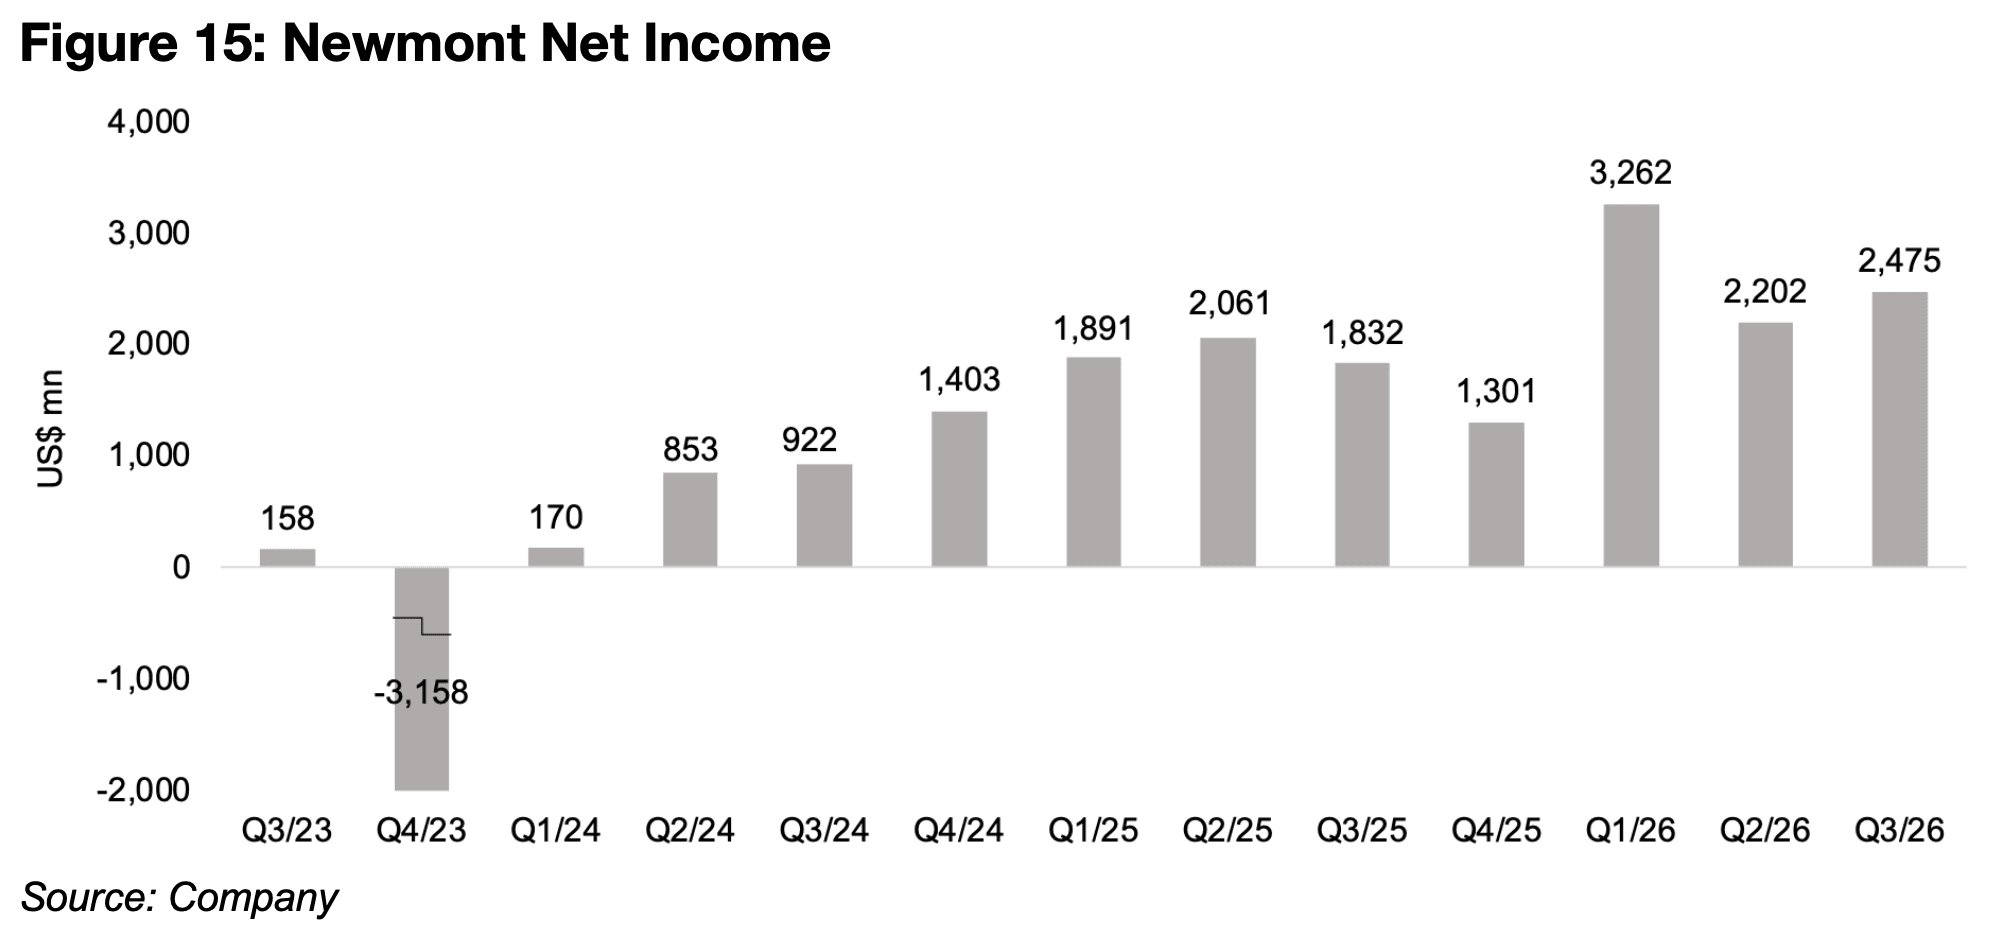
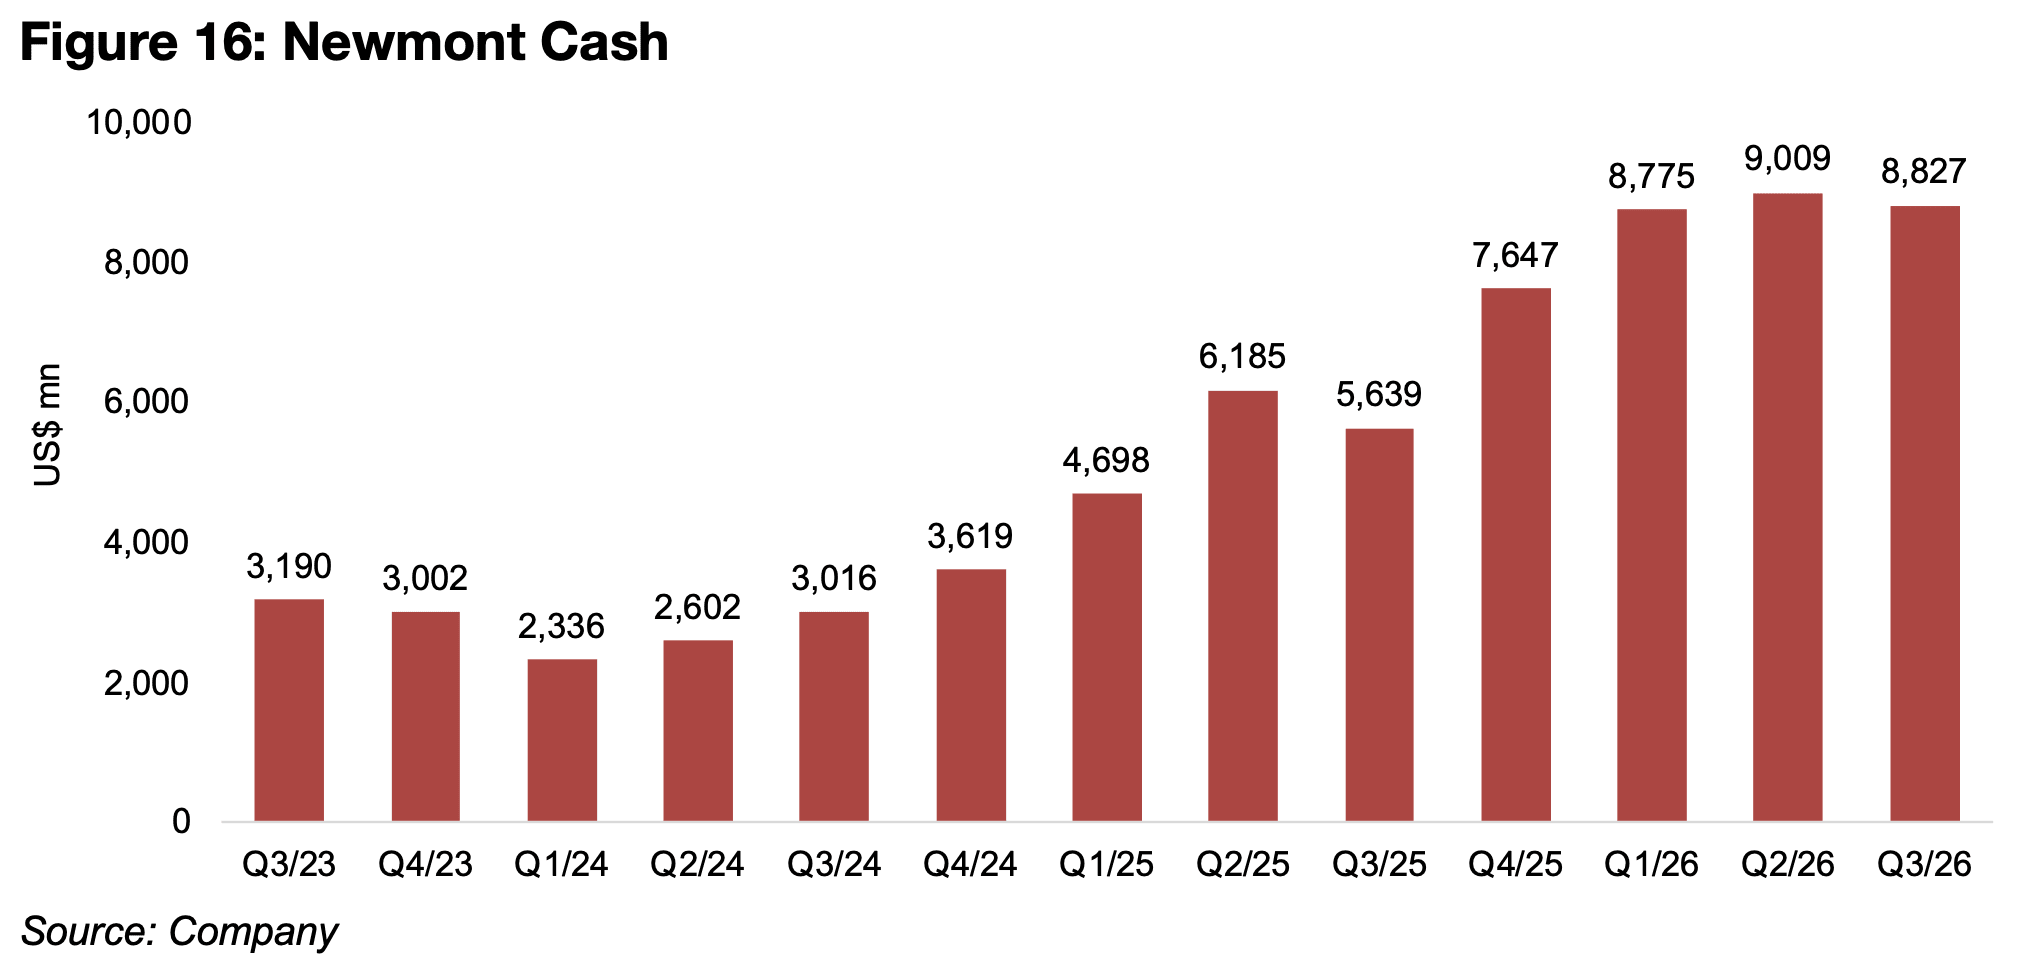
Net income actually rose qoq to US$2.5bn from US$2.2bn in Q2/26, which was dragged down by some exceptional items, and was up significantly yoy from US$1.8bn in Q3/25 (Figure 15). However, this is still down from the US$3.3bn peak in Q1/26, when there was a speculative surge in the gold price and energy costs were subdued with the Middle East war only starting in the last month of the quarter. The company’s cash edged down qoq, but has remained around US$9.0bn for the last three quarters, providing significant capacity for acquisitions, including of junior miners, even after any return of cash to shareholders through dividends (Figure 16).
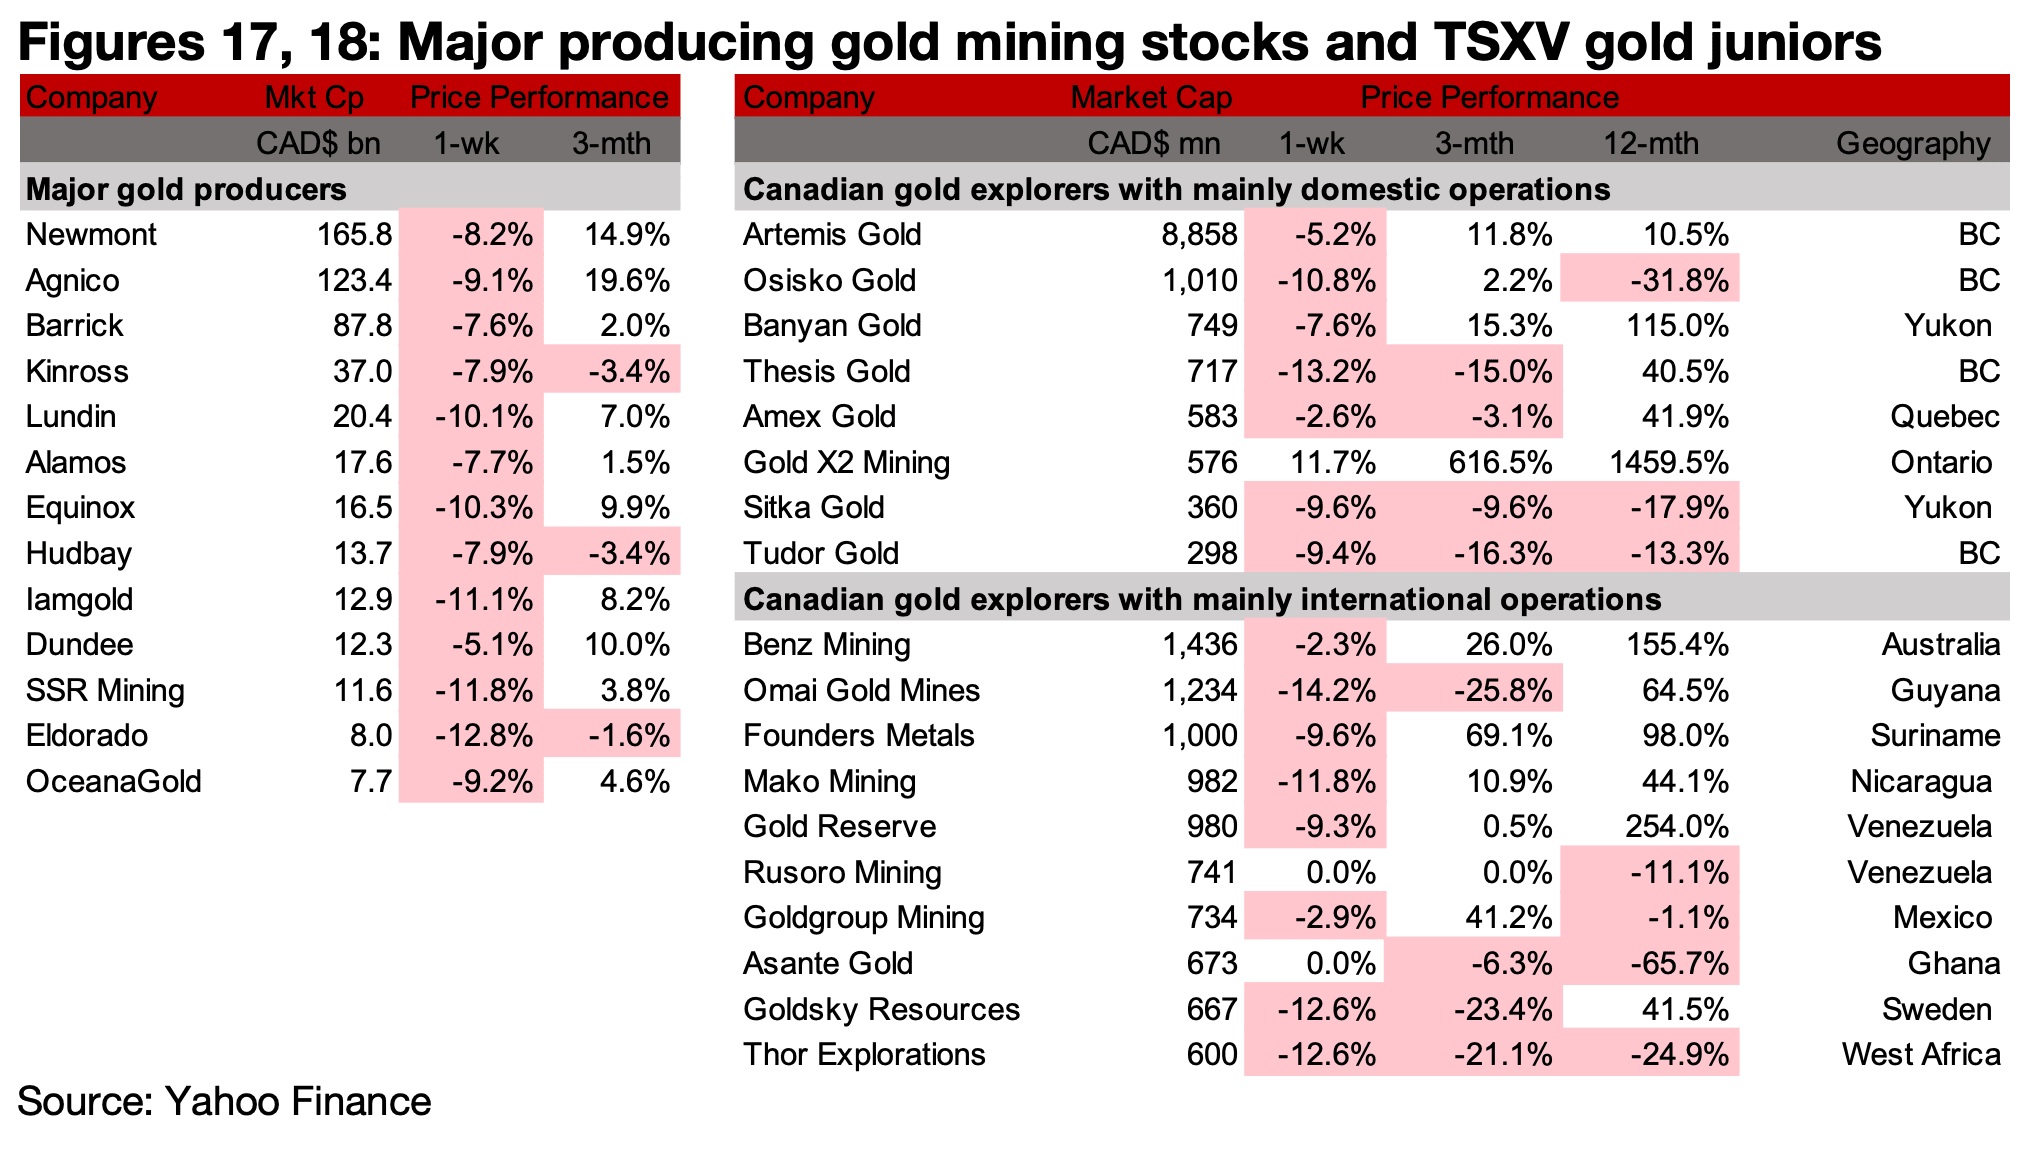
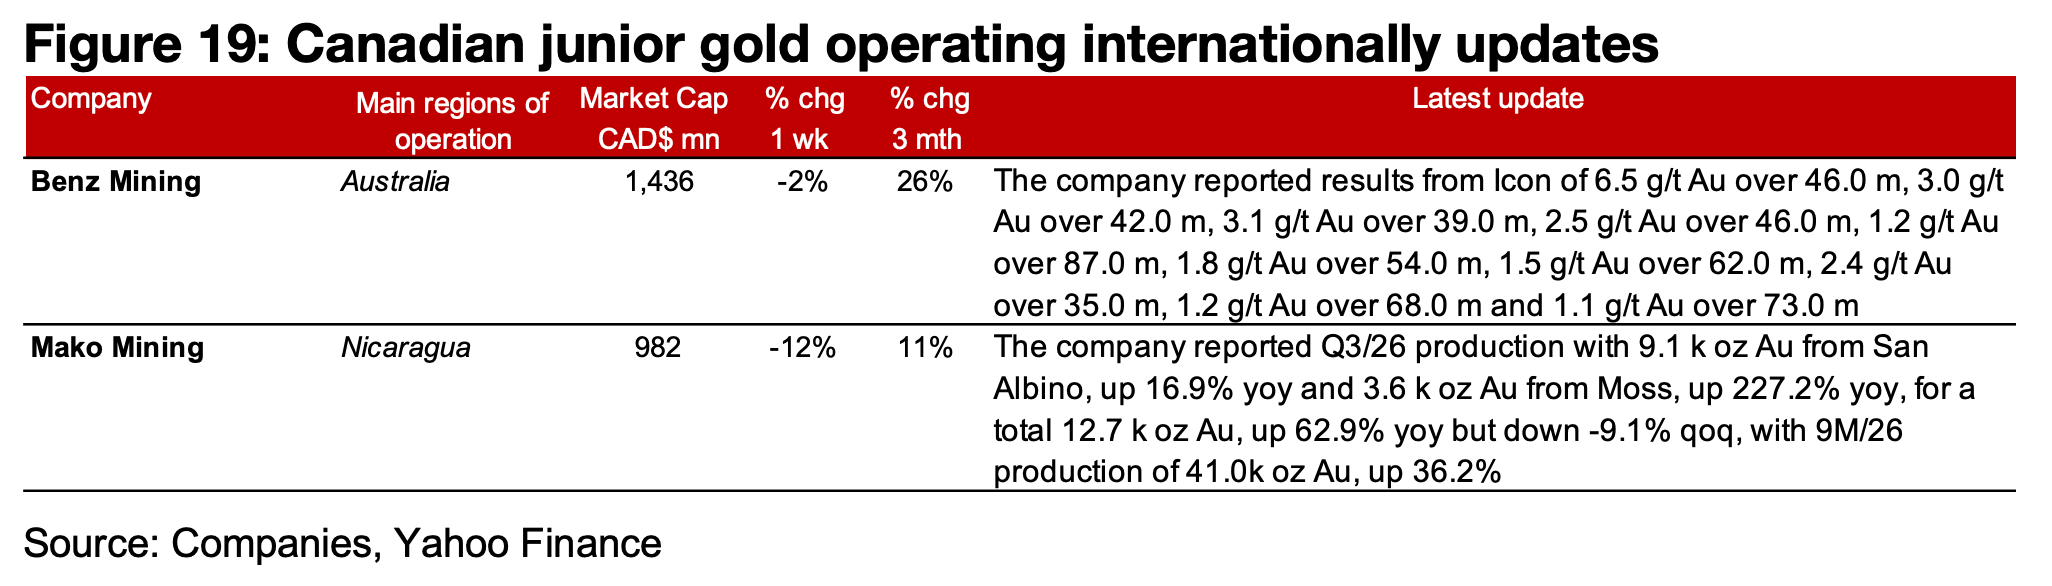
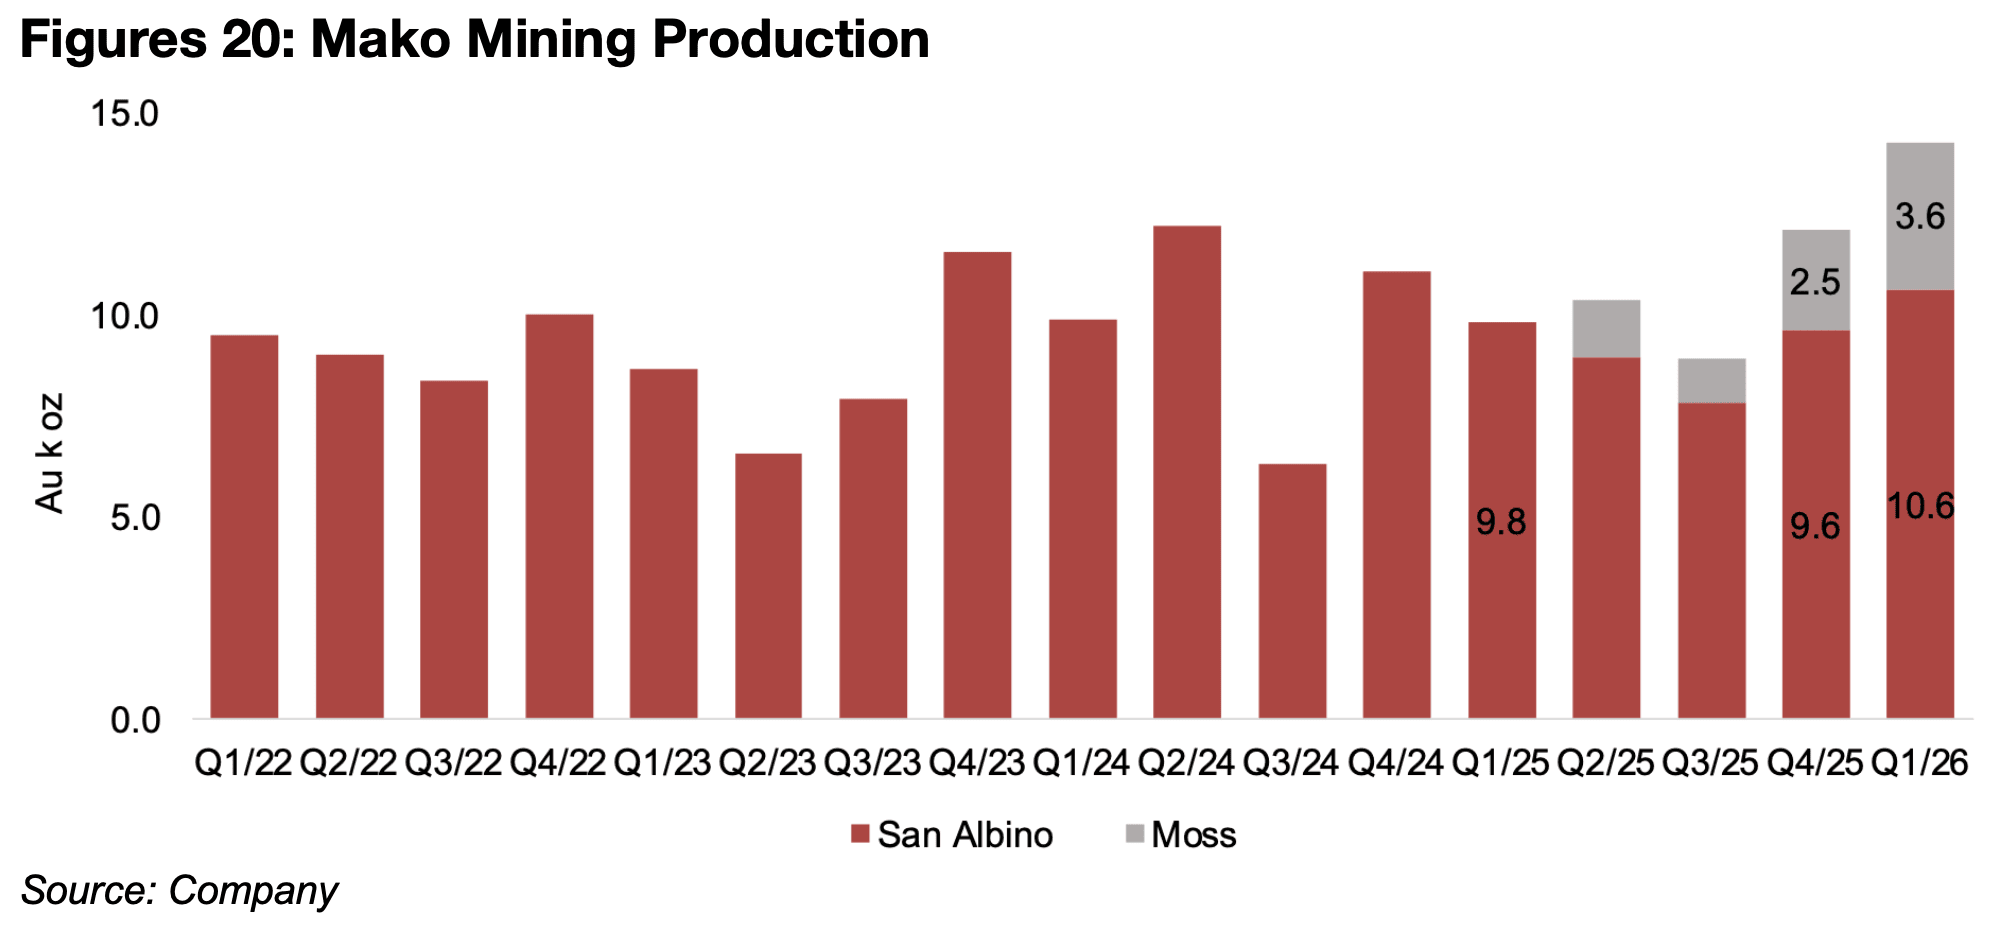
All of the major producers and most of large TSXV gold crashed on the metal price plunge (Figures 17, 18). For the TSXV gold companies operating mainly domestically, there were no major press releases. For the companies operating mainly internationally, Benz Mining reported drill results from Icon and Mako Making released Q3/26 production results (Figure 19). Mako’s total output for Q3/26 was 12.7 k oz Au, up 62.9%, with 9M/26 at 41.0 k oz Au, rising 36.2% (Figure 20). San Albino production was 9.1 k oz Au, up 16.9% but down -9.1% qoq, with throughput and recoveries near flat although average grades have declined with the proportion of stockpile processed higher compared to mine material. Production from Moss was 3.6 k oz Au, up 227.2% yoy, as recoveries were hit by longer solution return times from higher stacking lifts, which held back the supply of gold-bearing solution for processing. The crushing plant throughput was also below the expected rate on mechanical and other operational issues, and the company has now completed maintenance that should increase production rates.
Disclaimer: This report is for informational use only and should not be used an alternative to the financial and legal advice of a qualified professional in business planning and investment. We do not represent that forecasts in this report will lead to a specific outcome or result, and are not liable in the event of any business action taken in whole or in part as a result of the contents of this report.
Author
Ben McGregor authors the Weekly Roundup at CanadianMiningReport.com, providing sharp analysis of the metals and mining sector. With a talent for spotting trends, Ben distills complex market shifts into clear, engaging insights on TSXV junior miners. His weekly updates cover gold, copper, uranium, and more, blending data-driven perspectives with a knack for identifying opportunities. A vital resource for investors, Ben’s work navigates the dynamic junior mining landscape with precision.