

July 20, 2026
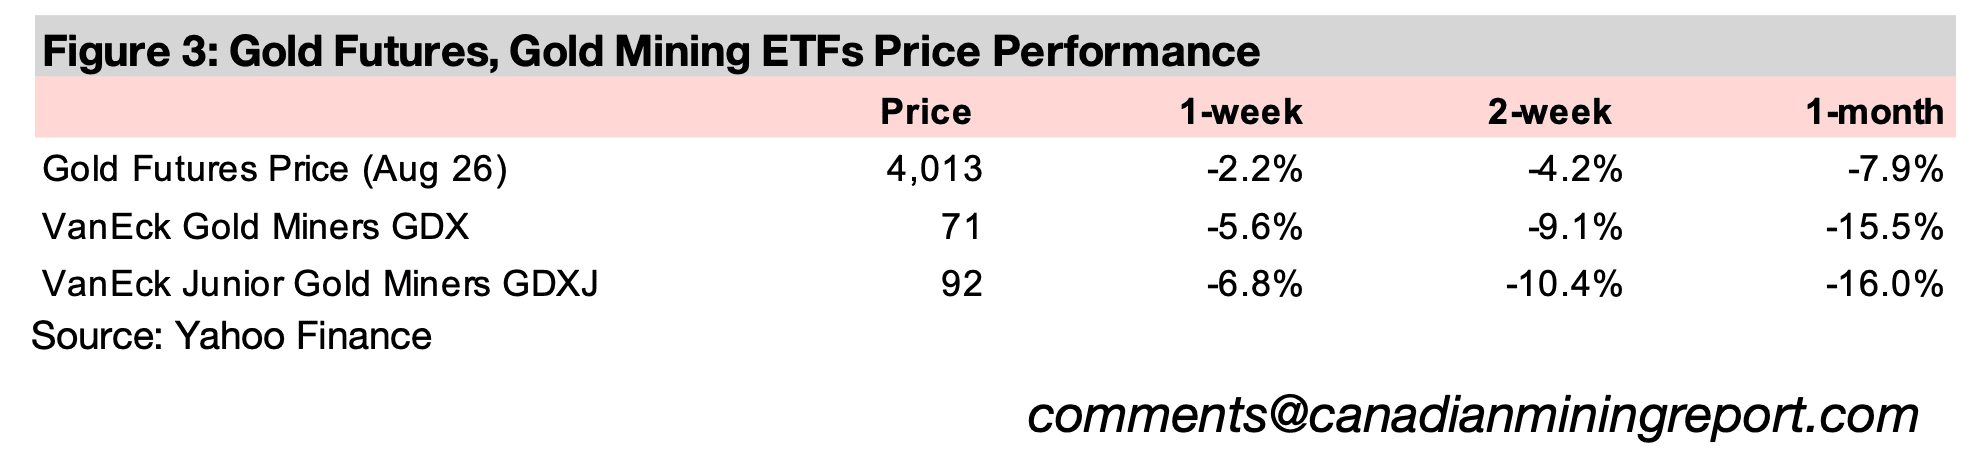
Gold declined -2.2% to US$4,013/oz, hitting new lows for the year of US$3,986 midweek before a slight recovery, with a major drop in US inflation apparently offsetting upside drivers including a falling US$ and yields and spike in geopolitical risk.
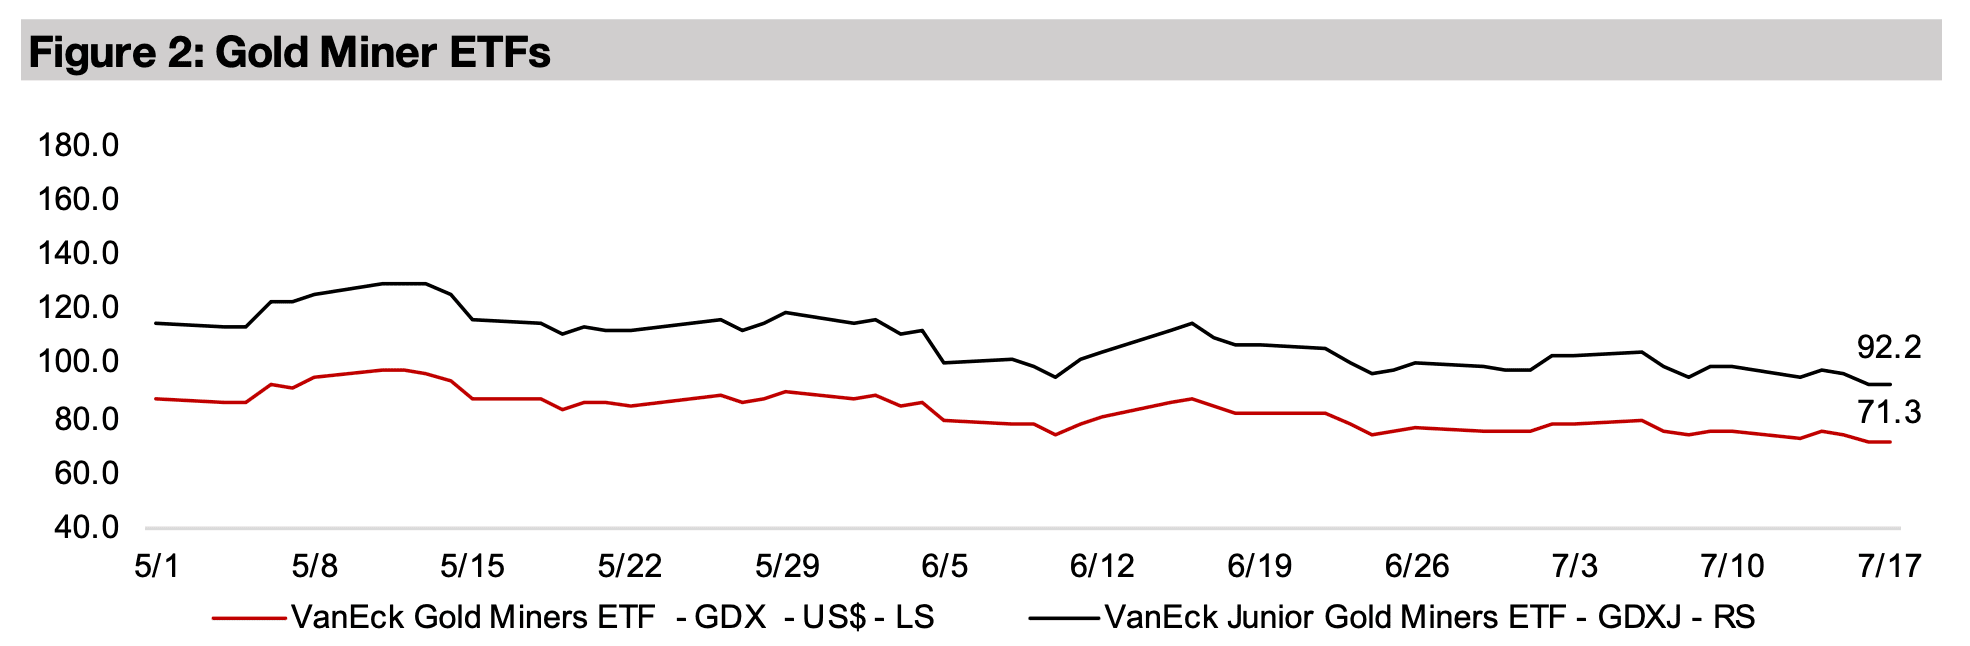
The gold stocks hit their lows for the year on the fall in the metal price, with the GDX down -5.6% and GDXJ losing -6.8%, below the drop in equities, with the S&P 500 declining -1.2%, the Nasdaq off -2.2%, and Russell 2000 down -0.4%.


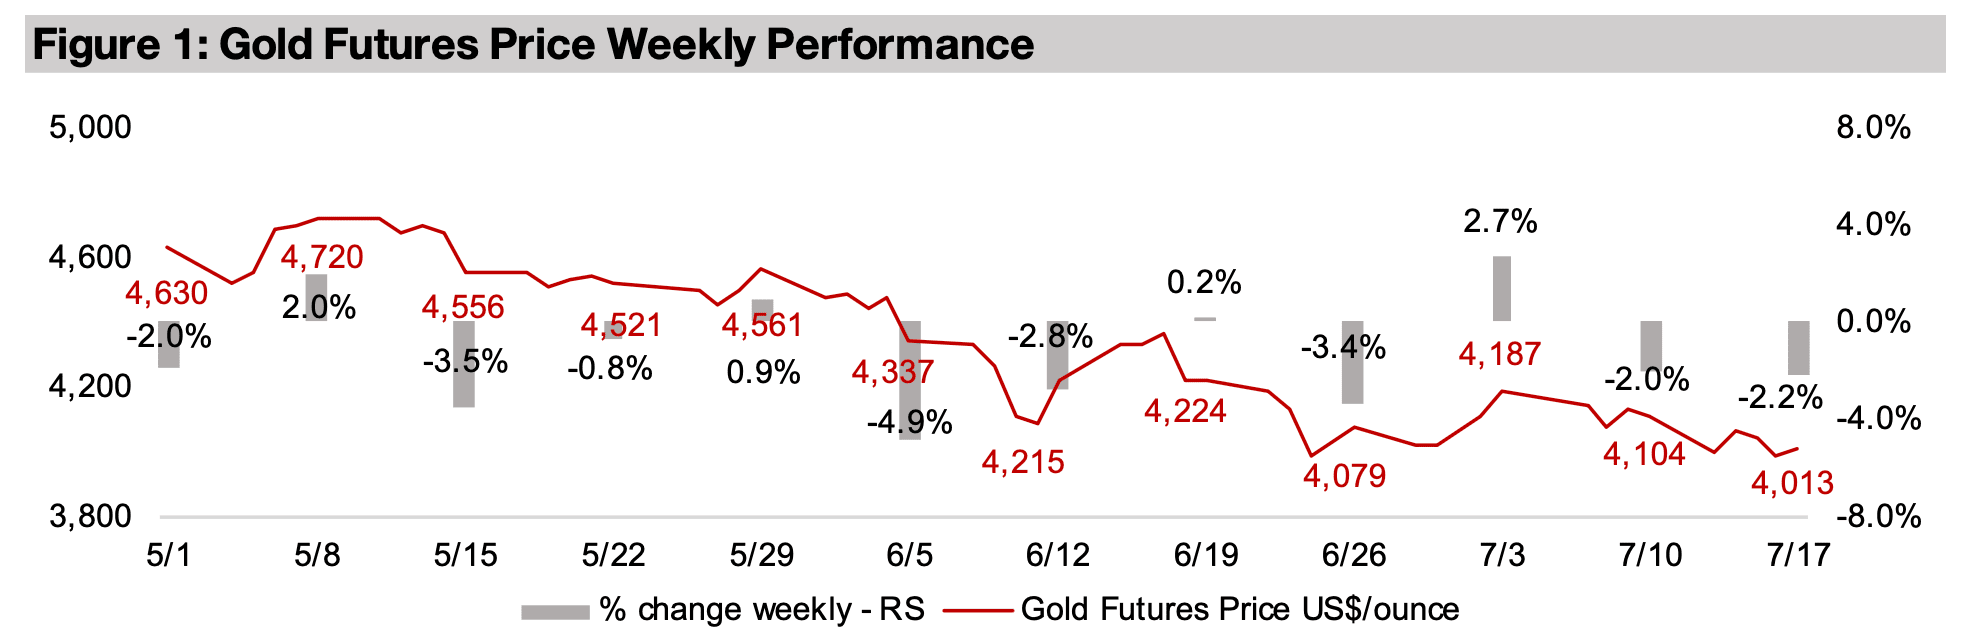
The gold price dropped -2.2% to US$4,013/oz, briefly hitting new lows of
US$3,986/oz for the year before recovering above the key US$4,000/oz level,
apparently driven by the huge drop in US inflation reported for June 2026. Even with
this leading to declining expectations for rate hikes, large cap equities dropped, with
the S&P 500 losing -1.2%, mainly on tech weakness as the Nasdaq fell -2.2% on
contagion fears after the severe slump in South Korea driven by semiconductor
stocks. While there was also a decline in small caps, it was more moderate, with the
Russell 2000 down just -0.4%. The gold stocks continued their downtrend to new
lows for the year, with the GDX sliding -5.6% and GDXJ losing -6.8%.
Gold’s recent moves have suggested some incongruence in the market’s view on the
metal, with it seeming to decline regardless of the direction of the underlying
fundamentals. The market’s thesis prior to this week appeared to be that rising
inflation was driving a higher probability for US rate hikes, implying higher US$ and
real yields, and a lower gold price. There had also been expectations that the Middle
East conflict could cool, putting further pressure on the metal.
With the US$ and yields declining this week on the lower inflation, and geopolitical
risk spiking, staying consistent with this outlook would have seen the market move
back into gold, rather than reducing positions in the metal. This could have been
because the market may have viewed the drop in the CPI as so severe that it simply
outweighed these other effects, especially with inflation, and its underlying cause,
monetary expansion, a critical driver for gold long-term. However, if inflation was such
a concern, we would have expected to see more weakness in the metal in June 2026
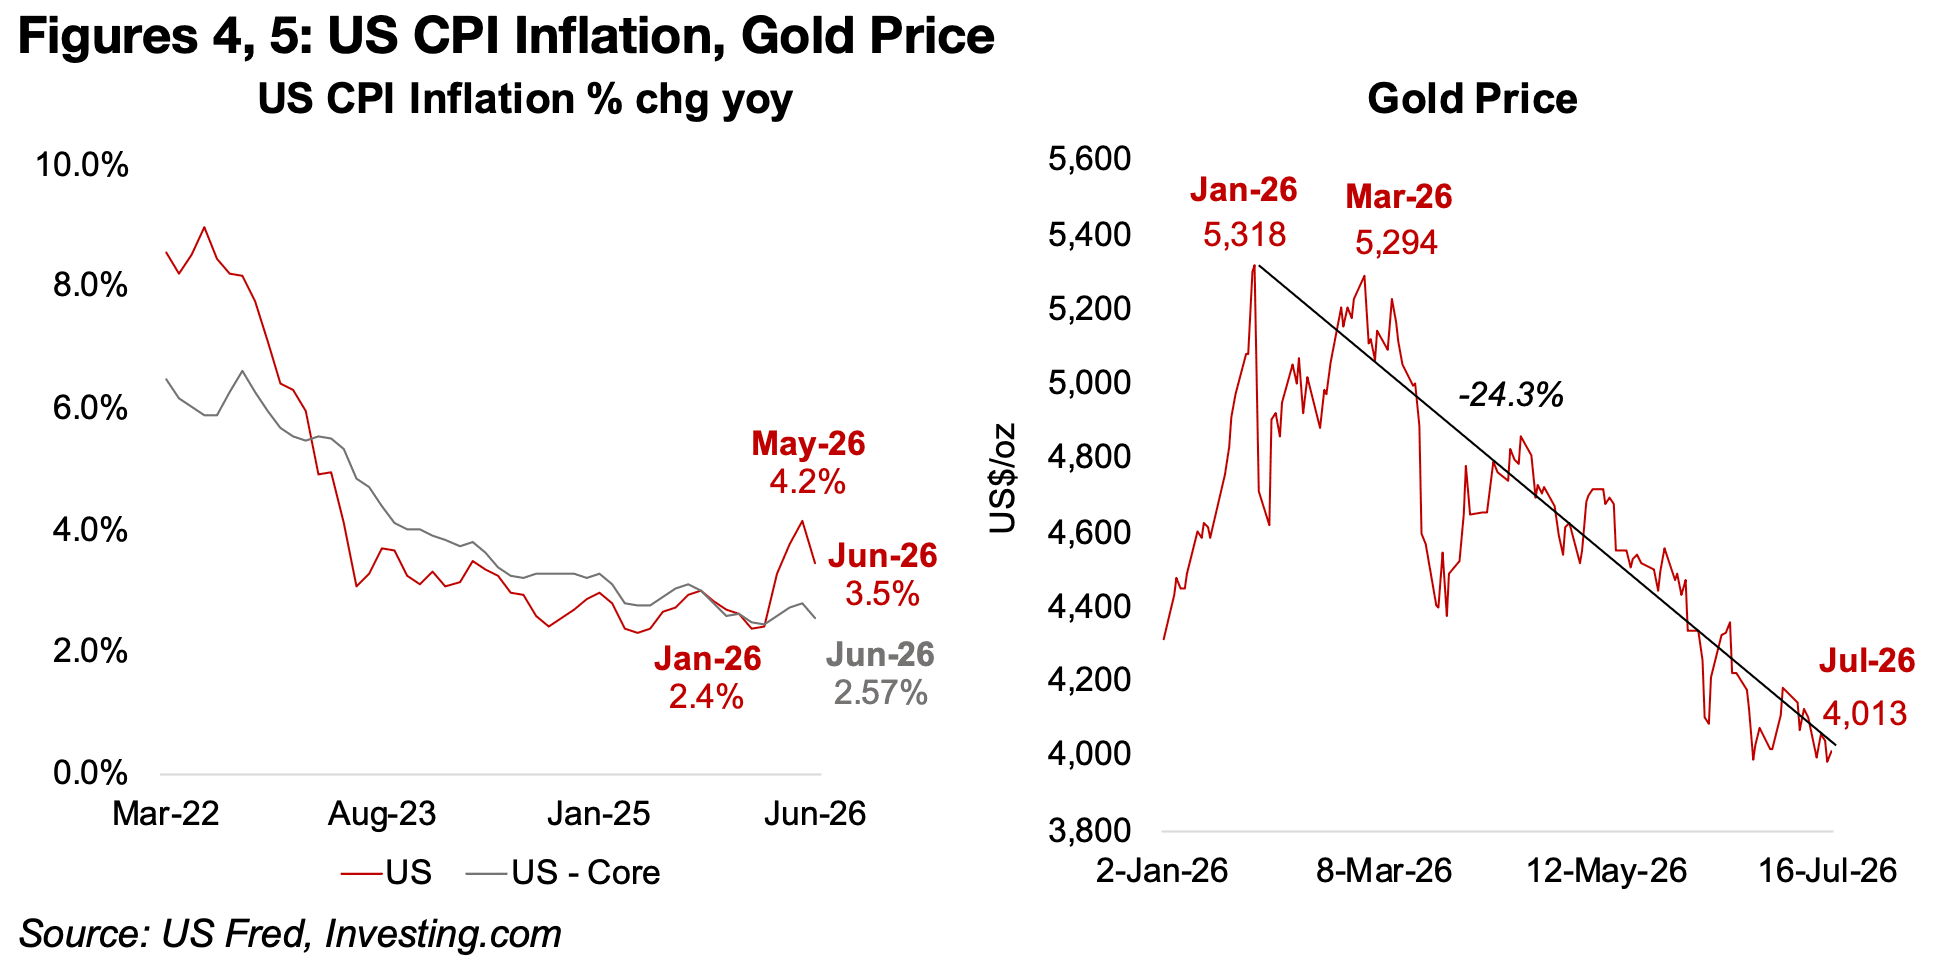
when a 4.2% yoy jump in the May 2026 US CPI was reported (Figure 4).
Another part of the explanation for the slide in gold could be that even though there
was a major decline in inflation in June 2026 to 3.5% from the energy price-driven
spike in May in 2026, it still remains relatively high versus the past year. So while rate
hike probabilities have declined in the immediate term, the market still expects them,
only somewhat later, with a 13% chance of higher rates at the July meeting, but 50.5%
by September and 79% by December.
With conflict in the Middle East racheting up this week, the market may also be
expecting that the decline in inflation proves temporary, and that oil prices are
heading back up, with crude oil rising 7.0% last week. Core inflation, excluding
volatile food and energy prices, also actually did not change that much in June 2026,
declining to 2.6% from 2.8% in May 2026, and it has remained relatively steady over
the past year. This could see markets less inclined to incorporate major declines in
inflation into its pricing of gold.
Another major issue beyond these fundamentals is that gold could simply still be consolidating from the excesses of late 2025 and early 2026. The short-term speculators, but also many retail investors, that drove that surge in the metal price are likely still largely out of the sector at present. This has come after a -24.3% decline in the gold price from the peak close in the futures price at US$5,318/oz at the end of January 2026 (Figure 5).
The investment banks, which had turned heavily bullish on the metal in early 2026,
another sign that gold had become an overcrowded and consensus trade, have
recently started to cut their targets prices for the metal. However, this could actually
be an indicator that the metal price may be nearing a trough given their track record
overall in estimating the gold price.
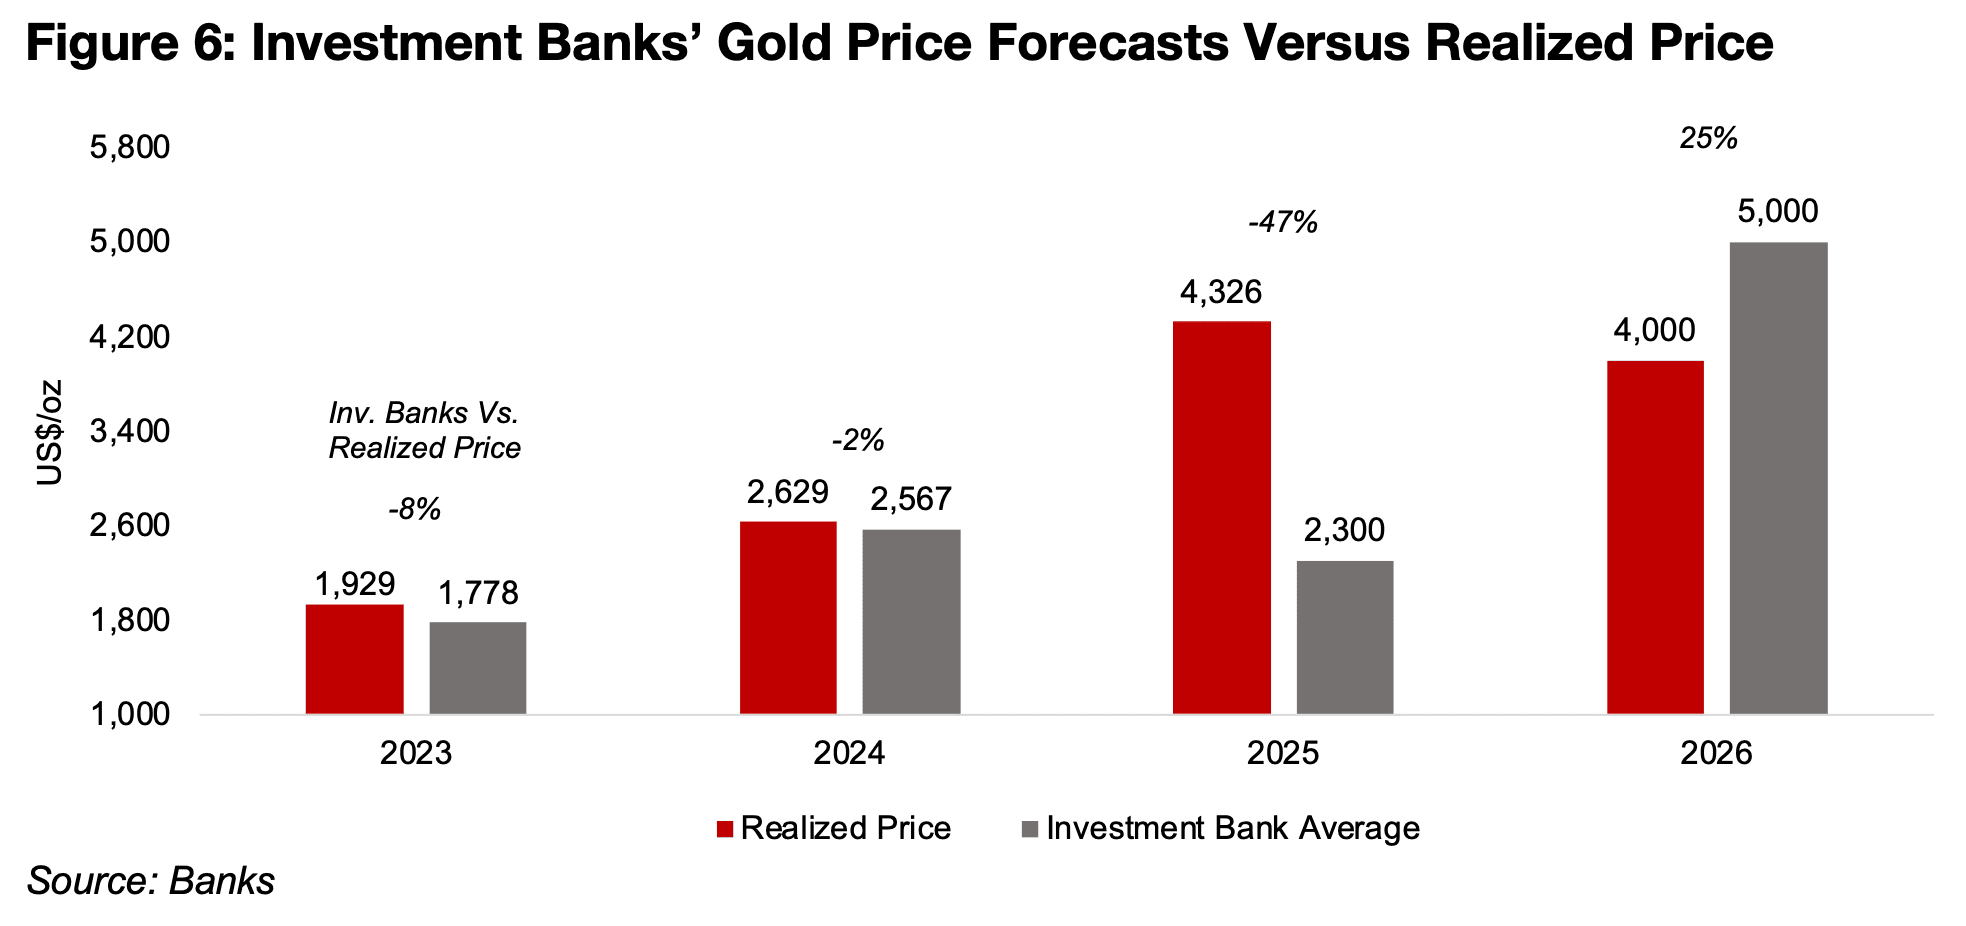
The forecasts from these banks overall strongly lagged the realized gold price through
the bull market from 2019-2025, by -8% in 2023, -2% in 2024 and -47% in 2025, and
only finally got well ahead of the price earlier this year, just before the plunge. They
are still on average targeting around US$5,000/oz for this year, having downgraded
on average by -6.1% from just over US$5,300/oz previously. With this average
estimate still 25% above the market price, we would not be surprised to see further
downgrades from investment banks if gold does not start to recover soon (Figure 6).
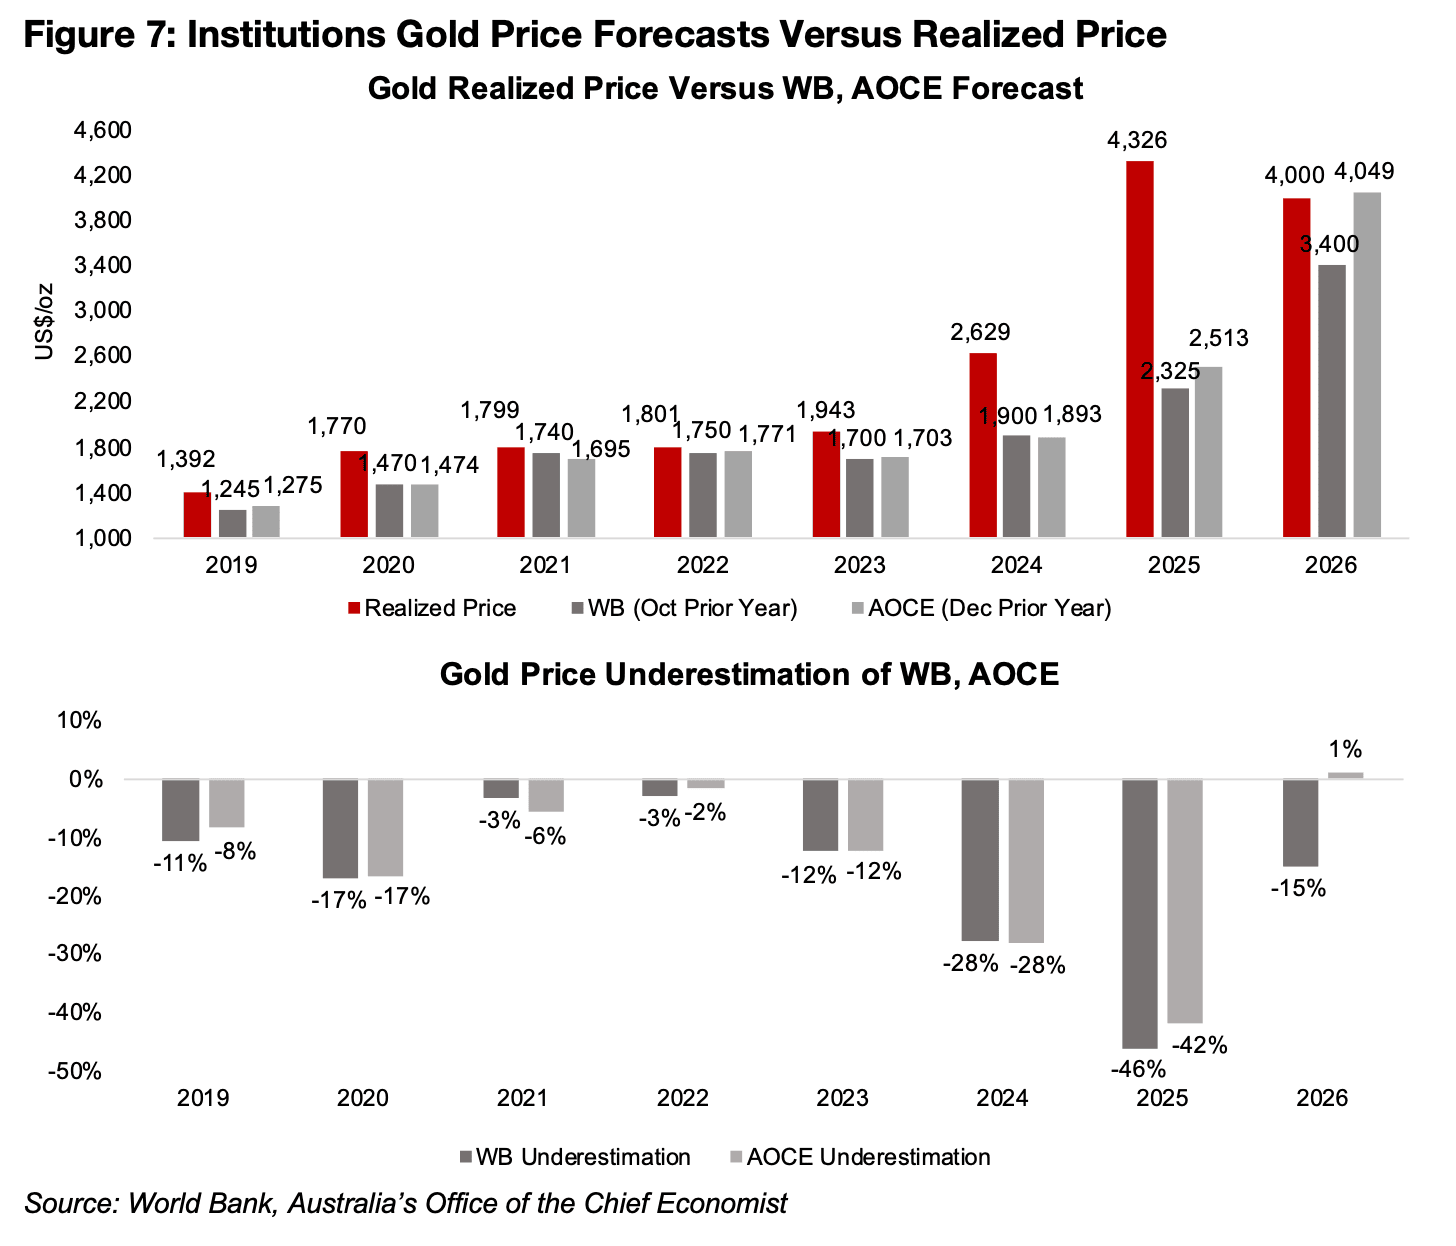
The major institutions with gold price forecasts, the World Bank and Australia’s Office of the Chief Economist (AOCE), have also substantially underestimated the realized gold price for the entire bull market from 2019 to 2025 (Figure 7). The closest they were to matching the metal price came in 2021 and 2022 when it held relatively flat. In contrast to the investment banks, their forecasts for 2026 have not moved above the gold price, with the World Bank still significantly below the current market level, and the AOCE estimate now almost exactly at the market price.
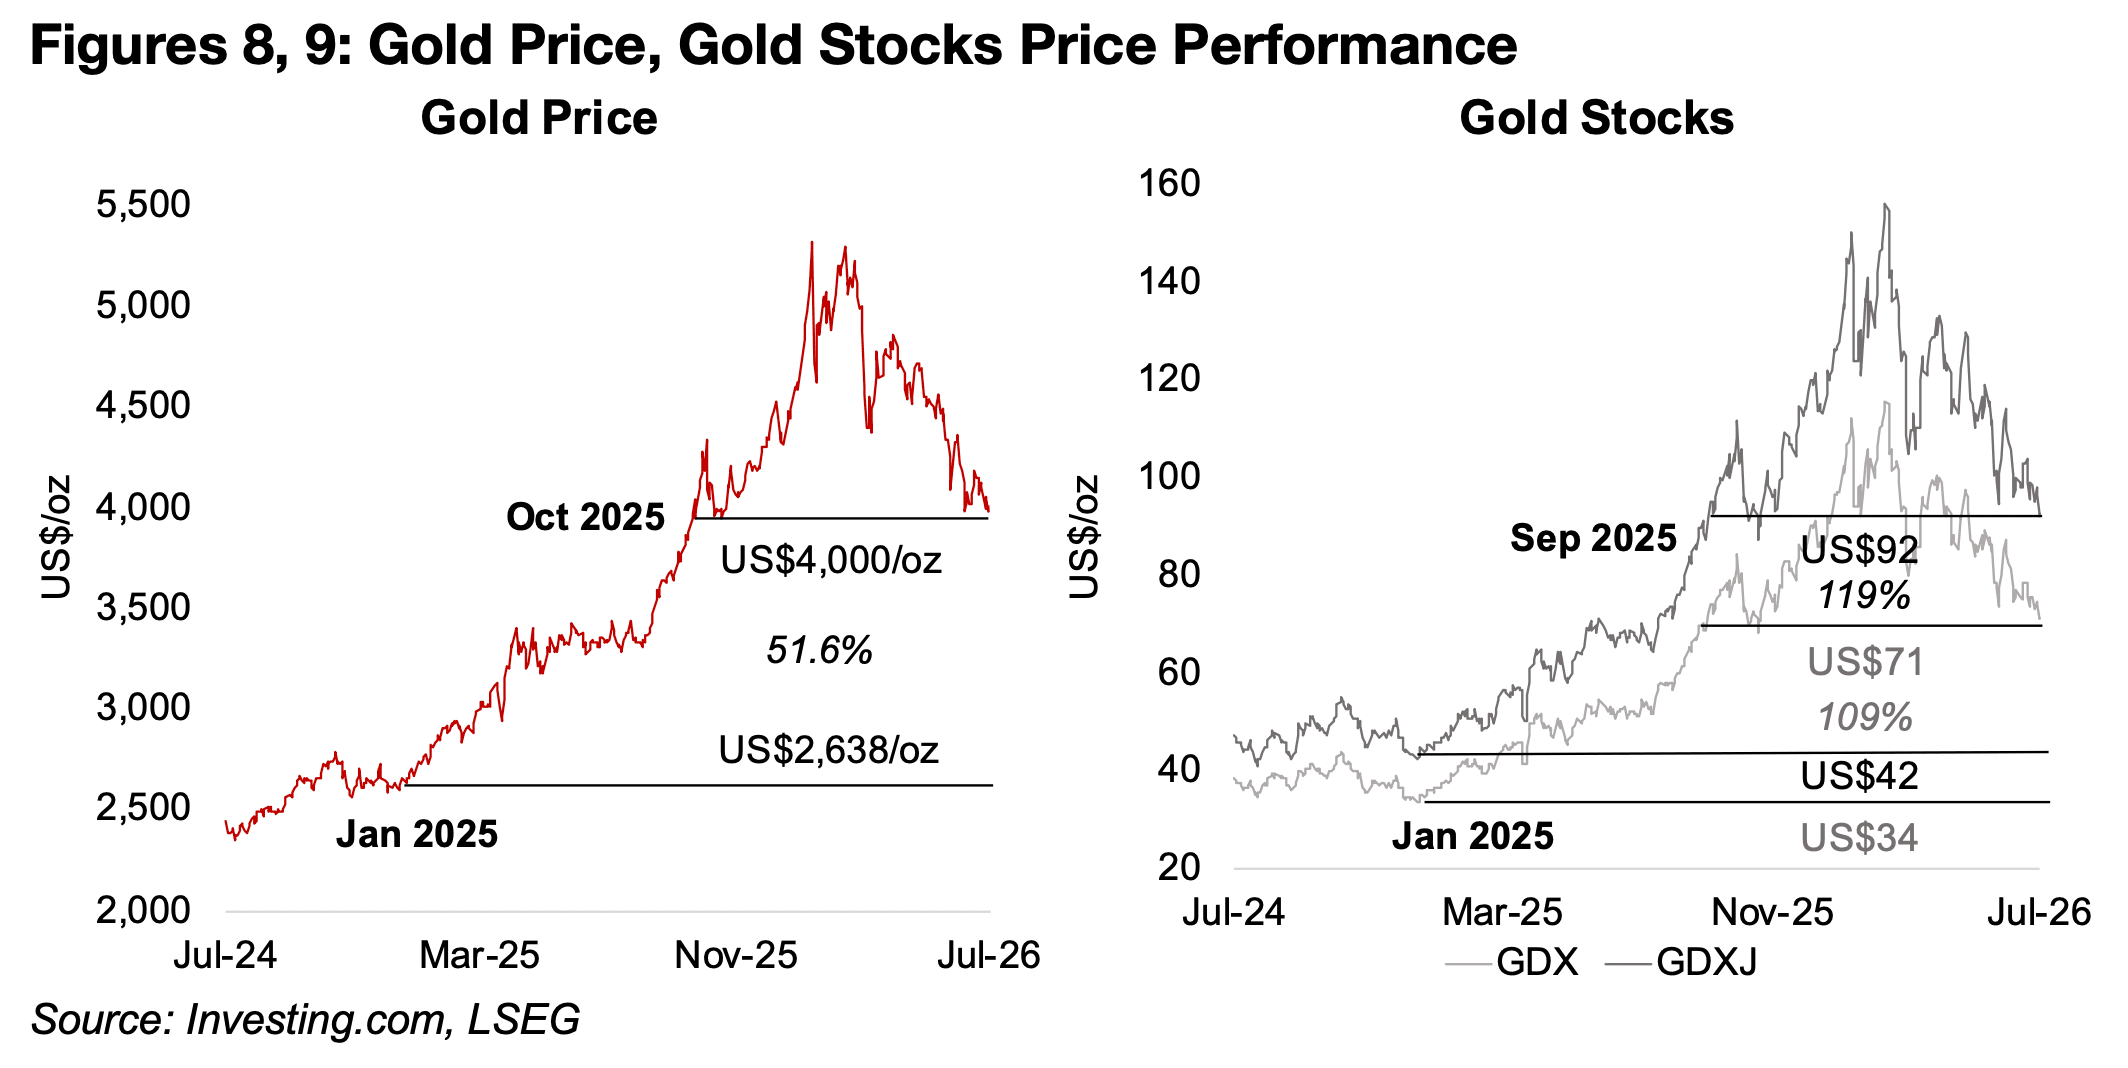
However, investors even holding gold for nine months have not made severe losses, and only purchases made in a relatively short period of December 2025 and January 2026 have faced major declines. Gold investments made during mid-2025 are still highly profitable and from January 2025 there has still been a 51.6% gain to US$4,000/oz from US$2,638/oz (Figure 8). There have been even larger gains for the gold stocks over the same periods, with the GDX ETF up 119% to US$92 from US$42 in January 2025, and the GDXJ ETF up 109% to US$71 from US$34 (Figure 9).
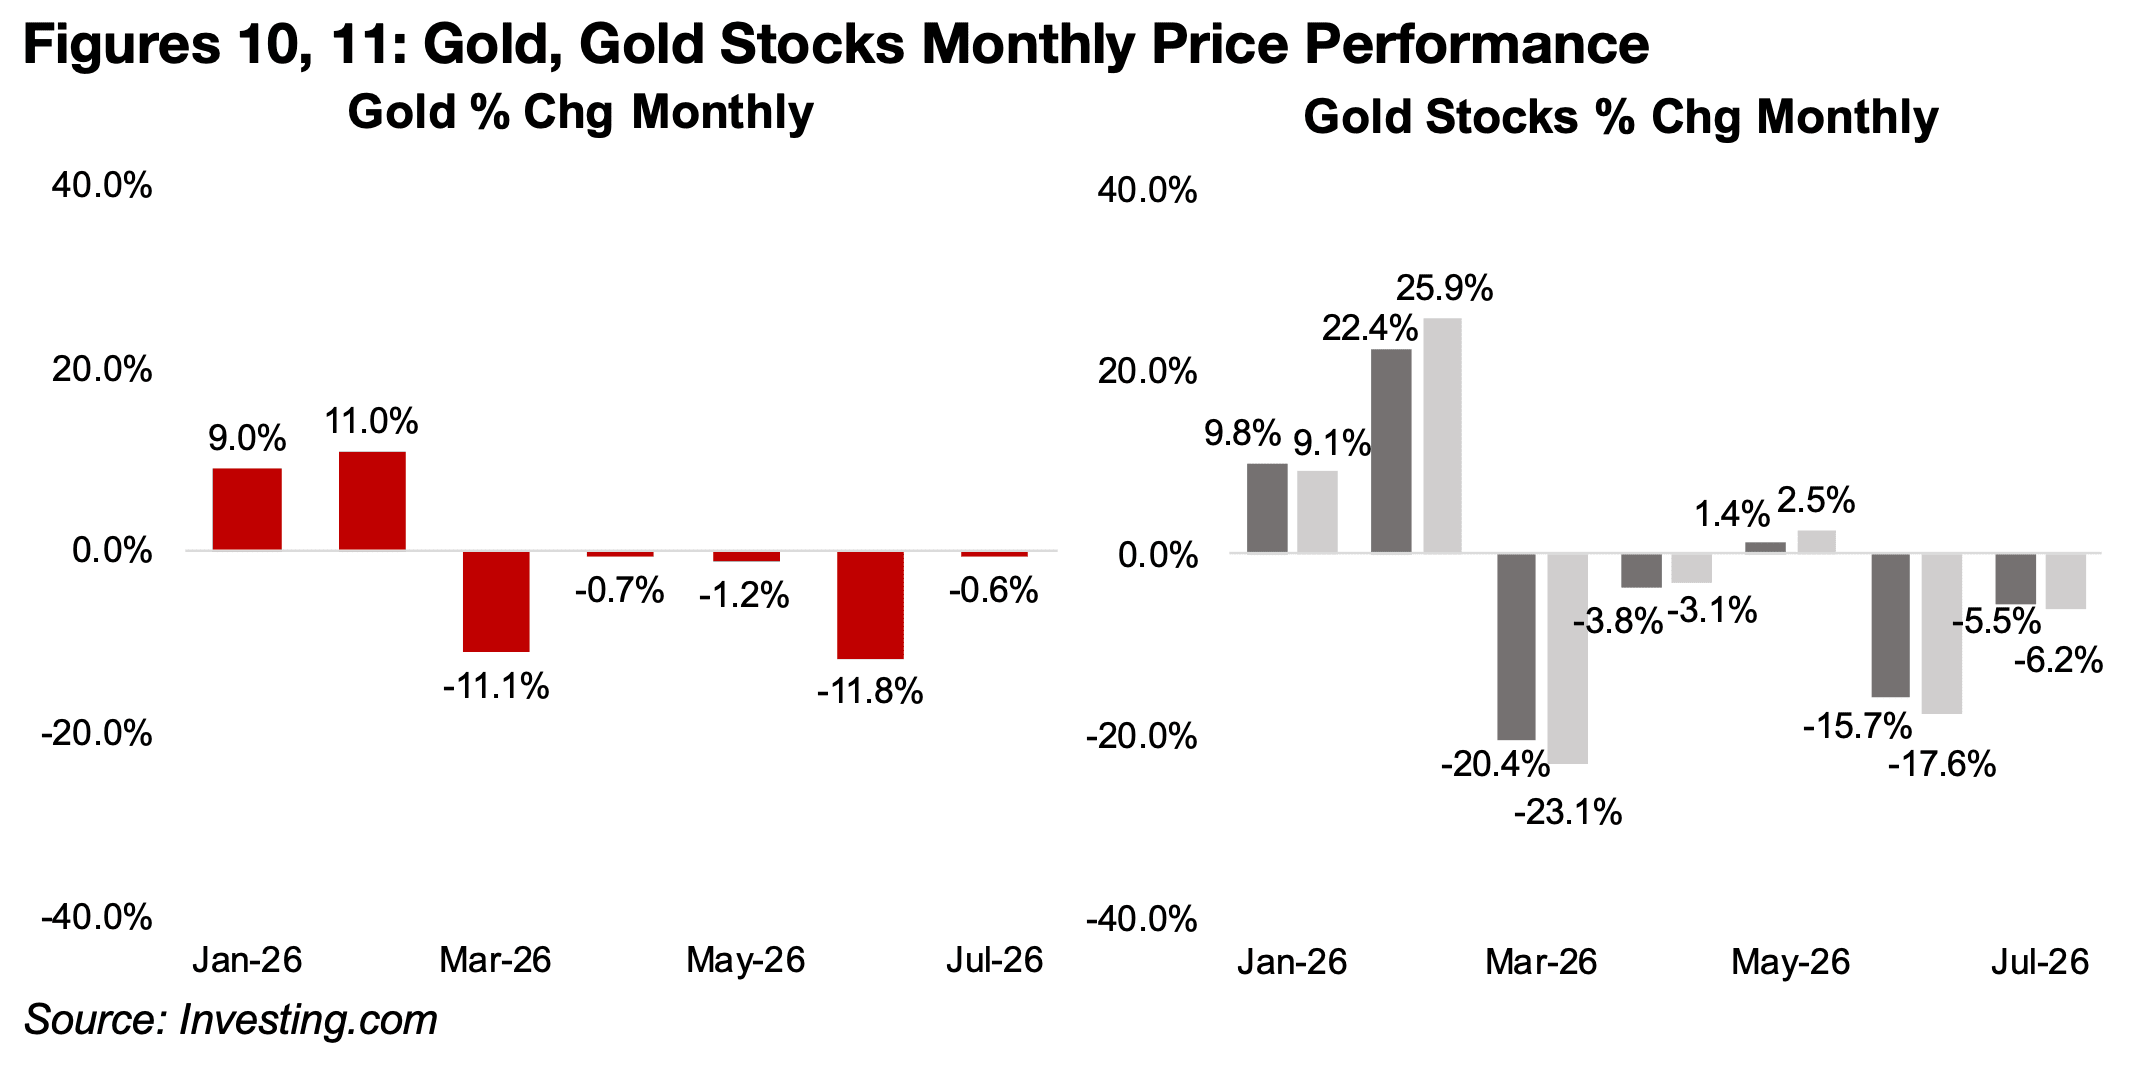
Even for traders looking to short the metal, the volatility has actually not been that
attractive, with gold declining around only -1.0% in April, May and so far in July 2026,
with major drops only in March and June 2026, by over -11.0% (Figure 10). Overall it
could be considered quite an orderly decline, and not indicative of a severe panic.
The gold stocks have seen a similar pattern, but with larger moves to the up and
downsides, as would be expected given that they are leveraged to the metal price.
The declines in GDX and GDXJ were below -5.0% for April 2026, they gained over
1.0% and 2.0% in May 2026 and have dropped over -5.0% in July 2026 (Figure 11).
The big declines were in March 2026, by over -20%, and in June 2026, by over -
15.0%, with a couple of rough months, but really no huge sustained plunge.
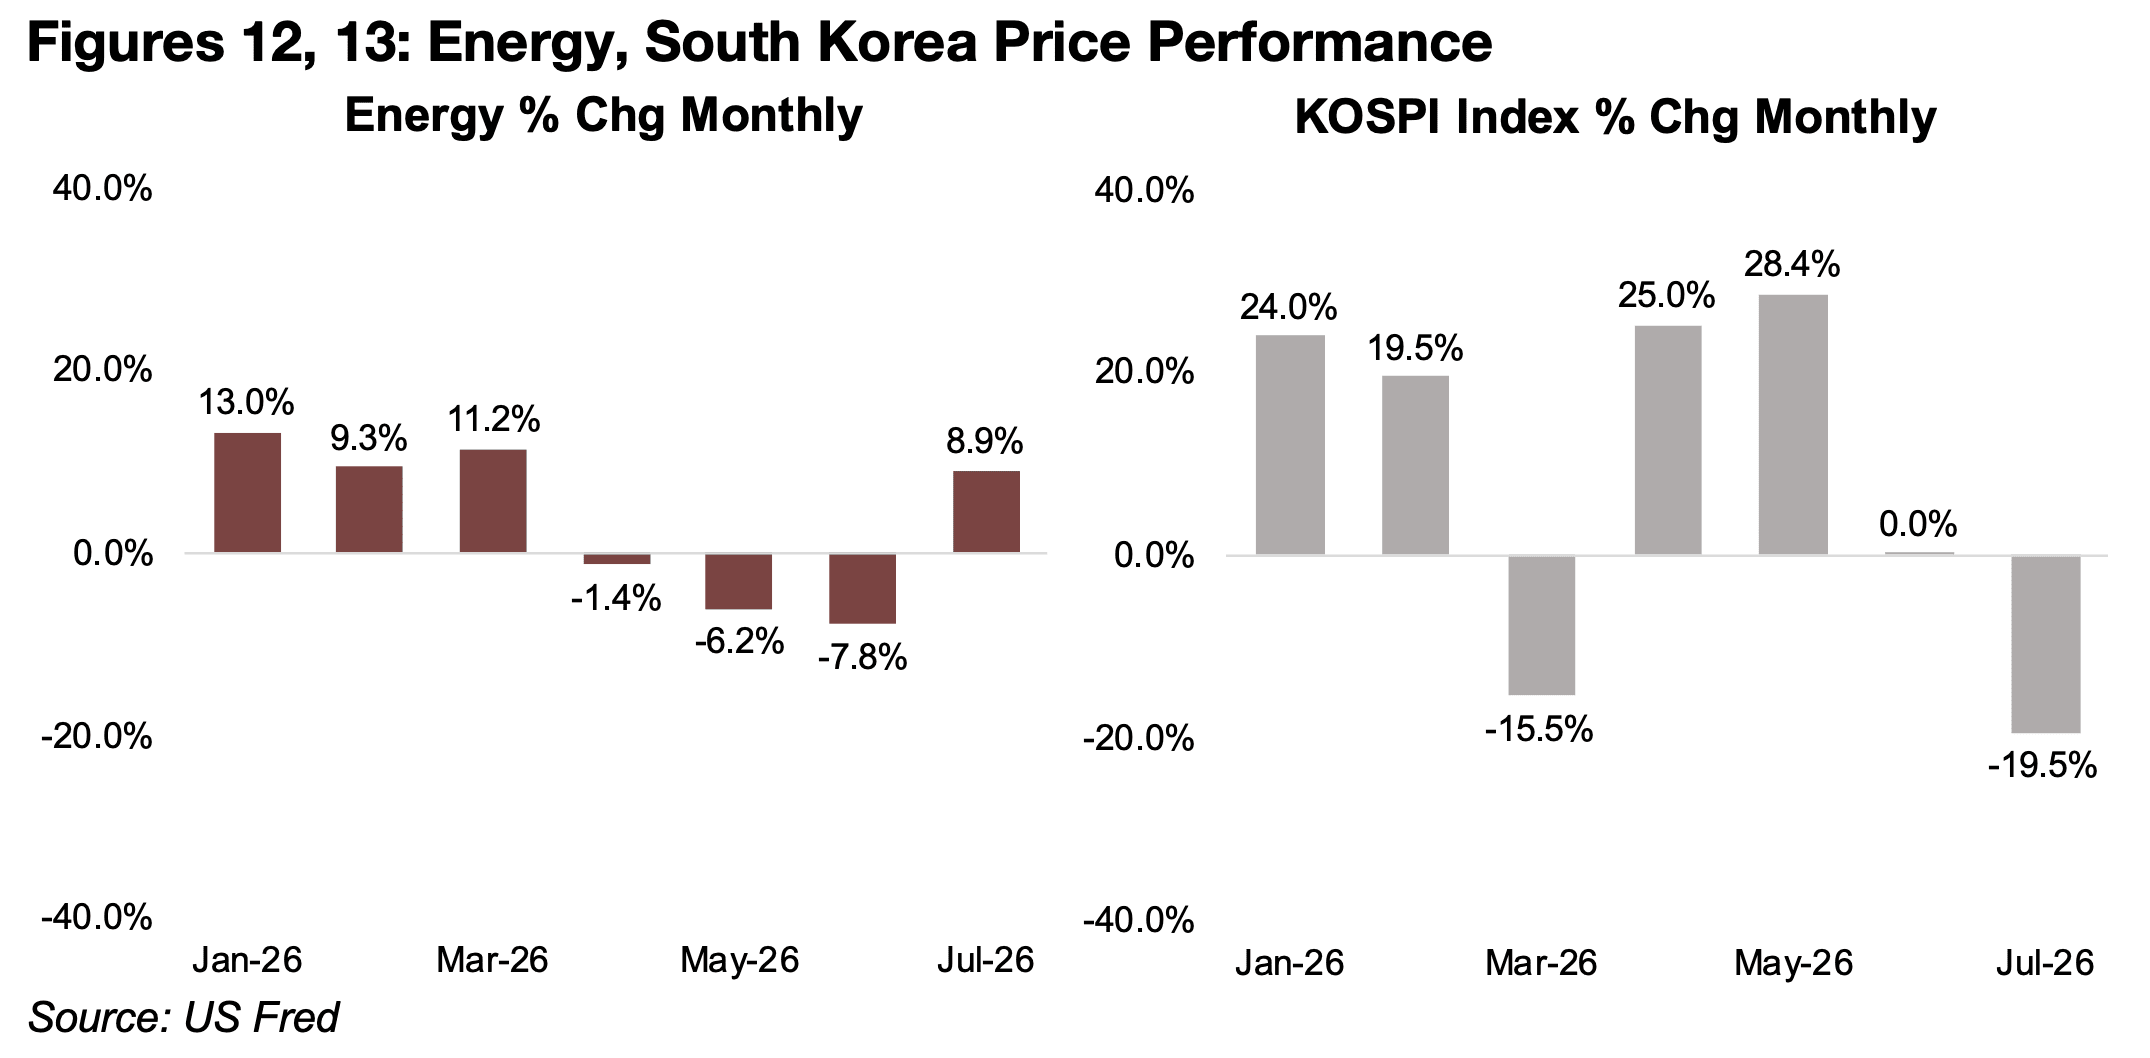
There has been a clearer trend for energy sector, with the first three months of the
year very strong, then a worsening pullback in each month of Q2/26 and a significant
rebound so far in July 2026 (Figure 12). The gains actually were not entirely driven by
the war, as the sector was already rising for two months before it started in March
2026, as the markets were rotating towards industries with lower valuations, including
energy, which still has multiples near the bottom of the global sectors.
The jump in oil in March 2026 obviously drove gains, but increasing hopes for a quick
resolution to the conflict over the next three months send oil prices back down. The
oil price and energy sector have rebounded this month as attacks in the Middle East
have started again.
Some of the most significant volatility this year is still coming out the tech sector, but
this has shifted towards East Asia, specifically South Korea, with a boom in its KOSPI
Index driven especially by just semiconductor stocks, Samsung Electronics and SK
Hynix, which have benefited from demand from the AI boom. This drove gains of
24.0%, 19.5%, 25.0% and 28.4% in January, February, April and May 2026
respectively, with one major down month of -15.5% in March 2026 (Figure 13).
However, there has been a huge slump in these companies as the market has started
to question the sustainability of the AI boom, leading to a flat June 2026 for the KOSPI
and then a -19.5% plunge so far in July 2026.
This does have significant implications for tech overall, as it is the first time that we
have seen a major crash in stocks related to the AI boom, and shows that the sector
is not invulnerable to a severe decline. These moves in South Korea also make the
movements in the gold price and gold stocks this year seem relatively subdued.
The gold price is unlikely to be hit much by a major decline in the tech sector, with it
almost entirely driven by monetary factors, with its demand from industry relatively
low. This contrasts with silver, with its demand split more evenly between monetary
and industrial factors. The metal with likely the largest exposure to tech is copper,
which has seen a major boost from data center demand to support the AI sector, well
ahead of aluminum, although the latter metal has also seen a more moderate boost
from the tech boom.
The other major metals, iron ore, nickel and zinc, have the majority of their demand
from the steel sector, and therefore are not exposed much to a decline in the tech
sector. In terms of total real estate and infrastructure demand for steel, the
contribution to demand for data centers or other tech construction on a global basis
is relatively small and could not considered to be a major driver. Therefore we would
not actually expect to see a severe hit to the metals segment from any further
weakness in the global tech sector.
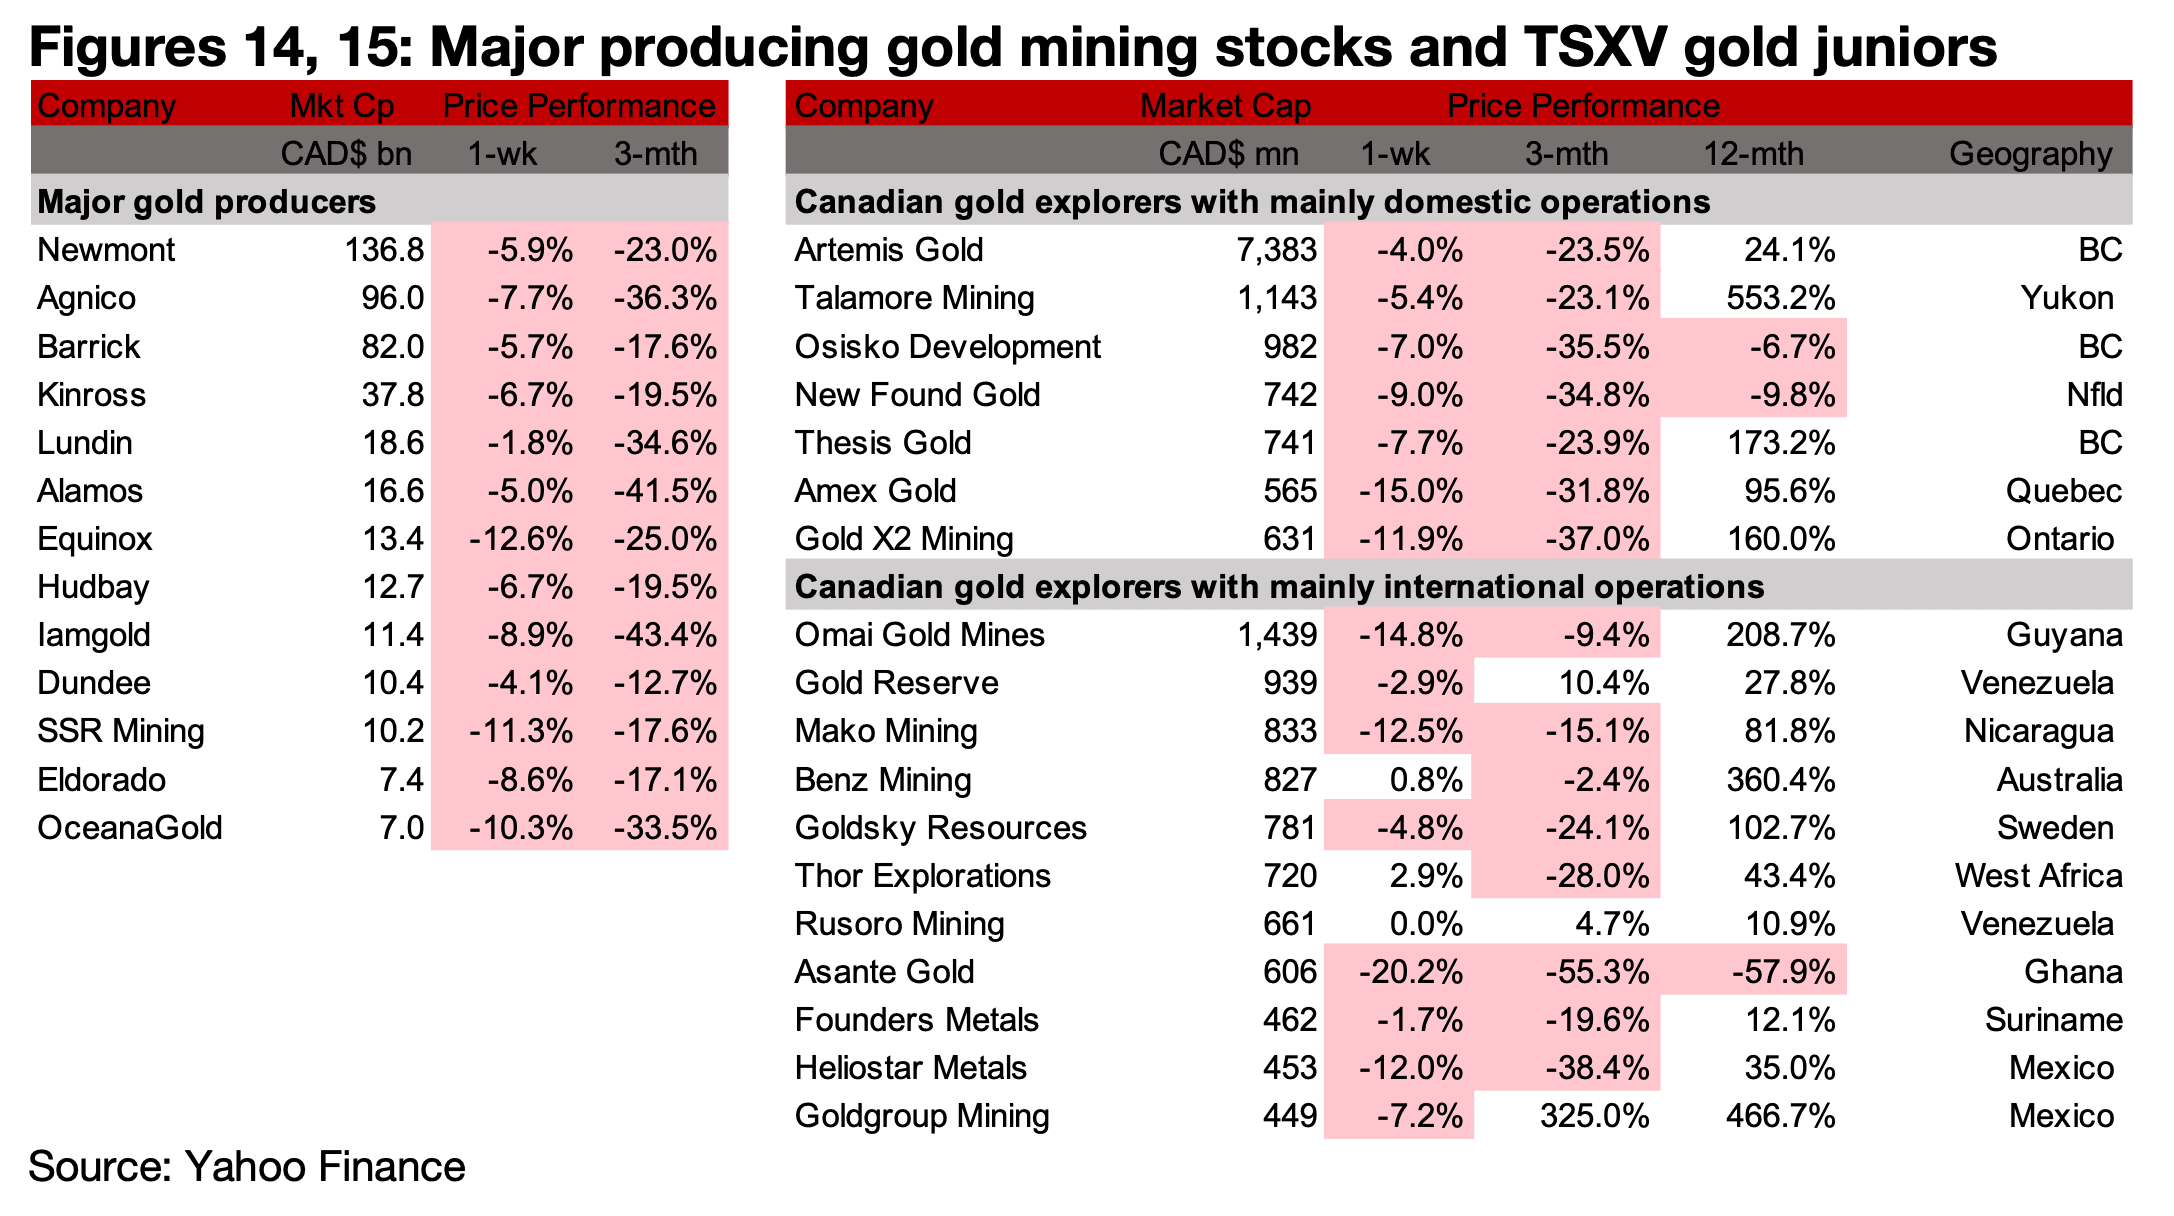
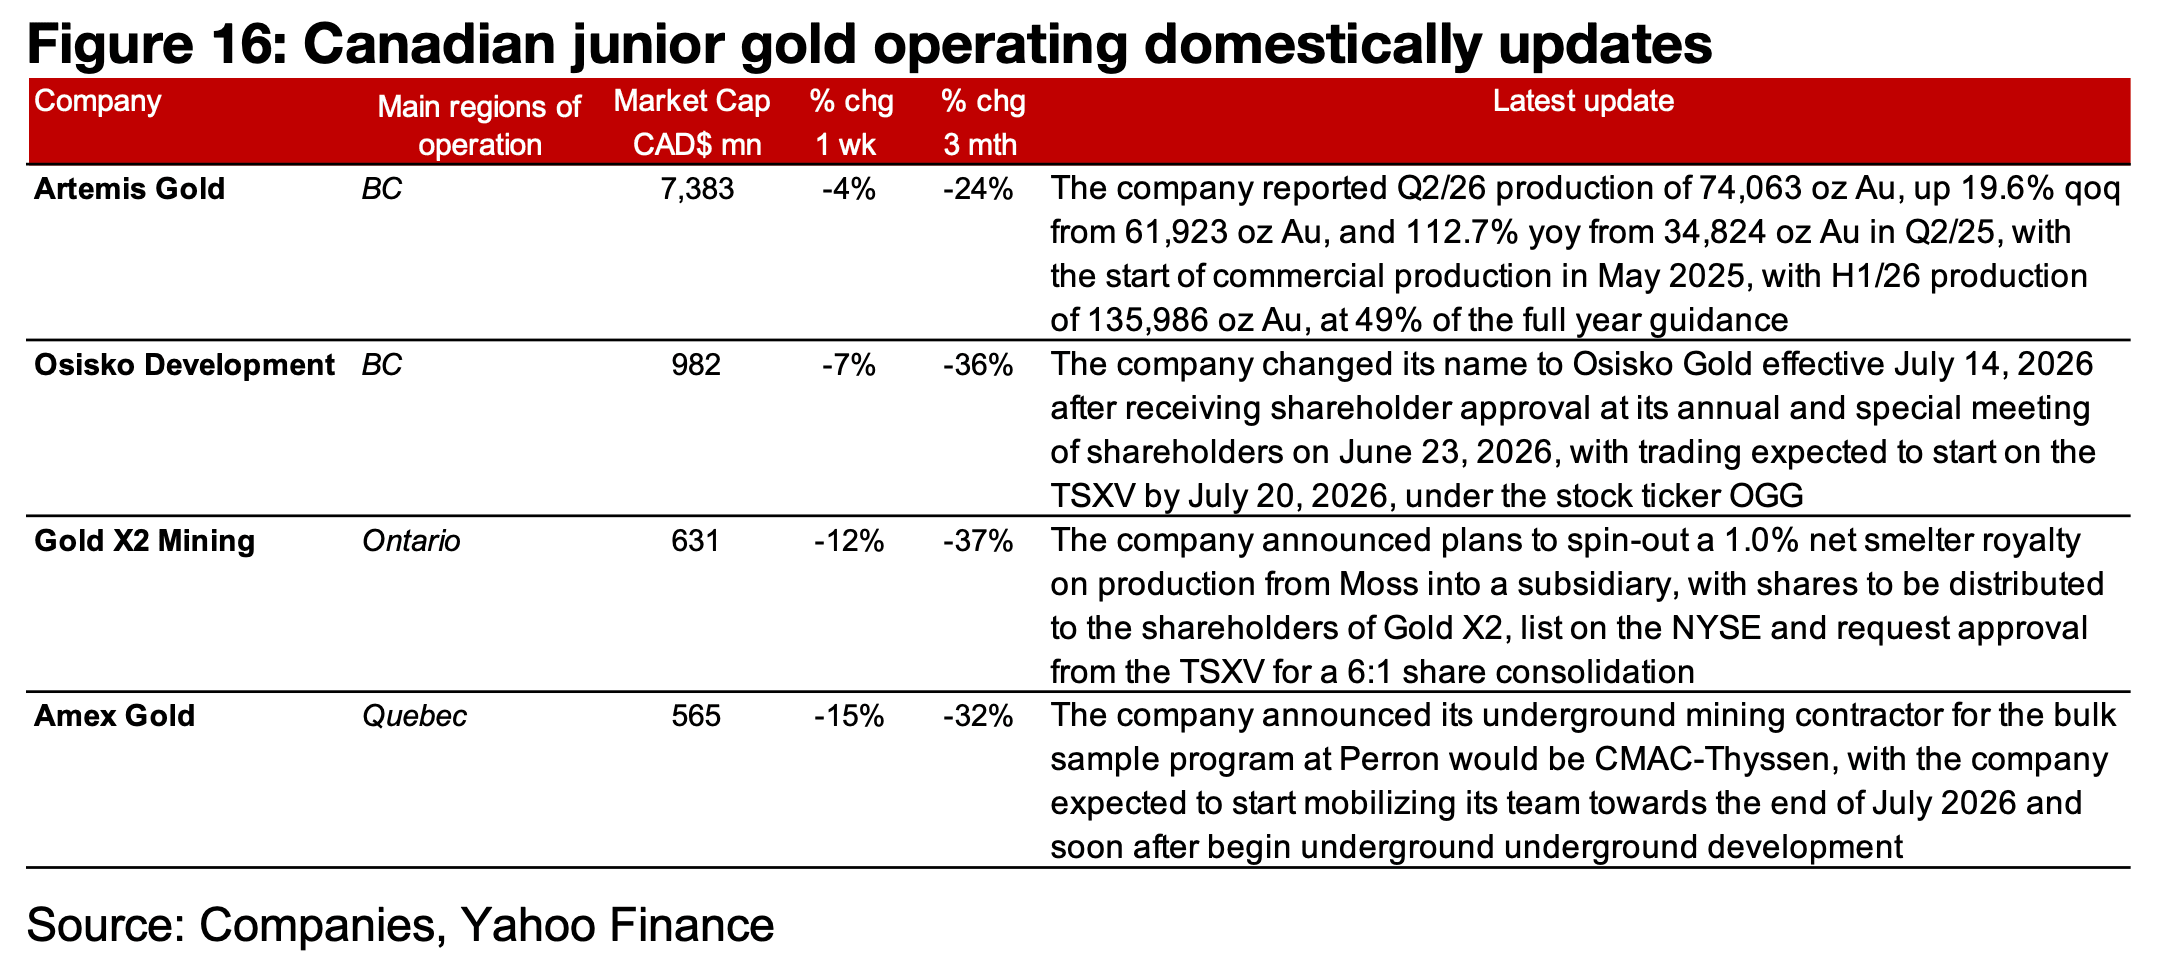
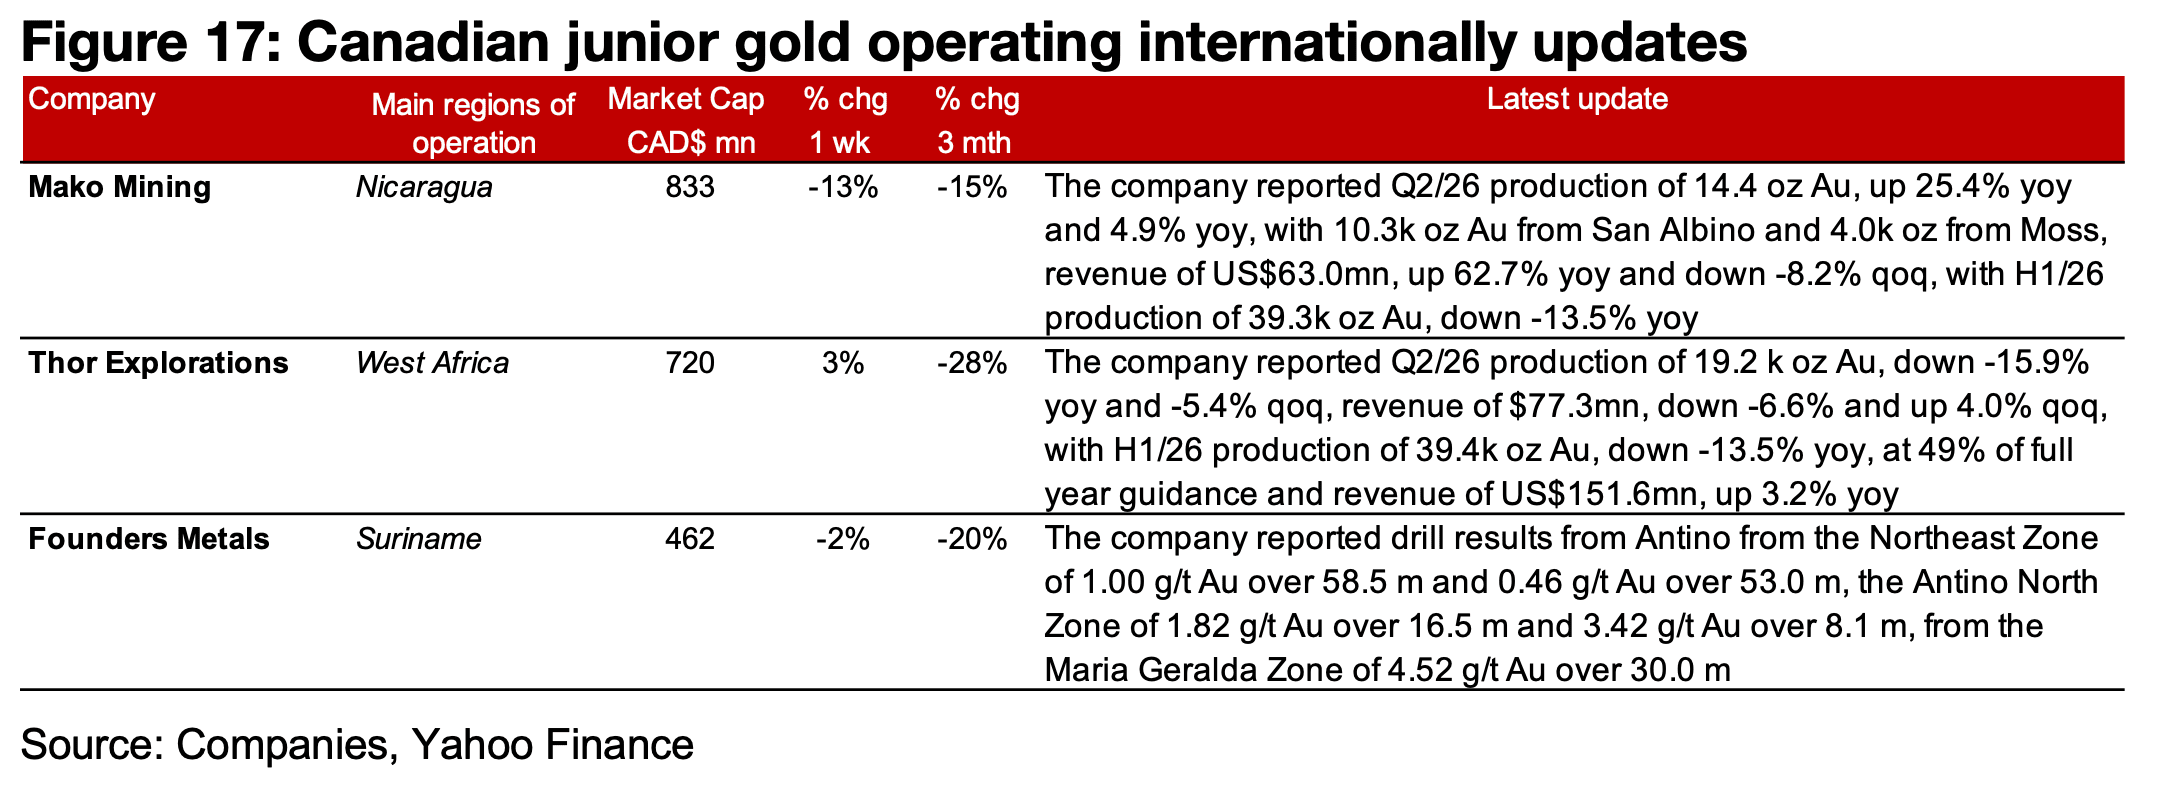
The major producers all saw major declines for a second week, and most of TSXV gold was down (Figures 14, 15) For the TSXV gold companies operating mainly domestically, Artemis reported Q2/26 production results, Osisko Dev announced its name change to Osisko Gold, Amex reported that CMAC-Thyseen would be the contractor for underground mining for the Perron bulk sample program and Gold X2 announced plans for a spin-out to a 1.0% net smelter royalty on Moss into a subsidiary and listing on the NYSE and will request approval from the TSXV for a 6:1 share consolidation (Figure 16). For the TSXV gold companies operating mainly internationally, Mako and Thor reported Q2/26 production and Founders announced Antino drill results (Figure 17).
Disclaimer: This report is for informational use only and should not be used an alternative to the financial and legal advice of a qualified professional in business planning and investment. We do not represent that forecasts in this report will lead to a specific outcome or result, and are not liable in the event of any business action taken in whole or in part as a result of the contents of this report.
Author
Ben McGregor authors the Weekly Roundup at CanadianMiningReport.com, providing sharp analysis of the metals and mining sector. With a talent for spotting trends, Ben distills complex market shifts into clear, engaging insights on TSXV junior miners. His weekly updates cover gold, copper, uranium, and more, blending data-driven perspectives with a knack for identifying opportunities. A vital resource for investors, Ben’s work navigates the dynamic junior mining landscape with precision.