
October 20, 2025
Gold rose 6.0% to US$4,213/oz for its first full week above US$4,000/oz, as US regional bank issues led to concerns over risks in the sector globally, although the metal dropped at the end of the week as US comments on China tariffs softened.
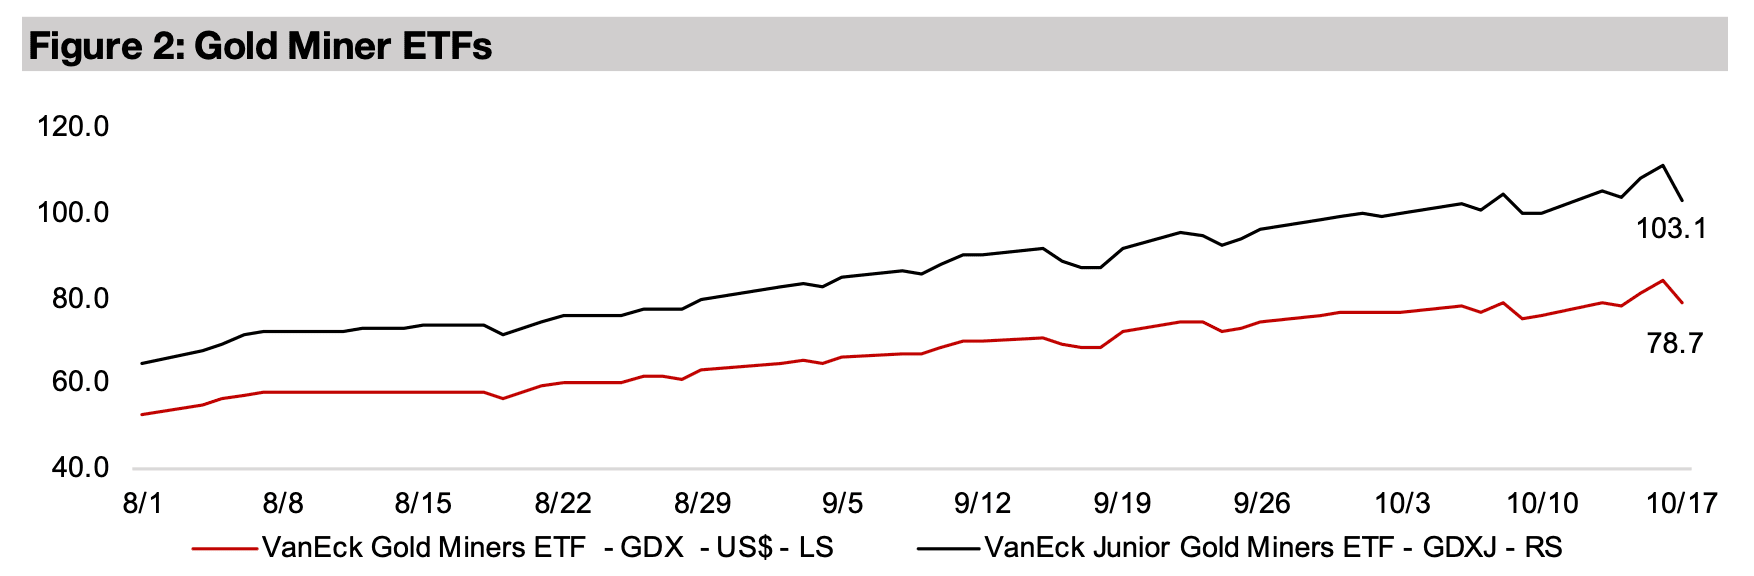
The gold stocks rose, with the GDX up 3.9% and GDXJ gaining 3.2%, even given a significant pullback later in the week, and still outperformed equities overall, with the S&P 500 up 0.6%, the Nasdaq gaining 0.5% and Russell 2000 adding 1.2%.


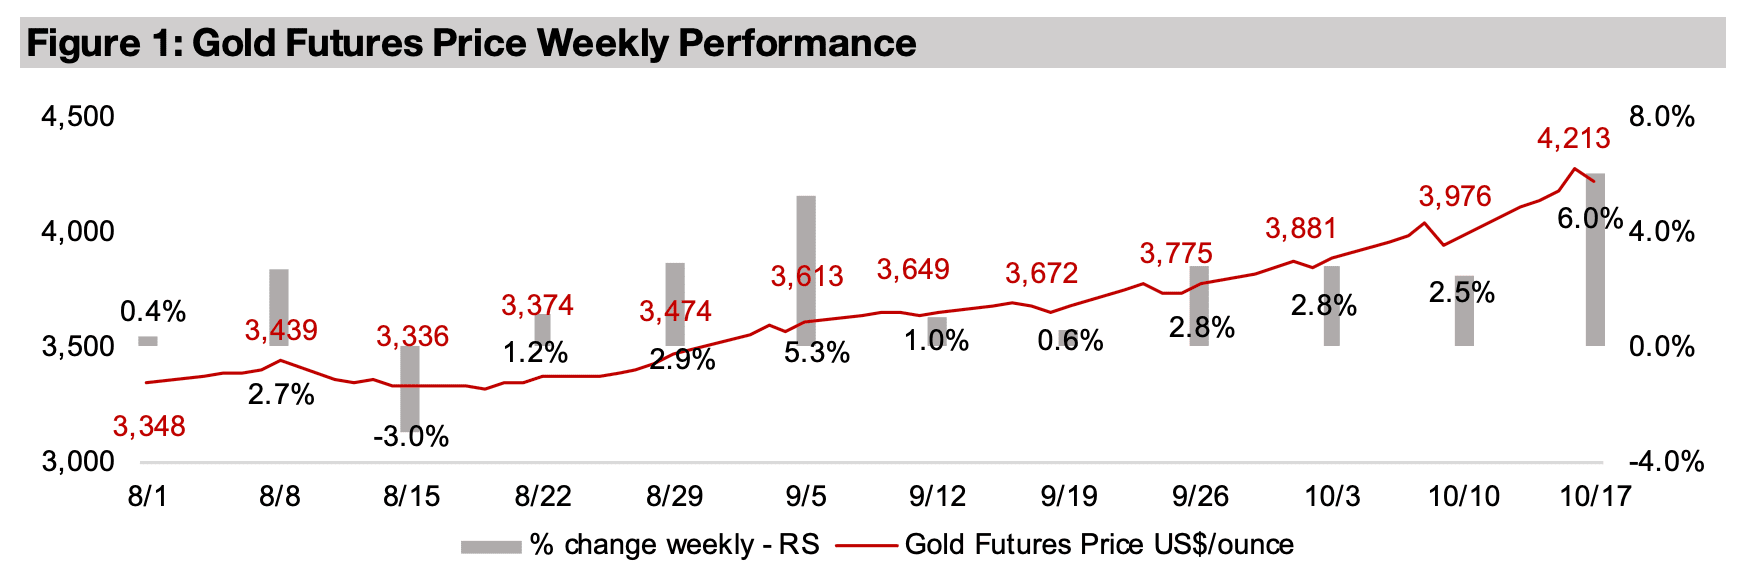
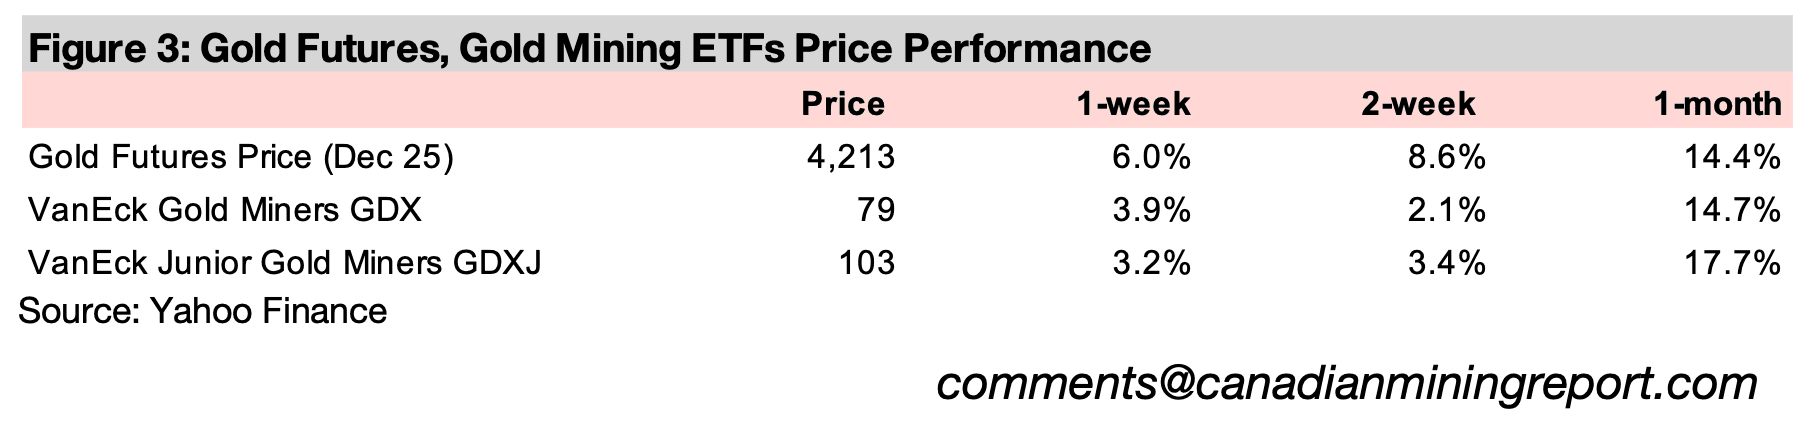
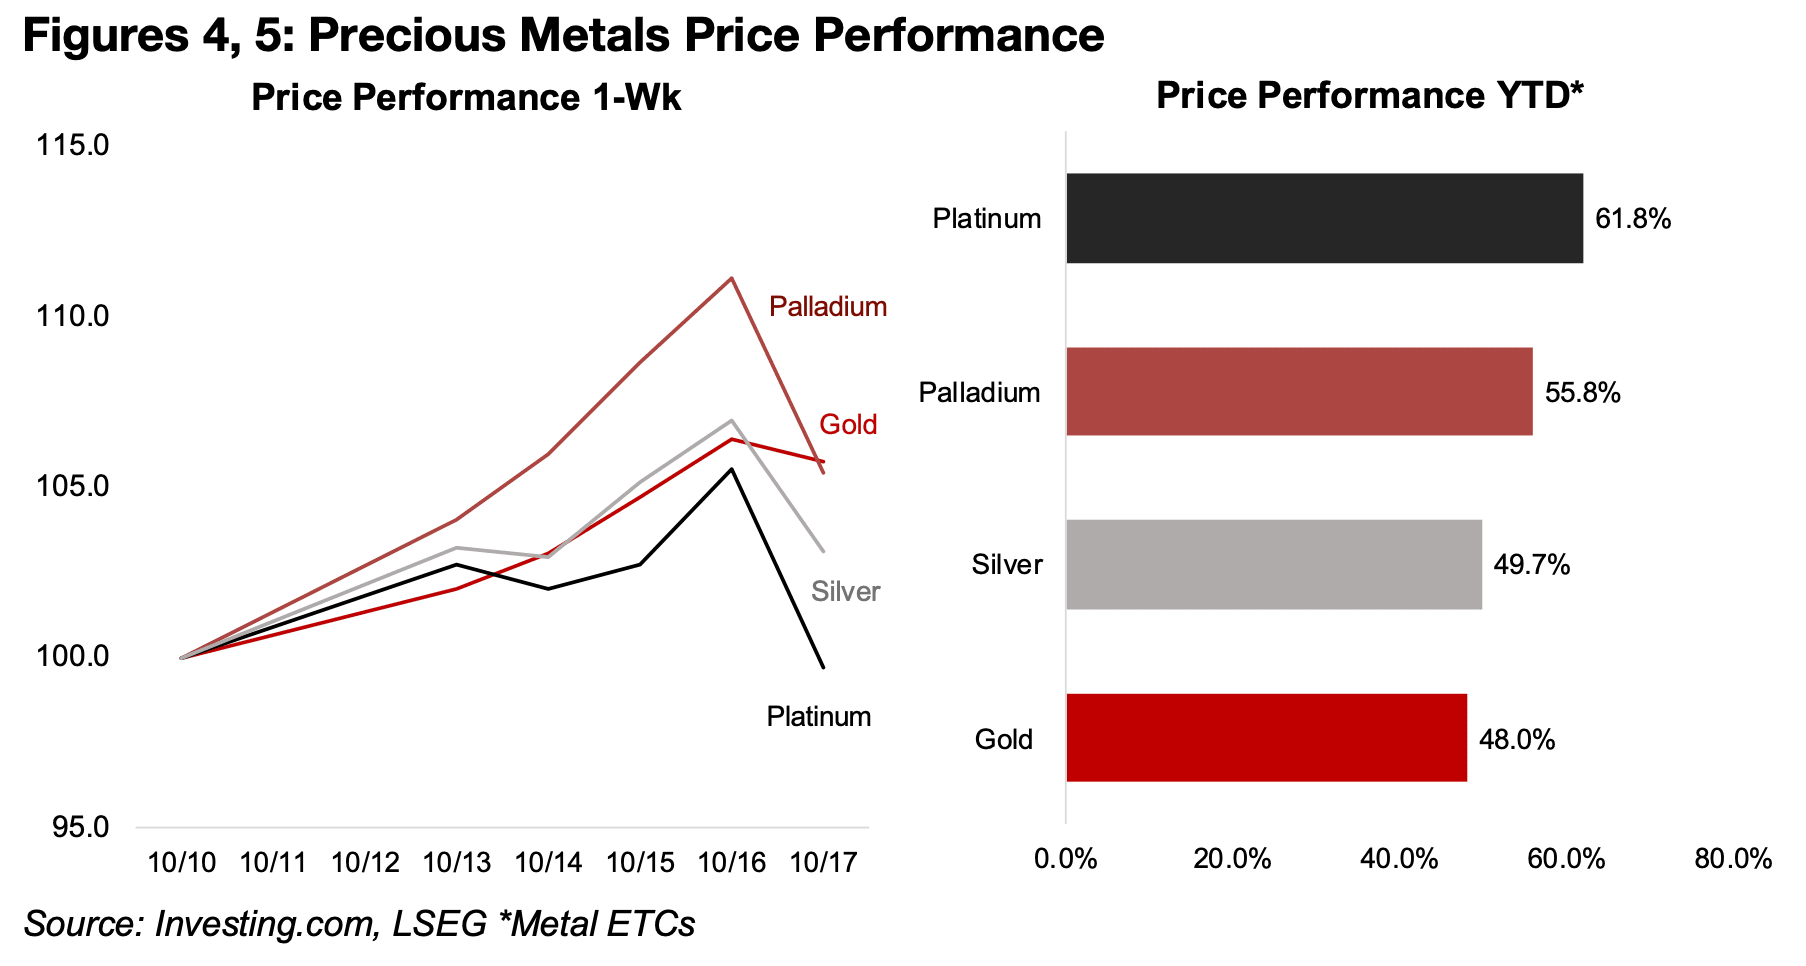
The gold price jumped 6.0% to US$4,213/oz, for its largest percentage gain since April 2025, and its first ever full week above the US$4,000/oz level. This was driven in part by concerns over global credit, which started with a few regional US banks, but then spread to a global slump for the sector. However, at the end of the week the precious metals still had an abrupt pullback, with the gold futures price down -1.6% on Friday, and its ETC losing -0.6%, and the platinum, palladium and silver ETCs down -5.5%, -5.1%, -3.6% (Figure 4). The decline came after the US president indicated that the proposed 100% on tariffs on China might not be sustainable, while the US$ also rose, with these metals tending to move inversely to the currency. There may have also been some profit taking given the rapid ascent of these metals this year, with the gold, silver, platinum and palladium ETCs still up 48.0%, 49.7%, 55.8% and 61.8%, respectively, and gold adding US$500/oz in just a month (Figure 5).
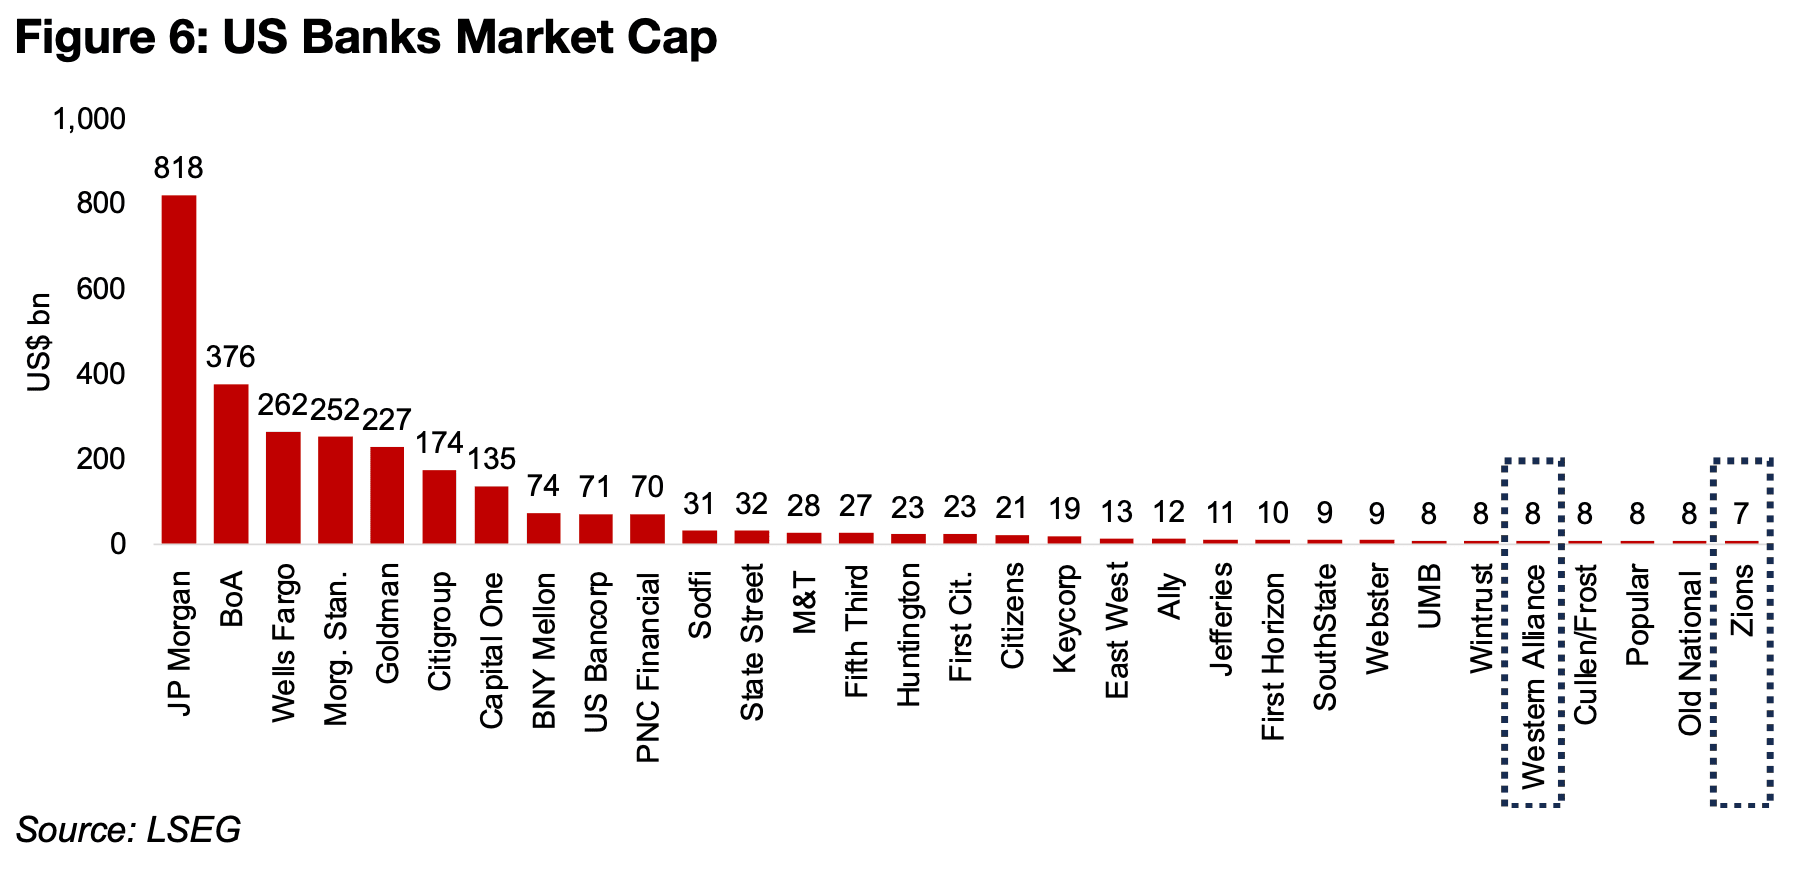
The global decline in banking stocks actually started from just two small US banks in
two relatively small states in terms of contribution to GDP, Zions Bancorporation in
Utah, and Western Alliance in Arizona. The first announced a write-off of US$50mn
in loans, and the second began the legal process over a US$100mn bad loan. These
two banks are only the twenty-seventh and thirty-first largest banks in the US, with
market caps of just US$7bn and US$8bn, and the loan amounts, while large for the
individual banks, were small in terms in the total financial system (Figure 6). These
announcements, therefore, would not necessarily have been expected to lead to a
worldwide drop in financials.
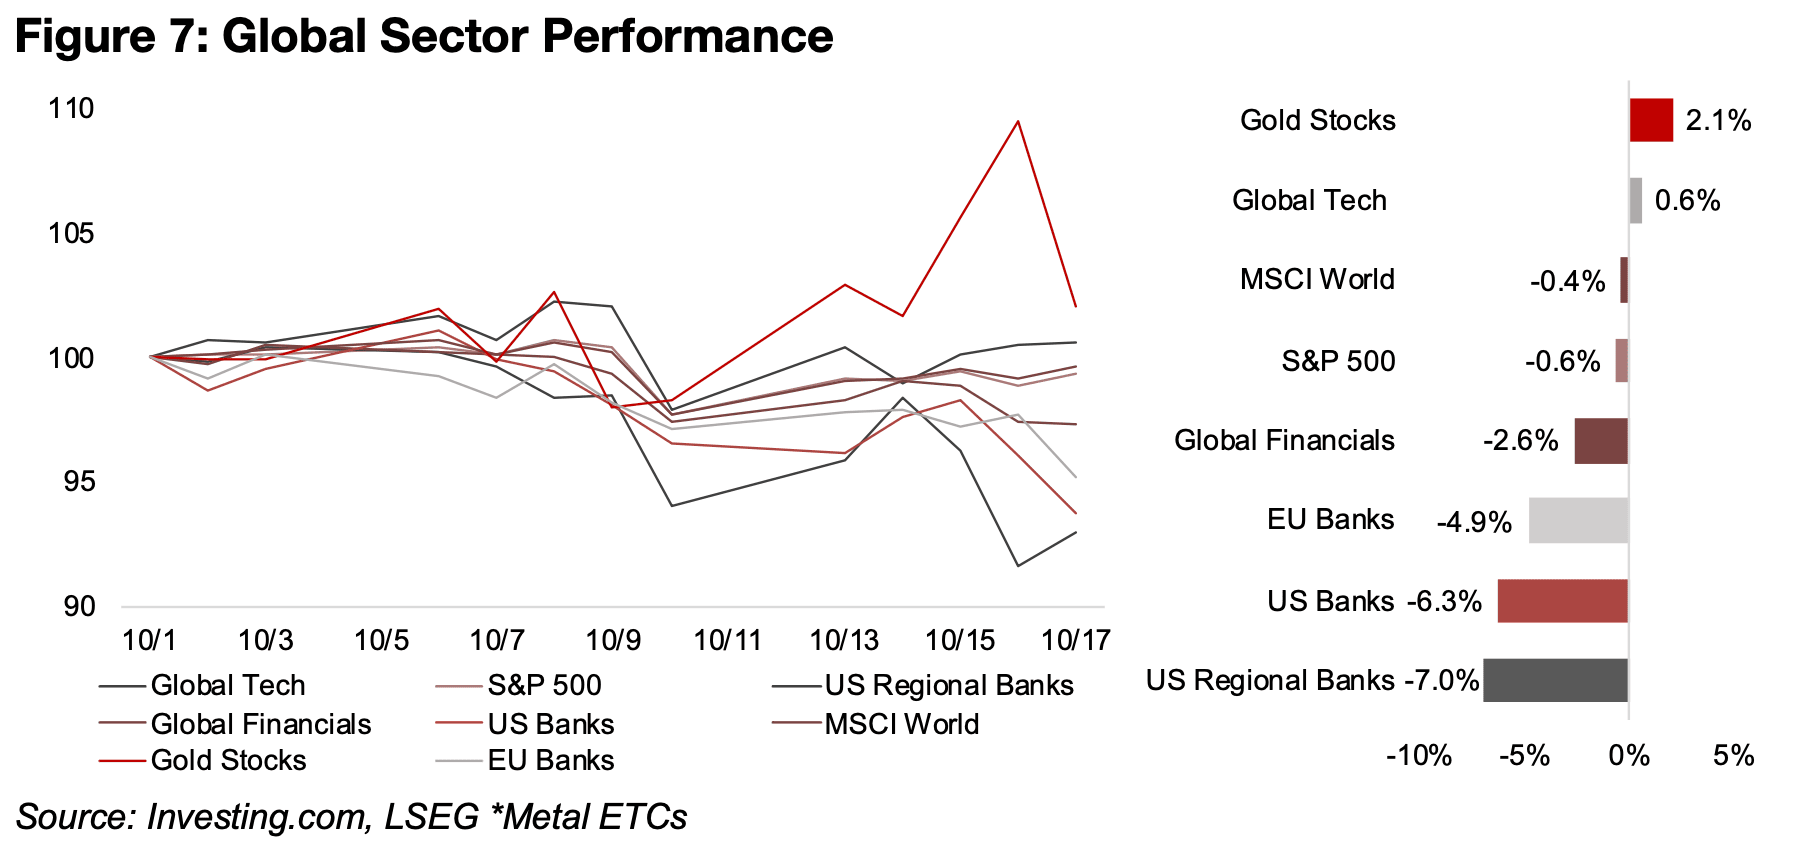
However, these cases seem to have highlighted stress at the edges of the lending
market, with global interest rates still relatively high compared to the past three
decades, even after major cuts by central banks over the past year. The plunge in the
two banks after these announcements, with Western Alliance down -10% and Zions
losing 9%, saw the markets also sell off US regional banks, which were viewed as
having similar risks of a lower capital base to absorb large loans losses, which sent
the sector down -7.0% since the start of October, 2025. (Figure 7). However, even
the large US banks were affected, with the sector down -6.3%, and the downturn
became international, with EU banks losing -4.9% and Global financials down -2.6%,
well below the -0.6% decline in the S&P 500 and -0.4% fall in the MSCI World.
While this move may have been overblown, given that the problem was limited to a
couple of banks, the market clearly took it as a sign to price in more risk into the
sector. The situation looked similar to the Silicon Valley Bank (SVB) crisis in early
2023. This bank collapsed after interest rates rose rapidly, hitting their many pre-
revenue tech company clients, which required low rates to continue raising funds to
operate. While SVB was also relatively small, that crisis became international, and
eventually required a major bailout in the US and Europe.
The global financial crisis of 2008-2009 also started out with issues in 2007 that
initially seemed minor, being limited to the relatively small subprime mortgage sector.
However, the declines at the edges of the financial system in subprime highlighted a
broader issue of credit being far overextended. Recently there have been signs of a
pullback in private credit, which had seen huge growth market until recently, similar
to the surge in subprime, which may point to deeper issues with the financial system.
Whether the dip in banks proves temporary or is a sign of greater problems to come,
it was more than enough to continue driving the market into gold as a safe haven.
This move into the metal has likely been further supported by a recent crash in
another sector, crypto, which has brought into question once again whether it can be
considered a store of value, like gold, or a high-risk asset. While longer-term, it may
be the former, in many short to medium-term periods, it has proved to be the latter.
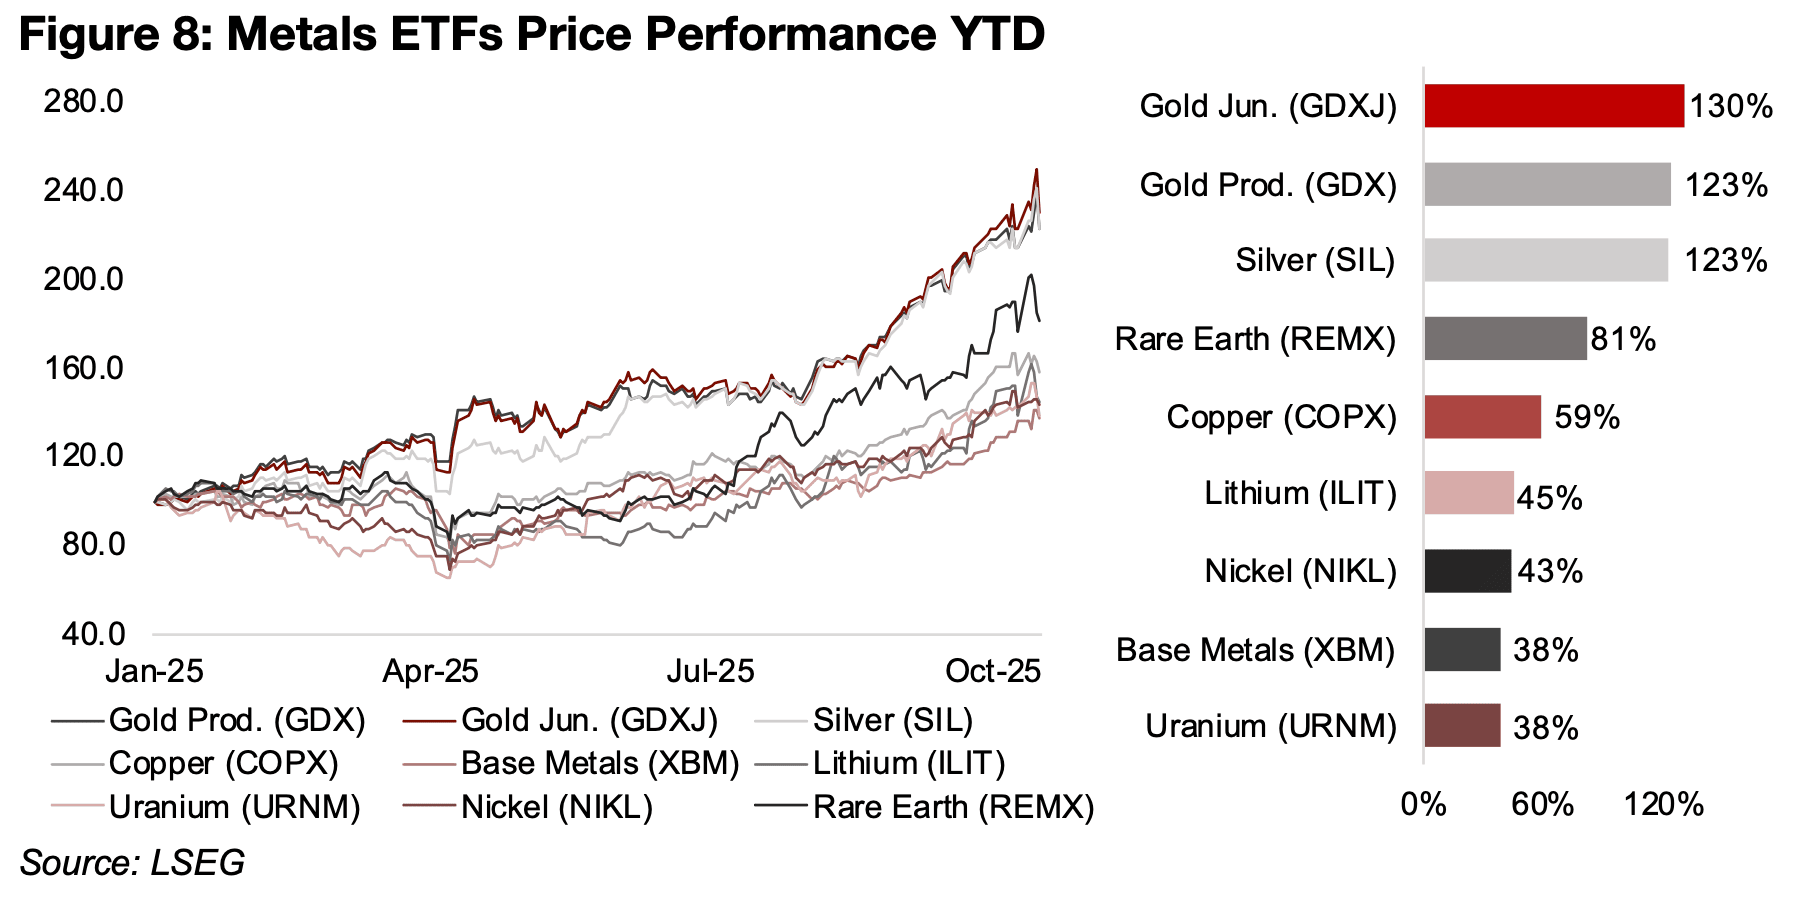
While the gold stocks pulled back on Friday along with the metal price, they still rose
for the week, with the GDX up 3.9% and GDXJ adding 3.2%. They have far
outperformed the major markets and sectors this year, up 130% and 123%,
respectively, with only silver stocks close, with the SIL ETF of producers gaining 123%
(Figure 8). However, the other metals stocks have also had a major year, that would
look quite impressive if not overshadowed by the precious metals. The rare earth,
copper, lithium and nickel stocks are up 81%, 59%, 45%, 43%, respectively and the
base metals and uranium stocks have both gained 38%.
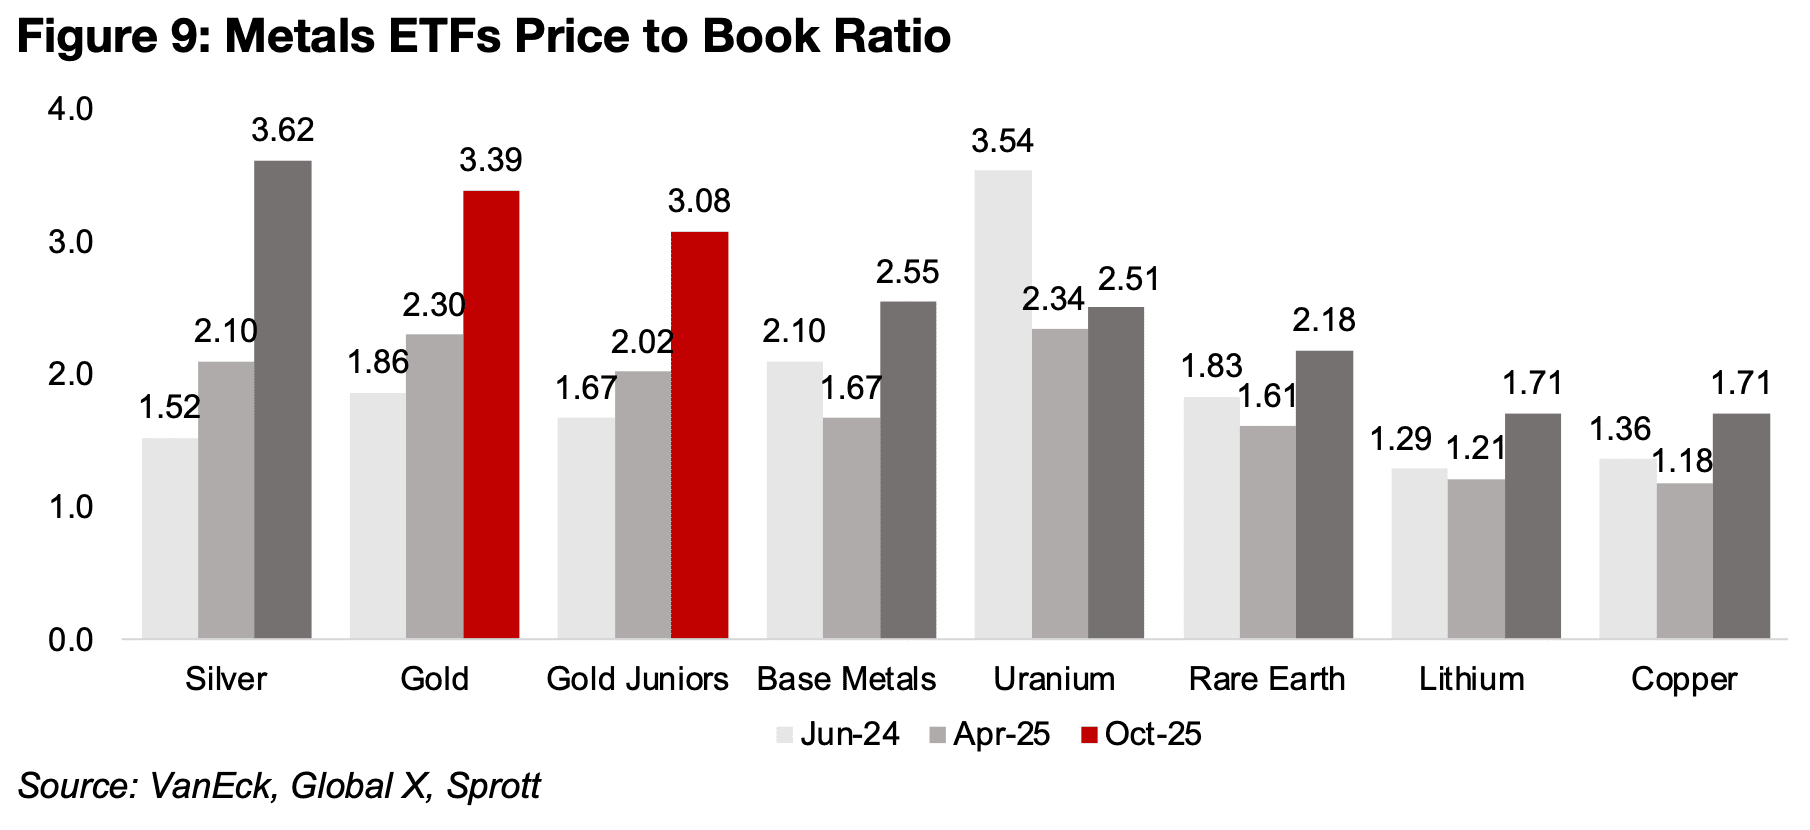
These gains have driven higher valuations for all of these metals sectors, with the
price to book (P/B) ratios rising as price gains outpace the rise in the book value. The
gold and silver stocks are no longer clearly inexpensive as they had been in mid-2024,
with the SIL, GDX and GDXJ P/B ratios of 3.62x, 3.39x and 3.08x, on average about
doubling the 1.52x, 1.86x and 1.67x of June 2024 (Figure 9). While these price to
book ratios are also not yet clearly excessive, as they head well above 3.0x and
towards 4.0x, the sector is no longer the bargain it was last year. The P/B multiples
for the base metals, uranium, and rare earth sector at over 2.0x, and the lithium and
copper sectors at 1.7x, are more moderate given that the gains in their underlying
metals prices have been more subdued than the surge in gold or silver.
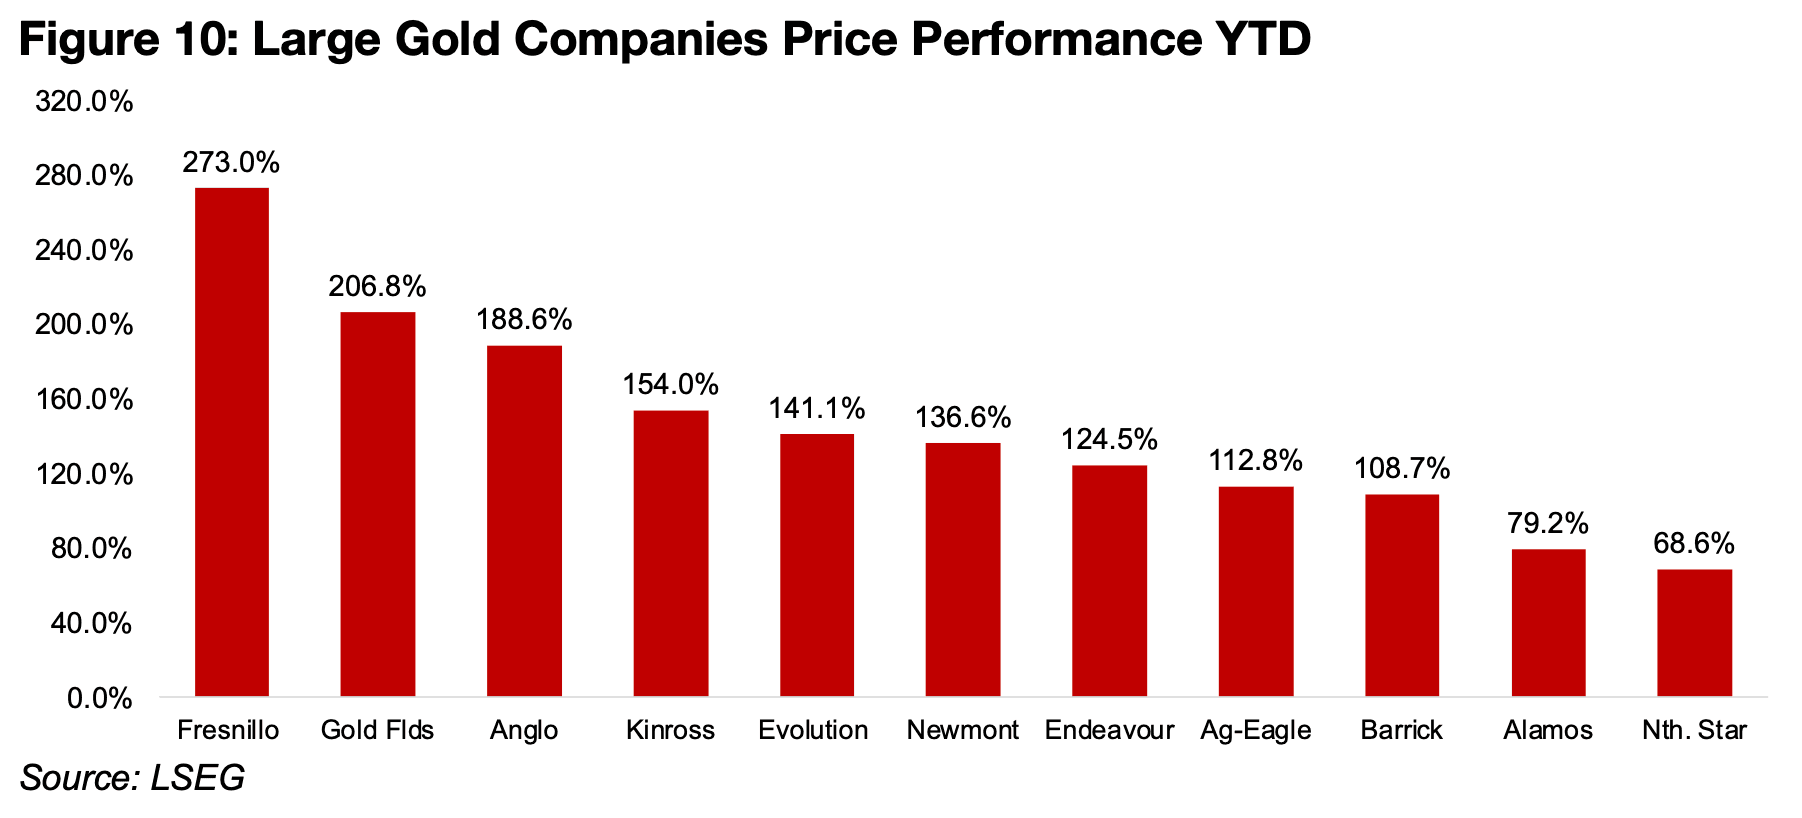
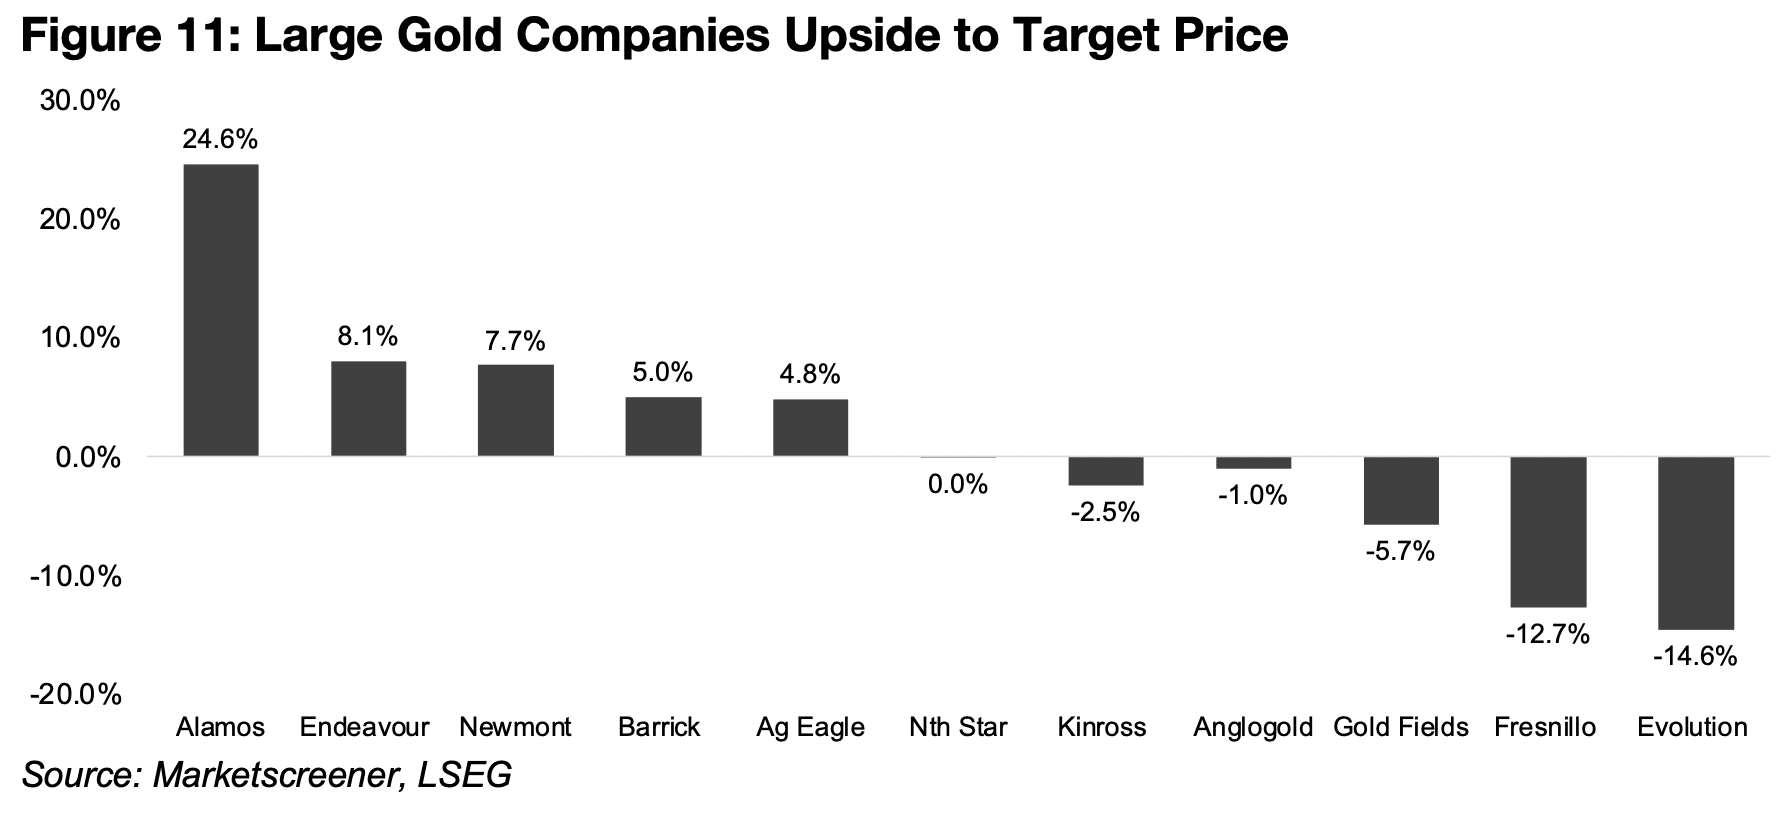
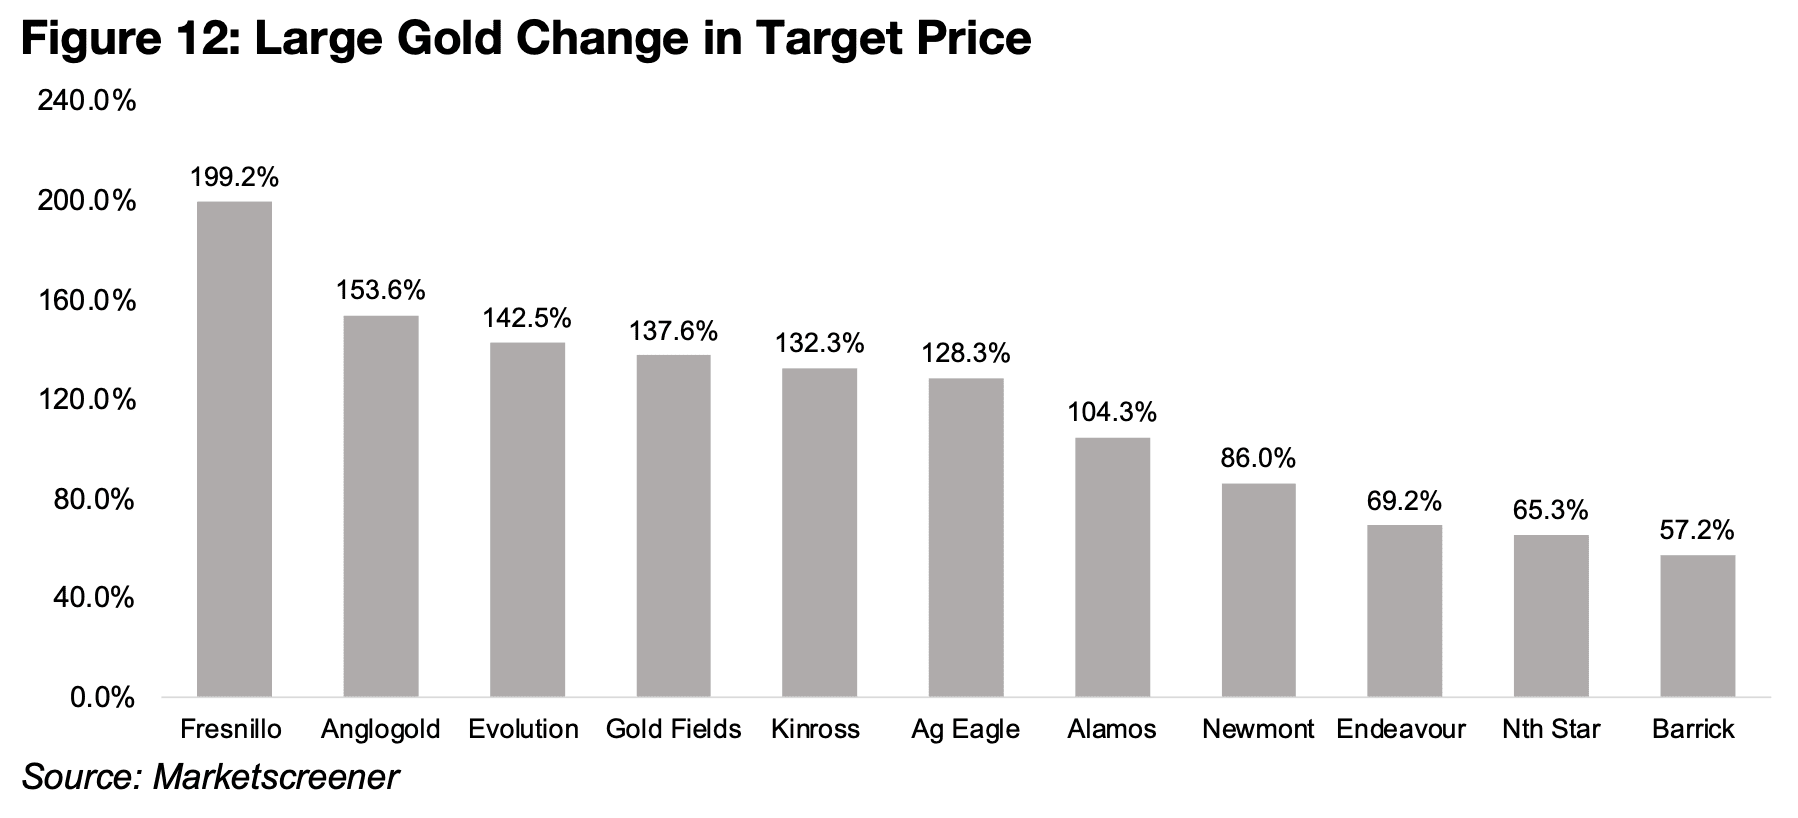
The largest gold companies are up between 69% and 273% this year, with the average market cap weighted gain correlating to the rise in the GDX ETF (Figure 10). However, this has seen many of these companies rise to near, or above, their market target prices, with only Alamos Gold currently having substantial upside to its target price (Figure 11). This could occur if the markets have still not priced in the rise in the gold price to these valuations, indicating further upside. However, the target prices of all of these companies have been increased substantially, ranging from 57% to almost 200% so far in 2025, with much of this gain only in recent months (Figure 12). This suggest that at least some of the rise in the gold price will have been incorporated into these prices, with the market finally accepting that higher gold, at least well above US$3,000/oz, will likely persist.
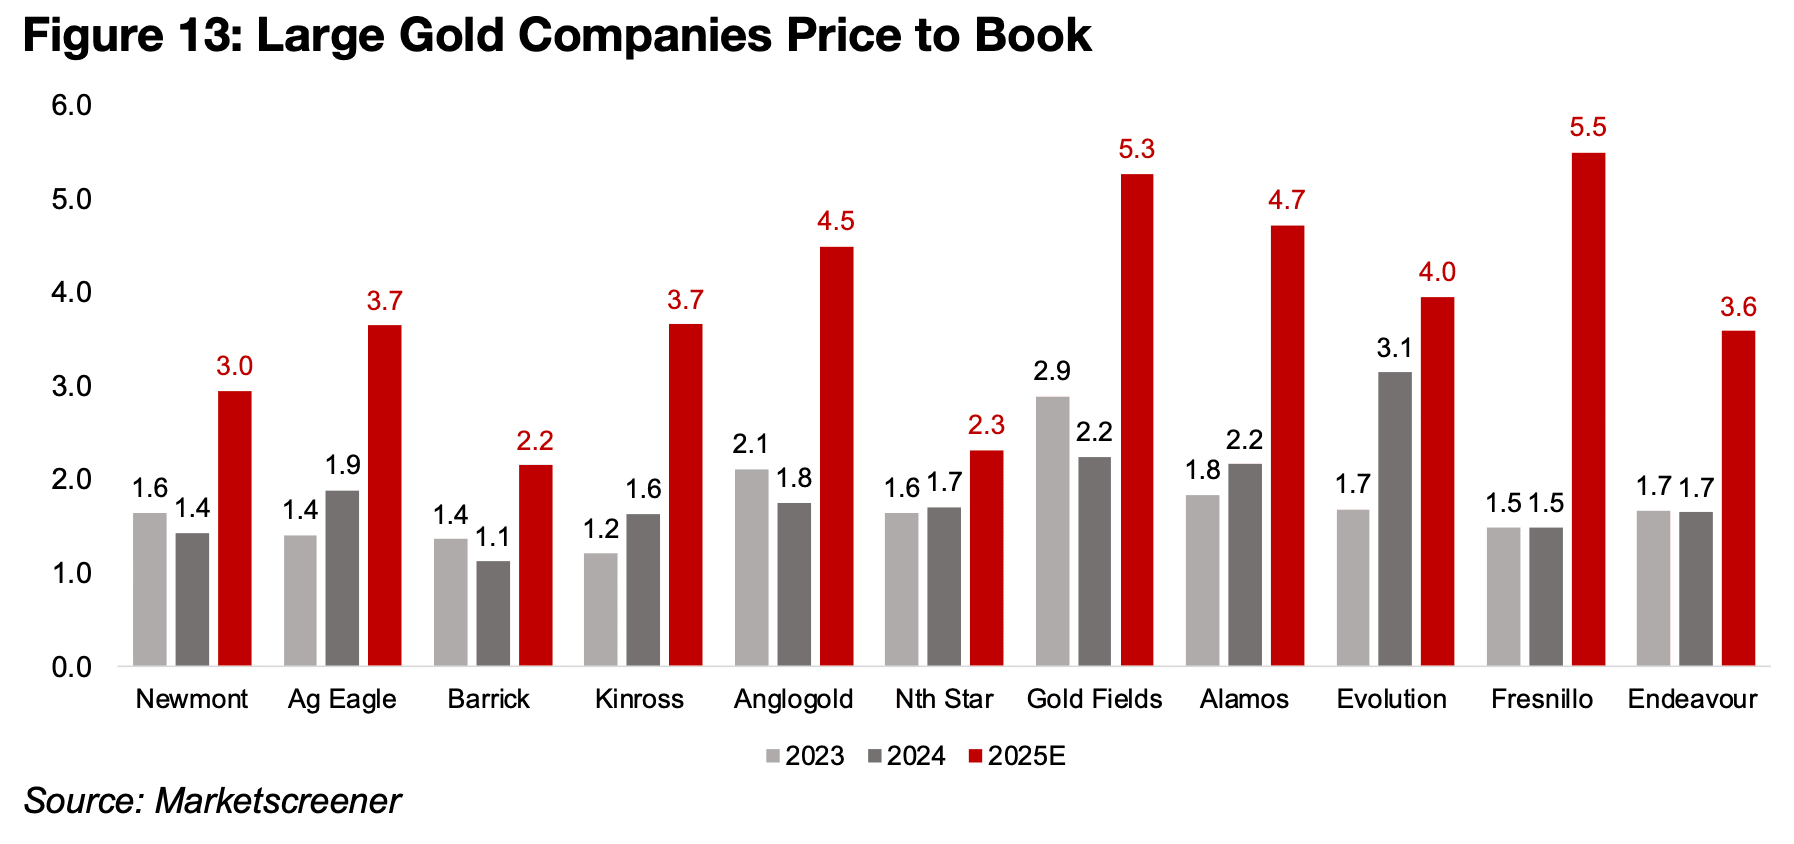
For further major upgrades of target prices, the market may need to see over US$4,000/oz hold for a considerable period. This would also lead to higher book value estimates, and could bring down price to book values, which have started to look high for many of the major gold producers. The P/B multiples of five out of eleven of the largest gold stocks by market cap now ranging from 4.0x-5.0x, while in 2023 they were at just 1.5x-2.9x, and nine are now at 3.0x or higher (Figure 13). With at least one investment bank already setting a gold price target of US$5,000/oz for 2026, and many estimating a US$4,000/oz average for next year, it could imply substantial gold stock target upgrades. However, caution is warranted if gold does not hold well above US$3,500/oz, which is likely already priced in for much of the sector given some relatively high multiples.
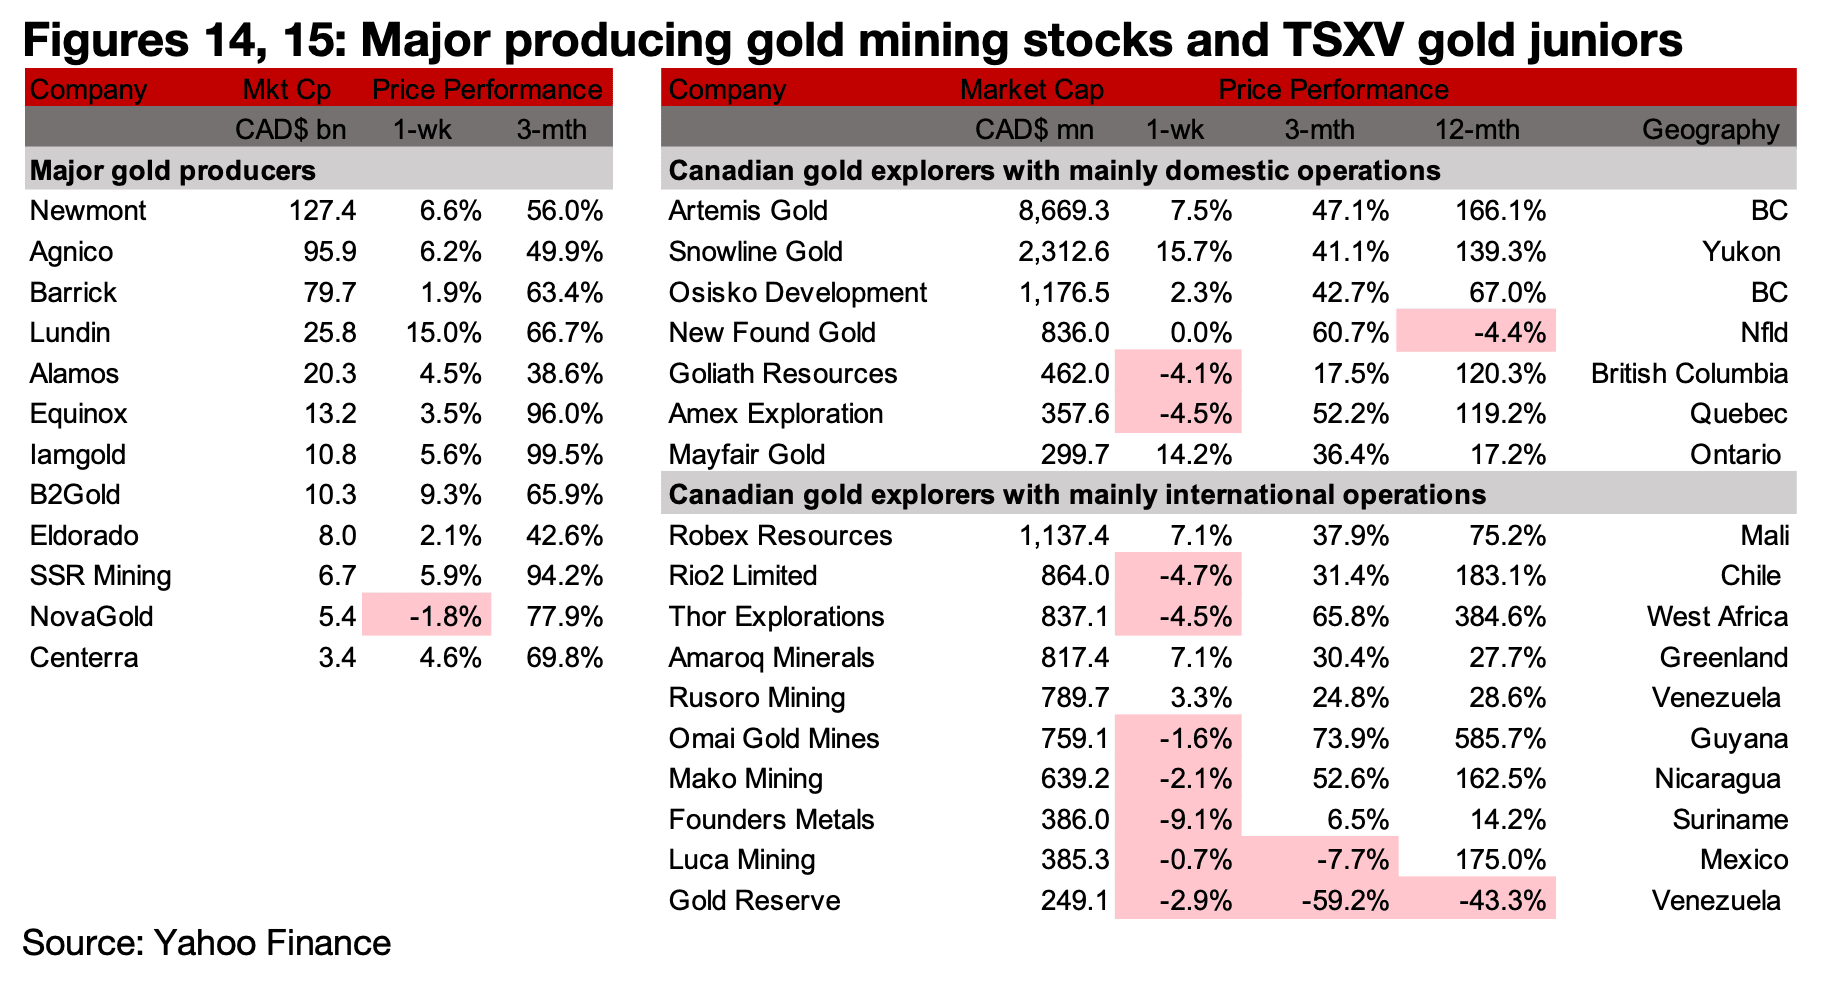
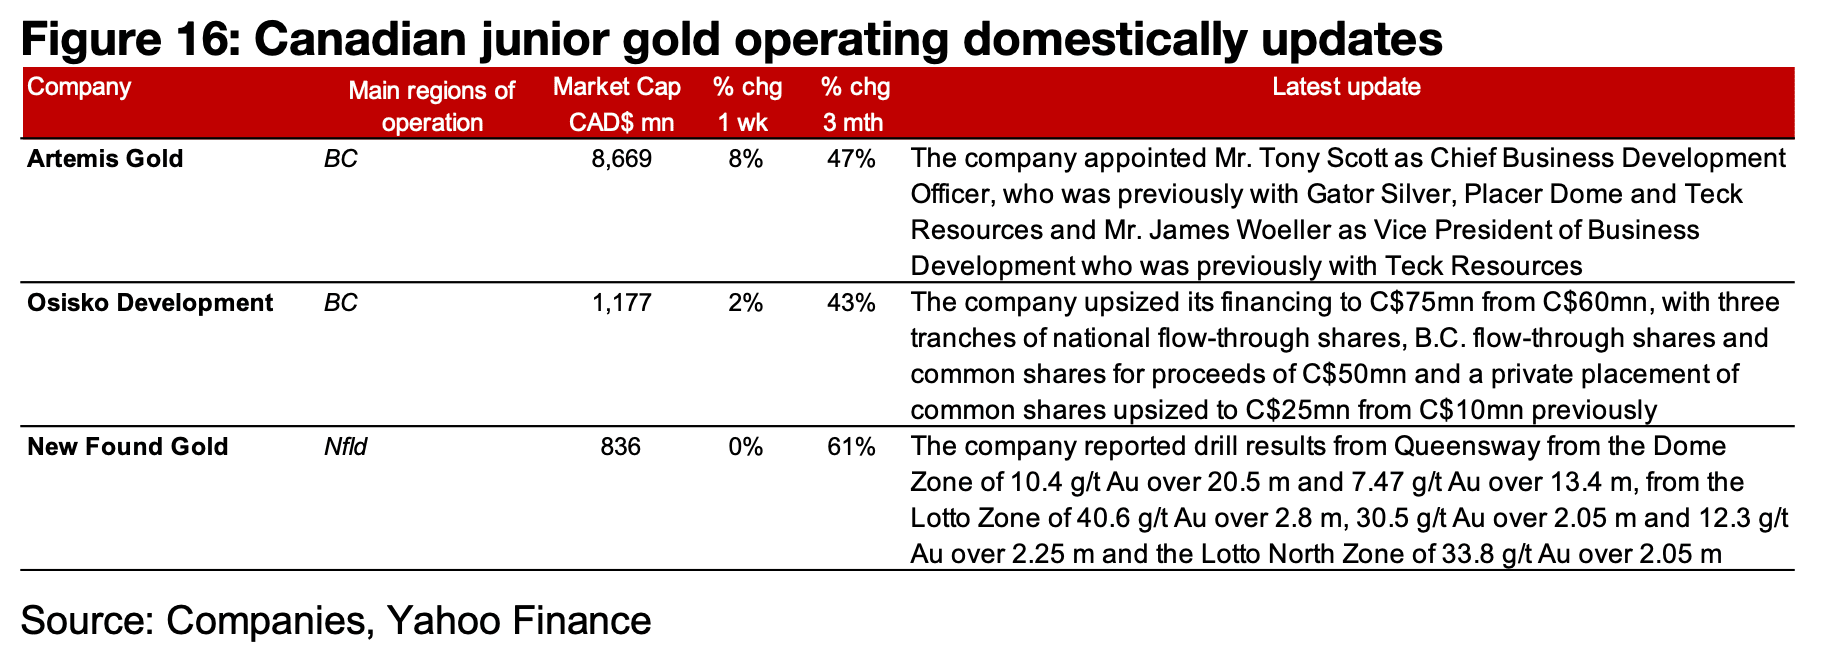
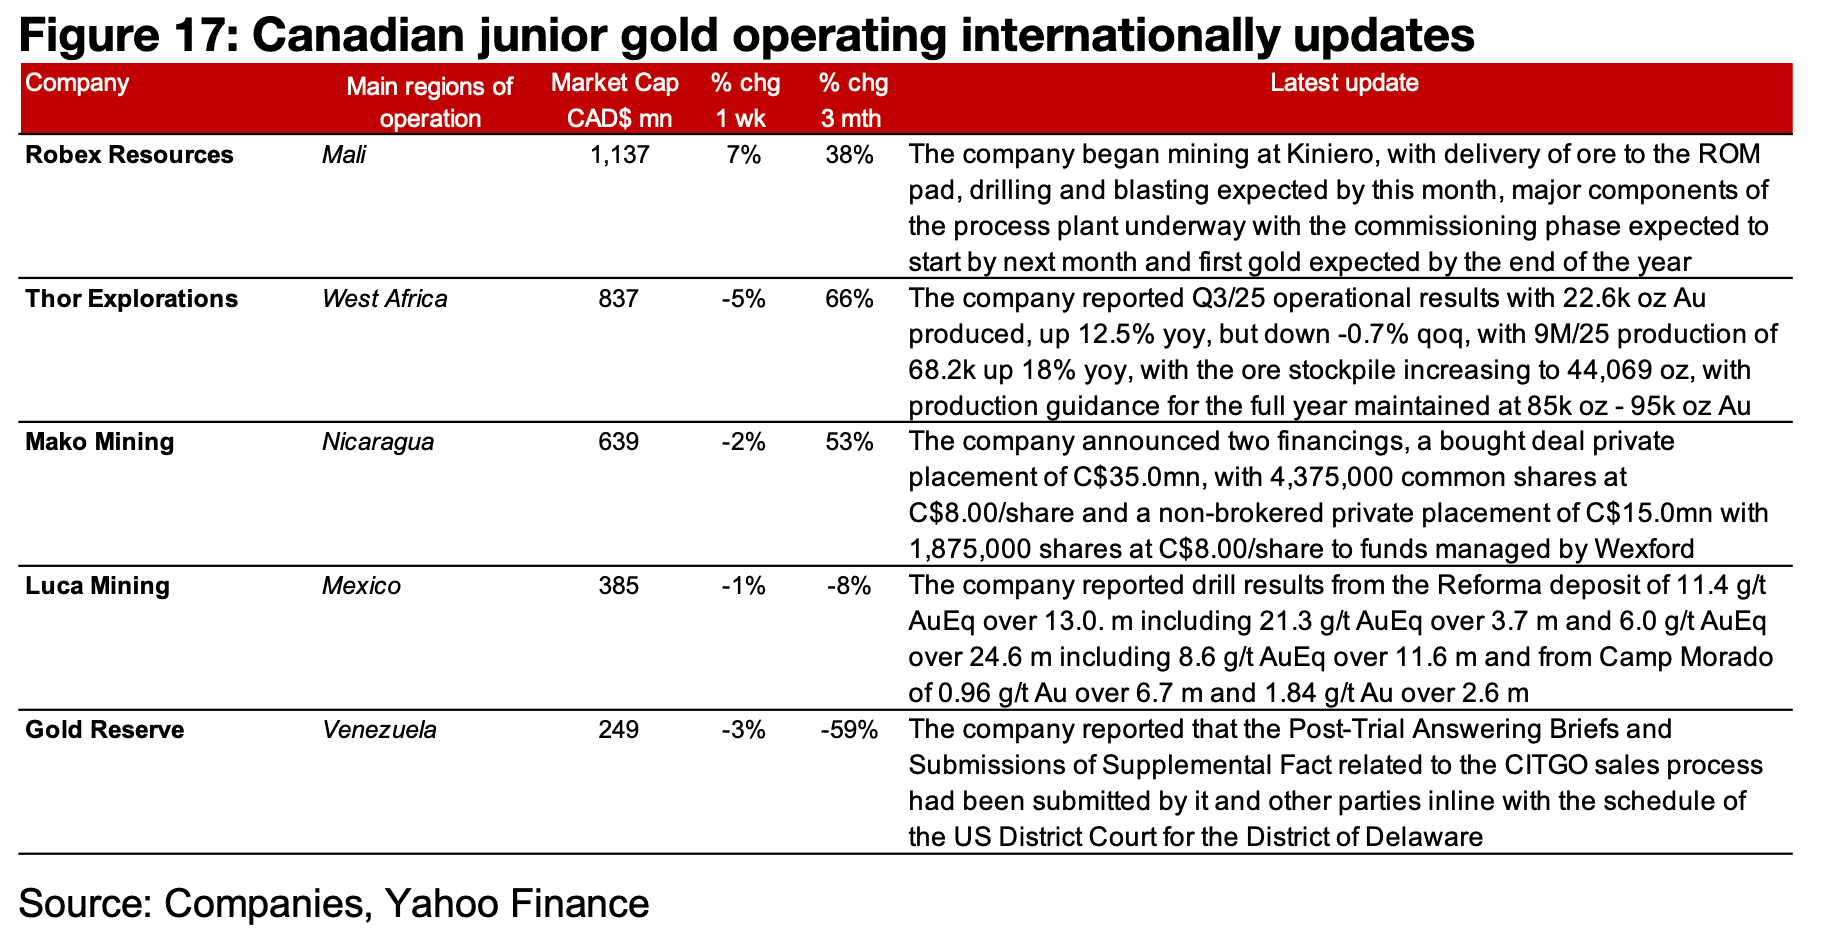
While almost all of the major producers rose, TSXV gold was mixed (Figures 14, 15) For the TSXV gold companies operating mainly domestically, Artemis Gold appointed business development executives, Osisko Development upsized its private placement and New Found reported drill results from Queensway (Figure 16) For the TSXV gold companies operating mainly internationally, Robex began mining at Kiniero, Thor reported Q3/25 operational results, Mako announced financings, Luca reported drill results and Gold Reserve gave an update on the CITGO sales process (Figure 17).
Disclaimer: This report is for informational use only and should not be used an alternative to the financial and legal advice of a qualified professional in business planning and investment. We do not represent that forecasts in this report will lead to a specific outcome or result, and are not liable in the event of any business action taken in whole or in part as a result of the contents of this report.
Author
Ben McGregor authors the Weekly Roundup at CanadianMiningReport.com, providing sharp analysis of the metals and mining sector. With a talent for spotting trends, Ben distills complex market shifts into clear, engaging insights on TSXV junior miners. His weekly updates cover gold, copper, uranium, and more, blending data-driven perspectives with a knack for identifying opportunities. A vital resource for investors, Ben’s work navigates the dynamic junior mining landscape with precision.