June 09, 2025
While gold futures rose 1.0% to US$3,323/oz, and the spot price gained 1.3%, it was far outperformed by the other precious metals, with the spot prices of platinum, silver and palladium up 10.0%, 8.5% and 8.0% on monetary and industrial factors.
The larger TSXV global gold producers, Thor Explorations, Robex Resources and Mako Mining have all reported Q1/25 results, with production up for all three yoy and the group’s cash balance rising and debt reduced substantially over the past year.
The junior gold stocks outperformed the majors for a second week, with the GDXJ up 5.6% versus a 1.9% rise in the GDX, on strong small caps, with the Russell 2000’s gain of 3.2% ahead of the 1.8% and 2.5% rises in the S&P 500 and Nasdaq.


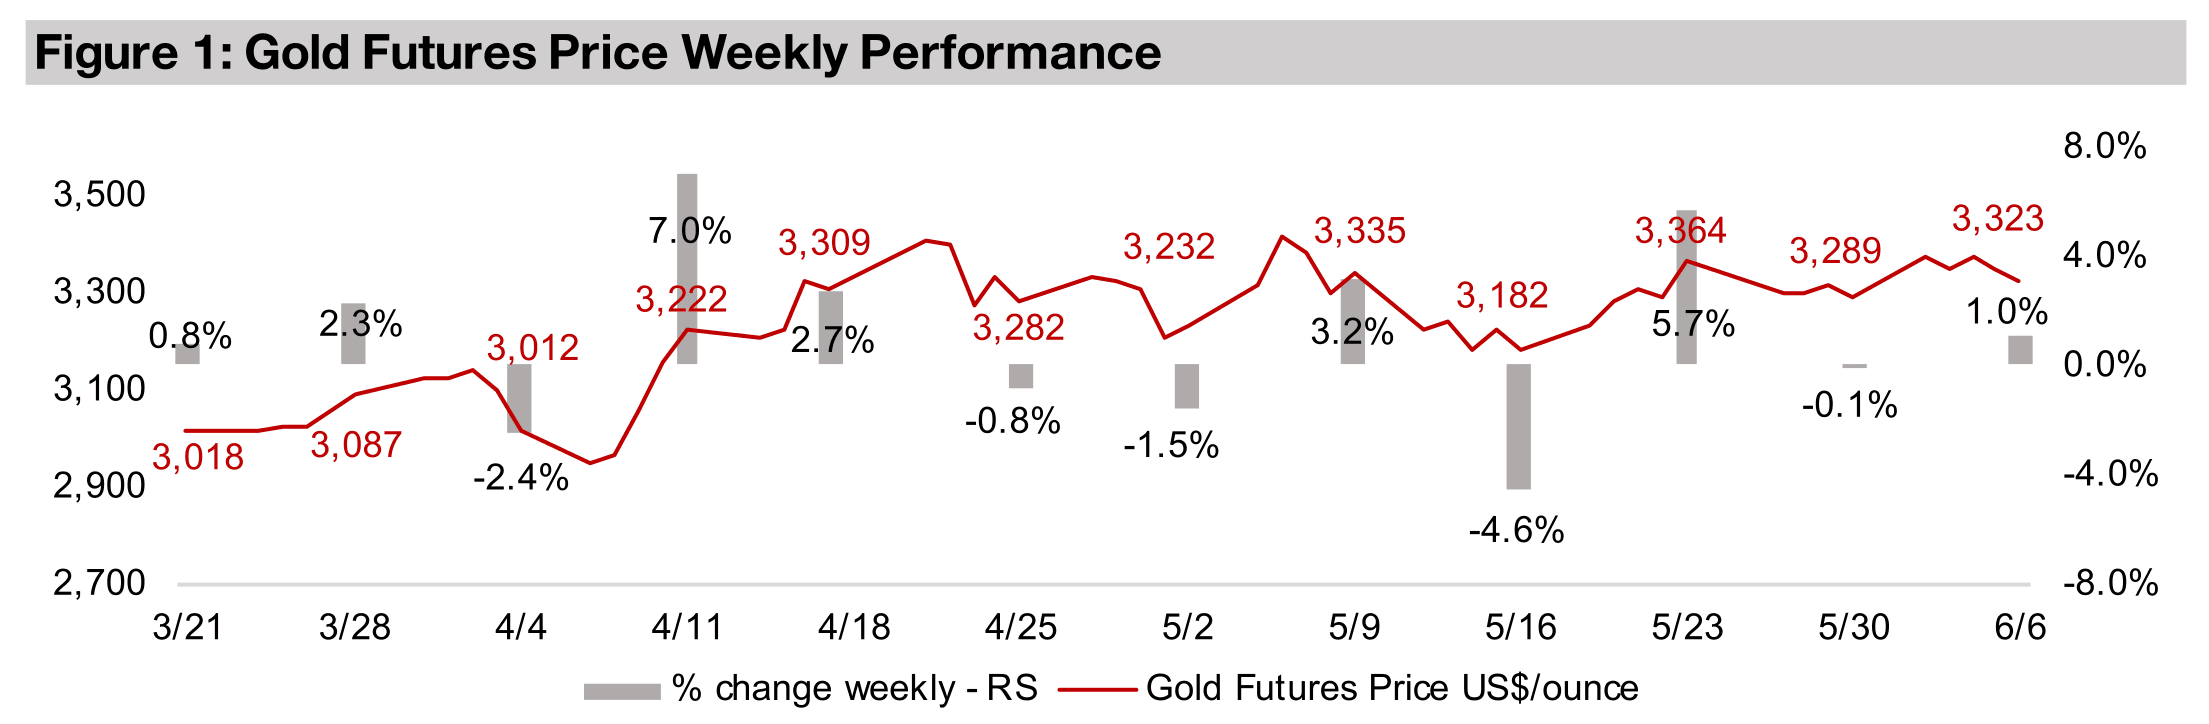


The gold futures price rose 1.0% to US$3,323/oz, again closing towards the middle of a roughly US$3,200-US$3,400/oz range that has held for over the past two months. However, there were much more significant moves from the other precious metals, with the spot prices of platinum, silver and palladium surging 10.0%, 8.5% and 8.0%, respectively, versus a 1.3% rise for the spot gold price (Figure 4). While some major base metals also rose, they lagged the precious metals, with copper gaining 4.4%, zinc up 1.7% and nickel rising 1.6%. Iron ore and aluminum lagged in the rally, up just 0.7% and 0.3%. The gold stocks rose, with the juniors outperforming the majors for a second week, with the GDXJ up 5.6%, far ahead of the 1.9% gain in the GDX. This was partly as small caps overall were strong, with the 3.2% rise in the Russell 2000 index outpacing the 1.8% increase in the S&P 500 and 2.5% gain in the Nasdaq.

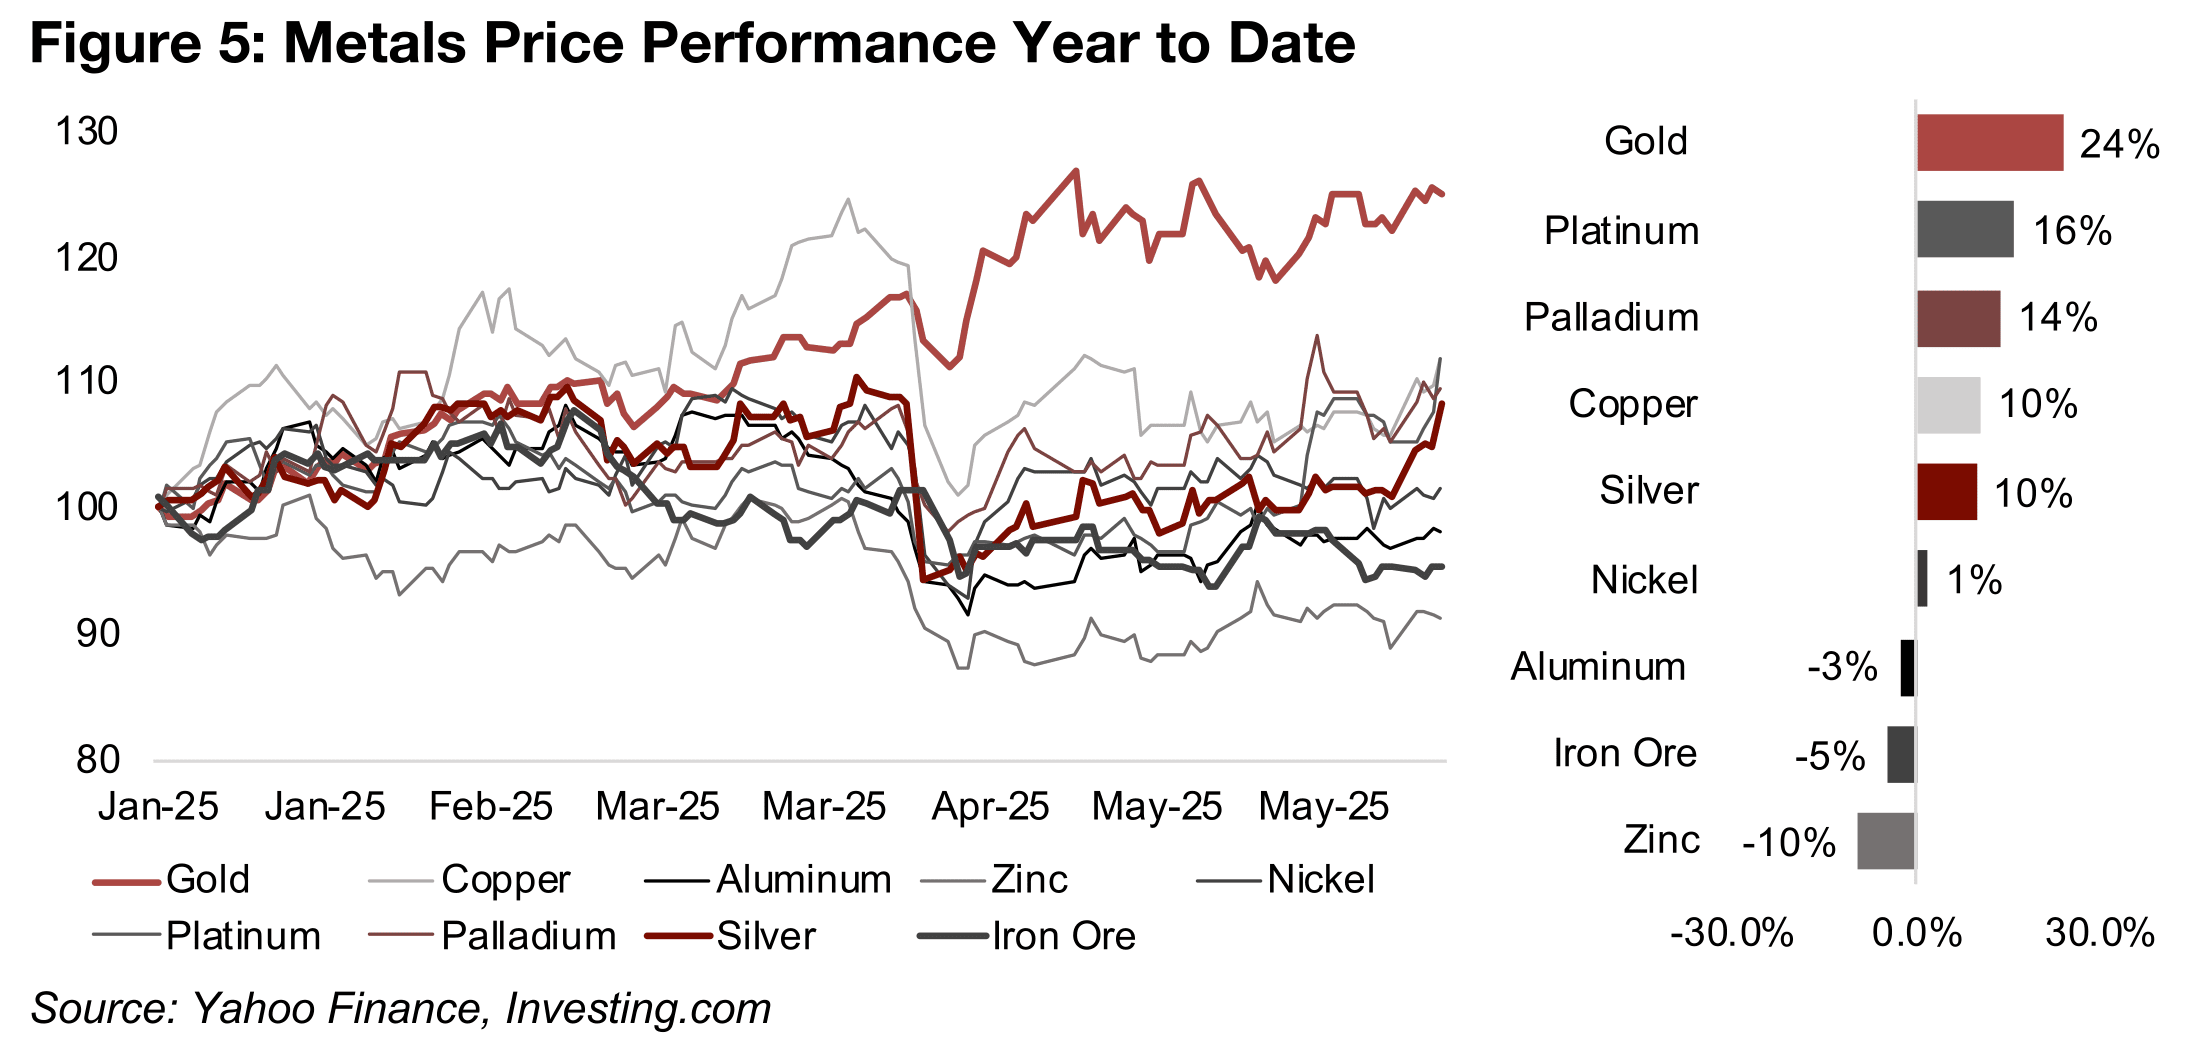
Gold still leads the metals by far in 2025, up 25%, although platinum and palladium
have been closing the gap over the past month, up 16% and 14%, respectively, with
silver gaining just 10% (Figure 5). However, a potential continued convergence has
some fundamental support, given that gold’s ratios versus these metals had become
historically extreme, and were starting to look unsustainable. In recent months we
had outlined scenarios that would close the gap, with one high probability outcome
being a flat gold price while other metals rose, as has occurred this week.
Both silver and platinum, and palladium, to a lesser degree, have a large component
of their demand driven by monetary factors, similar to gold. With gold’s extreme rise
this year, it could therefore be expected that these metals would be at least
somewhat correlated with the move, but they had lagged overall. Partly this was
because these metals are also driven by industrial factors, and there had been market
concerns over global economic demand. However, these expectations may have
improved recently, as evidenced by the rise in copper and other base metals, and
seen the both monetary and industrial factors drive up the precious metals in tandem.
Both silver and platinum will also have been supported by expected deficits for 2025.
While the gold to silver ratio and gold to platinum ratios have plunged to 92.0 and
2.82x, respectively, off multi-year highs of 104.7x and 3.44x, they both are still far
above medium-term 2021-2025 averages of 81.2x and 2.1x (Figures 6, 8). Assuming
a reversion to the mean, and relatively flat gold, this implies that the silver and
platinum could have further upside. The copper to gold ratio has also risen off its lows
of 0.0014x, but only slightly, indicating that the market may still be relatively cautious
on metals driven entirely by industrial factors without the support of monetary drivers
(Figure 7).

Gold’s ratios versus other commodities have not reverted towards their averages, and continued to rise in recent weeks. The gold to oil ratio is still at long-term highs of 50.8x, and the gold to broader CRB commodities index is at 9.4x, its highest since 2021 (Figures 9, 10). It is unclear whether these commodities will follow a similar path to the other precious metals and gap up to gold, as they do not have the direct backing of monetary factors. Oil especially has been hit by rising global production, and many commodities in the CRB index have seen prices decline after recent booms.

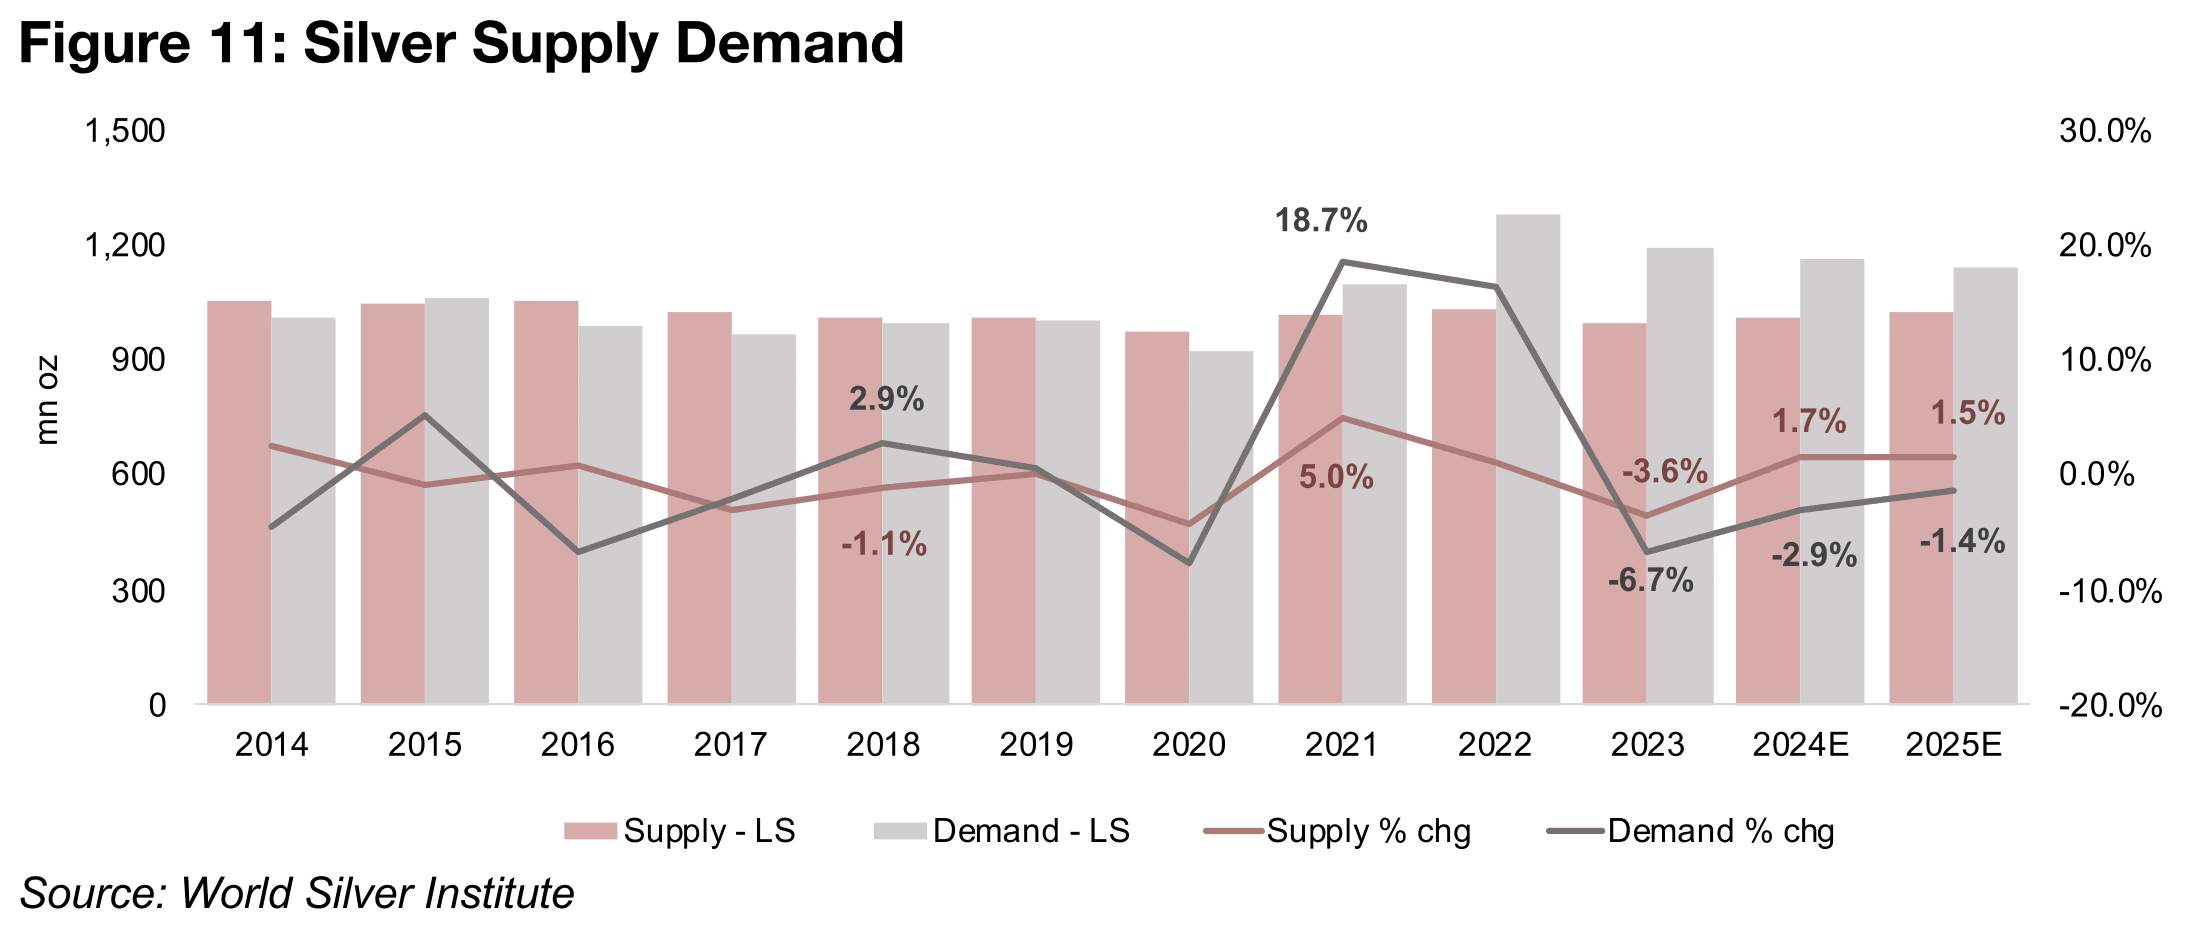
Silver is expected to have its fifth consecutive year of deficit in 2025, with demand growth, at 1.5%, outpacing a -1.4% contraction in supply, for a -117.8 mn oz deficit (Figures 11, 12). While this has contracted from -249.6 mn oz in 2022, it is still a substantial 14.3% of total silver supply. Pressure in the market is further indicated by LMBA inventories, which have trended down from highs of 1,180k in June 2021 to just 751k currently. There has also been a decline in supply yoy this year through to March 2025 from Mexico, the largest supplier of silver, at 23% of the 2024 total.


While the two largest gold producers Newmont and Agnico were down, most of the other majors were up, while TSXV gold mainly rose (Figures 13, 14). For the TSXV gold companies operating mainly domestically, New Found gold closed the first tranche of its placement for gross proceeds of C$56.1mn (Figure 15). For the TSXV gold companies operating, Gold Reserve reported that the U.S. District Court in Delaware had changed the PDV Holding share sale date, Robex Resources and Mako Mining reported Q1/25 results and Minera Alamos provided an update on its plans for the Copperstone Mine gold project, including permitting (Figure 16).


The TSXV larger gold producers, Thor Explorations, Robex Resources and Mako Mining have now all reported Q1/25 results, with the sector showing a strong operating performance overall. All three reported a rise in production yoy, with Thor at 22.8k oz Au, up 16% yoy, Robex at 12.9k oz Au, up 2.3% and Mako at 9.8k oz Au, up 4.4%, with the aggregate for the three at 45.5k oz Au, up 9.4% (Figure 17).

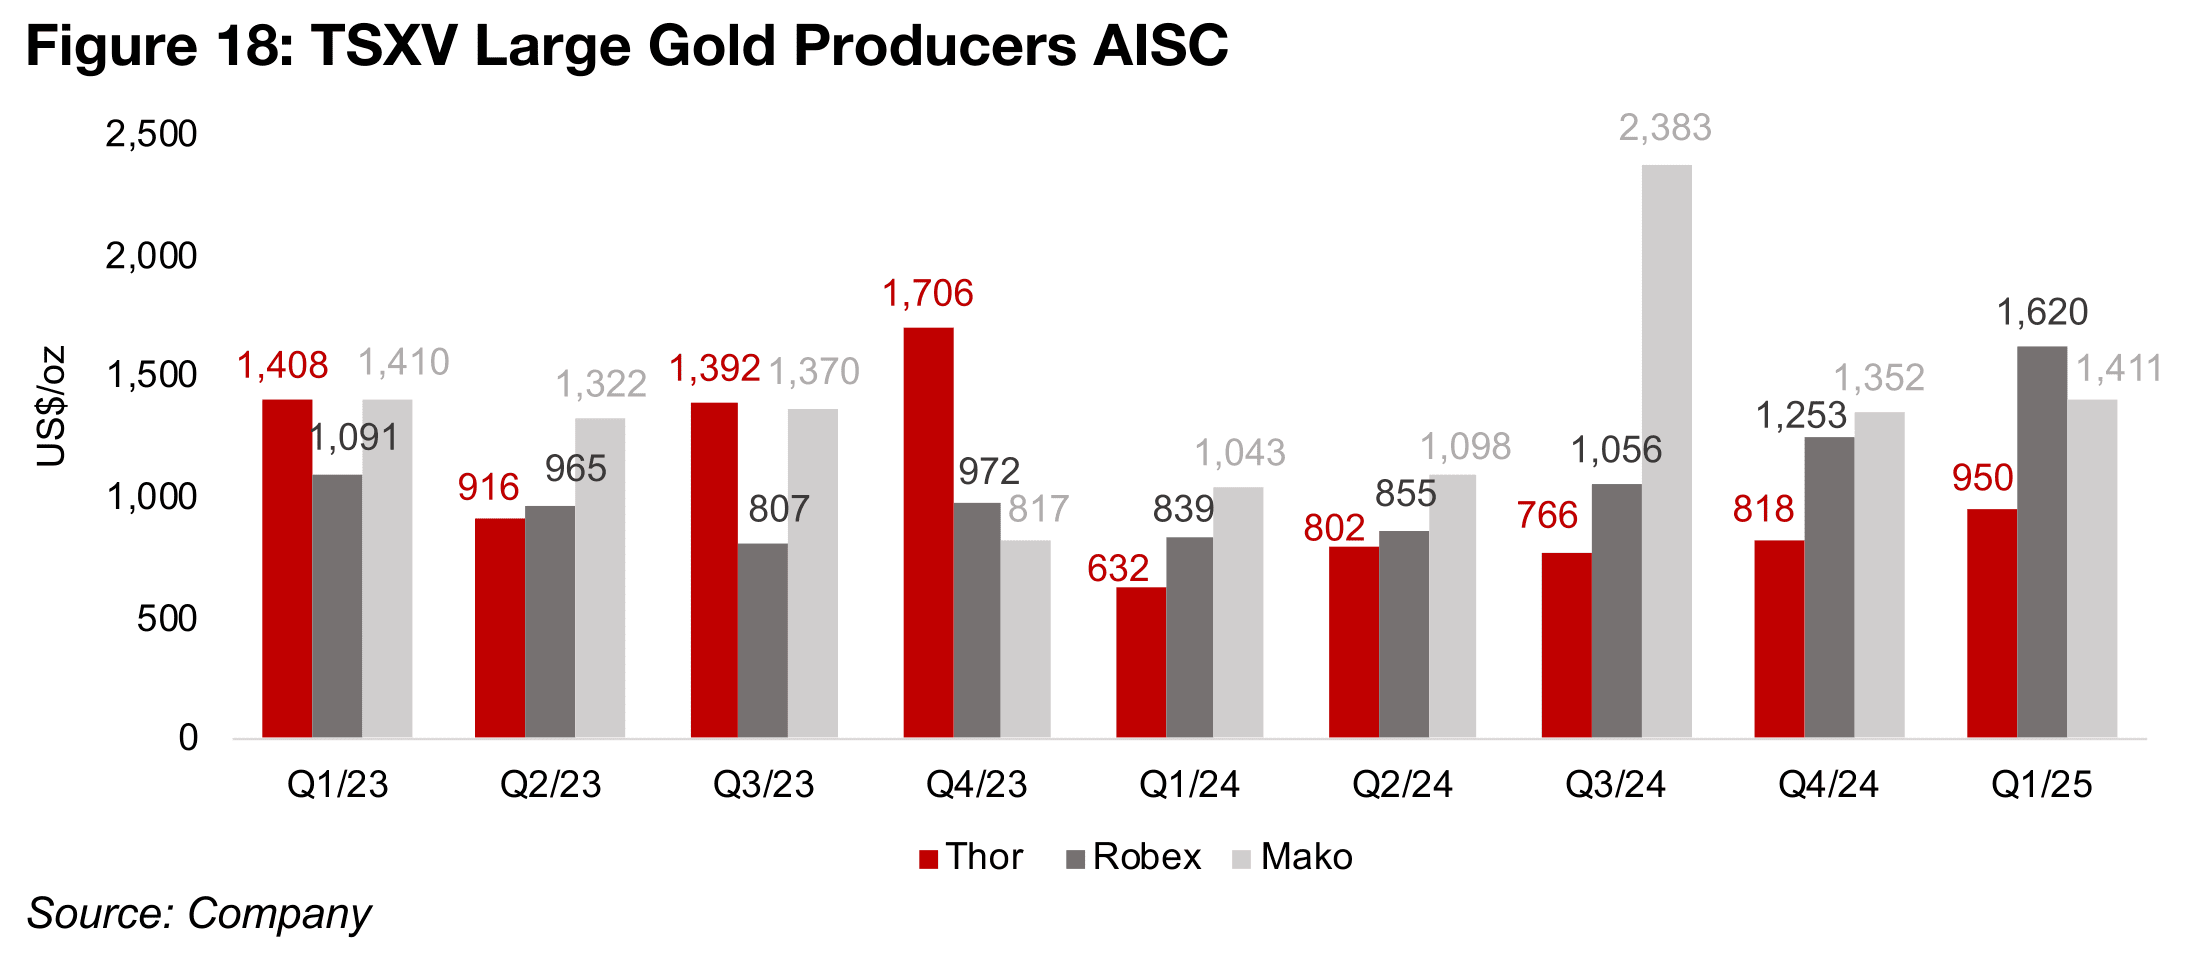
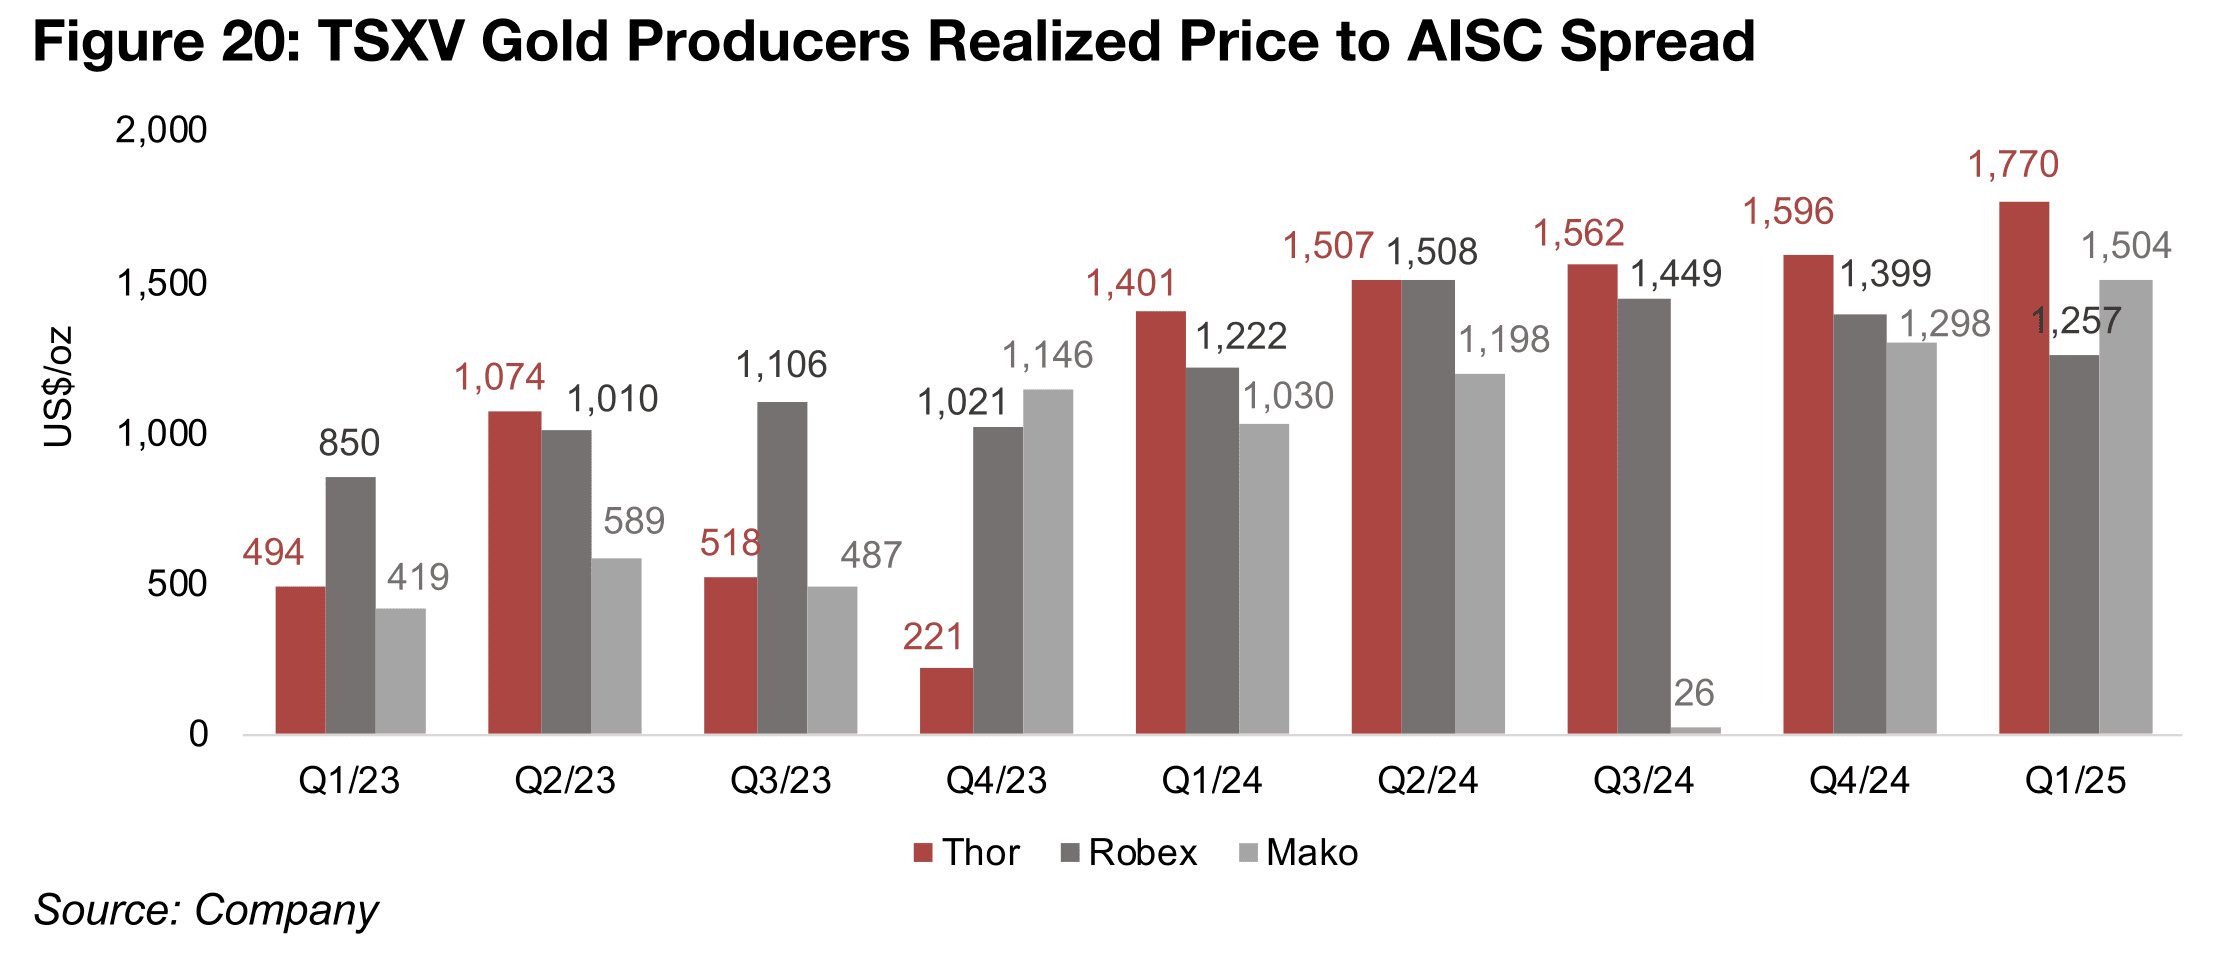
There has clearly been an uptrend in costs, from lows for all three in Q1/24, with the all-in-sustaining-cost (AISC) for both Thor and Robex relatively high in 2023 driven by company specific operating issues. Mako also had a very high AISC in Q3/24 on exceptional issues, but it had declined back inline with the overall trend by Q4/24 (Figure 18). However, the rise in costs has been offset by the rise in the realized gold price from 2024 after relatively flat prices through 2023 (Figure 19). This has driven a rise in the realized gold price to AISC spread, with Thor by far leading the group since 2024, given its low AISC, with Robex having the second highest spread through 2024, but Mako moving ahead in Q1/25 (Figure 20).

The strong operational performances have seen the sector cash rise considerably, more than doubling to $59mn in Q1/25 from $20mn in Q1/24 (Figure 21). While there was a huge jump in cash for Robex in Q2/24, this was from capital raising, and was put into project development, exploration and debt reduction over the next two quarters. The sector has also reduced debt from a peak $154mn in Q2/23 to just $39mn in Q1/25, with Thor having paid down all its borrowings last quarter, with the remaining debt only leases (Figure 22). While Robex has comprised the largest proportion of debt over the past two years, it has seen a major decline from $97mn in Q2/23 to $27mn in Q1/25.


Disclaimer: This report is for informational use only and should not be used an alternative to the financial and legal advice of a qualified professional in business planning and investment. We do not represent that forecasts in this report will lead to a specific outcome or result, and are not liable in the event of any business action taken in whole or in part as a result of the contents of this report.
Author
Ben McGregor authors the Weekly Roundup at CanadianMiningReport.com, providing sharp analysis of the metals and mining sector. With a talent for spotting trends, Ben distills complex market shifts into clear, engaging insights on TSXV junior miners. His weekly updates cover gold, copper, uranium, and more, blending data-driven perspectives with a knack for identifying opportunities. A vital resource for investors, Ben’s work navigates the dynamic junior mining landscape with precision.