
July 10, 2023
The gold price rose 0.3% to US$1,926/oz, edging up for a second week as US unemployment data painted a mixed picture for the economy, while US and EU bond yields have flattened this year especially in contrast to the huge surge in 2022.
The average gold price forecast from several major banks has jumped around US$200/oz jump since we last reported the data in April 2024, including the World Bank, which is forecasting a rise in most major metals this year, but a decline in 2024.
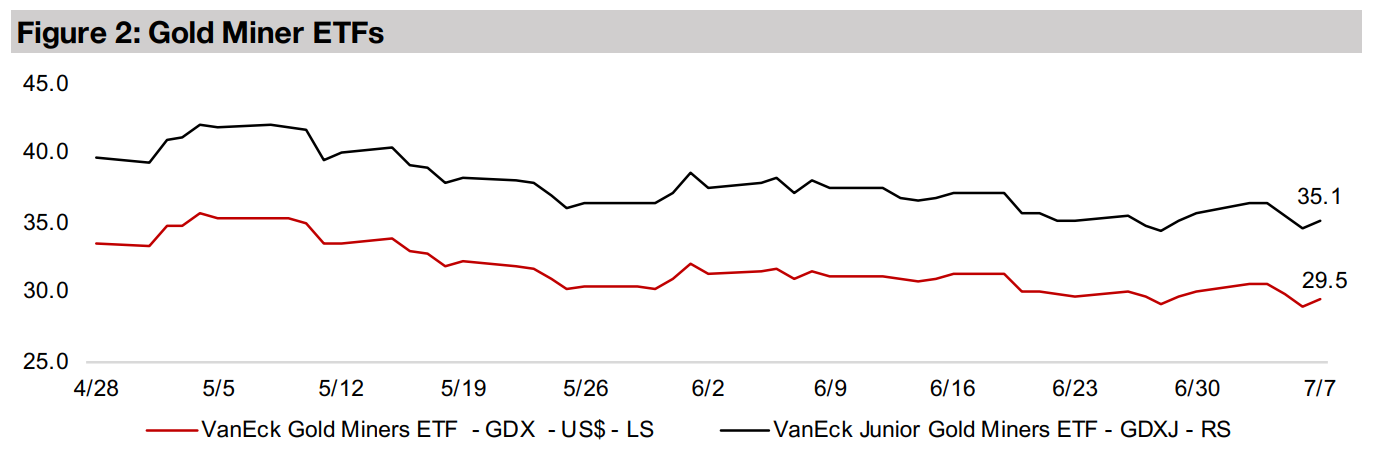
Overall gold stocks were down with the GDX declining -2.2% and GDXJ off -1.7% with a slide in equities offsetting the uptick in the gold price, although the larger TSXV gold stocks were mixed, with some internationally-focussed names rising.


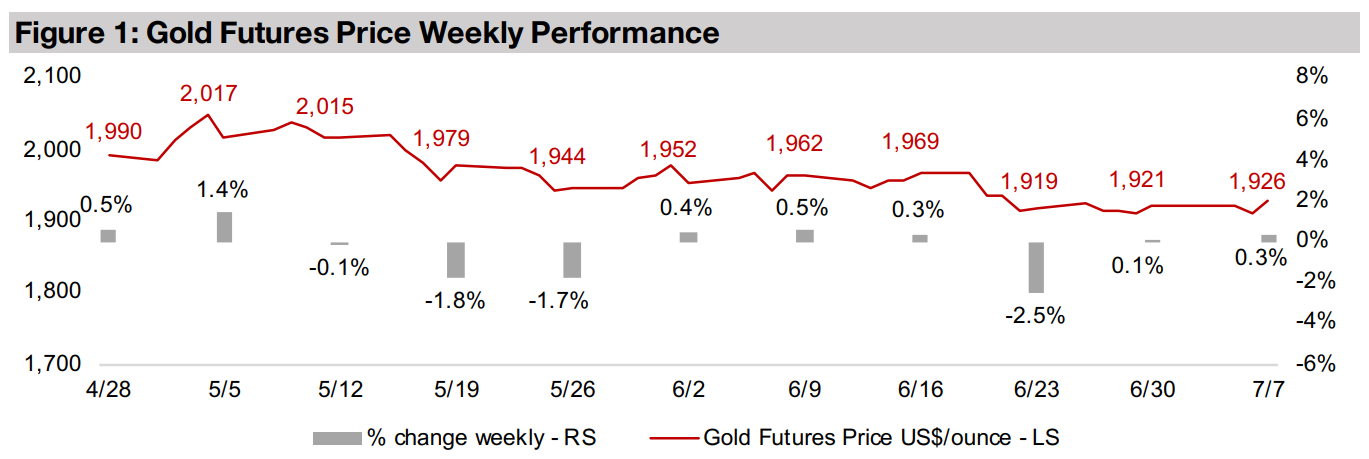
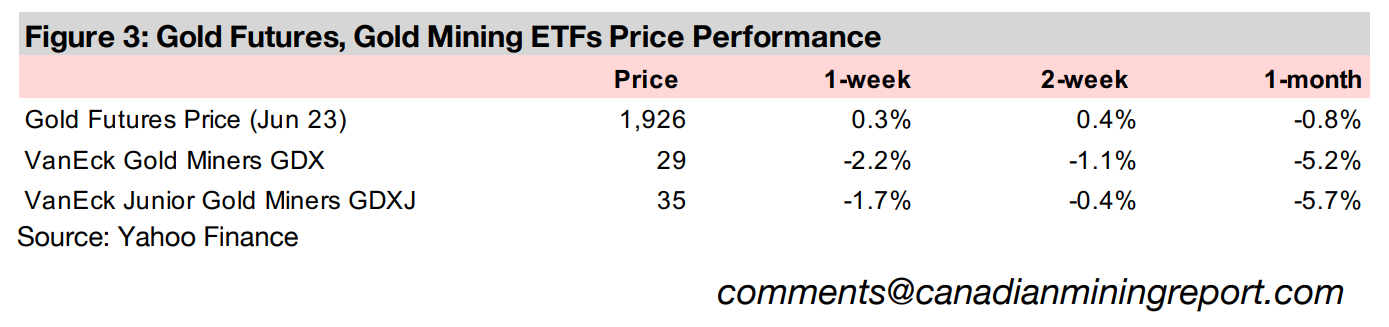
Gold ticked up 0.3% to US$1,926/oz and has averaged around the US$1,920/oz level
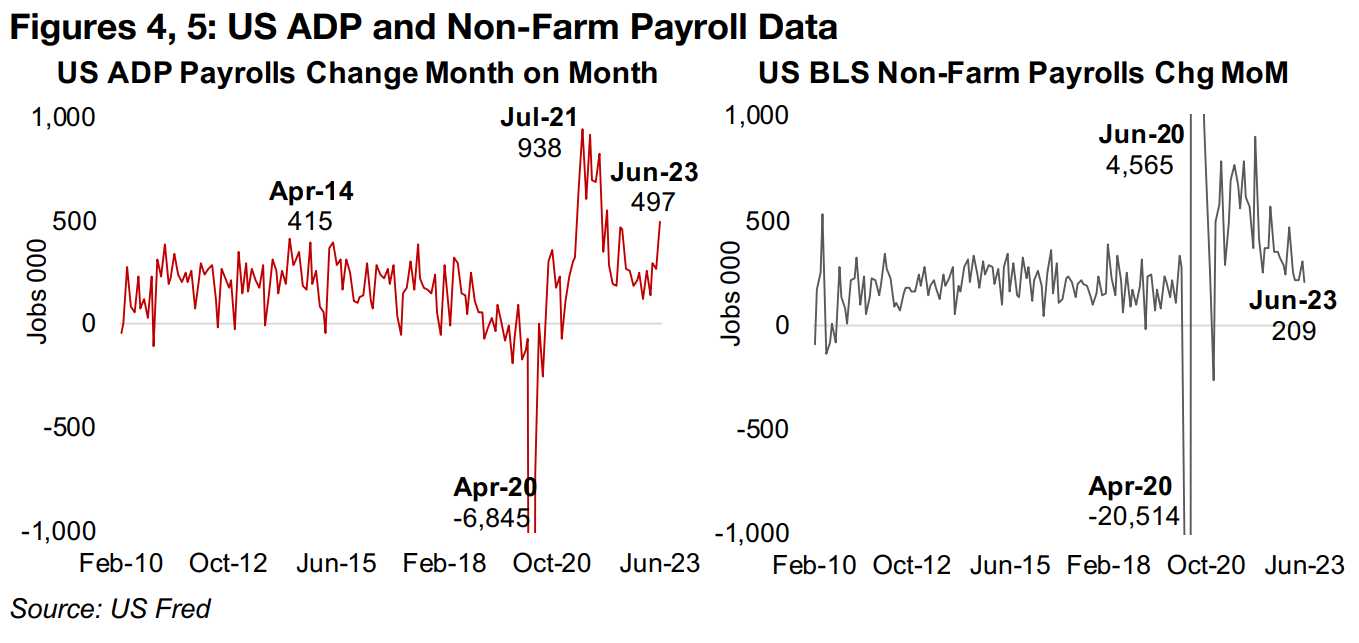
for the past three weeks. The major economic news this week was two labour market
reports in the US, the ADP Payrolls, and the Bureau of Labor Statistics (BLS) non-farm payrolls. The US ADP Payrolls rose 497k in June 2023, above consensus
estimates and suggesting a hot labor market, and marking a reversal of a downtrend
from July 2022 to January 2023 seeming to indicate a cooling US job market (Figure
4). The number was substantially above even the peak growth during the mid-2010s
boom, at 415k in April 2014, and the highest number since 551k in February 2022.
This drove a negative reaction in markets, suggesting a continued hawkish stance by
the US Fed as the booming job market implies inflation pressure. However, the BLS
non-farm payrolls rose just 209k, coming in below expectations, at its lowest level
since December 2020, continuing a downtrend and offsetting the strong ADP number
to some degree (Figure 5). Overall, though, the market still expects a hawkish Fed to
hike its base rate 0.25% at its July 2023 meeting, to 5.50%-5.75%, which will see
rates heading for three-decade highs.
The key factor that has allowed both the US Fed and the European Central Bank to
storm ahead with rates hikes has been a robust employment situation in both regions.
The Fed has a dual mandate to both maintain price stability and to maximize
employment, and while the ECB officially has only a single mandate to maintain price
stability, employment levels will certainly be a defacto concern. Strong employment
has seen these central banks concentrating on their inflation fight, and while headline
CPI numbers have been declining in both the US and EU, core inflation has been
stubborn and driven the continued hawkish stance.
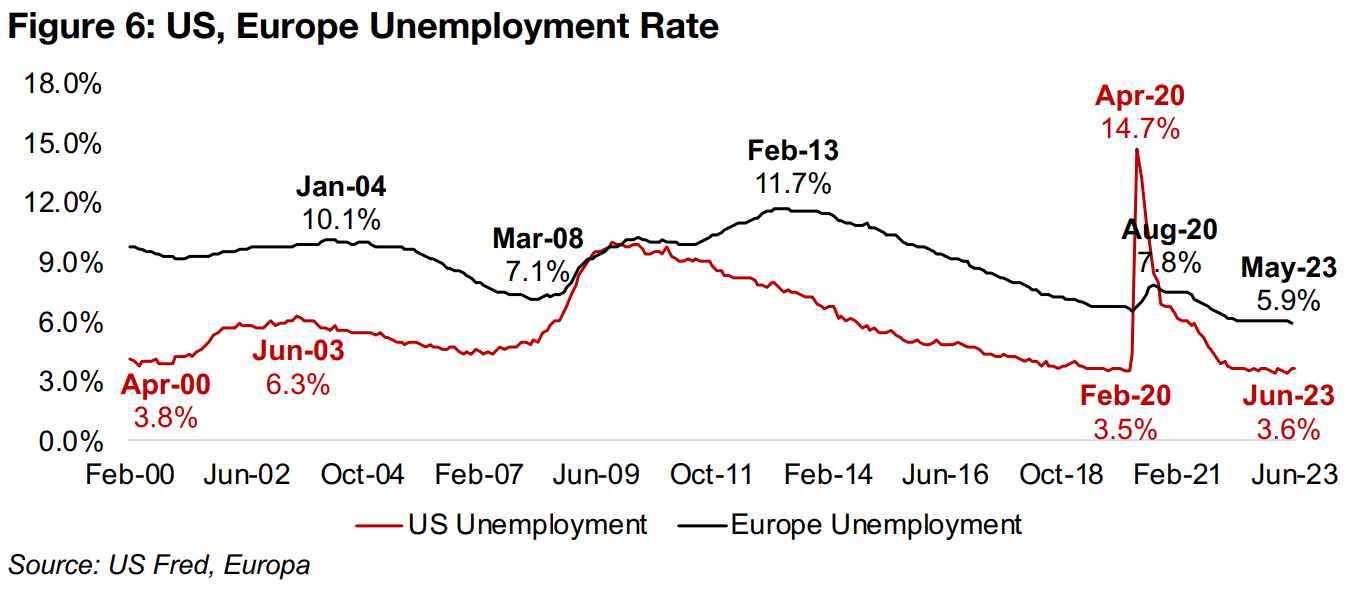
US unemployment declined in June 2023 to 3.6% from 3.7% in May 2023, up slightly
from twenty-year lows of 3.5% in March 2023 (Figure 6). European unemployment,
which is structurally higher than the US, was also at over twenty years lows at 5.9%
in May 2023, trending down from a peak of 7.8% in August 2020, well below the 14.7%
peak in the US in April 2020. As long as employment remains strong it will allow these
central banks to continue with rate hikes if they deem them necessary. We also
expect that they are willing to accommodate a moderate rise in the unemployment
numbers if there is a trade-off of core inflation declining towards their 2.0% targets.
While the short-term base rates of the central banks continue to rise, longer-maturity
bond yields have flattened in 2023, causing a heavy 'inversion' of yield curves.
Generally higher maturity bonds have higher yields to account for their higher risk
over time, but in rare periods they have lower yields than shorter maturities, which
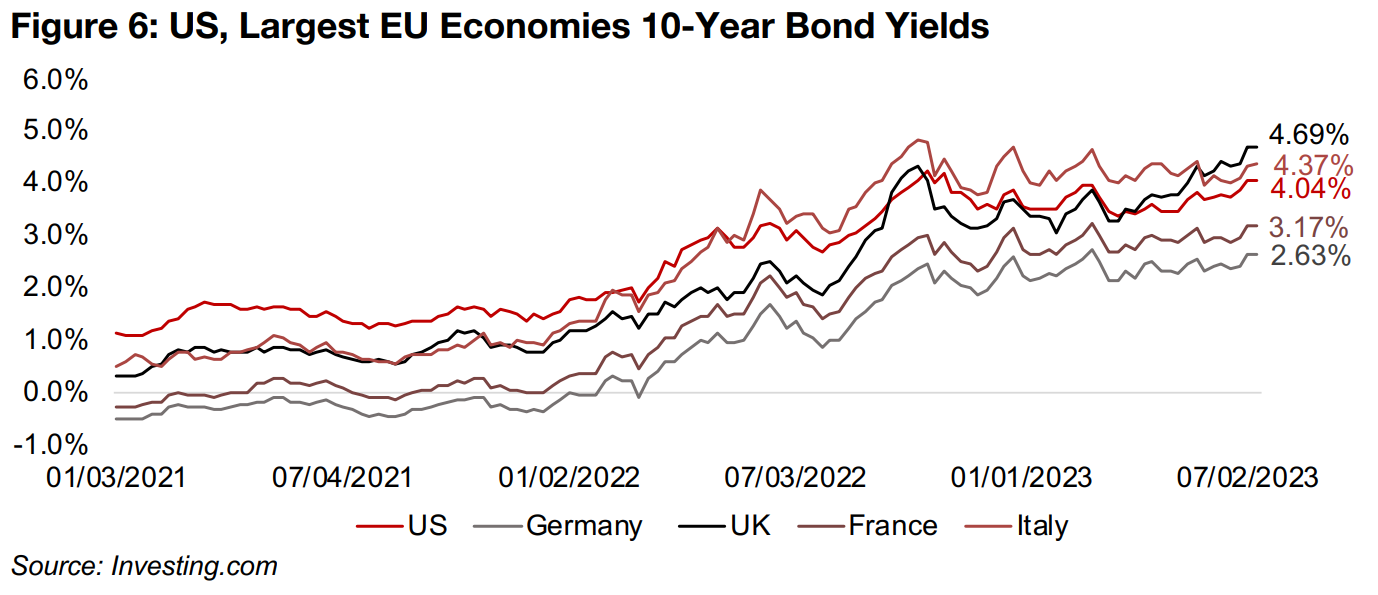
historically often indicates an upcoming recession. The surge in global 10-year bond
yields over 2022 has settled down in 2023, with the US at 4.05%, slightly off a peak
of 4.16% in October 2022 (Figure 7). In Europe, only the UK has set recent new highs
with the 10-year at 4.69%, with Italy's 4.37% yield down from a 4.63% high in
February 2023, France's at 3.17%, near flat from its February 3.21% high, and
German yields at 2.62%, considerably down from a 2.71% peak in February 2023.
These yields are critical because as they pass a certain level things tend to start to
'break' economically. The first sign of this was the March 2023 banking crisis, which
was driven almost entirely by the surging rates decreasing the value of bonds on
banks' balance sheets, and increasing concerns about their solvency. While there
has been no major fallout since, consumers and businesses facing rapidly rising
interest payments and high inflation will likely be reconsidering purchase and
investment decisions that would have seemed viable with the low rates of just a year
ago, and this could eventually drive an economic slowdown.
Currently it is widely expected that the rate hike cycle in the US and Europe is coming
to an end, which explains the flattening of yields in 2023; the market is indicating that
it expects the current high rates not to last long. However, if these expectations prove
wrong, inflation persists and interest rates head for a range of over 3.0%-6.0% for
these economies, we expect that more things will start to 'break', similar to the March
2023 banking crisis. Also, even if central banks don't hike much more, they have
indicated that they will hold rates at these relatively high levels for an extended period.
This raises the question of whether rates even at current levels can continue without
generating serious economic fallout heading into 2024.
That gold has continued to see strong support by the market is interesting given the
continued surge in short-term interest rates. This has made real bond yields much
less negative, making these instruments increasingly attractive versus yieldless gold,
and potentially drawing away some fund flows from the metal. Also, the money supply
in the US has been contracting for the first time in decades and EU money supply
growth is nearing zero. With the value of the gold stock a relatively steady fraction of
the global money supply over the past decade, we might have expected a money
supply contraction also to be negative for the gold price.
However, as the inverted yield curves indicate, the market is simply not expecting
that rate hikes can continue much farther, and that central banks could start to ease
monetary policy as early as next year, giving a boost to gold. They are also likely
pricing in increasing geopolitical tensions over the past year, providing an additional
premium for gold, as it acts a general risk hedge, in addition to being driven by the
core monetary drivers. This could also explain the rise in the stock market this year,
with the market perhaps starting to price in much lower rates. Of course, there is the
offsetting issue that the recession that would likely be the cause of such lower rates
would also hit company earnings, putting downward pressure on stocks.
However, it is common in stock bubbles for investors to throw caution to the wind, especially near the end of a boom, and become less concerned about the potential downside. It could also be the case that the market has split, with the more cautious piling into gold and the more bullish moving heavily into stocks, or that the bulls are hedging their bets with gold. This is considerably different from the stock boom and gold bear market from 2012 to 2018, when rates were so low for so long that the market shifted almost entirely to risk on with safe havens like gold eschewed. The current stock boom is a very different one, and looking increasingly risky, with interest rates near several decade highs and valuations extended, which explains why investors are much more prone to hold gold for protection this time around.
If a broad correction (or crash) in the stock market does occur, we expect that it would
drive a flight to safety in gold. However, the problem for gold stocks is if a rise gold
does not offset the broader risk off pressures in a stock crash, which can fall
especially heavily on small caps. However, we have had a test of such a scenario
during the March 2023 banking crisis, and the gold stocks passed with flying colors.
While the Russell 2000 small cap index dropped -13% from the start of February
2023 to the end-April 2023, gold rose 13% from early March 2020 to end-April. This
helped drive the GDX ETF of producing gold miners up 34.5% from early March lows
to its mid-April 2023 highs while the GDXJ ETF of junior miners gained 34.7%.
The underperformance of gold stocks since, with the GDX down -18%, and the GDXJ
down -20%, has mainly been because there was a return to risk-on as authorities
reacted quickly to the banking crisis and drove liquidity into the market. However, for
the second half of 2023, liquidity is expected to decline, with the US money supply
already contracting since December 2022, and EU money supply growth is also
rapidly heading towards zero. It suggests that sustaining the current stock bubble,
which is also driven by just a handful of tech stocks, could be difficult.
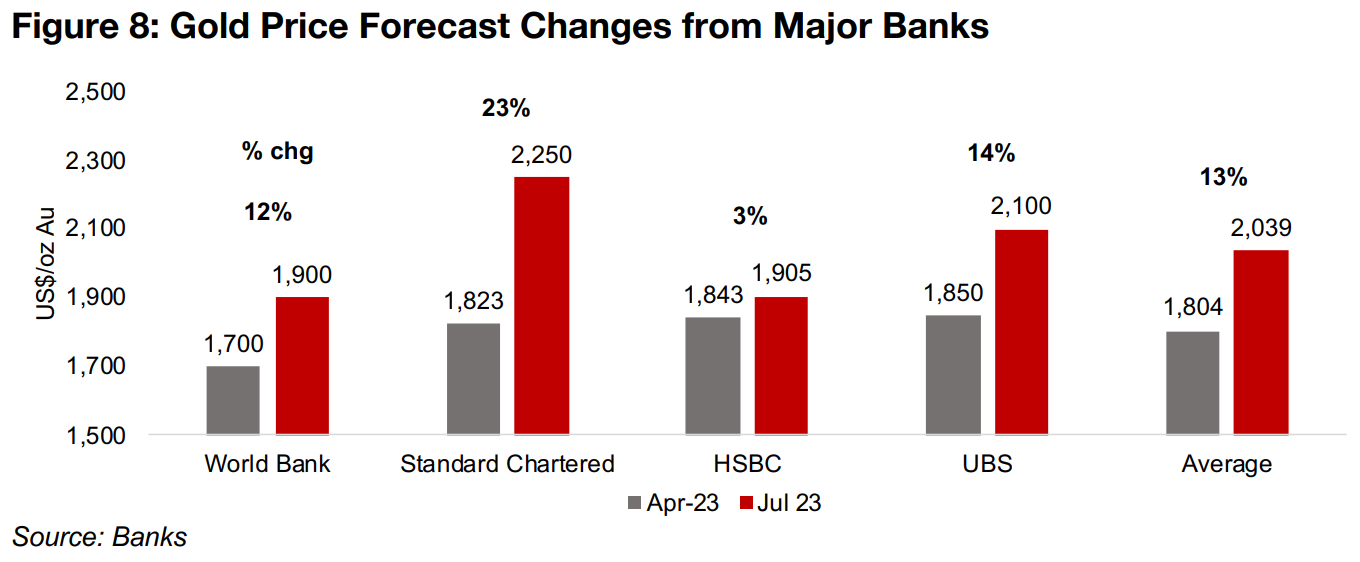
Several major banks have made considerable upgrades to their targets on gold over the past three months since we reported the estimates from several institutions in April 2023. At that point the average estimate for thirteen banks and other financial institutions was just US$1,821/oz, but as the price has now averaged US$1,933/oz so far in 2023, they are starting to revise their targets upwards. As this point, it would take an average gold price below US$1,700/oz over the second half of this year to pull the average down to the April consensus estimate, which seems unlikely. While new estimates are not available from all banks comprising the April 2023 average, four have provided updates, with the World Bank, Standard Chartered, HSBC and UBS boosting their targets 12%, 23%, 3% and 14%, respectively, with a 13% rise in the average for the four to US$2,039/oz from US$1,804/oz (Figure 8).
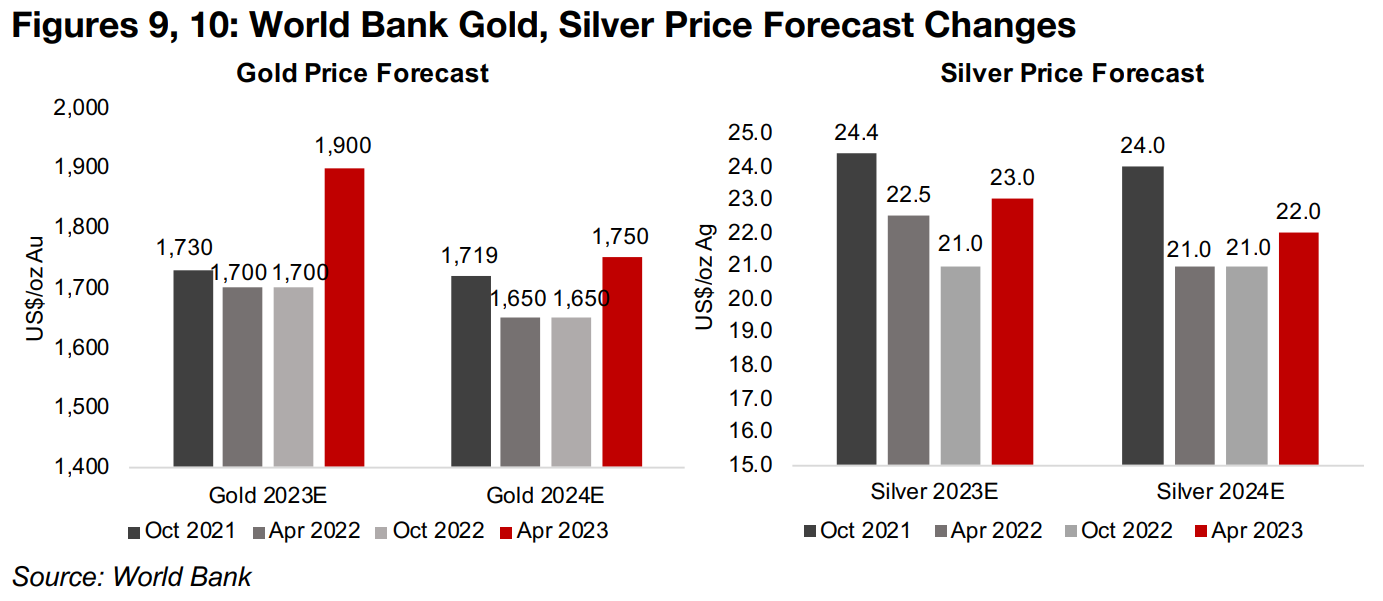
We can track the evolution of the gold price forecast through the estimates of the
World Bank, which are reported every six months, in contrast to updates to targets
in press articles from the major investment banks which are comparably inconsistent.
For 2023, the World Bank was expecting a gold price around US$1,700/oz for about
a year and half until a significant upgrade in April 2023 to US$1,900/oz, as gold
averaged US$1,900/oz for Q1/23 and rising risk from the banking crisis was likely
incorporated (Figure 9). However, the World Bank still expects gold to decline next
year, with an estimate of just US$1,750/oz, although this is a US$100/oz boost from
the previous US$1,650/oz target.
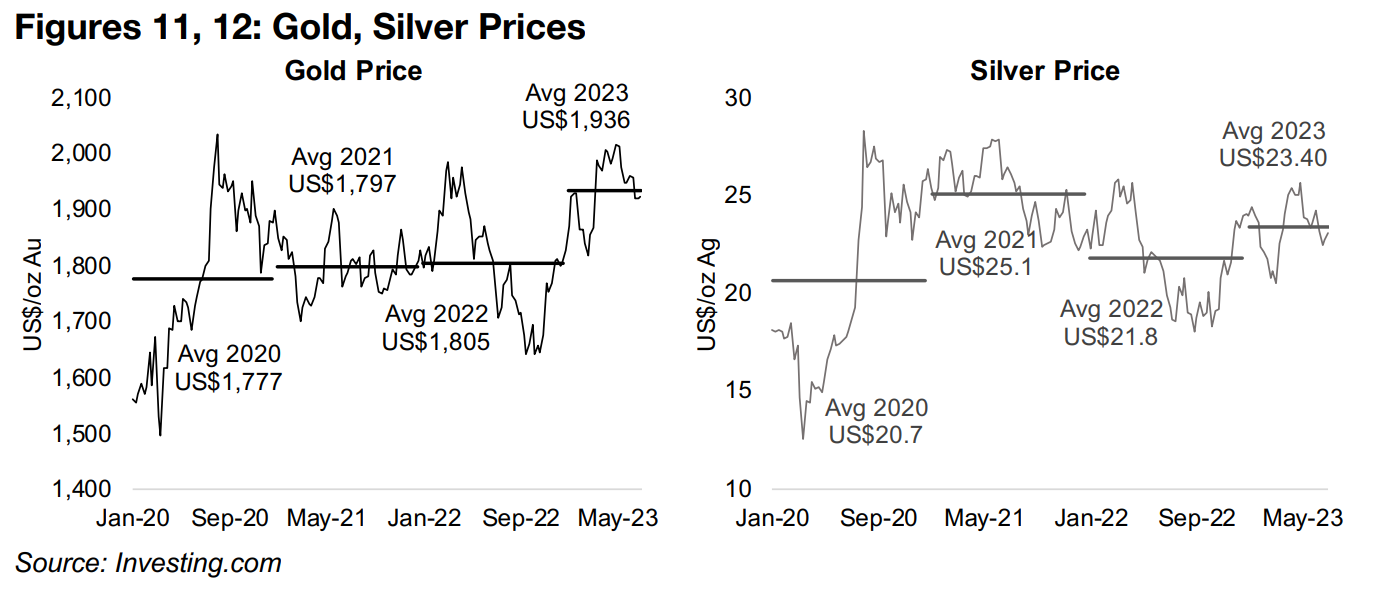
We expect that the 2024 estimate is likely too low, and the World Bank has proved
overly bearish on the gold price in recent years. Even with the gold price averaging
just below US$1,800/oz in 2021 and just above it in 2022, the October 2021, April
2022, and October 2022 World Bank estimates for 2023 implied a contraction to
around US$1,700/oz (Figure 11). We see most of the major drivers aligned in gold's
favor for 2024 including rising recession risks, a potential return to monetary easing,
and high geopolitical risk, which combined could see gold easily surpass the WB
estimate.
The World Bank was more bullish on silver in 2021, as the price averaged US$25.1/oz
in 2021, and the bank assumed this level would be sustainable, with a US$24.4/oz
estimate for 2023 and US$24.0/oz estimate for 2024 (Figures 10, 12). However, the
drop in the average silver price to US$21.8/oz in 2022, after an extended drop in the
base metals through mid-2022, drove down the WB estimate to lows of just
US$21.0/oz for 2023 and 2024 by October 2022, However, with the silver price
recovering to US$23.4/oz on average in 2023, the World Bank has boosted its
estimate for 2023E to US$23.0/oz and expects a slight decline to US$22.0/oz in
2024E.
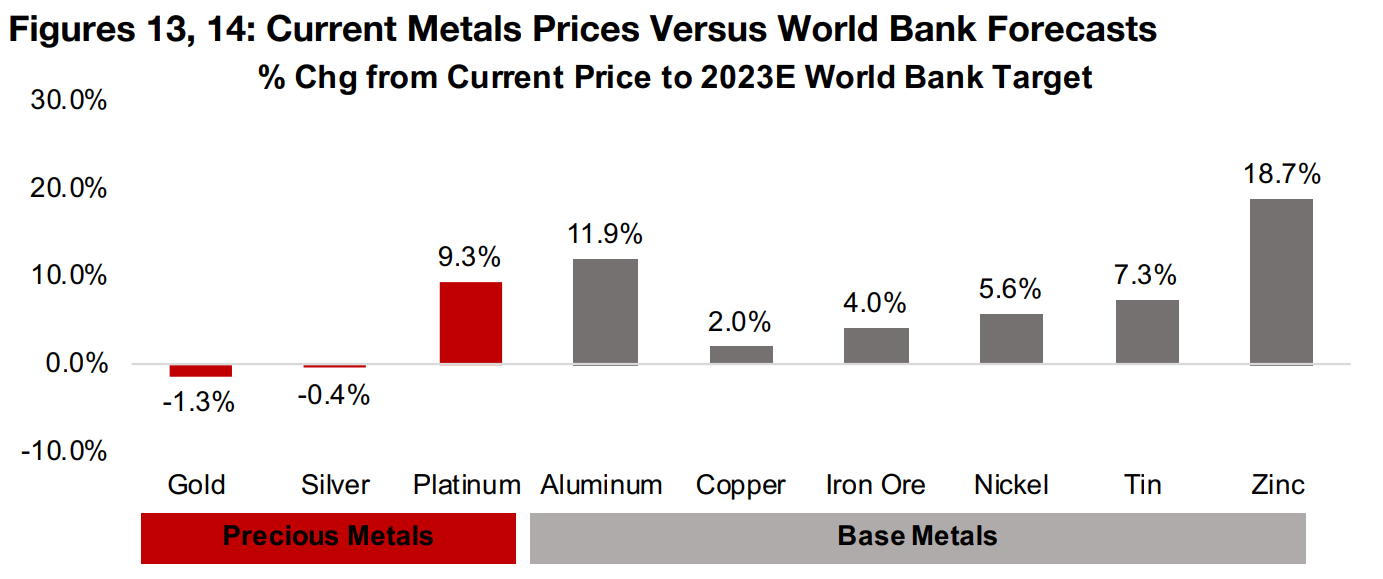
The World Bank is bullish on the outlook especially for the base metals in 2023,
expecting a further rise in their prices to hit the WB targets, with strong gains
especially for aluminum, tin and zinc (Figure 13). It is less upbeat on gold and silver
after its recent substantial upgrades, expecting them to be near flat, although it
expects to platinum to rise 9.3%. Overall these estimates would seem to indicate
expectations for an improvement in the industrial cycle over the second half of 2023.
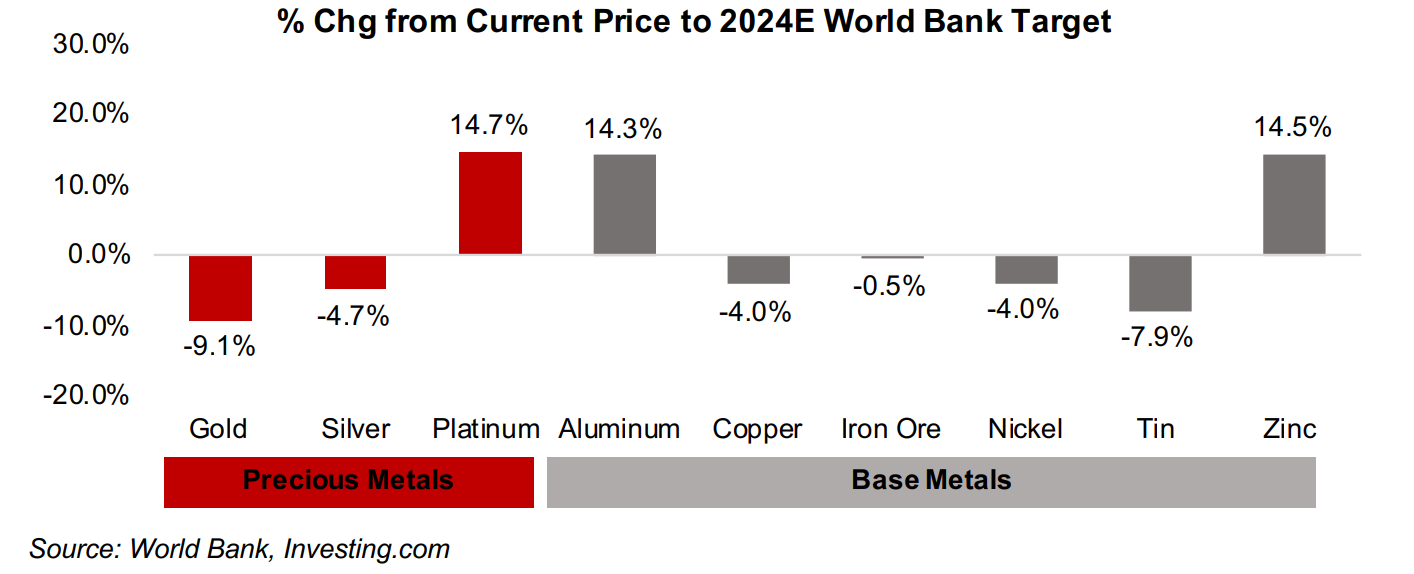
However, by 2024, the World Bank expects a decline in several major base metals
from current levels, copper, iron ore, nickel and tin (Figure 14). This seems to indicate
a slower global economy next year, with the rise in aluminum possibly an outlier
driven by sector specific factors more than broader macro drivers. While this would
seem to indicate rising risks, at the same time the World Bank expects a considerable
decline in gold and silver, suggesting a move out of these risk hedges next year.
This appears to be a contradiction to us, and we would expect a downturn in the
industrial cycle, and therefore in the base metals, to in turn imply a recession, driving
a further move into safe havens like gold and silver. We therefore believe that the
World Bank could once again be understating the outlook for gold in 2024, as it has
for most of past two years.
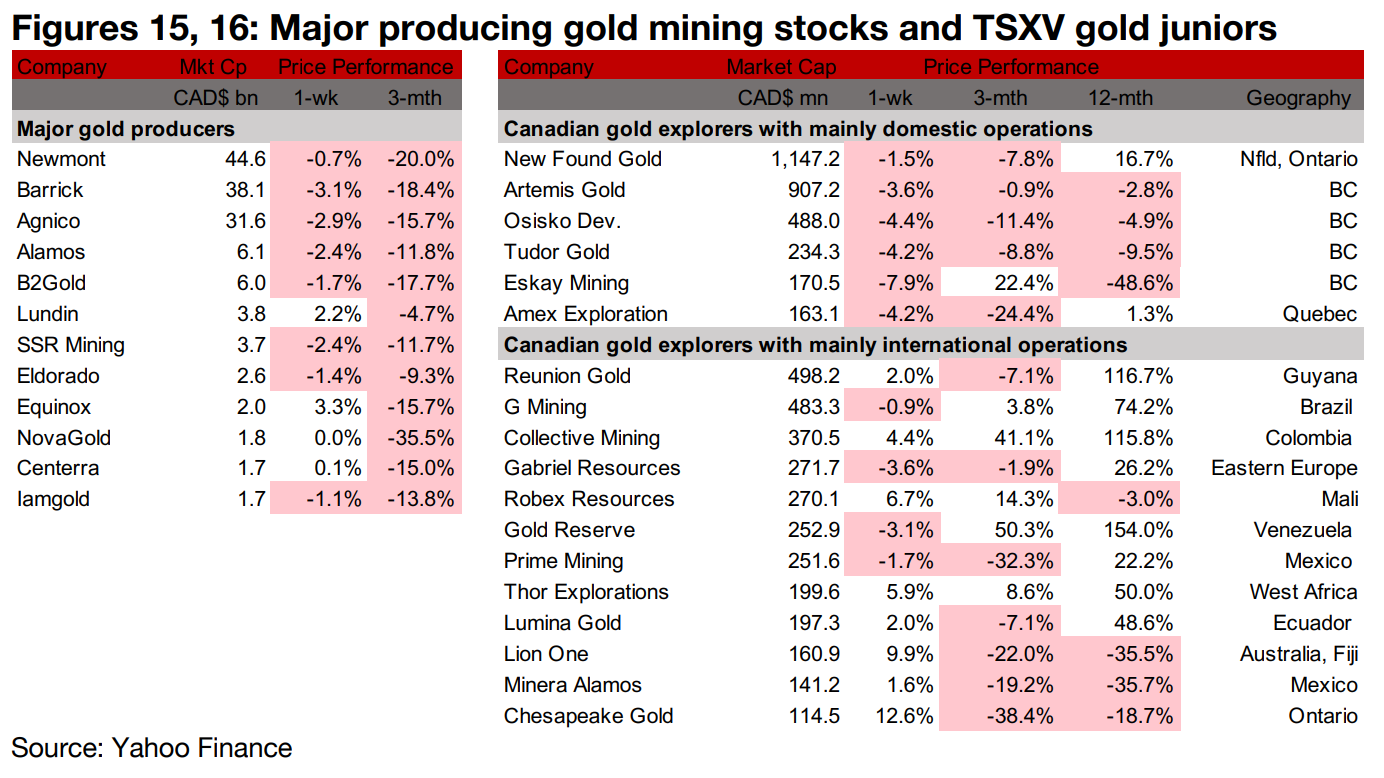
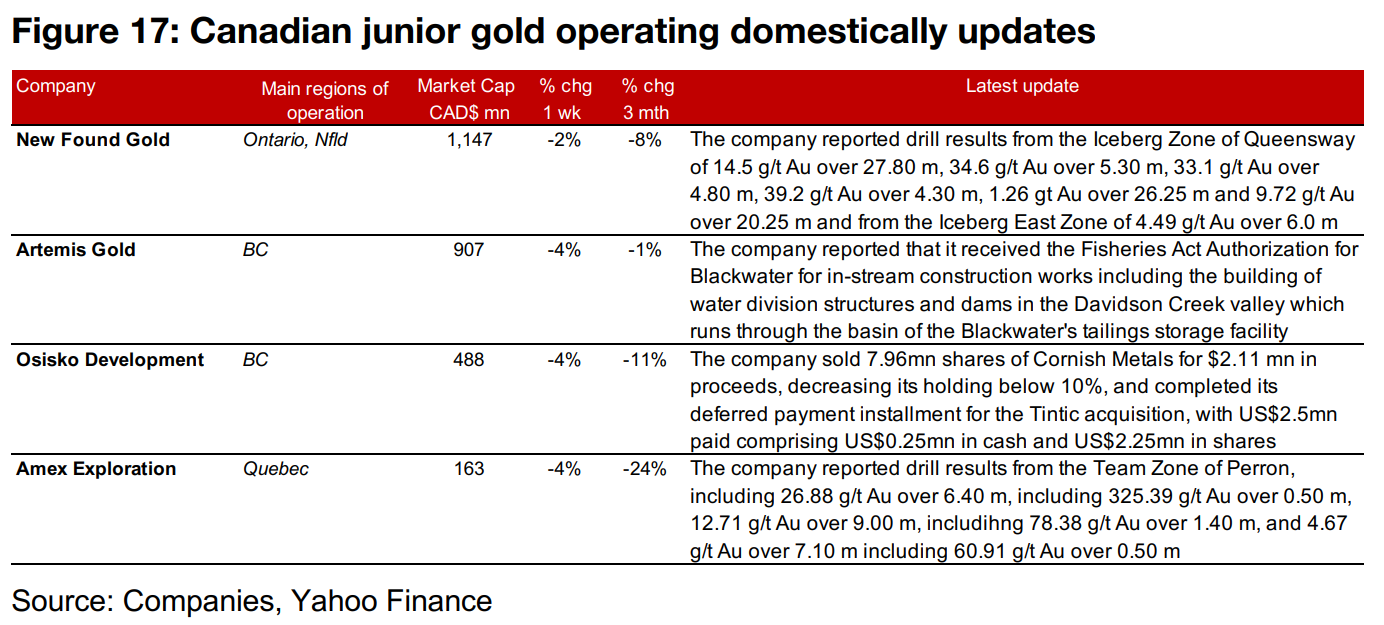
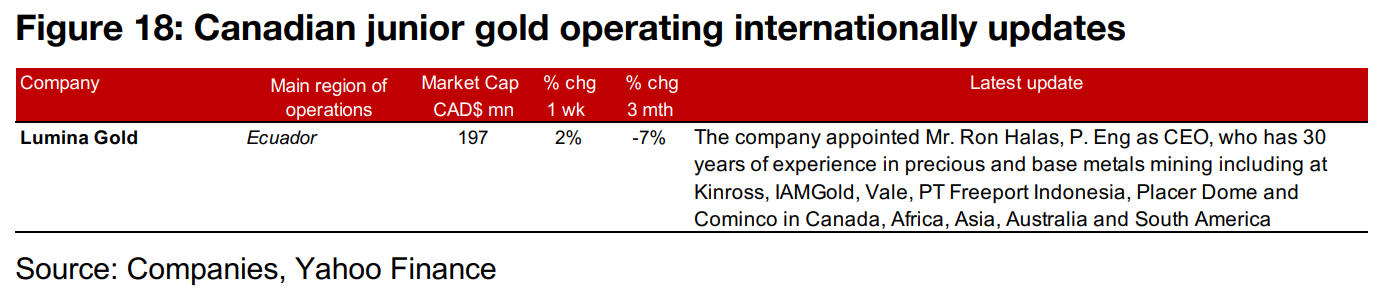
The gold producers were mainly down while TSXV gold stocks were mixed (Figures 15, 16). For the TSXV gold companies operating domestically, New Found Gold reported drill results from Queensway, Artemis received its Fisheries Act Authorization for Blackwater, Osisko Development decreased its holding in Cornish Metals below 10% and Amex reported drill results from Perron (Figure 17). For the TSXV gold companies operating internationally, Lion One appointed Mr. Ron Halas as CEO (Figure 18).
Disclaimer: This report is for informational use only and should not be used an alternative to the financial and legal advice of a qualified professional in business planning and investment. We do not represent that forecasts in this report will lead to a specific outcome or result, and are not liable in the event of any business action taken in whole or in part as a result of the contents of this report.
Author
Ben McGregor authors the Weekly Roundup at CanadianMiningReport.com, providing sharp analysis of the metals and mining sector. With a talent for spotting trends, Ben distills complex market shifts into clear, engaging insights on TSXV junior miners. His weekly updates cover gold, copper, uranium, and more, blending data-driven perspectives with a knack for identifying opportunities. A vital resource for investors, Ben’s work navigates the dynamic junior mining landscape with precision.