
February 05, 2024
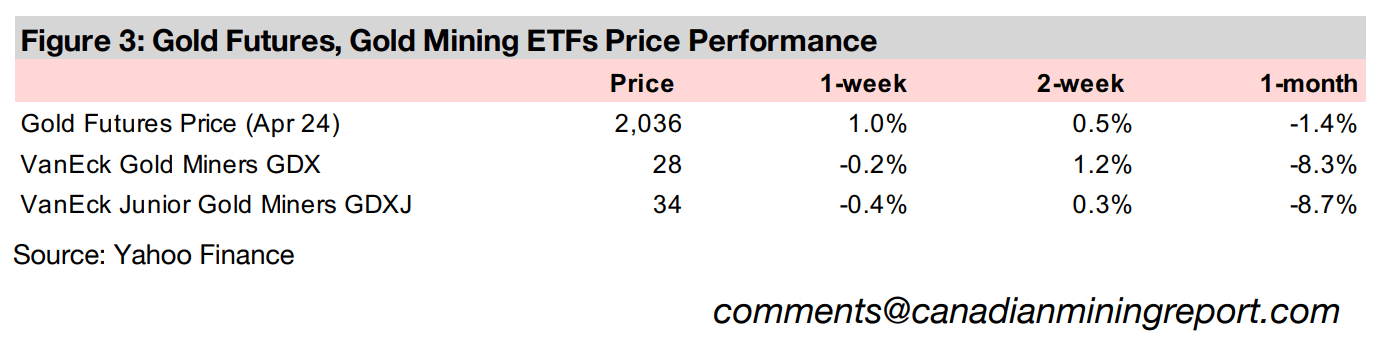
The gold price rose 1.0% to US$2,036/oz, even as the expectations for March 2024 rate cuts by the Fed dipped as US employment data far surpassed expectations, while January 2024 was the metal’s first full month ever above US$,2000/oz.
This week we look the performance of mining stocks versus their underlying metals prices since the start of 2023, with gold stocks lagging far behind the resilient metal price, with the underperformance of the stocks for several other metals less severe.
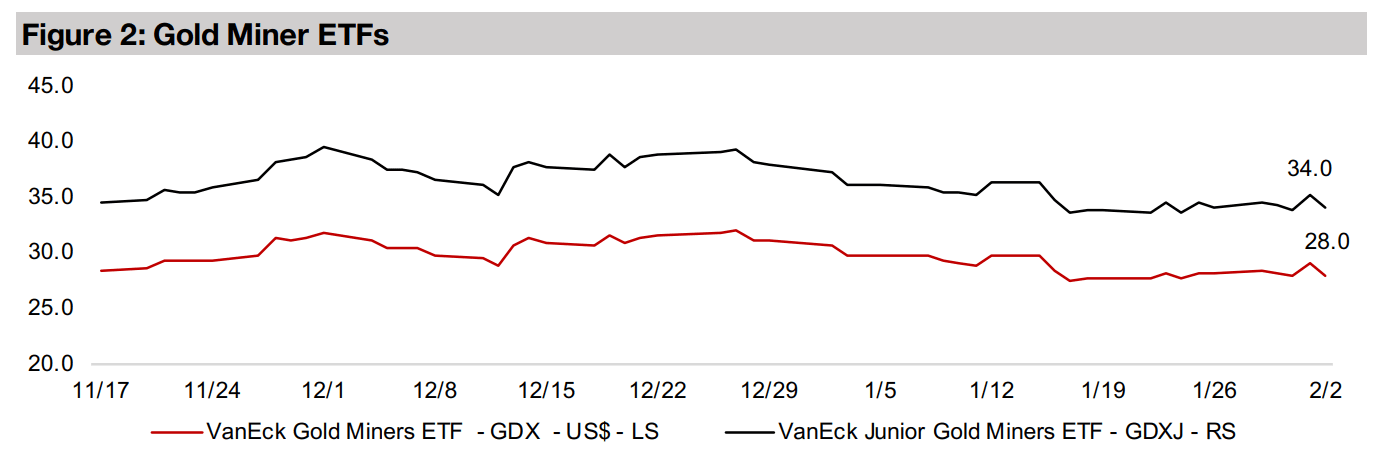
The gold stocks declined, with the GDX down -0.2%, as the main gains for large caps remained concentrated in US large-cap tech, which saw some quarterly earnings beats, while the GDXJ dropped -0.4% as the metal and small caps were both down.


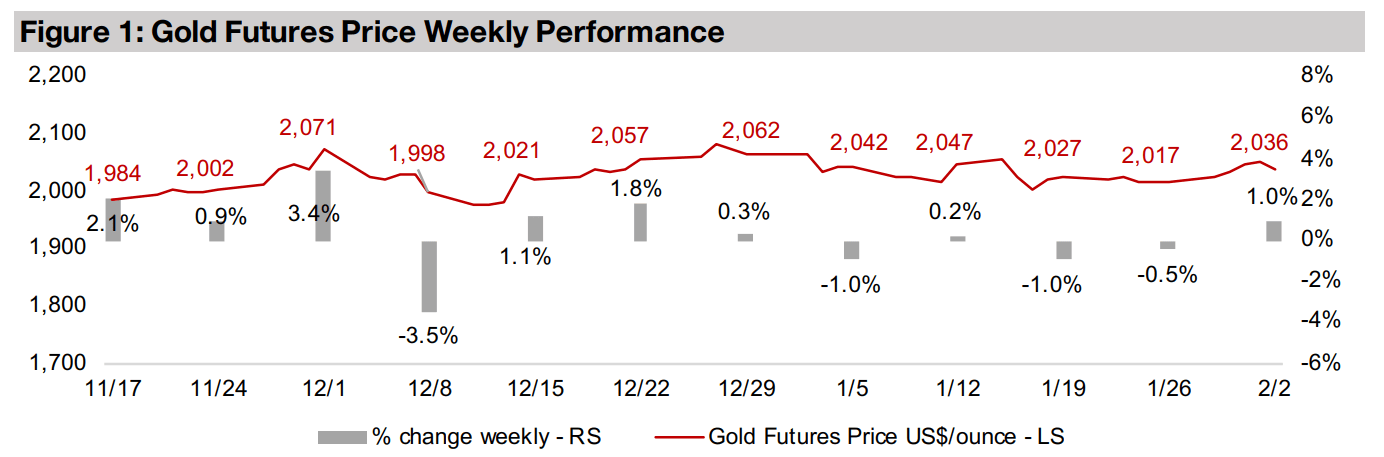
The gold price rose 1.0% this week to US$,2026/oz, closing every trading day in
January 2024 above US$2,000/oz, the first month this has ever been achieved by the
metal. The key economic data was US payrolls, which shocked the market to the
upside, and led to a drastic reduction in expectations for a March 2024 rate cut.
However, with the US earnings reporting season in full swing, this was offset by a few
key companies strongly beating expectations, including Meta and Amazon. Both are
part of a handful of US large-cap tech stocks which have driven a large percentage
of the gains in Nasdaq and S&P 500 over past few years.
While this support from large-cap tech led to a 1.34% rise in the S&P 500 and 1.74%
gain in the Nasdaq, it did not benefit the producing gold stocks, with the GDX down
-0.2%. The small-cap Russell 2000 index dropped -0.59%, as the risk of ‘higher for
longer’ rates for this part of the market was more the focus than any strong earnings.
This pressure on small caps also hit the gold juniors, and was not offset by the
moderate gain in the gold price, with the GDXJ down -0.4%.
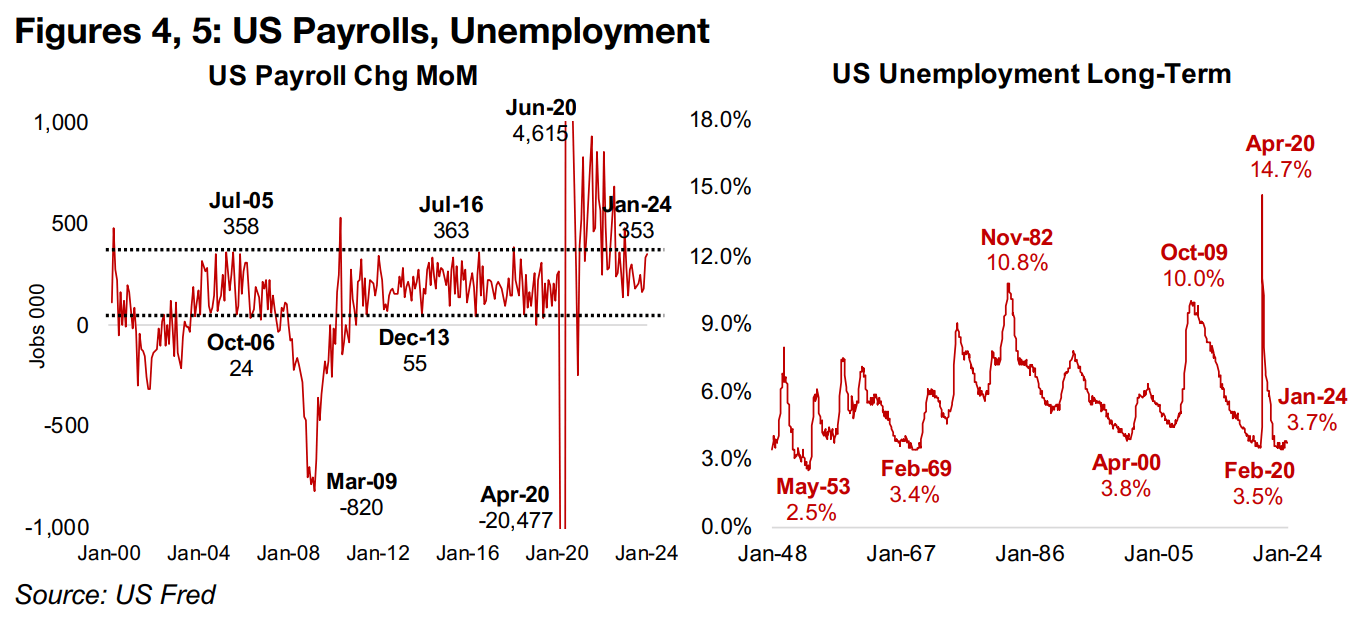
The US payroll numbers were particularly exceptional, with 353k jobs added month on month in January 2024, nearly twice the consensus expectation for 185k (Figure 4). This was certainly towards the top of the ‘normal’ range for payroll data between around 25-50k at the low end up to around 350k-360k at the high end. The only large deviations from this range since data started in 2000 are during major crises, including the early-2000s dot.com bust, the global financial crisis in 2008-2009 and then during the global health crisis in 2020-2021. The unemployment rate also remained low in January 2024 at 3.7%, flat month on month and still at one of the lowest levels in seventy-five years (Figure 5). These figures hardly indicate trouble in the US economy to a degree the Fed would feel heavily pressured into rapid rate cuts.
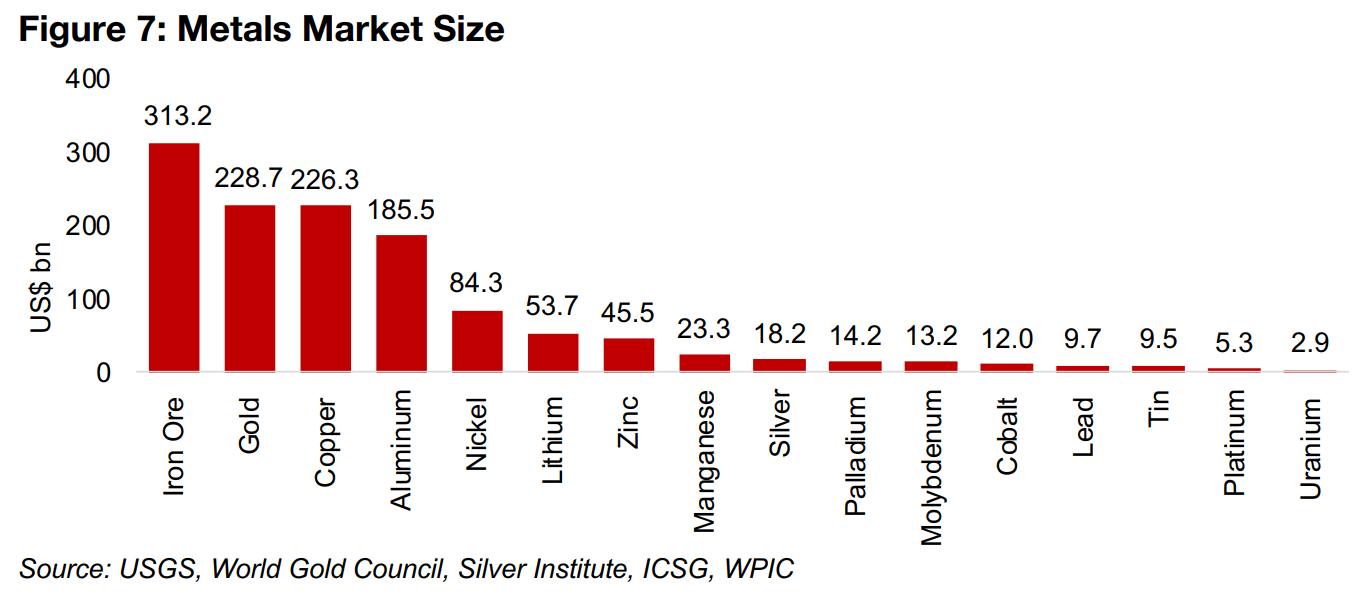
Most of the major metals markets have been struggling in early 2024, with prices of thirteen out of sixteen declining (Figure 6). Of the big four markets, only copper gained, but only by 0.3% (Figure 7). With the metal considered an indicator for developed countries’ economic outlook, the stagnation suggests a lack of a clear market view on how 2024 will pan out. Gold was also nearly flat, down -0.3%, as it consolidates above the US$2,000/oz level after a strong run in late 2023. With the metal tending to be an indicator of expectations for global monetary policy and broader risk, the market appears to view the up and downside for these factors as balanced for now.
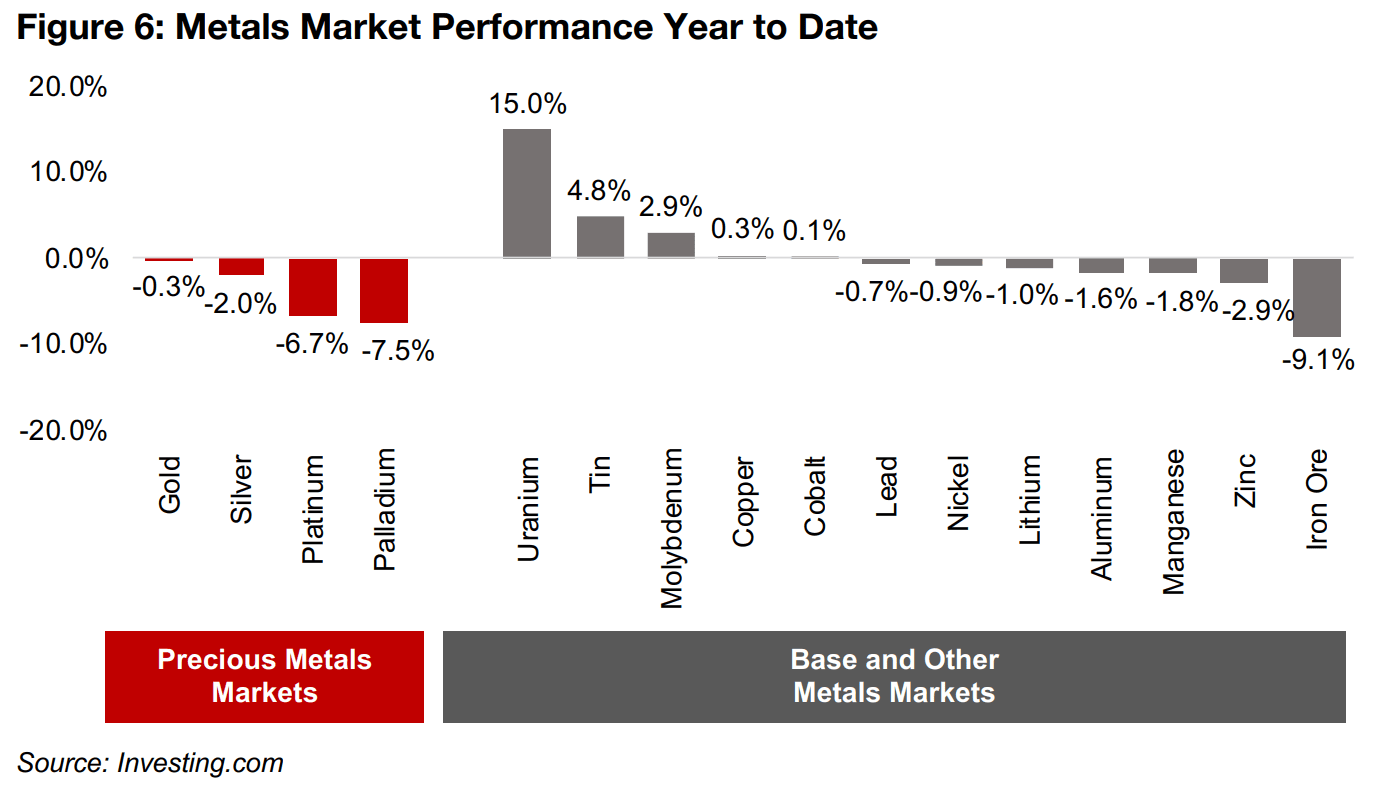
Aluminum declined -1.6%, and as a broader bellwether for the global economy, also showed a market not taking a particularly strong bullish or bearish view. Iron ore declined -9.1%, which is mainly on demand concerns in China, which accounts for 50% of demand for the metal, especially after the central bank there recently held rates flat, while markets were expecting a cut. The declines of other major metals this year have been similarly muted, except for platinum and palladium, down -6.7% and -7.5%, respectively. The only big gainer has been uranium, up 15.0%, continuing a multi-year secular upswing in the price as global policy support for nuclear power as part of green energy plans rises.
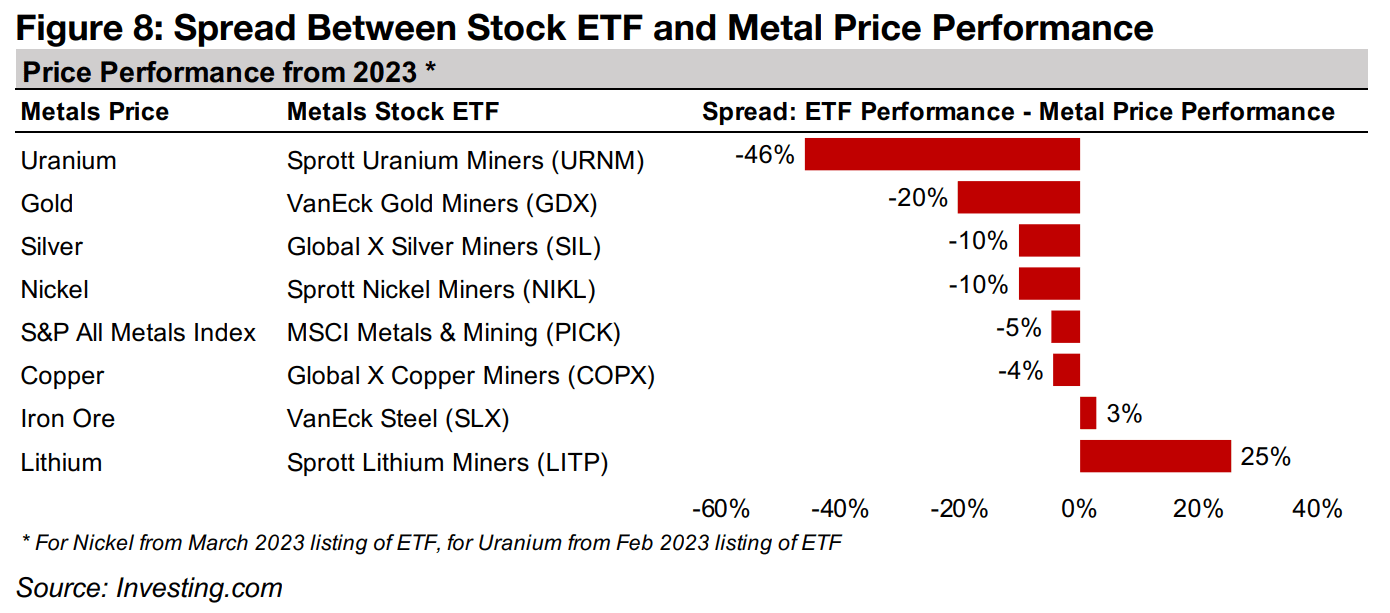
This week we look at the spreads in the performance of the metals prices and their respective stock ETFs since 2023 (Figure 8). The big laggards are the uranium and gold stocks, which are dramatically underperforming the strong gains in their underlying metals over the past year. Silver, nickel, copper have had more moderate underperformances, and iron ore a slight outperformance, with lithium the only sector where the stocks are actually far ahead of the metals price.
Starting with the broadest sector overview, in Figure 9 we compare the S&P All Metals Index, which includes all of the major metals, weighted by global production, to the MSCI Metals & Mining Stocks ETF (PICK). The two have seen a broad correlation since 2023 and currently have converged to only a -5% spread, with the All Metals Index down -3% and the PICK down -8%. In contrast to this, the spread between the gold price, which has risen 9% since 2023, and gold stocks, as measured by the VanEck’s Gold Miners ETF (GDX) which is down -11%, has reached -20%, its highest level over the period (Figure 10).
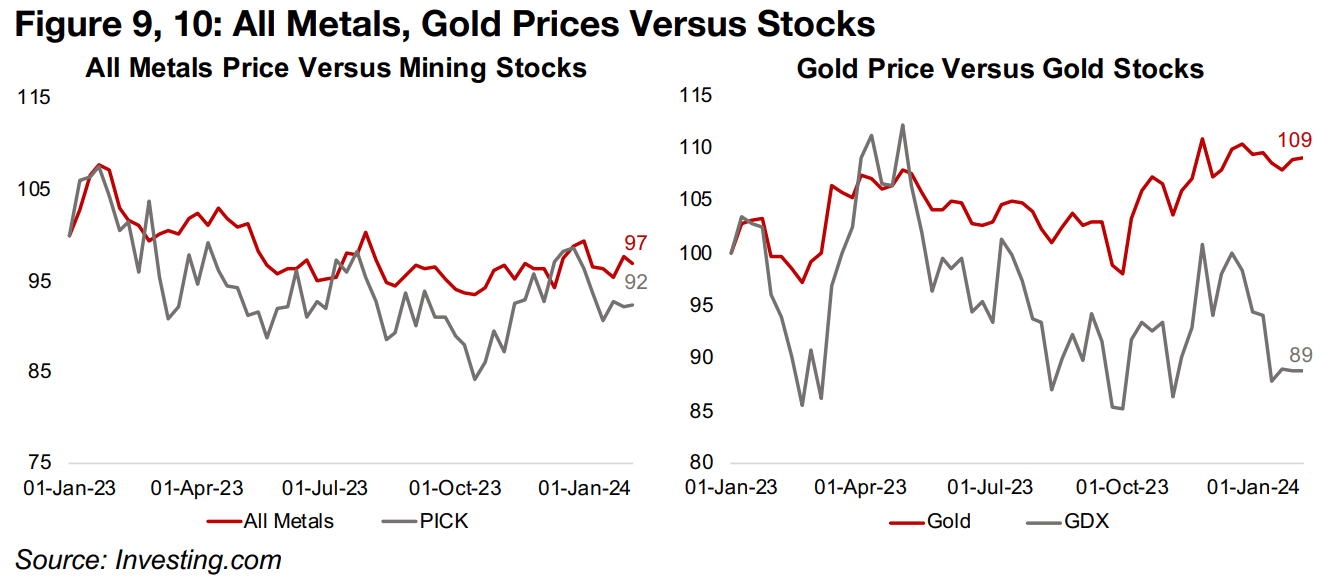
This suggests that either the market is not expecting the gold price to remain high, or that costs in the industry will surge, and potentially hit margins. However, if cost concerns were the cause, we would likely see a similar underperformance of stocks for the other metals too, which would also have profitability hit by inflation. This leaves the likely cause being doubts that gold prices will be sustained at high levels. However, as we have shown in recent reports, the market has consistently underestimated the gold price over the past several years, and we expect that this could be the case again in 2024.
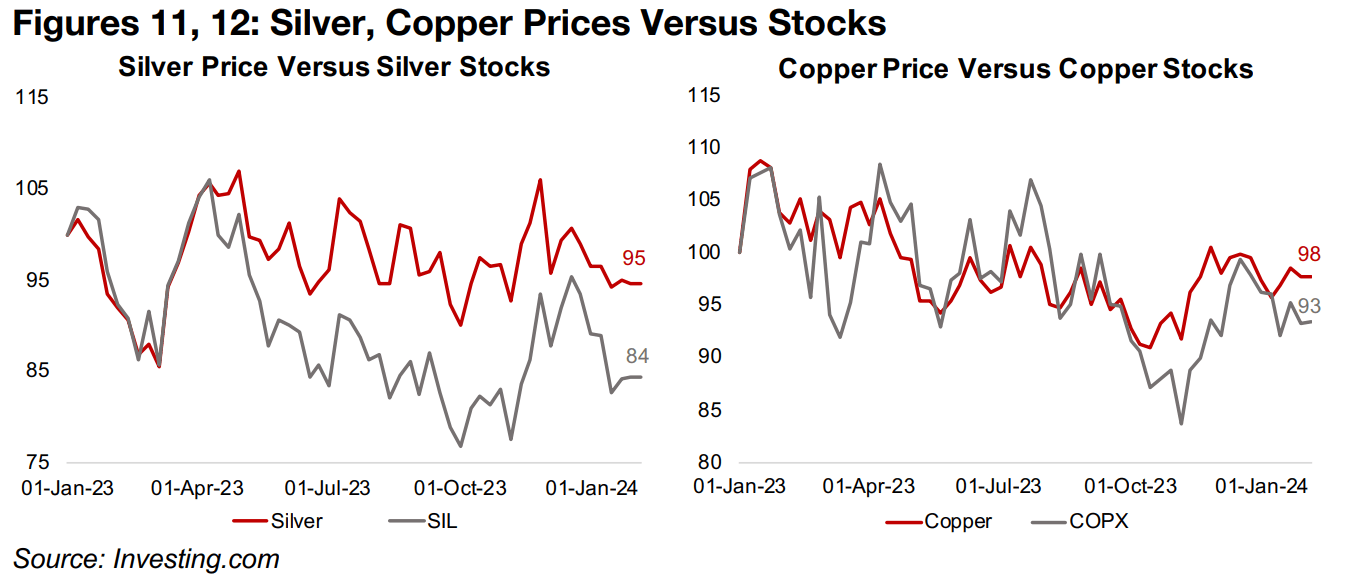
While not as wide as for gold, the underperformance of silver stocks, using the Global
X Silver Miners ETF (SIL), is about -10%, with metal down -5% since 2023 and silver
stocks declining about -15% (Figure 11). This can be justified to some degree by
silver’s decline, with the stocks often considered a leveraged bet on the metal, and
the big drop in the metal theoretically causing an even bigger drop in the stocks.
However, this would also suggest that the rise in gold should see the gold stocks
actually outperform, not severely underperform, the metal price. This further indicates
that this imbalance between gold stocks and the underlying metal might not be
sustained. For copper there has been a very tight relationship between the stocks,
using the Global X Copper Miners ETF (COPX), and the metal over most of the period
since 2023. The gap is currently at about -5%, with copper down -2% and the COPX
down -7%. The quite flat price has left less room for any leverage effect to kick in.
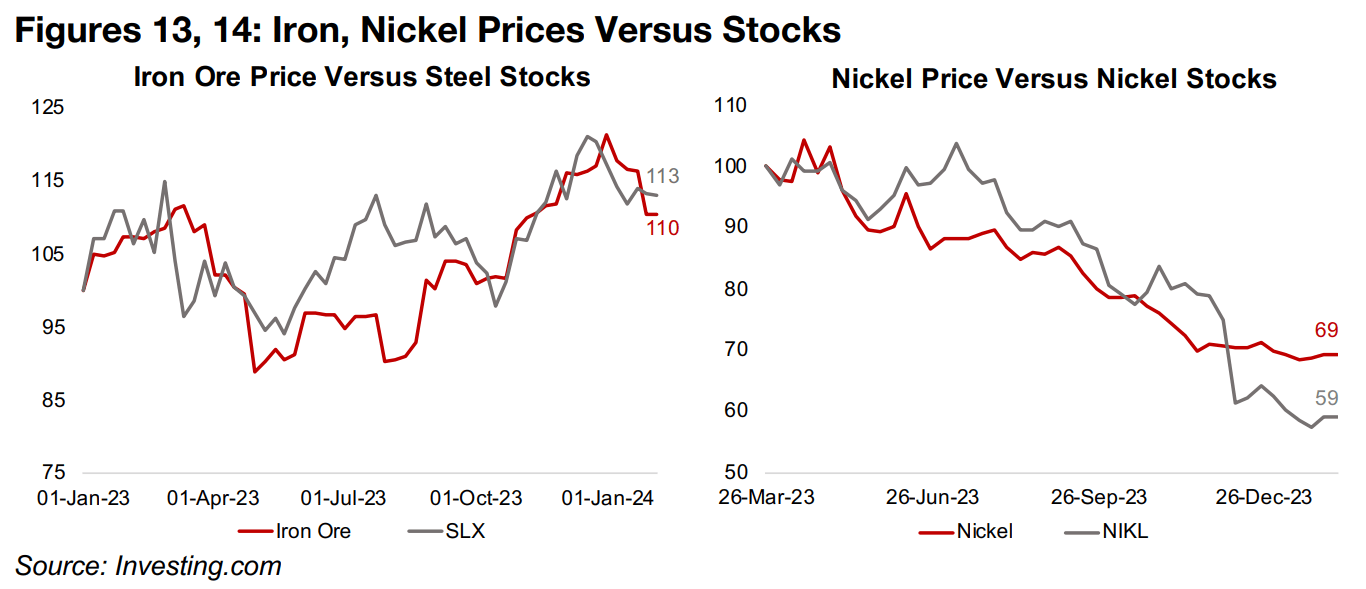
For iron ore, there is no stock ETF, but there is a steel ETF, and nearly 100% of iron ore goes becomes pig iron used in steel production, making the closest proxy VanEck’s Steel ETF (SLX). The spread is tight at 3%, with iron ore up 10% and the steel stocks rising 13% (Figure 13). For nickel the leverage effect has been to the downside, with the price down -31% and stocks declining -41%, although the spread at -10% is still just half of the gold versus gold stock spread (Figure 14).
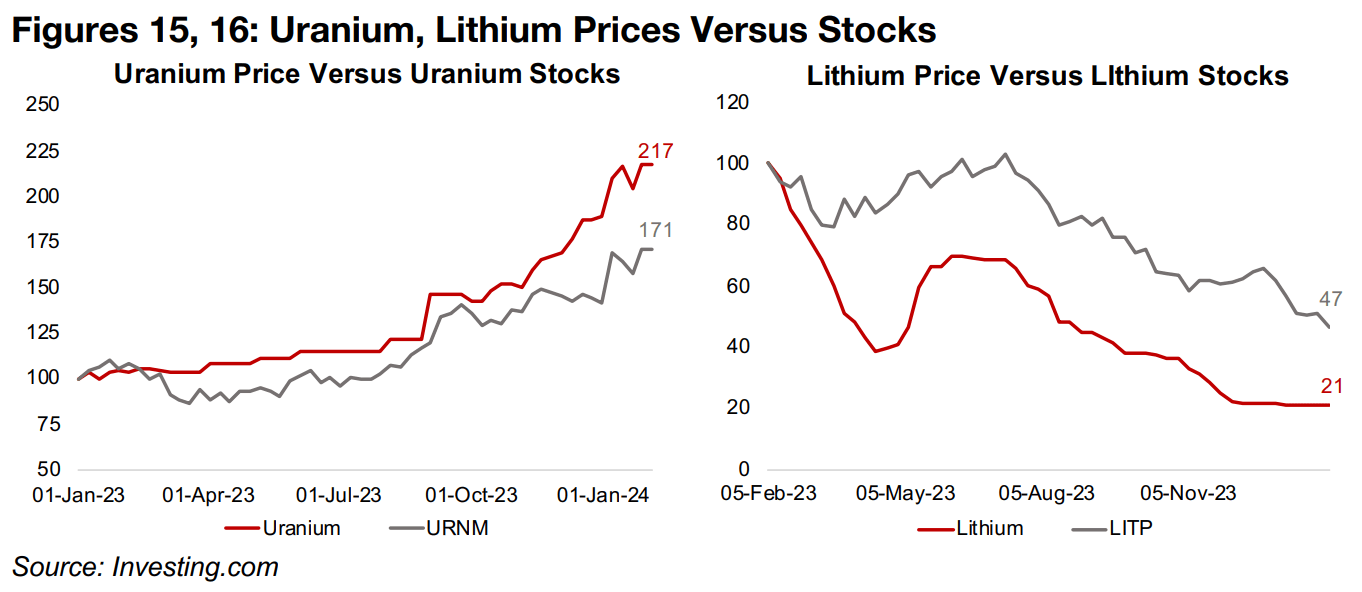
The two largest outliers of performance are uranium and lithium. The uranium price has been undergoing a particularly aggressive boom over the past year, up 117%. While we might have expected uranium stocks, using Sprott Uranium Miners ETF (URNM), to do even better from the leverage effect, they have actually substantially underperformed the metal, up just 71%, for a -46% spread (Figure 15). A similar situation has occurred for lithium, with the metal price collapsing by -79%, but stock prices, using the Sprott Lithium Miners ETF (LITP), declining only -53% (Figure 16). This suggests that the market is not entirely convinced that either the booming uranium prices or collapsing lithium prices will be sustained.
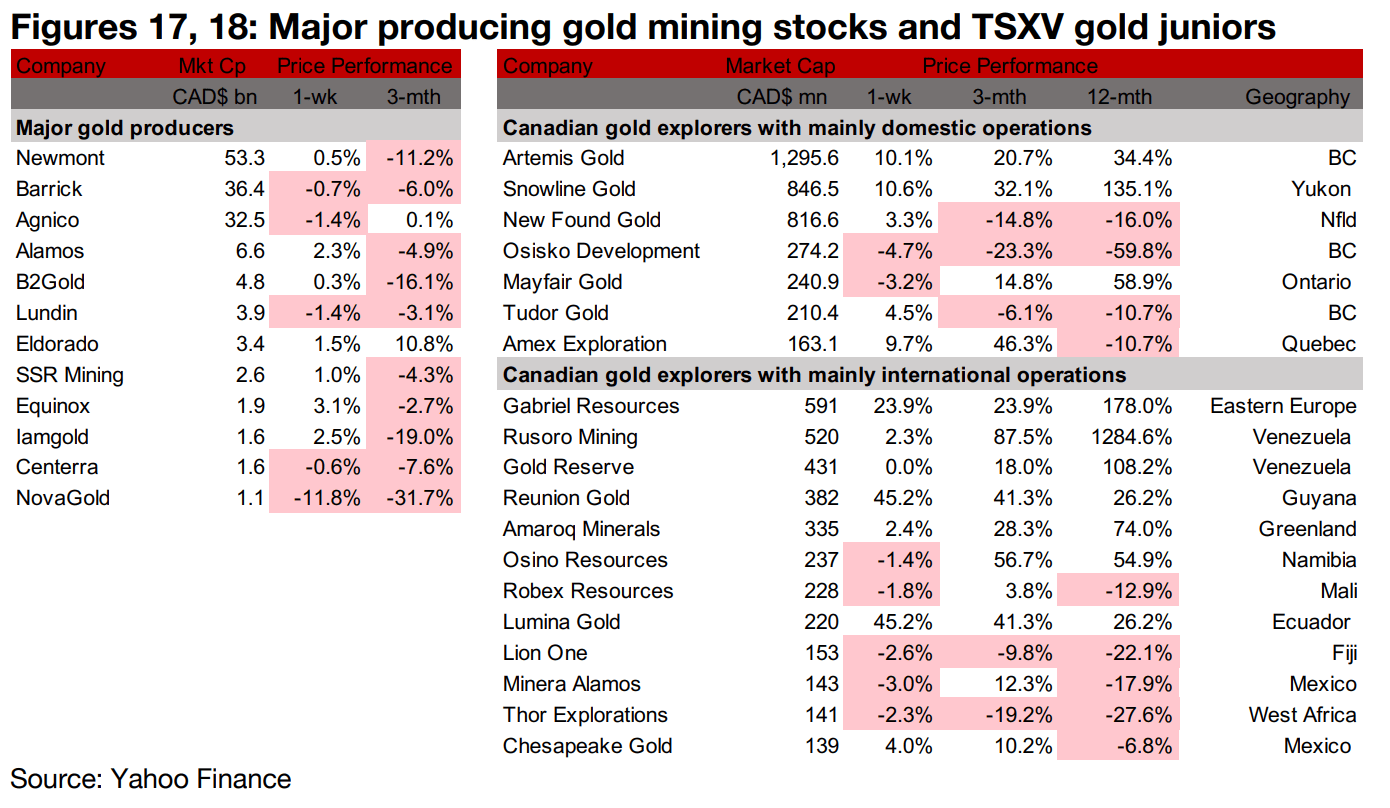
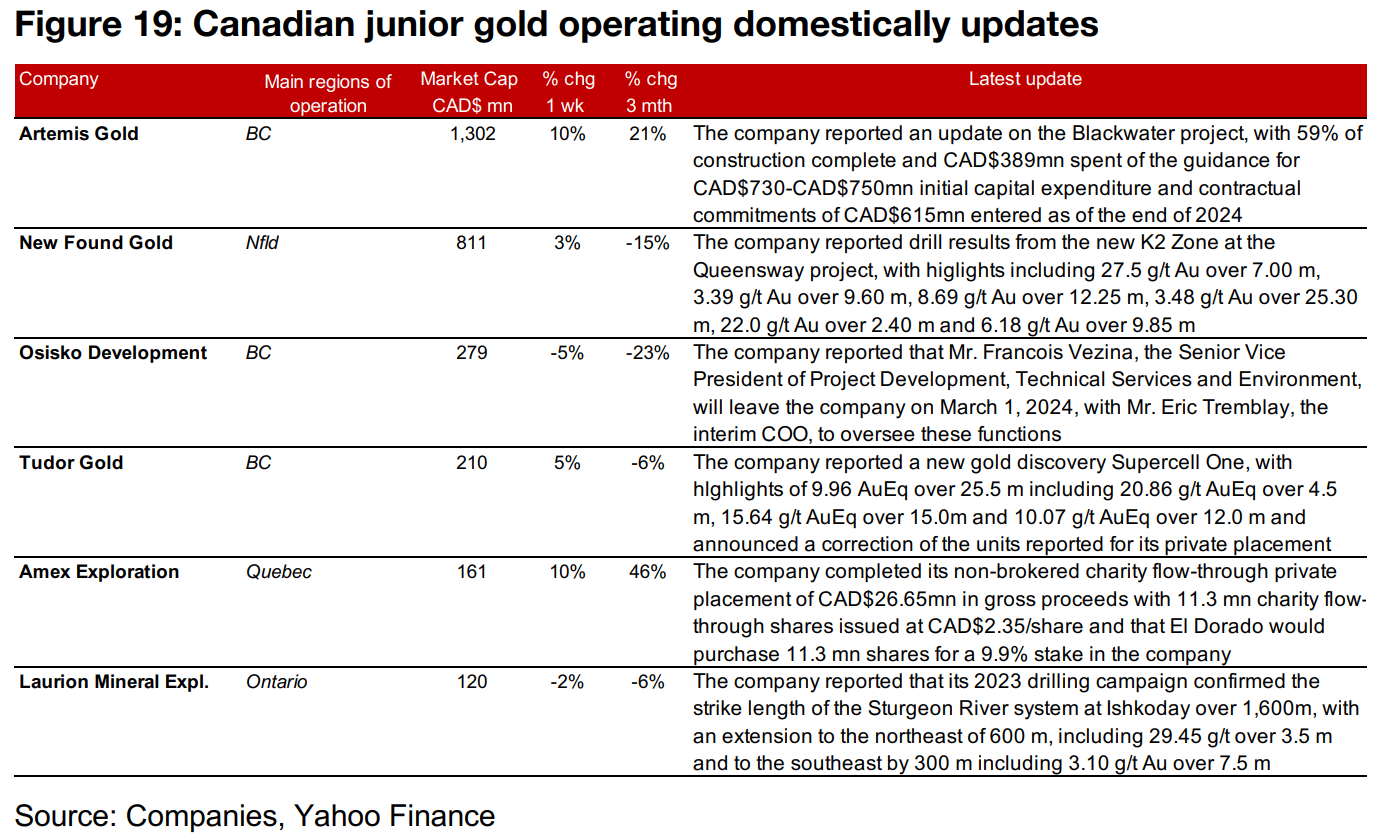
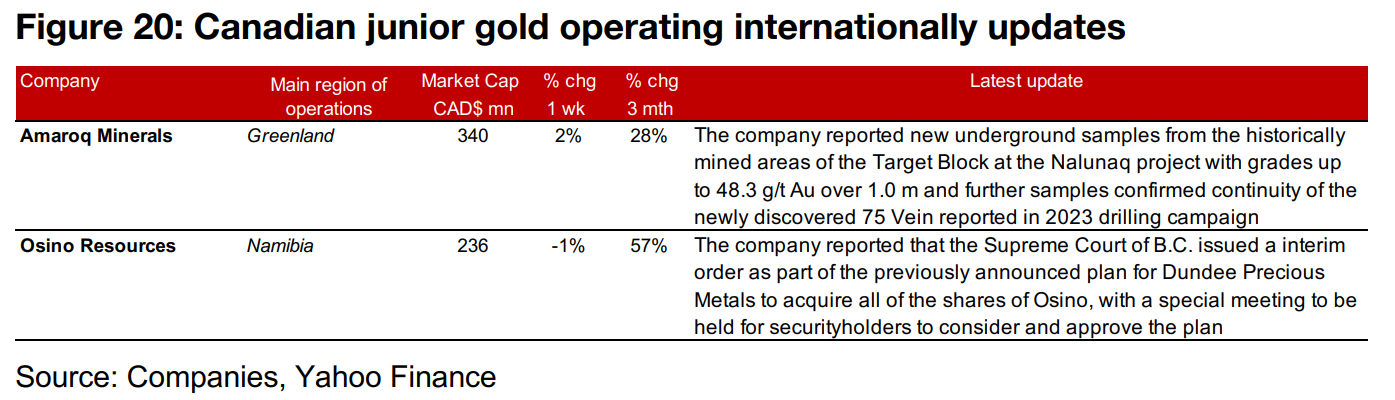
The gold producers and large TSXV gold stocks were mixed as the gold price rose but there was some pressure on small cap stocks (Figures 17, 18). For the TSXV gold companies operating domestically, Artemis reported a construction update for Blackwater, New Found Gold released drill results from the new K2 Zone at Queensway and Osisko Development announced a management change. Tudor Gold reported the new Supercell One gold discovery, Amex completed its CAD$26.7mn private placement and Laurion provided further detail on its 2023 drilling campaign (Figure 19). For the TSXV gold companies operating internationally, Amaroq released new underground samples from Nalunaq and Osino announced further progress in its planned acquisition by Dundee (Figure 20).
Disclaimer: This report is for informational use only and should not be used an alternative to the financial and legal advice of a qualified professional in business planning and investment. We do not represent that forecasts in this report will lead to a specific outcome or result, and are not liable in the event of any business action taken in whole or in part as a result of the contents of this report.
Author
Ben McGregor authors the Weekly Roundup at CanadianMiningReport.com, providing sharp analysis of the metals and mining sector. With a talent for spotting trends, Ben distills complex market shifts into clear, engaging insights on TSXV junior miners. His weekly updates cover gold, copper, uranium, and more, blending data-driven perspectives with a knack for identifying opportunities. A vital resource for investors, Ben’s work navigates the dynamic junior mining landscape with precision.