

July 07, 2026
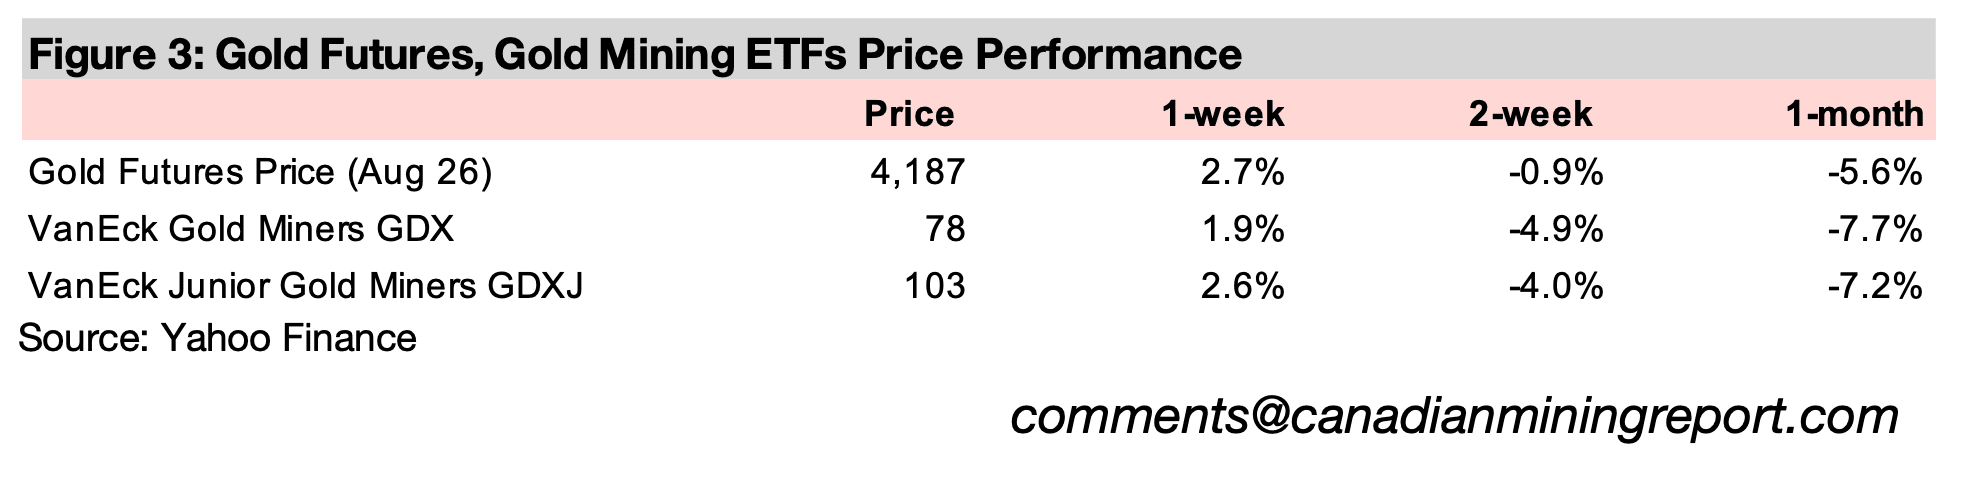
Gold rose 2.7% to US$4,187/oz as relatively weak US jobs data decreased expectations for the potential rate hike this year, which drove down the US$ and yields, although the latter had recovered by the end of the week.
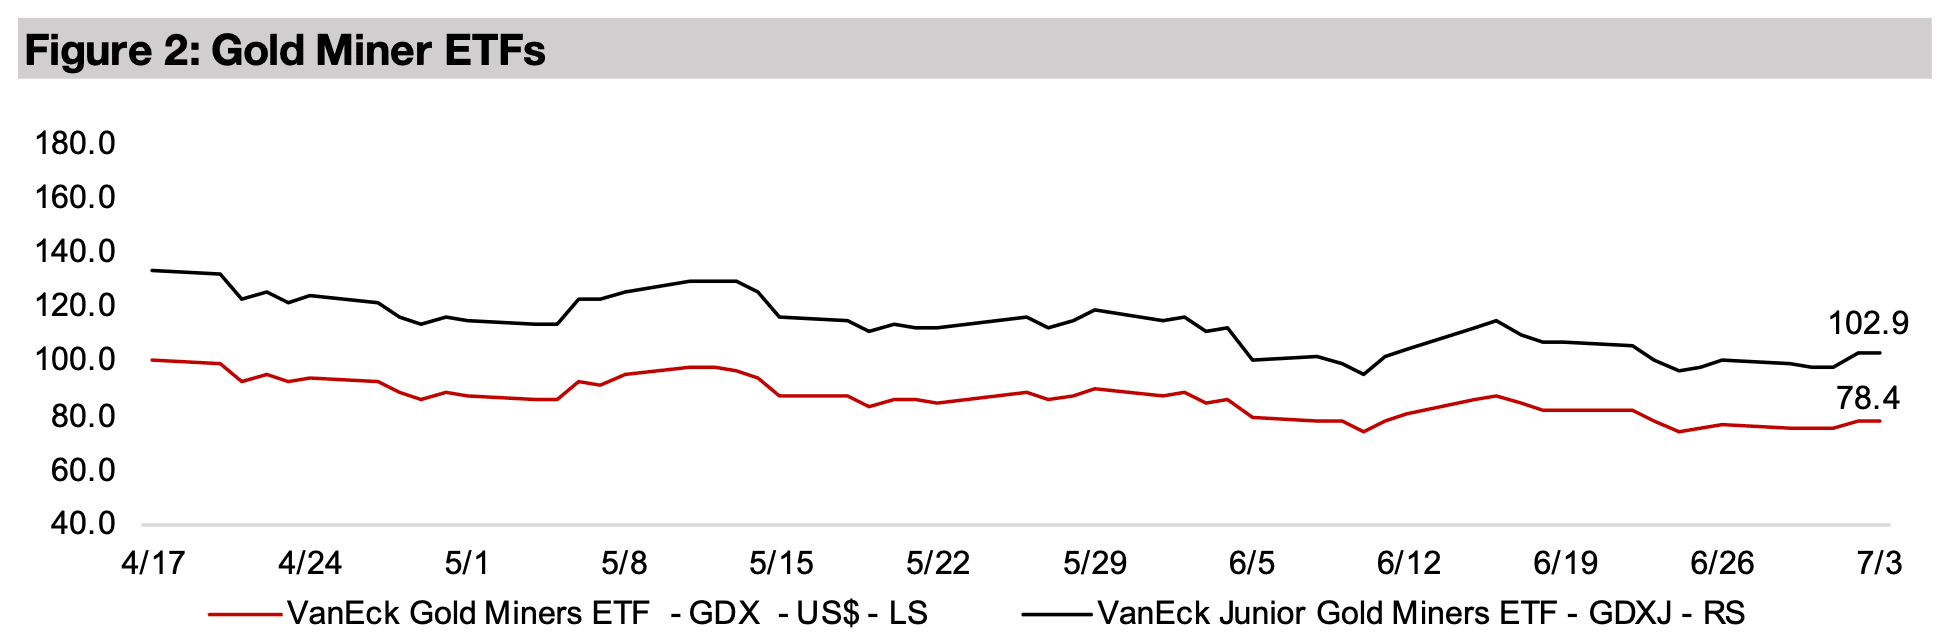
The gold stocks rebounded from near the lows for the year, with the GDX up 1.9% and GDXJ gaining 2.6%, as the metal and large cap equities rebounded, with the S&P up 2.3%, the Nasdaq jumping 2.9%, but the Russell 2000 lagging, up just 0.2%.


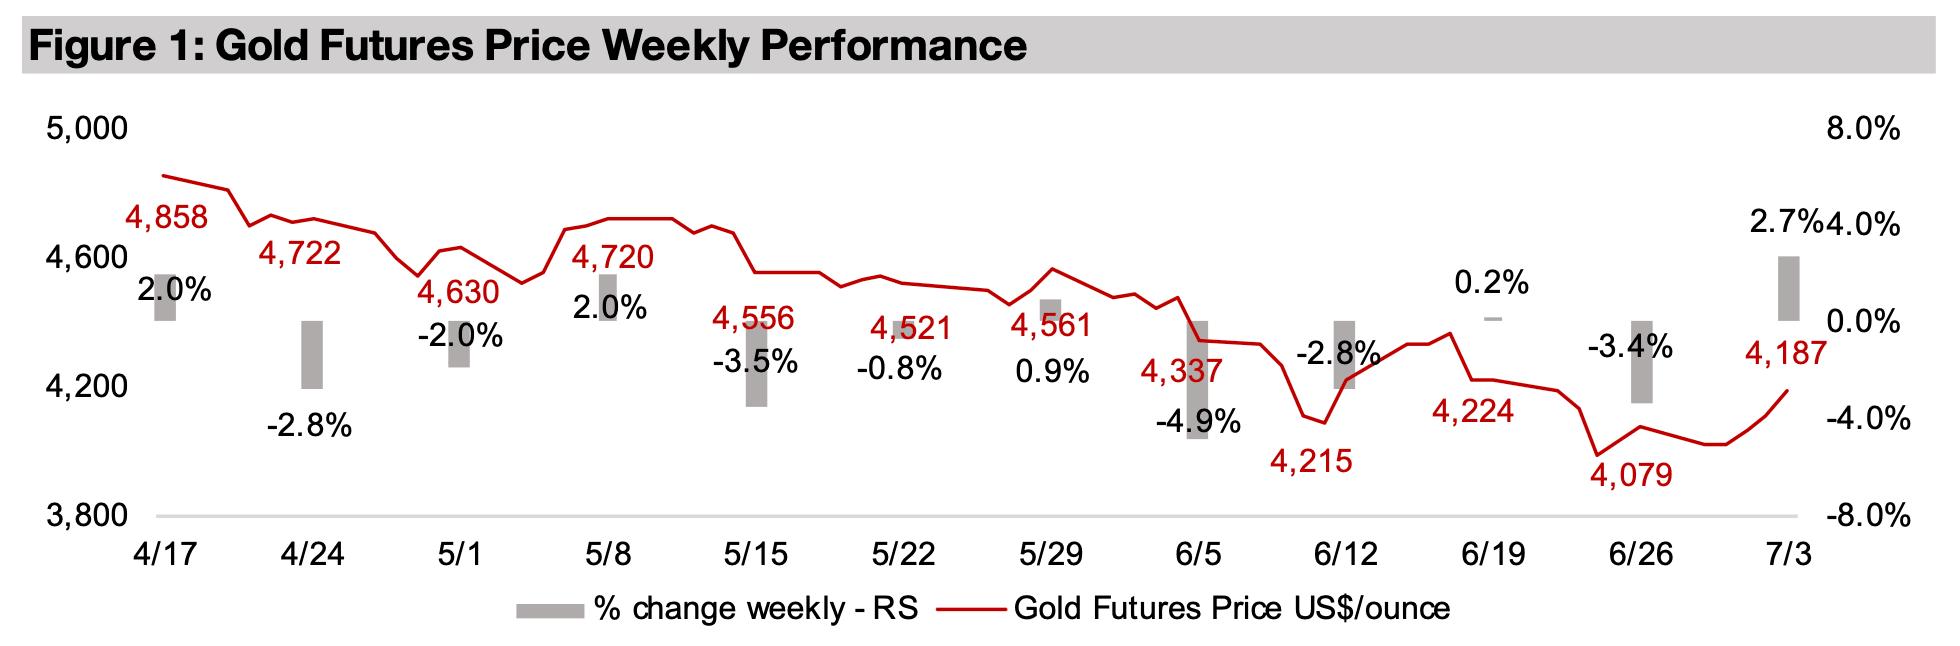
The gold rose 2.7% to US$4,187/oz as US jobs came in relatively weak for June 2026,
leading markets to ease off on rate hike expectations that had been driven by recently
very strong employment figures. While this drove a decline in the US$ as would be
expected, an initial drop in the 10-year bond yield was actually reversed by the end
of the week, with it eventually making gains. Even the moderate rise in the potential
that a widely expected rate hike this year could be avoided boosted large cap equity
markets, with the S&P 500 up 2.3% and Nasdaq gaining 2.9%. However, the Russell
2000 small cap index, which outperformed large caps in recent weeks, was near flat,
up just 0.2%, and gold stocks rose with the GDX up 1.9% and GDXJ gaining 2.6%.
The first major US employment report was ADP payrolls for June 2026, which rose
98,000, seasonally adjusted, declining moderately from 122,000 in May 2026 and not
significantly below consensus expectations 110,000. However, US non-farm payrolls
for June 2026 looked weaker, increasing by 57,000, only around half the 129,000 in
May 2026 and considerably below consensus estimates for 115,000. While the US
unemployment rate did decline to 4.2% on the increase in the jobs, it was also partly
driven by a drop in the participation rate of labor.
The biggest single driver in the metals space that could be coming even as early as
this week is the US decision on copper tariffs. The US Department of Commerce
submitted its report on the issue on the June 30, 2026 target date, and this is now
being reviewed by the government. The US tariff issues initially started causing
disruption to the global copper market from early 2025 as the new administration
implemented large new tariffs across many industries. Copper specifically became a
target in February 2025, when the government signed an Executive Order for the US
Department of Commerce to investigate the potential national security risks of copper
imports, with the possibility of imposing tariffs on all products in the sector.
There was an initial conclusion from the Department of Commerce submitted to the
government on June 30, 2025, with recommendations for no immediate tariffs on
refined copper, but 50% on semi-finished and 25% on copper derivatives. With
refined copper imports at US$8.7bn in 2024, this saw exactly half of the US$17.4bn
in total imports of the metal come under significant tariffs. The upcoming decision
could affect refined copper imports, with the potential for tariffs of 15% to be imposed
by January, 2027, which could rise to 30% by 2028. If the government decides to
move ahead, it would see all US copper imports facing substantial tariffs.
This contrasts with prior to 2025, when copper imports faced marginal tariffs below
5.0%, and overall they have been around these low levels for the last century, except
during the Great Depression. This shows the major historical significance of the tariffs
imposed on copper last year as well the upcoming decision.
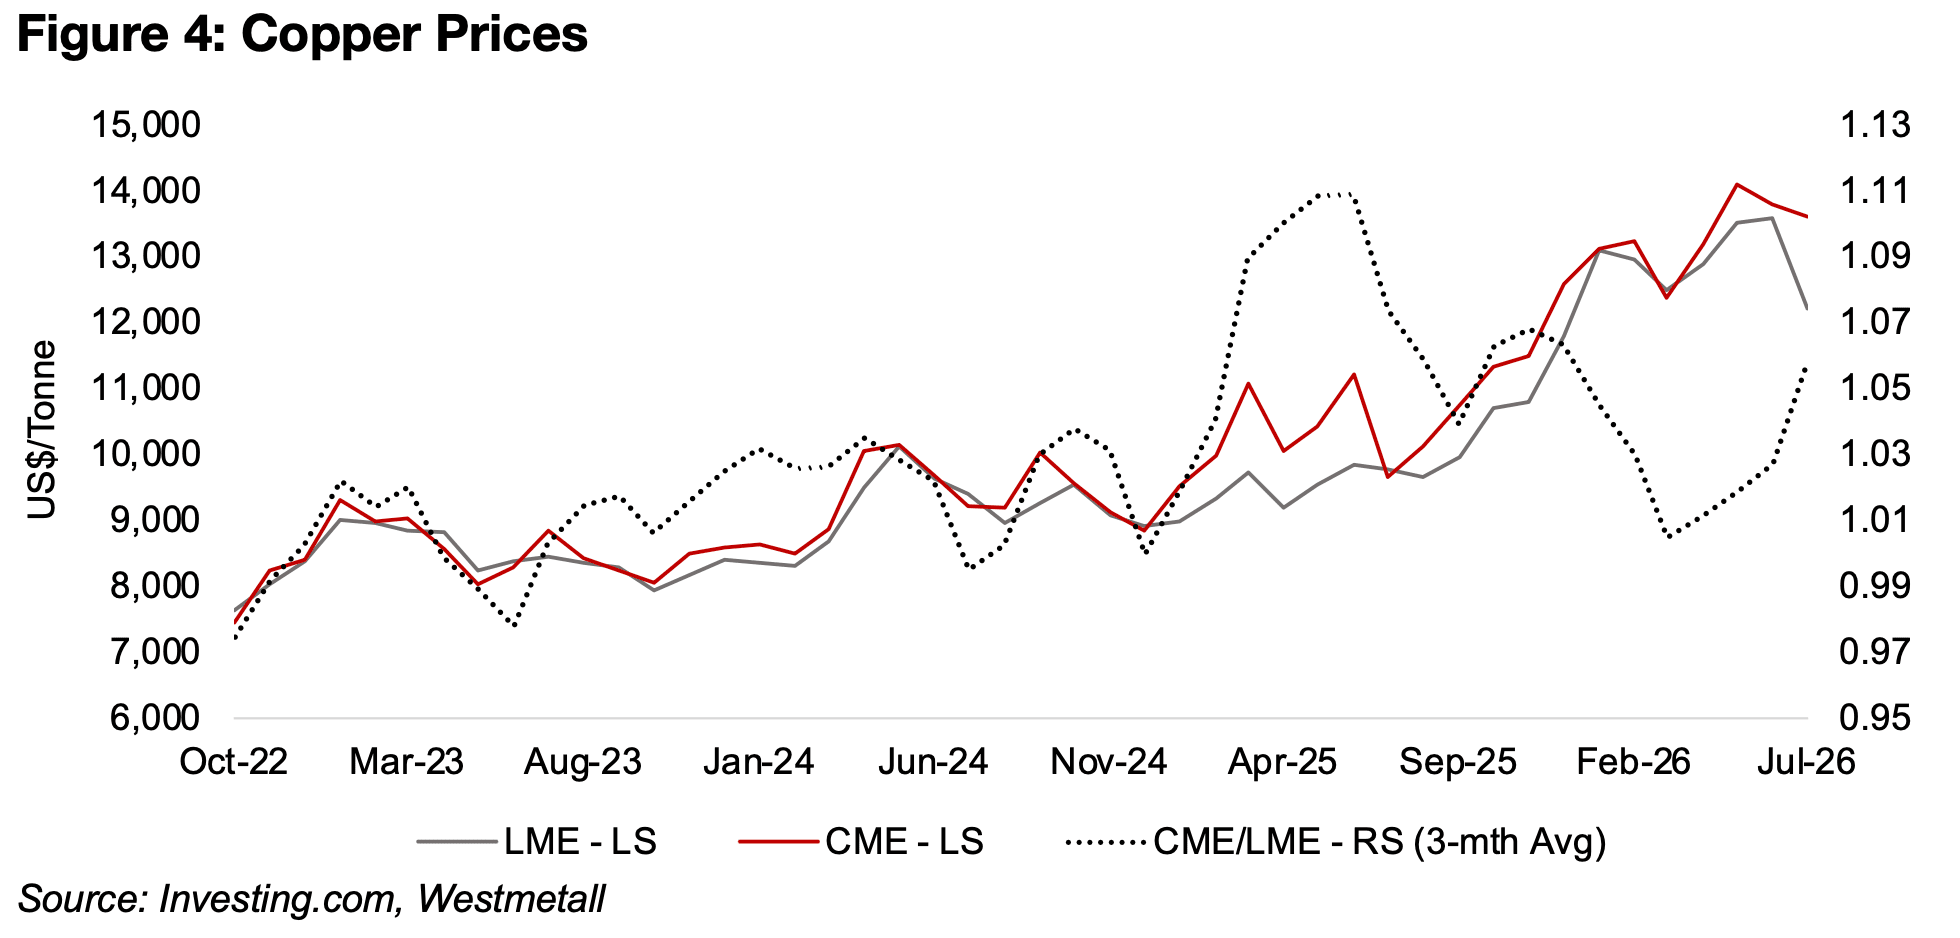
These tariffs issues have caused a major distortion in the relative prices of copper
between the US CME and the UK LME, with the two usually only diverging by around
1.0%-2.0%, but the spread jumping to near 30% in July 2025 just before the July 30,
2025 announcement of tariffs (Figure 4). For the full month of June 2025, the spread
averaged around 14%, and while it trended down in the following months, it was not
back to the historical average around 1.0% until the first four months of 2026.
However, the spread has again started to rise over the past three months, and is now
at 11%, not as high as its peak last year, but still quite elevated.
This has driven a major shift away from the average inventory balances between the
US, UK and China, which from 2014 to 2024 were 21%, 51% and 28% of the total,
respectively. The expectations of US tariffs saw huge flows into the country and
stocking up of inventories, with supply especially from the UK, which in turn
restocked copper by making purchases from China, which then also saw its copper
holdings drop. At the peak last year in June 2025, inventories were 55%, 24% and
21% in the US, UK and China, but total inventories were at just 384,315k tonnes
across the three regions.
This broader trend of a shift in copper inventories towards the US and away from the
UK and China has continued over the past year. Global copper inventories overall
have continued to surge in absolute terms in all three countries, reaching 1,143,648
as of June 2026, with the US and UK shares rising to 59% and UK 29% and China’s
share declining to just 11%. If there is eventually an overall rebalancing of this
situation, with inventories heavily flowing back to China from the UK and from the US
to the UK, there could potentially be quite extreme moves in the copper market still
to come from technical movements alone, apart from other broader underlying
macroeconomic factors driving the metal.
The copper price could see large moves either way based on the US tariff decision.
If major tariffs are imposed, the extreme imbalance in global inventories could worsen,
with flows towards the US likely driving up the copper price in the country. However,
with China inventories down to just 11% of the total, it could near a limit on how much
can be sold to the UK to offset flows to the US, although this could just lead to UK
inventories being depleted. If there is a decision for only moderate, or even no, major
new tariffs, it could potentially prompt a dramatic unwinding of this historical
imbalance of global copper inventories.
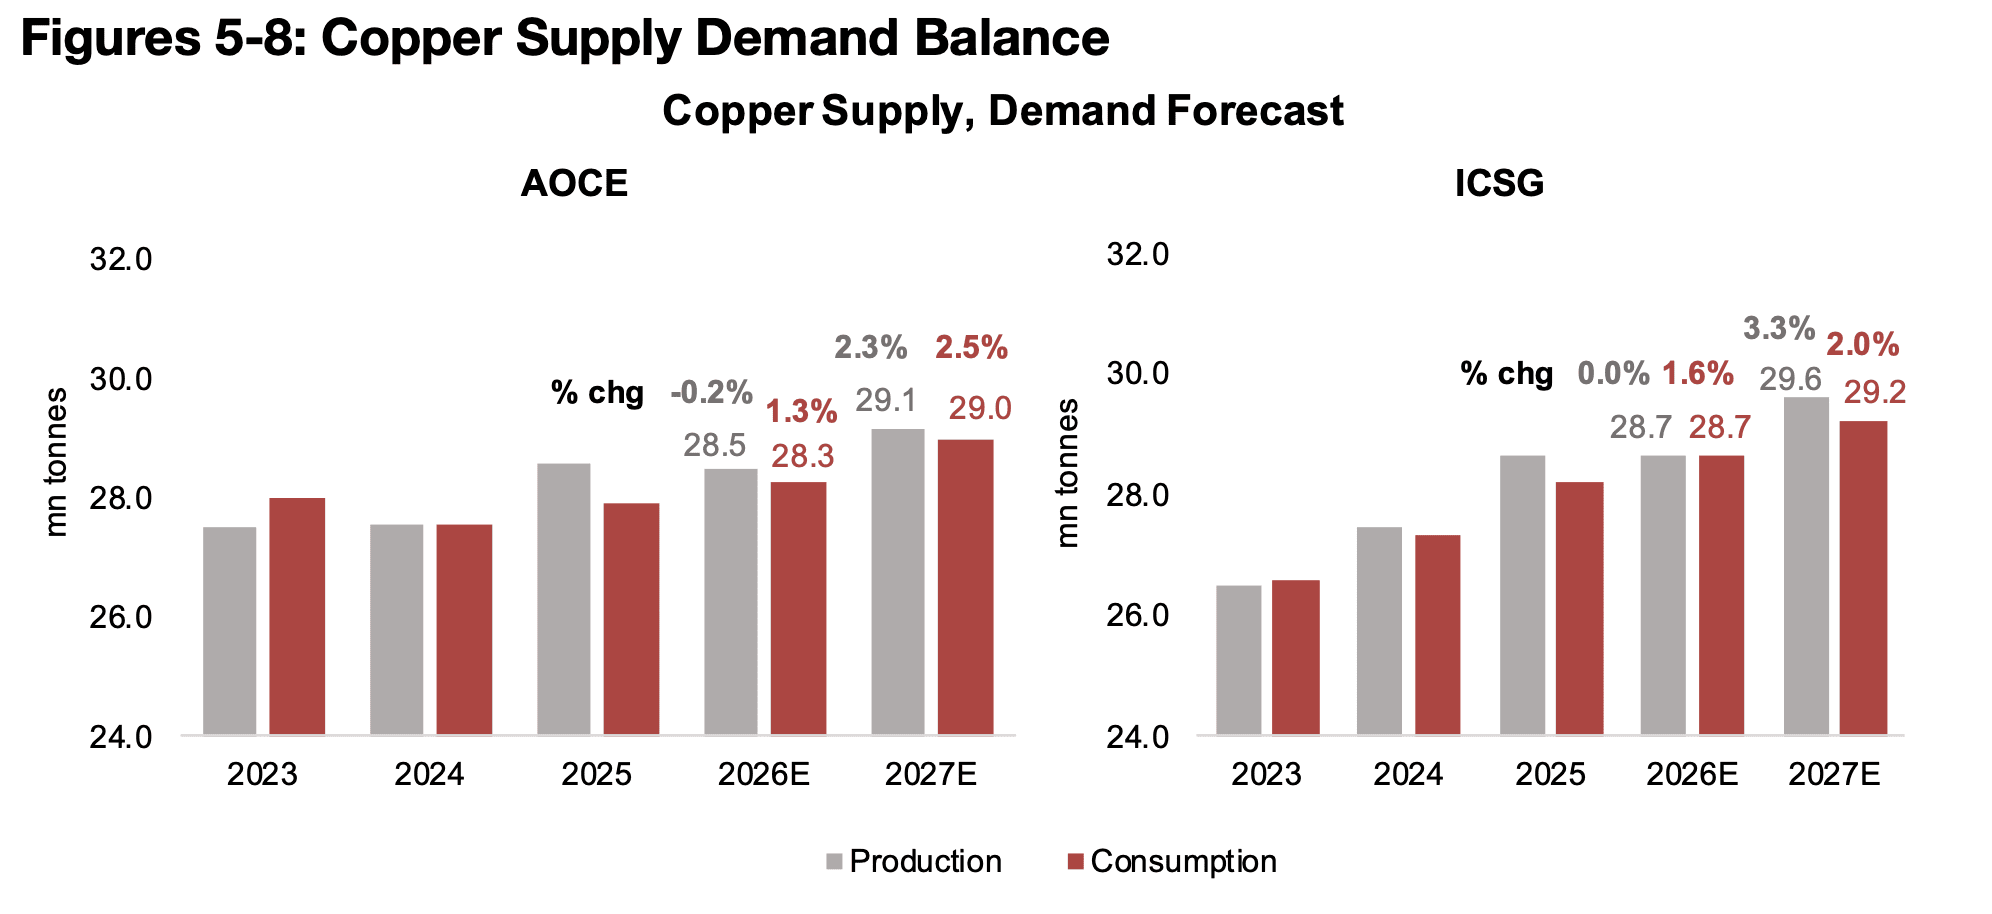
While there could therefore be major volatility in copper short-term, the outlook for the next two years looks relatively bearish based the forecasts from Australia’s Office of the Chief Economist (AOCE) and the International Copper Study Group (ICSG).
The AOCE has finally released new estimates in its June 2026 reported after the
regular March report was skipped, with the institution indicating the difficulty of
forecasting given the sudden disruption at the time to resource markets from the war
in the Middle East. The ICSG forecasts are also relatively recent, having been released
in April 2026 and therefore also incorporate the effects of the war and some major
declines in the global copper supply over the past year.
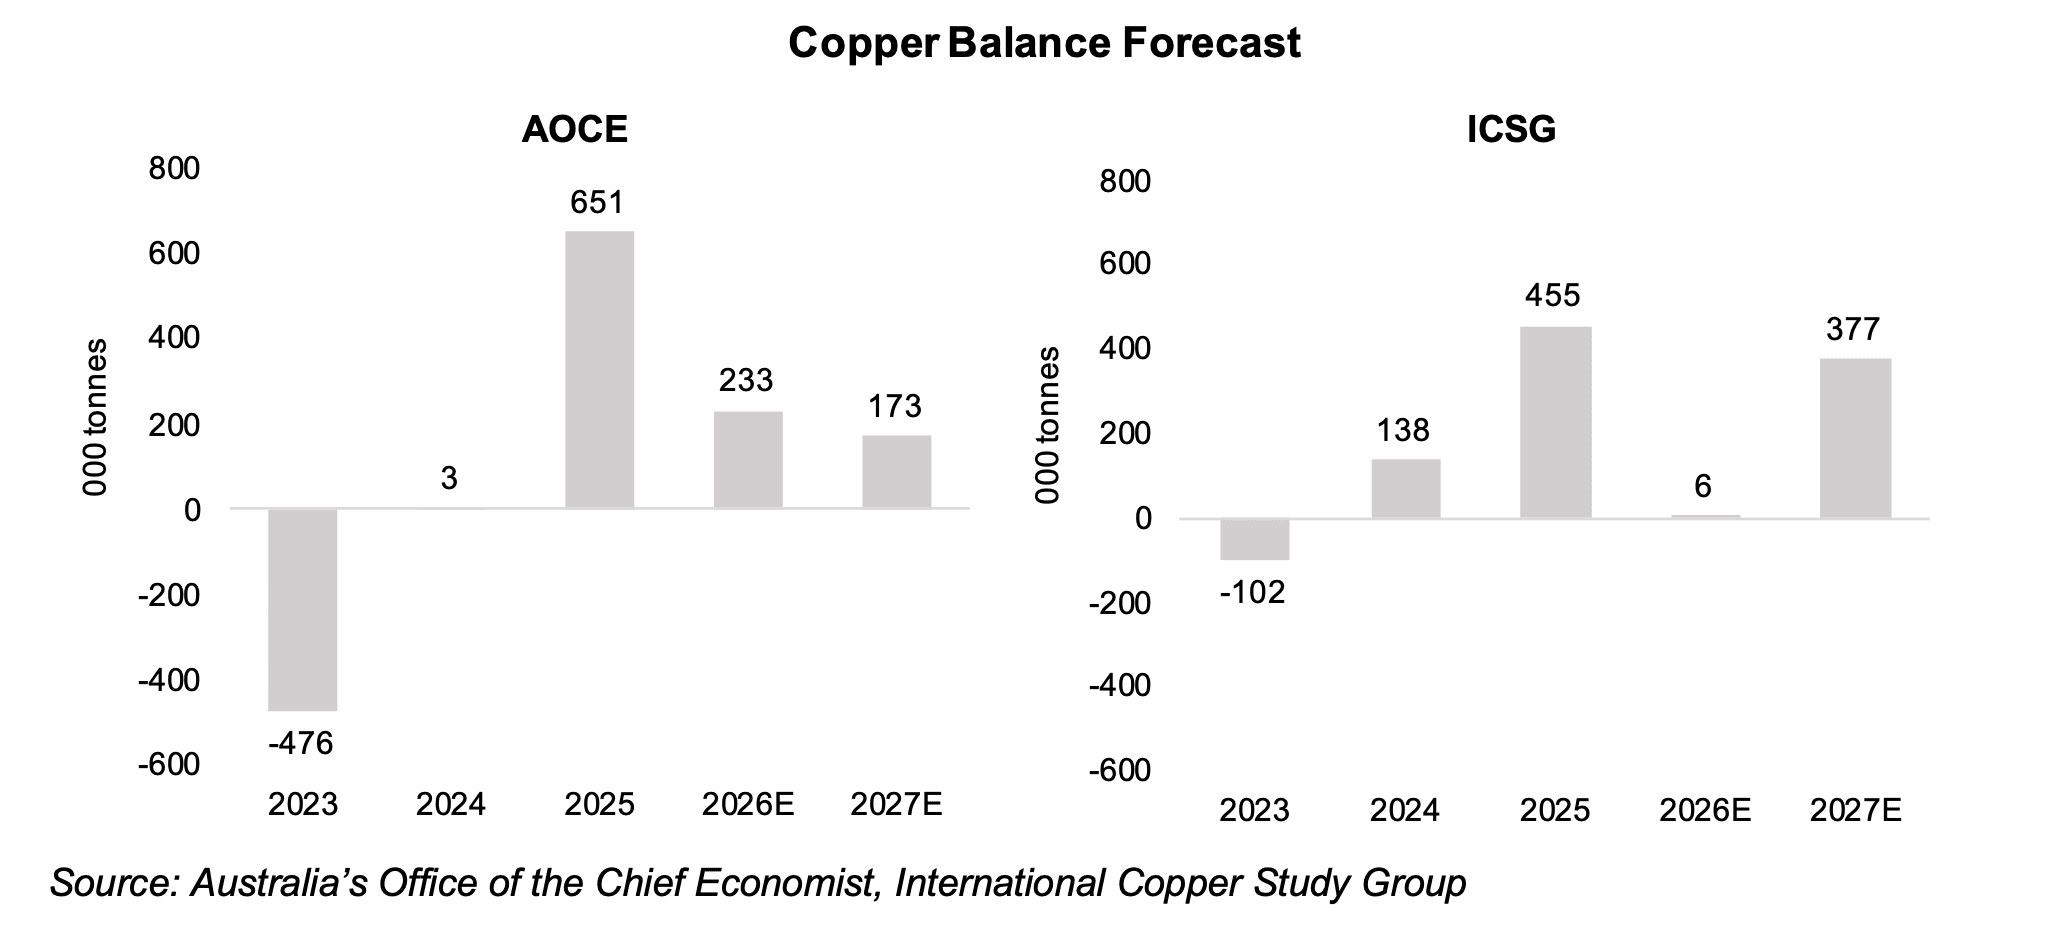
The AOCE and ICSG both forecast near flat production growth for 2026E, of -0.2%
and 0.0%, respectively (Figures 5, 6), outpaced by similar consumption growth of 1.3%
and 1.6%. However, given slightly different base figures in 2025, the AOCE forecast
leads to a significant surplus of 233k tonnes, and the ICSG a nearly balanced market,
with a small 6k tonne surplus (Figures 7, 8). However, both expect production growth
to rebound substantially in 2027E, to 2.3% and 3.3%, respectively, with consumption
growth of 2.5% and 2.0%. This drives a substantial surplus for both, although for the
AOCE it declines from 2026E to 133k tonnes, and for the ICSG it jumps to 377k
tonnes.
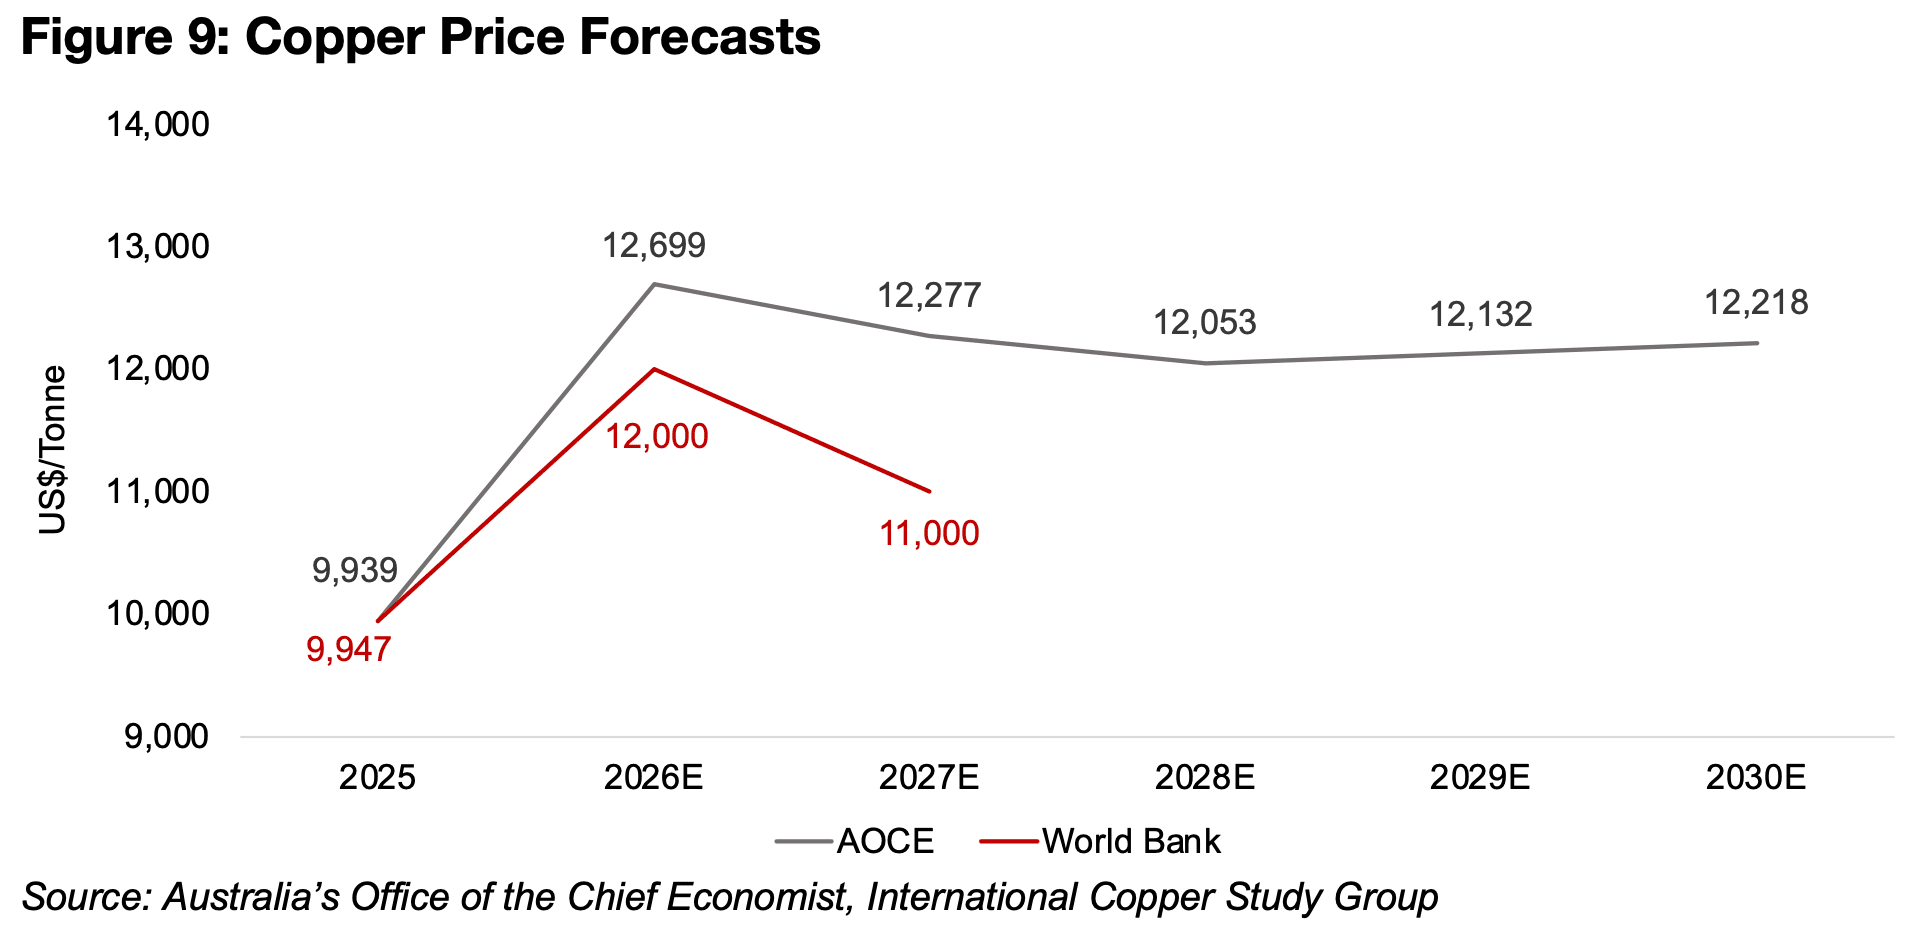
Only the AOCE has copper price forecasts, out to 2031E, with the ICSG not directly
providing estimates (Figure 9). However, the World Bank does provide regular
estimates for metals prices, including copper, but no full supply and demand
numbers, which allows for a comparison with the AOCE figures. While the World Bank
forecasts are also recent, from April 2026, they only extend out only to 2027E. Both
of the sources are expecting copper prices to peak this year, with the AOCE at
US$12,699/tonne and the World Bank at US$12,000/tonne, with a decline to
US$12,777/tonne and US$11,000/tonne, respectively, by 2027E. The AOCE expects
the copper price to continue the decline through to US$12,053/tonne in 2028E, and
then recovery moderately in 2029E and 2030E to US$12,218/tonne, still significantly
below the 2027E peak.
This contrast significantly with some major investment banks, which are forecasting
a potential jump to US$15,000/tonne over the next year, although many do have a
base case of US$12,000/tonne, which would be inline with the World Bank estimate.
The lowest estimate is US$9,500/tonne, which is an outlier, with the next lowest
estimate at US$11,000/tonne, and would effectively see a reversion of the price to
around 2026E levels. The thesis for the low figure is that the currently high prices are
driven mainly by the tariff related distortions, and as these eventually unwind as there
is more clarity on situation, that the price could also decline substantially.
In addition to the tariff related disruptions, the copper price seems to have been
driven recently especially by very bullish expectations for the demand side related to
the tech boom and AI. However, there are growing market concerns over the
sustainability of the growth in this sector, and a slowdown could be a drag on copper.
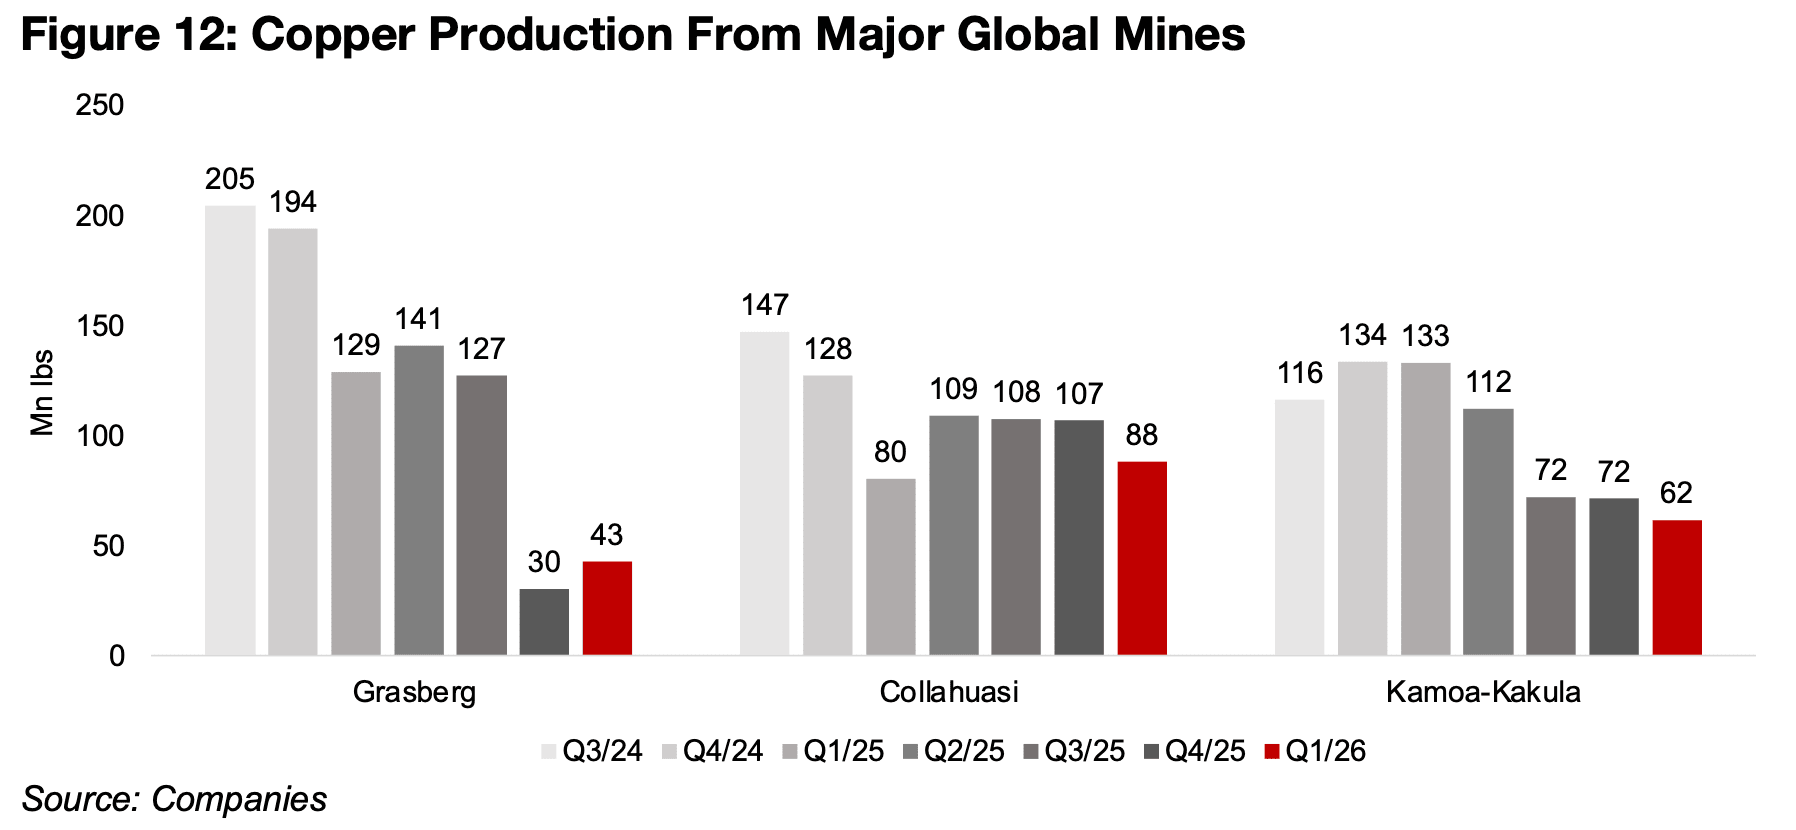
On the supply for copper, there is considerable scope for a rebound in production as
output has declined for several of the largest global mines over the past year, but the
issues causing the drop could start to be reversed in 2026E and 2027E. This includes
Grasberg, which had been the second largest producing copper mine in the world in
2024, but saw a huge plunge in output from Q4/25 after a mudslide in Indonesia
(Figure 9). However, the damage is expected to be repaired this year and production
could rebound substantially by 2027E.
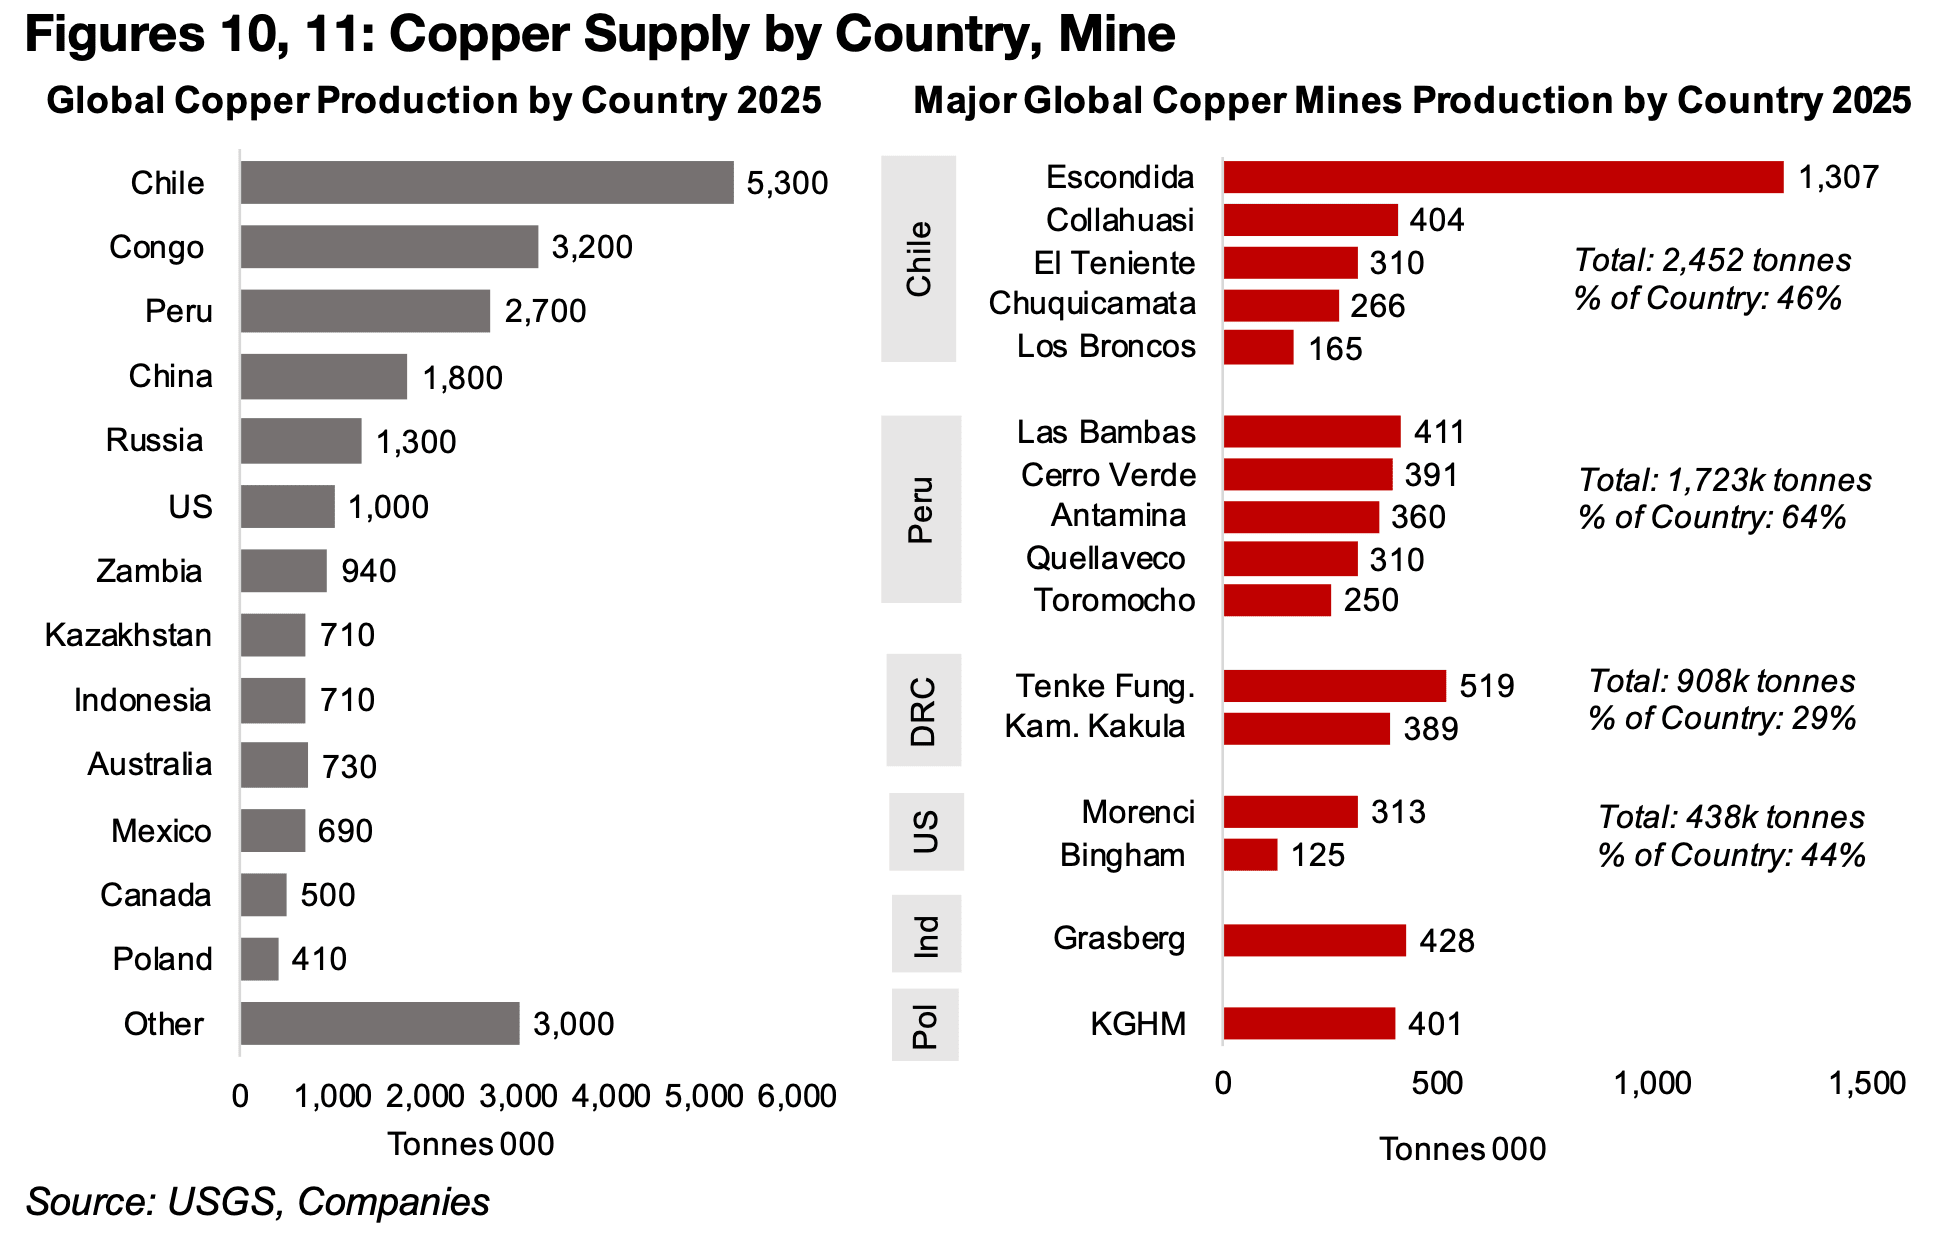
There has also been relatively weak output from the second largest mines in two
major copper producing countries, Collahuasi in Chile, and Kamoa-Kakula in the
Democratic Republic of Congo. These two countries are by far the largest copper
producers globally, and it is expected that the operational issues driving the lower
output could potentially be corrected in the next few years (Figures, 10, 11). Another
major mine in Panama, Cobre, had been producing over 300k tonnes per year prior
to operations being suspended over regulatory issues, and the government is
currently considering restarting operations. A rebound from these mines could put
global copper production on track for expectations of a large rise in output next year.
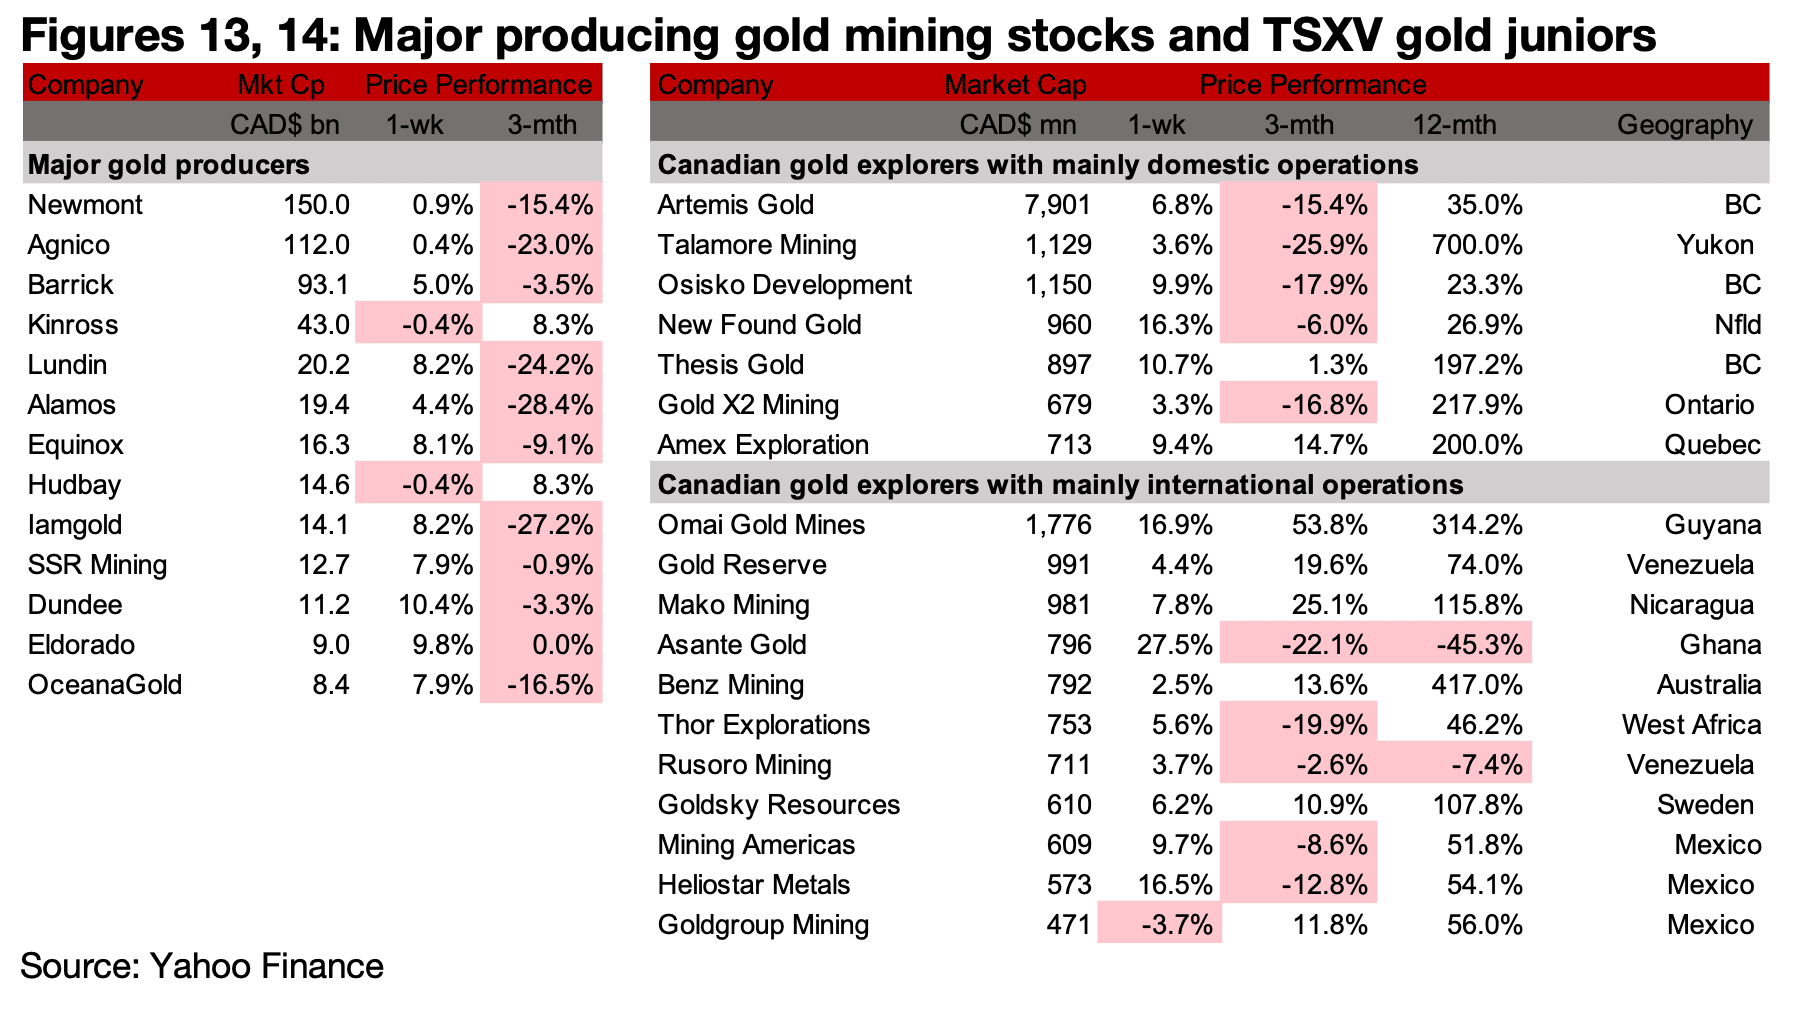
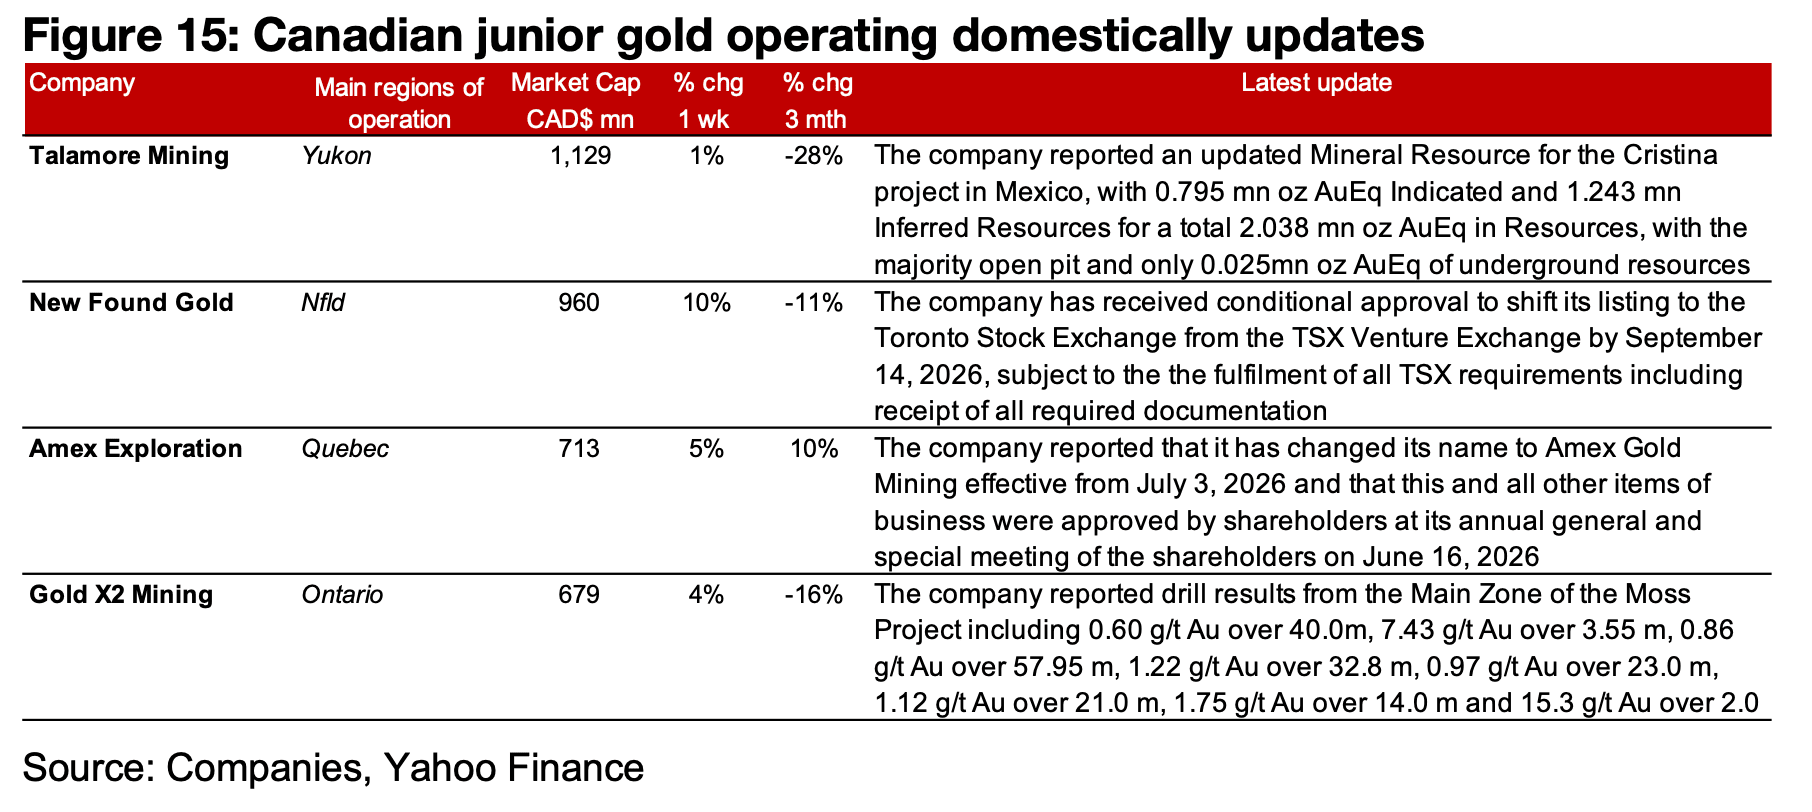
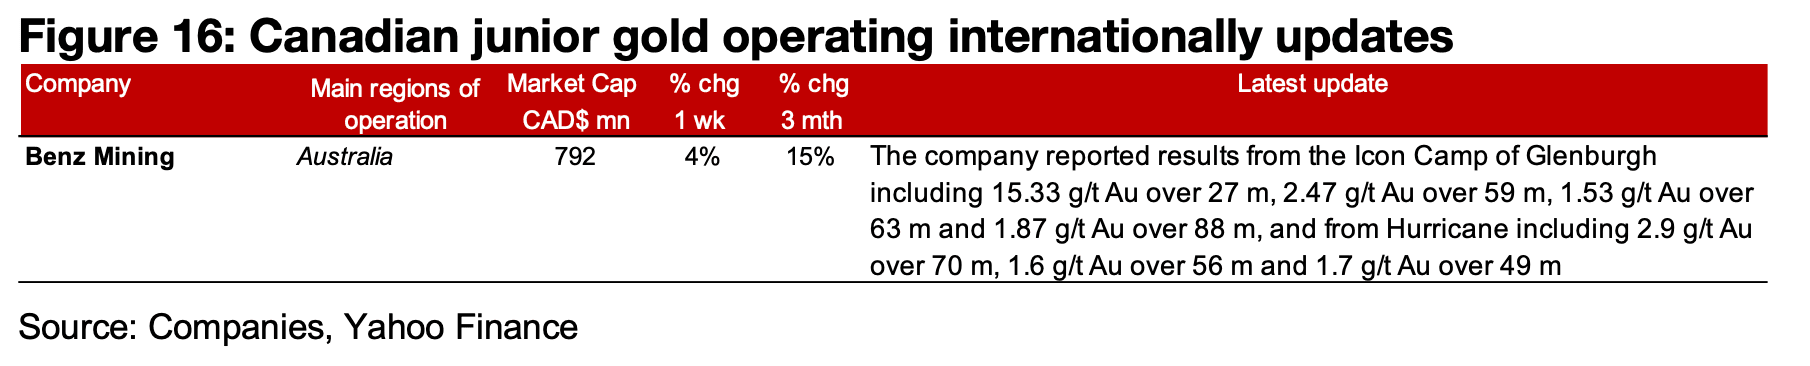
The major producers and TSXV large gold were almost all up on the rise in the metal price (Figures 10, 11) For the TSXV gold companies operating mainly domestically, Talamore mining reported an updated Mineral Resource for the Cristina project in Mexico, of 2.0 mn oz AuEq, which also includes Ag, Cu, Pb and Zn. This puts the project moderately below the total 3.0 mn oz AuEq Resources of its Coffee Project in the Yukon. However, Coffee is at a far more advanced stage than Cristina, with a PEA completed earlier this year, a Feasibility Study expected by the end of 2026 and permitting advanced. New Found Gold received conditional approval to shift its listing to the TSX from the TSX Venture Exchange, Amex Exploration changed its name to Amex Gold Mining and Gold X2 reported drill results from the Main Zone of the Moss Project (Figure 12). For the TSXV gold companies operating mainly internationally, Benz Mining reported results from the Icon Camp and Hurricane Camp of the Glenburgh project (Figure 13).
Disclaimer: This report is for informational use only and should not be used an alternative to the financial and legal advice of a qualified professional in business planning and investment. We do not represent that forecasts in this report will lead to a specific outcome or result, and are not liable in the event of any business action taken in whole or in part as a result of the contents of this report.
Author
Ben McGregor authors the Weekly Roundup at CanadianMiningReport.com, providing sharp analysis of the metals and mining sector. With a talent for spotting trends, Ben distills complex market shifts into clear, engaging insights on TSXV junior miners. His weekly updates cover gold, copper, uranium, and more, blending data-driven perspectives with a knack for identifying opportunities. A vital resource for investors, Ben’s work navigates the dynamic junior mining landscape with precision.