
September 29, 2025
Gold jumped 3.7% to US$3,809/oz, once again seeing strong gains after a more moderate rise in the previous two weeks, as markets may have been seeking hedges after equities slipped and could still be pricing in an expected Fed rate cutting cycle.
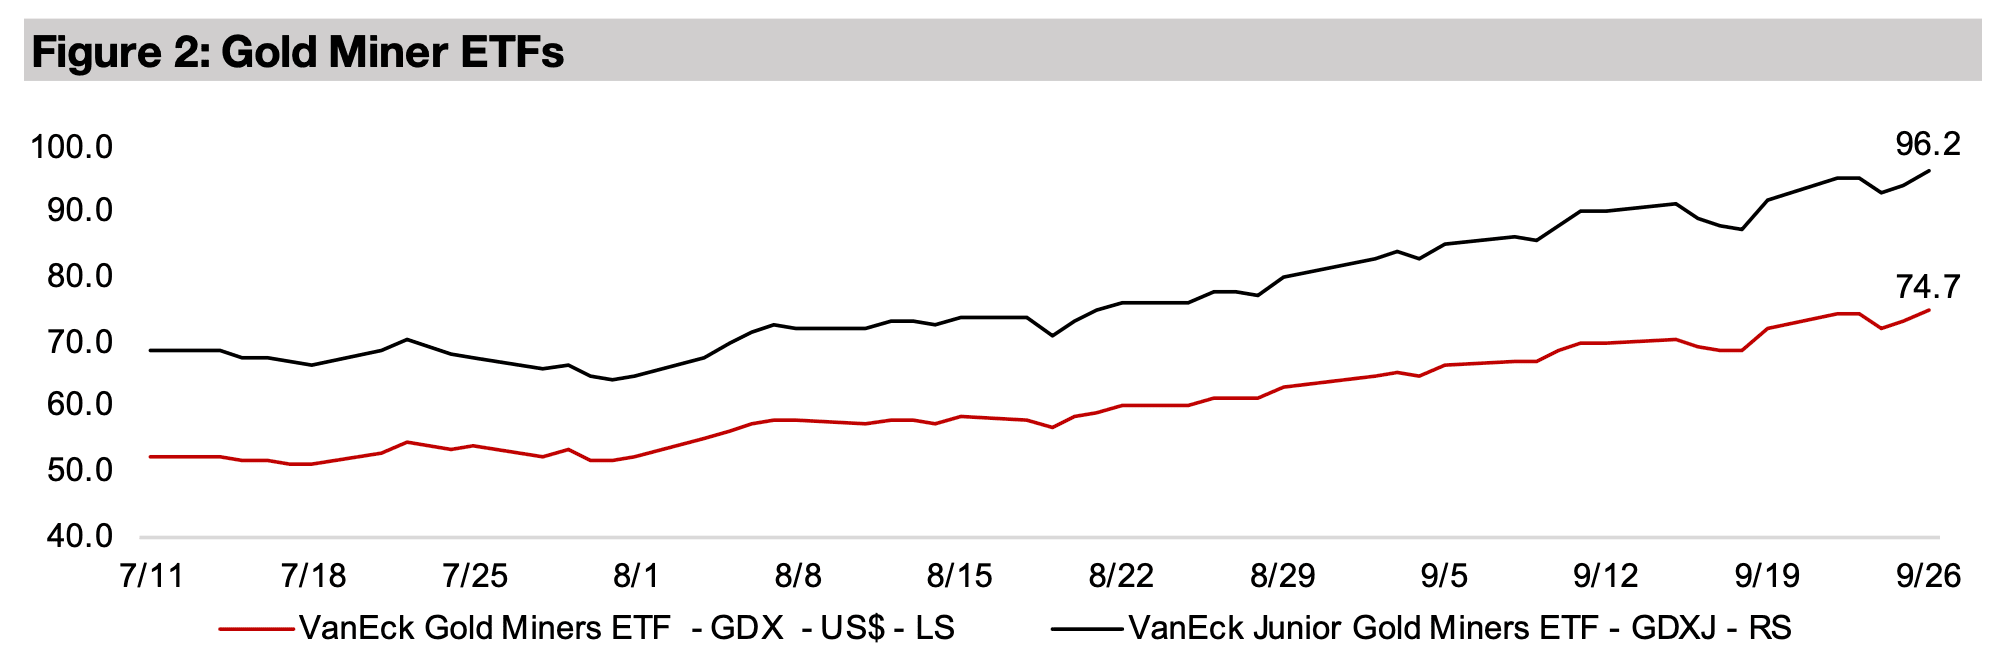
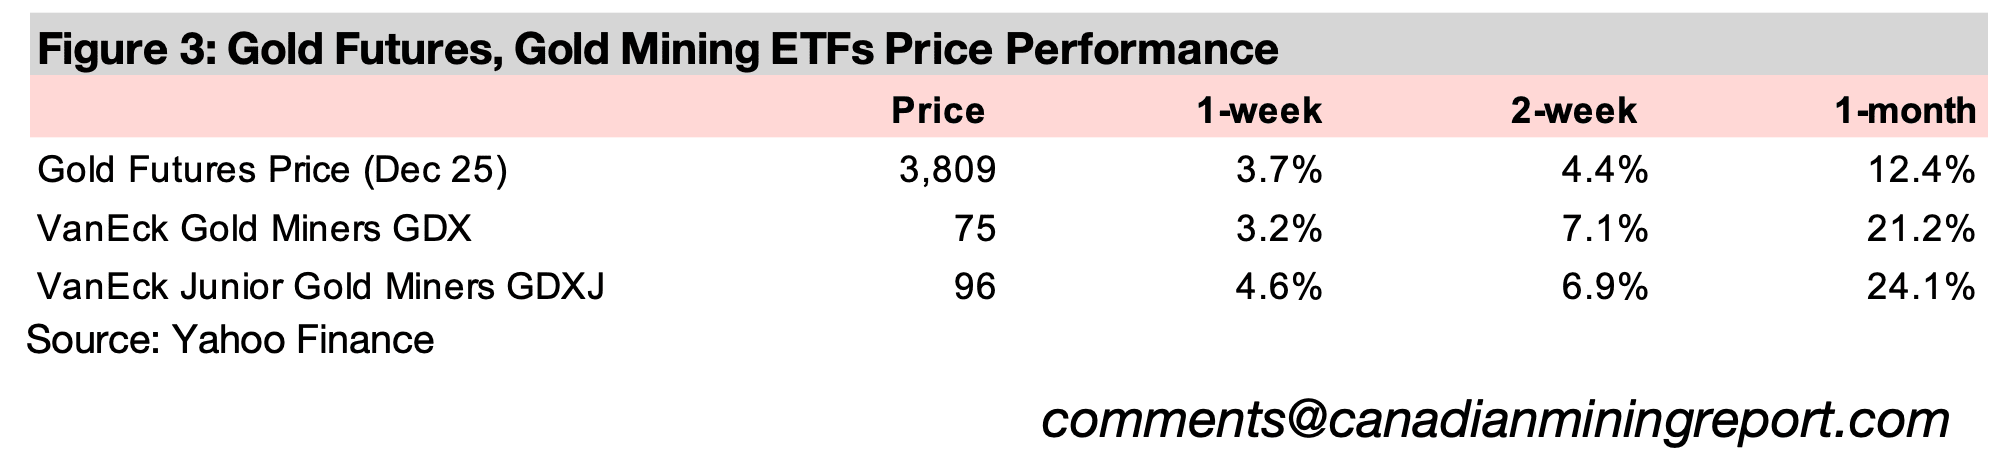
The gold stocks continued to set new highs with the GDX rising 3.2% and GDXJ gaining 4.6% on the strong metal price, while equities slipped, with the S&P 500 down -0.2% and Nasdaq and Russell 2000 declining -0.5%, with valuations remaining high.


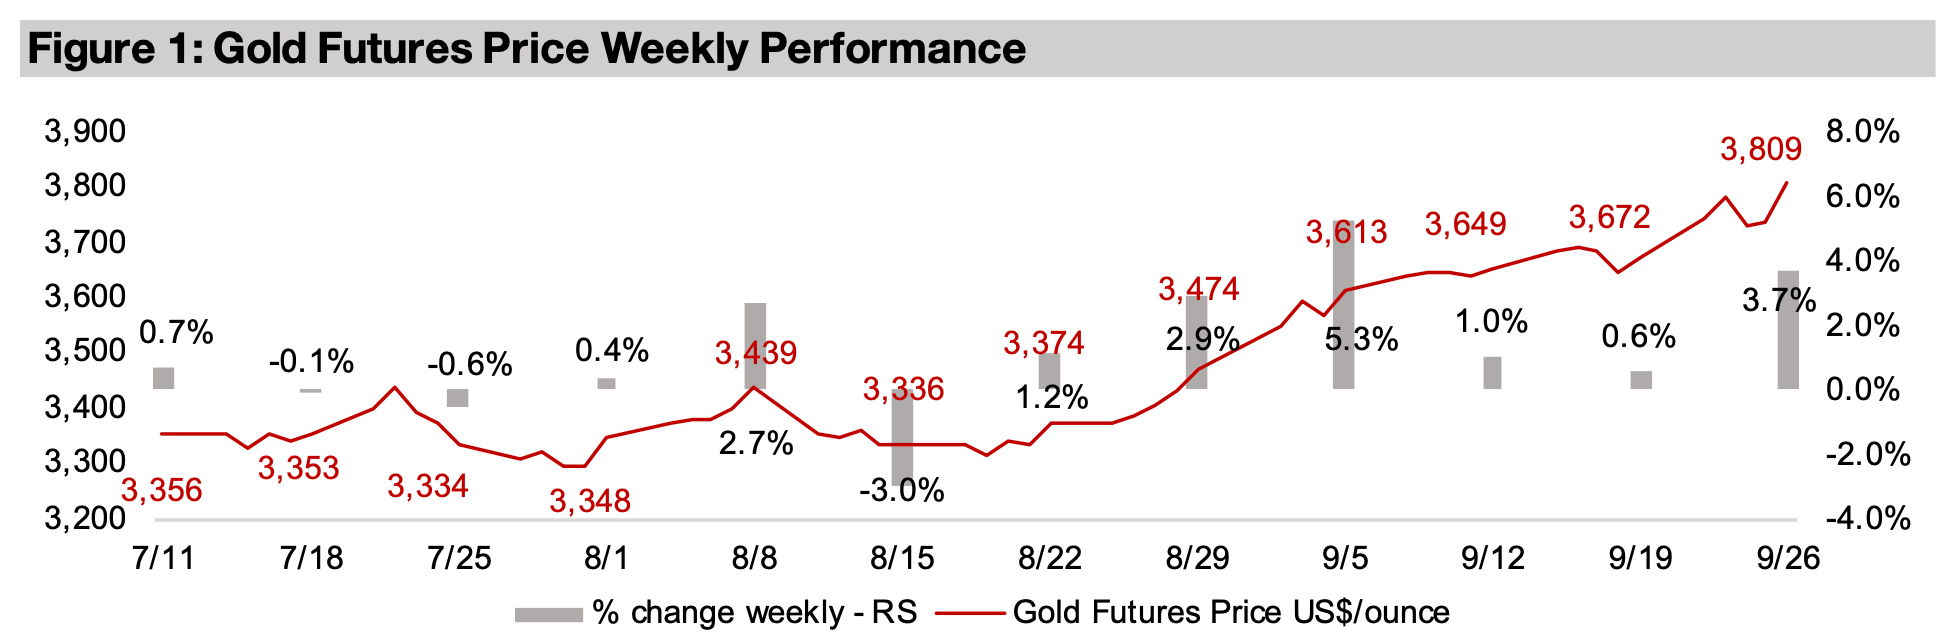
The gold price jumped 3.7% to US$3,809/oz, again rising strongly after muted gains
for the past two weeks, and it is now up nearly US$500/oz from the most recent lows
of US$3,313 on August 19, 2025. We had earlier expected gold could take a pause
after its only muted gain when the 0.25% Fed rate cut finally came through on
September 18, 2025. This seemed to suggest the start of a rate cutting cycle by the
US, which had been a major driver of the strong gains in gold from mid-August to
mid-September, may have been largely priced in by the market. However, this week’s
move indicates the market might have not fully incorporated the upside from two
more 0.25% cuts at the October and December meetings that are widely expected.
Another factor likely driving the move was some hedging of the decline in equities
with the metal. While the drop for the week was not that severe, with the S&P 500
down -0.2% and the Nasdaq and Russell 2000 losing -0.5%, this was after a rebound
from the lows mid-week. US equities remain positioned for downside pressure partly
because of increasingly excessive valuations. The market cap to GDP ratio for the
country has reached 218%, by far its highest level ever, with the ratio rarely getting
above 150% prior to 2020. The Shiller Price to Earnings Ratio (P/E), which adjusts for
average earnings and inflation, is also extreme at 39.84, its second highest level ever,
after the 43.21 peak in November 1999 during the dot.com boom. An almost
uninterrupted rally for the S&P, Nasdaq and Russell 2000, by 33%, 47% and 38%,
respectively, from their April 2025 lows, also suggests the risk of a pullback.
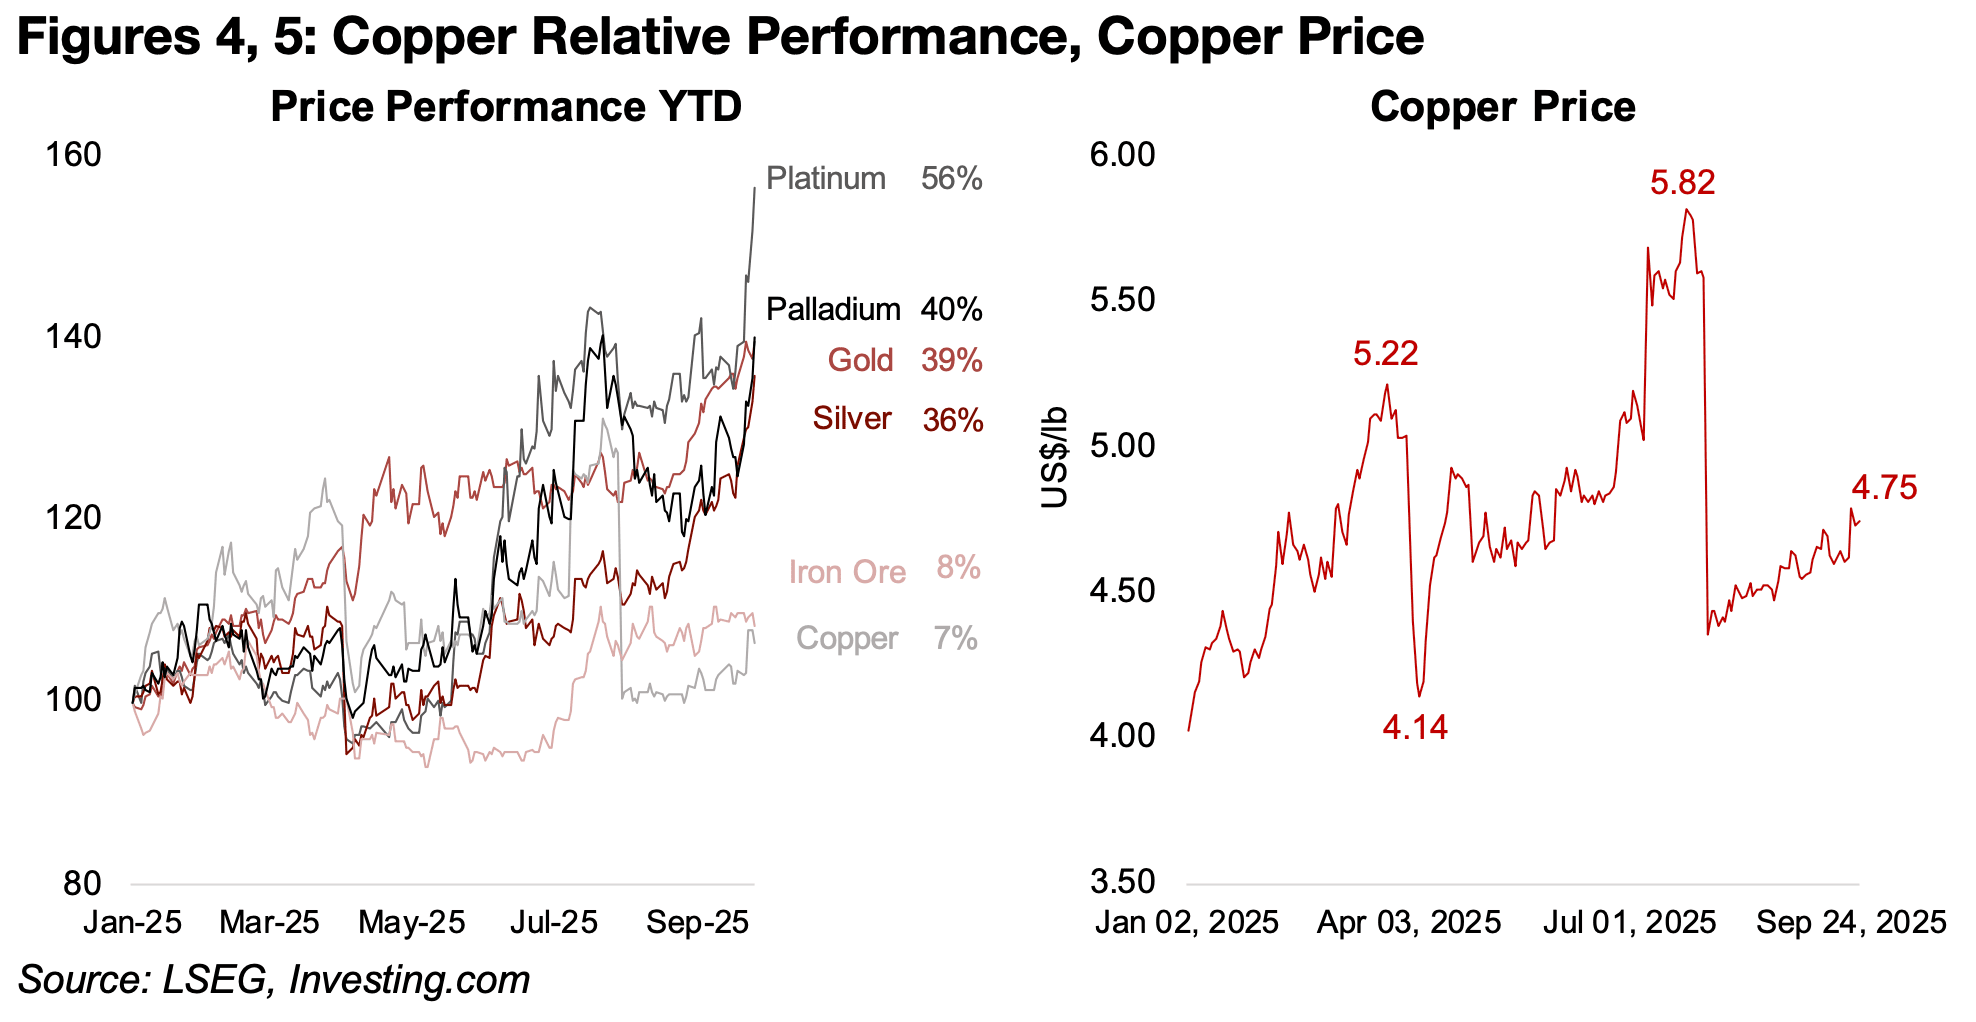
Platinum and palladium saw especially strong gains this week, up 12.5% and 12.2%,
mainly on an announcement from China of plans for a continued major push towards
green energy, with both metals having a range of key uses in this transition. Platinum
has been particularly strong this year, surging 56%, as the metal is expected to face
a major deficit, compared to a relatively balanced market for palladium, which is up
40% this year, just ahead of gold’s 39% gain (Figure 4). The copper price also saw a
relatively strong move this week, up 3.0%, as the fallout from the mudslide tragedy
at the Grasberg mine in Indonesia continued to cause concerns over supply in the
industry. This has boosted the gradual upward trend in the copper price after the
slump in late July 2025 following US clarifications on tariffs for the metal (Figure 5).
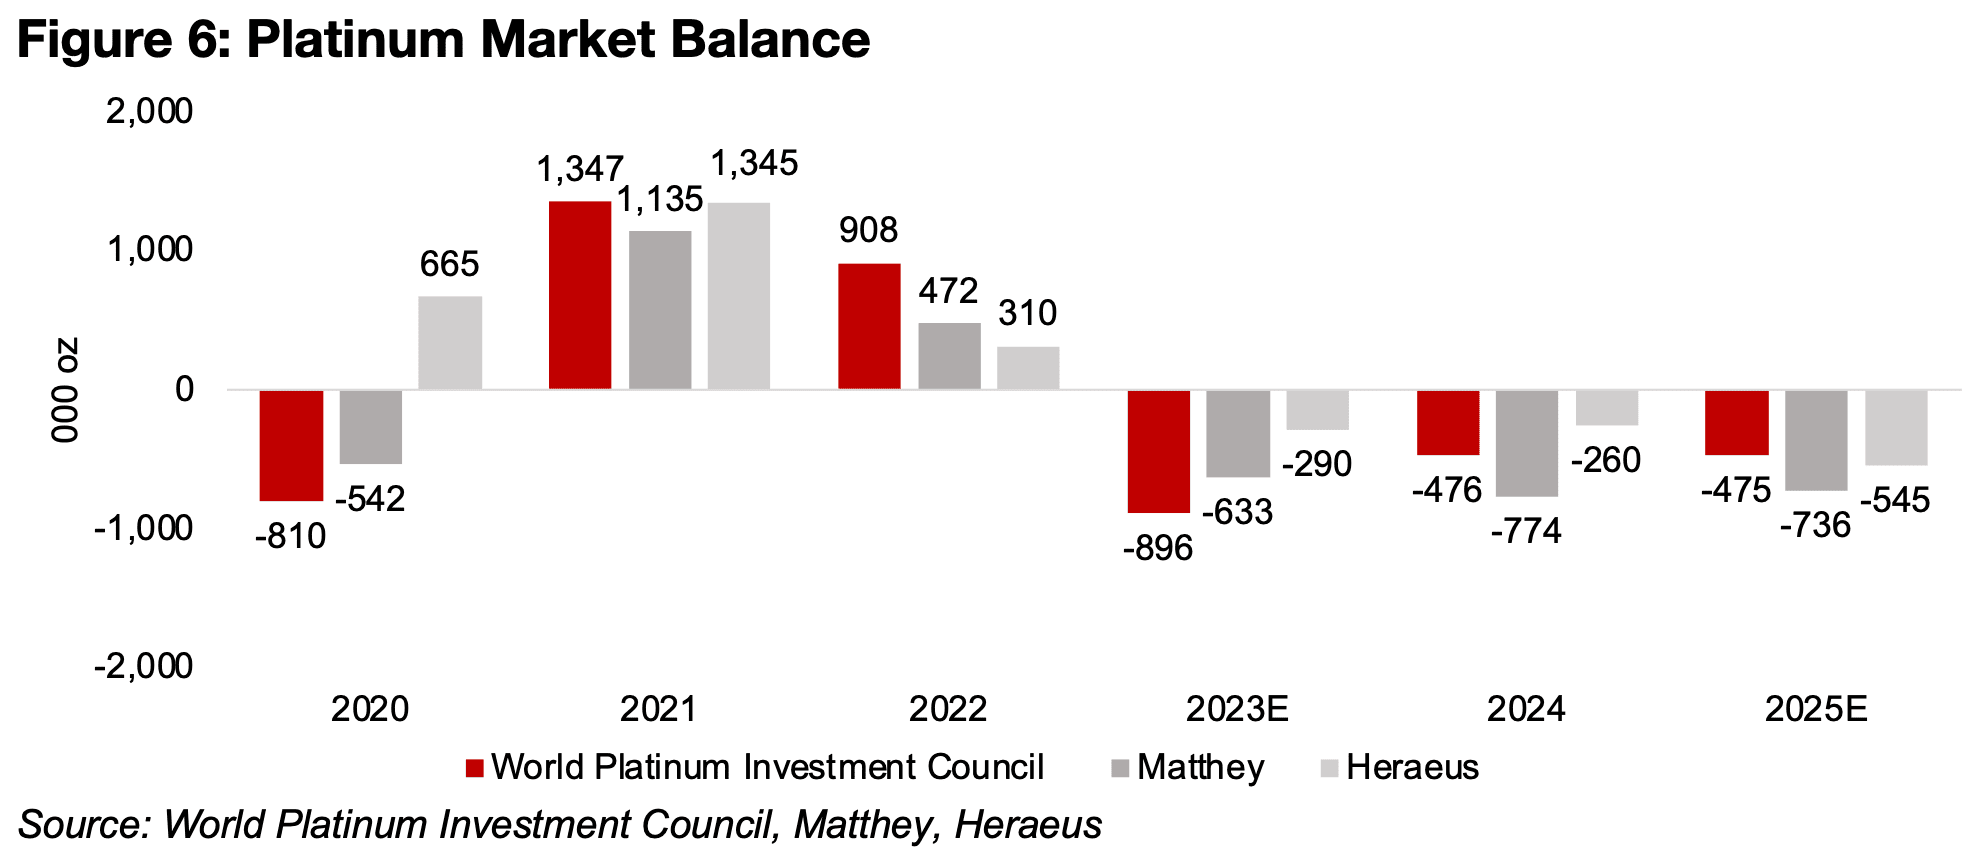
All of the major forecasters of the platinum market are estimating wide deficits in
2025E for the third consecutive year, with the World Platinum Investment Council
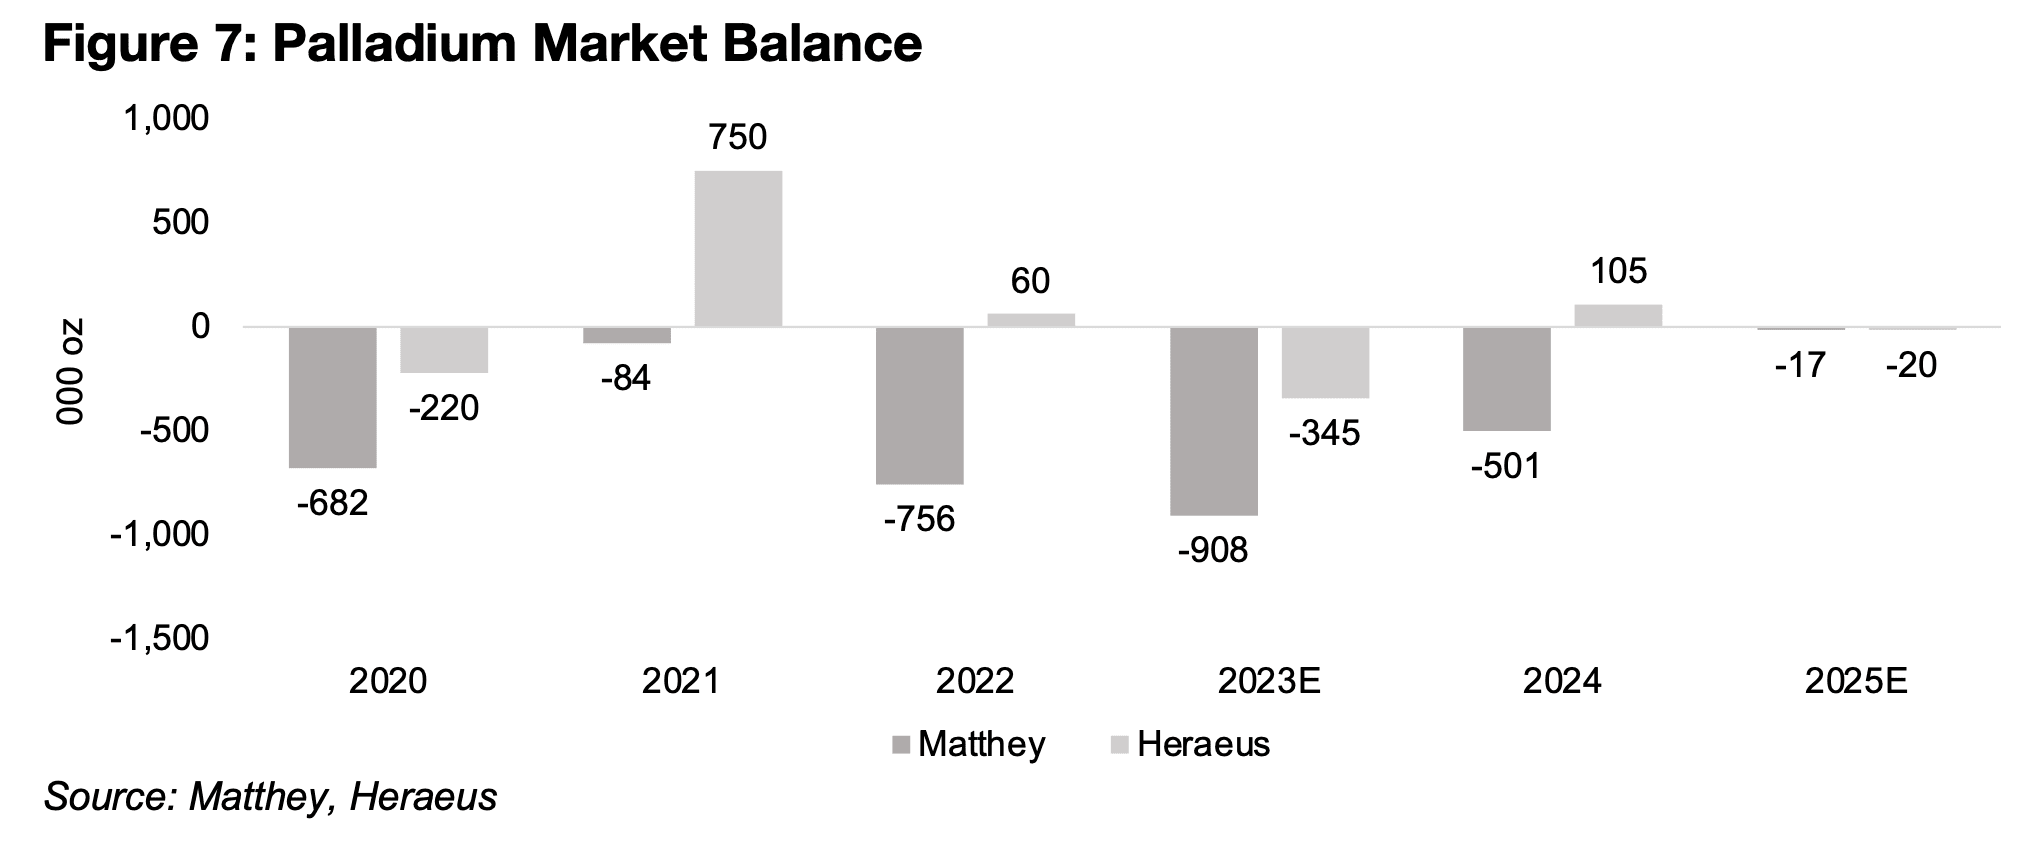
expecting -475k oz, Matthey -736k oz and Heraeus -545k oz (Figure 6). The palladium
market is expected to be roughly balanced, in contrast, with Matthey forecasting a
small -17k oz deficit, almost exactly inline with Heraeus’ estimate of -20k oz (Figure
7). While both metals have the largest proportion of their demand from the auto
industry for use in autocatalysts to reduce emission, this sector is more key for
palladium, where it is over 80% of the total, compared to just 40% for platinum.
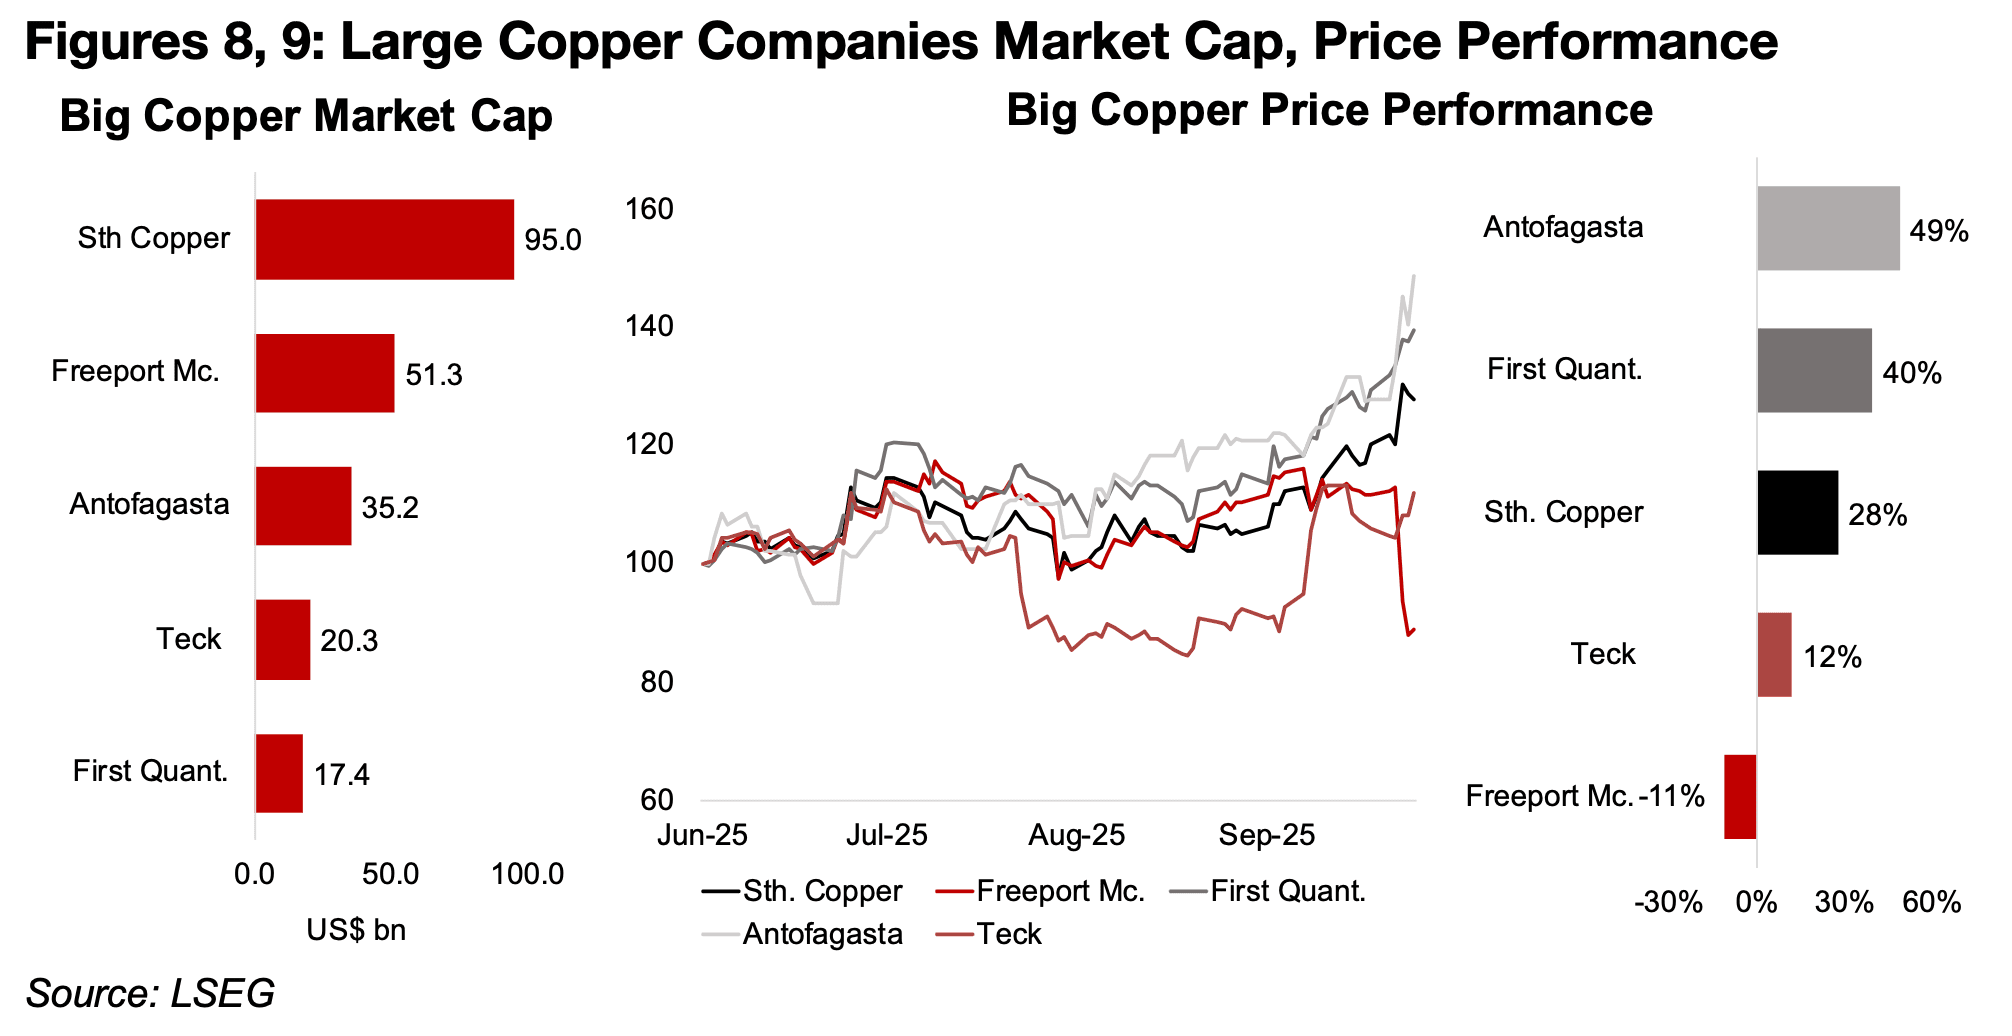
While the rise in the copper price boosted most of the large stocks in the sector, Freeport McMoran slumped, and is now down -11% since June 2025, compared to 49%, 40%, 28% and 12% gains for Antofagasta, First Quantum Minerals and Southern Copper and Teck (Figures 8, 9). This is because the company is a major shareholder of the Grasberg mine which suffered the mudslide, the second largest copper mine in the world, with an 800k tonne capacity (Figure 10).
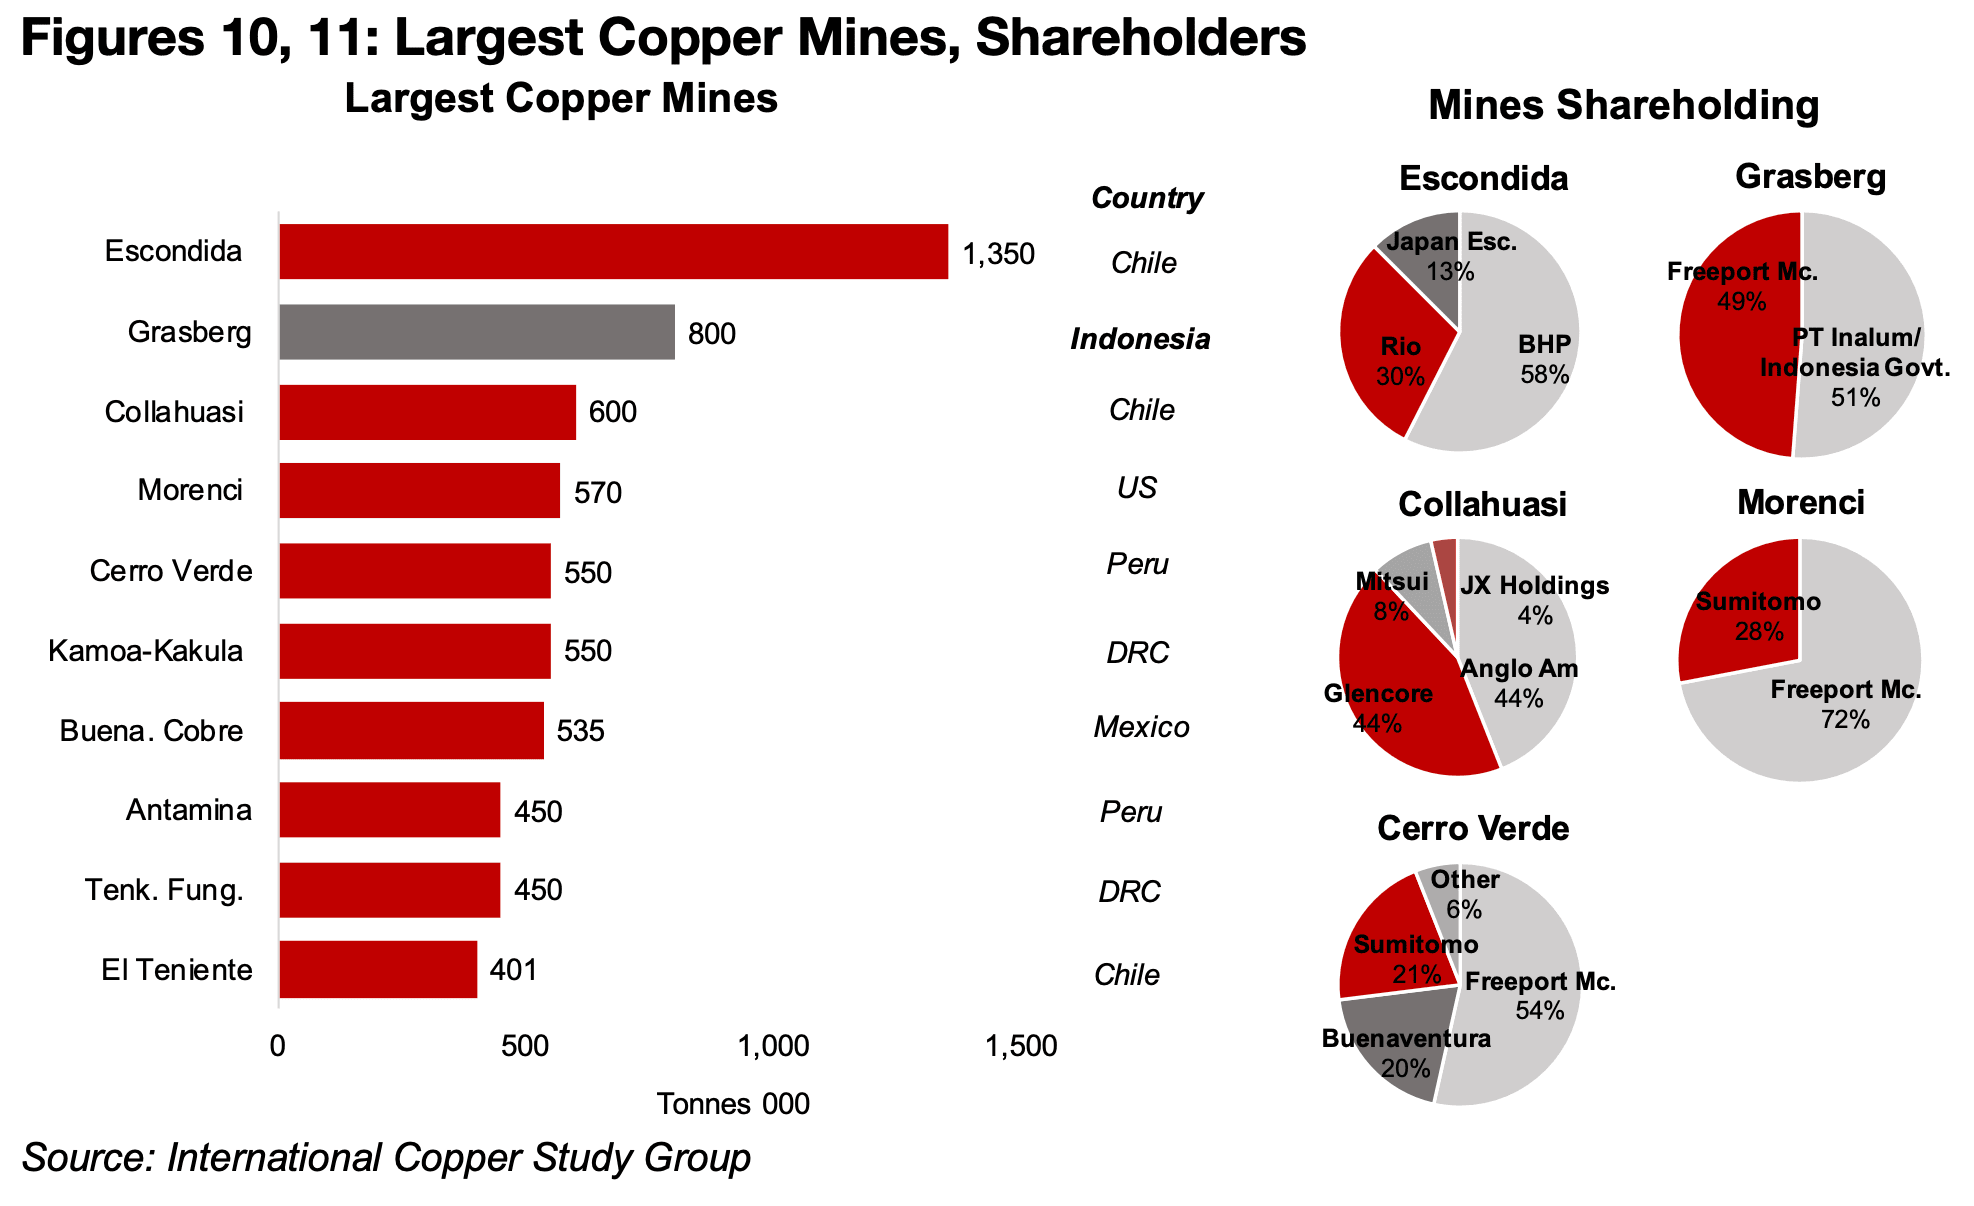
Freeport McMoran’s share of Grasberg is 49%, with PT Inalum and local
governments in Indonesia holding 51% (Figure 11). Production was halted at
Grasberg on September 8, 2025, after the mudslide to allow for rescue efforts for
workers. The company this week declared ‘force majeure’
, which was the main driver
of the over -20% decline in its price. This allows companies to not deliver on contracts
in the case of extreme events that that cannot be controlled, including natural
disasters. The company also expects that copper output from the mine will be very
low for the rest of this year as even the parts of the mine not affected by the mudslide
will not be able to restart operations until the middle of Q4/25.
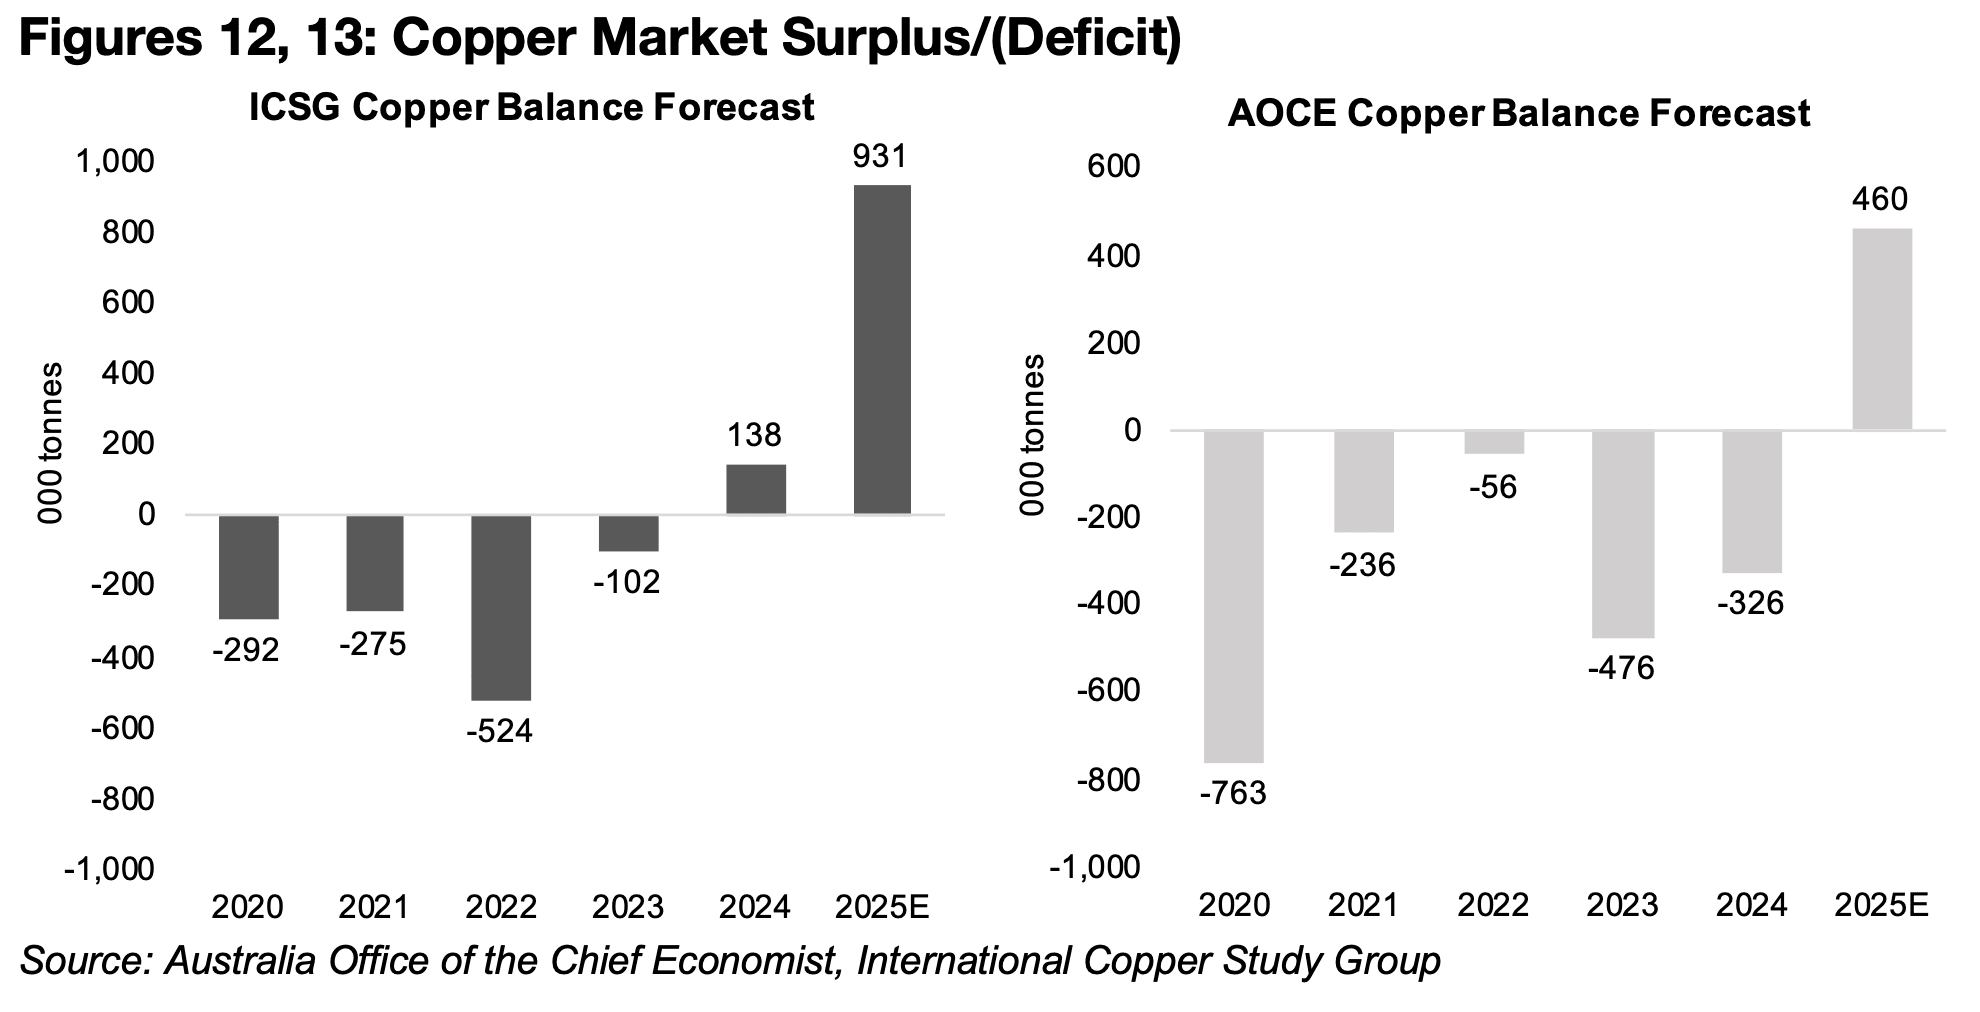
This has led to many market estimates for global copper output in 2025 and even into
2026, to be reduced substantially, and return to normal only in 2027. Currently the
International Copper Study Group (ICSG) forecasts a surplus for the copper market
of 931k tonnes and Australia’s Office of the Chief Economist (AOCE) estimates a 460k
tonne surplus (Figures 12, 13). However, these estimates were released prior to the
Grasberg mudslide and are likely to be revised down substantially. Some estimates
are for a 200k-tonne or more decline in output from Grasberg this year, which would
cut the AOCE surplus for 2025E nearly by half, although the ICSG forecast would
remain relatively high, at around 700k tonnes.
However, there has also been a temporary shutdown of other major copper capacity,
Hudbay Minerals’ Constancia mill in Peru after political protests, which has around
100k tonnes of output per year, and could further reduced the copper market surplus.
Overall there could be upward pressure on the copper price from the supply side for
the rest of year. However, we still see a chance of weaker than expected global
growth over the next year, which could reduce the demand for copper, and potentially
balance out the expected decline in supply.
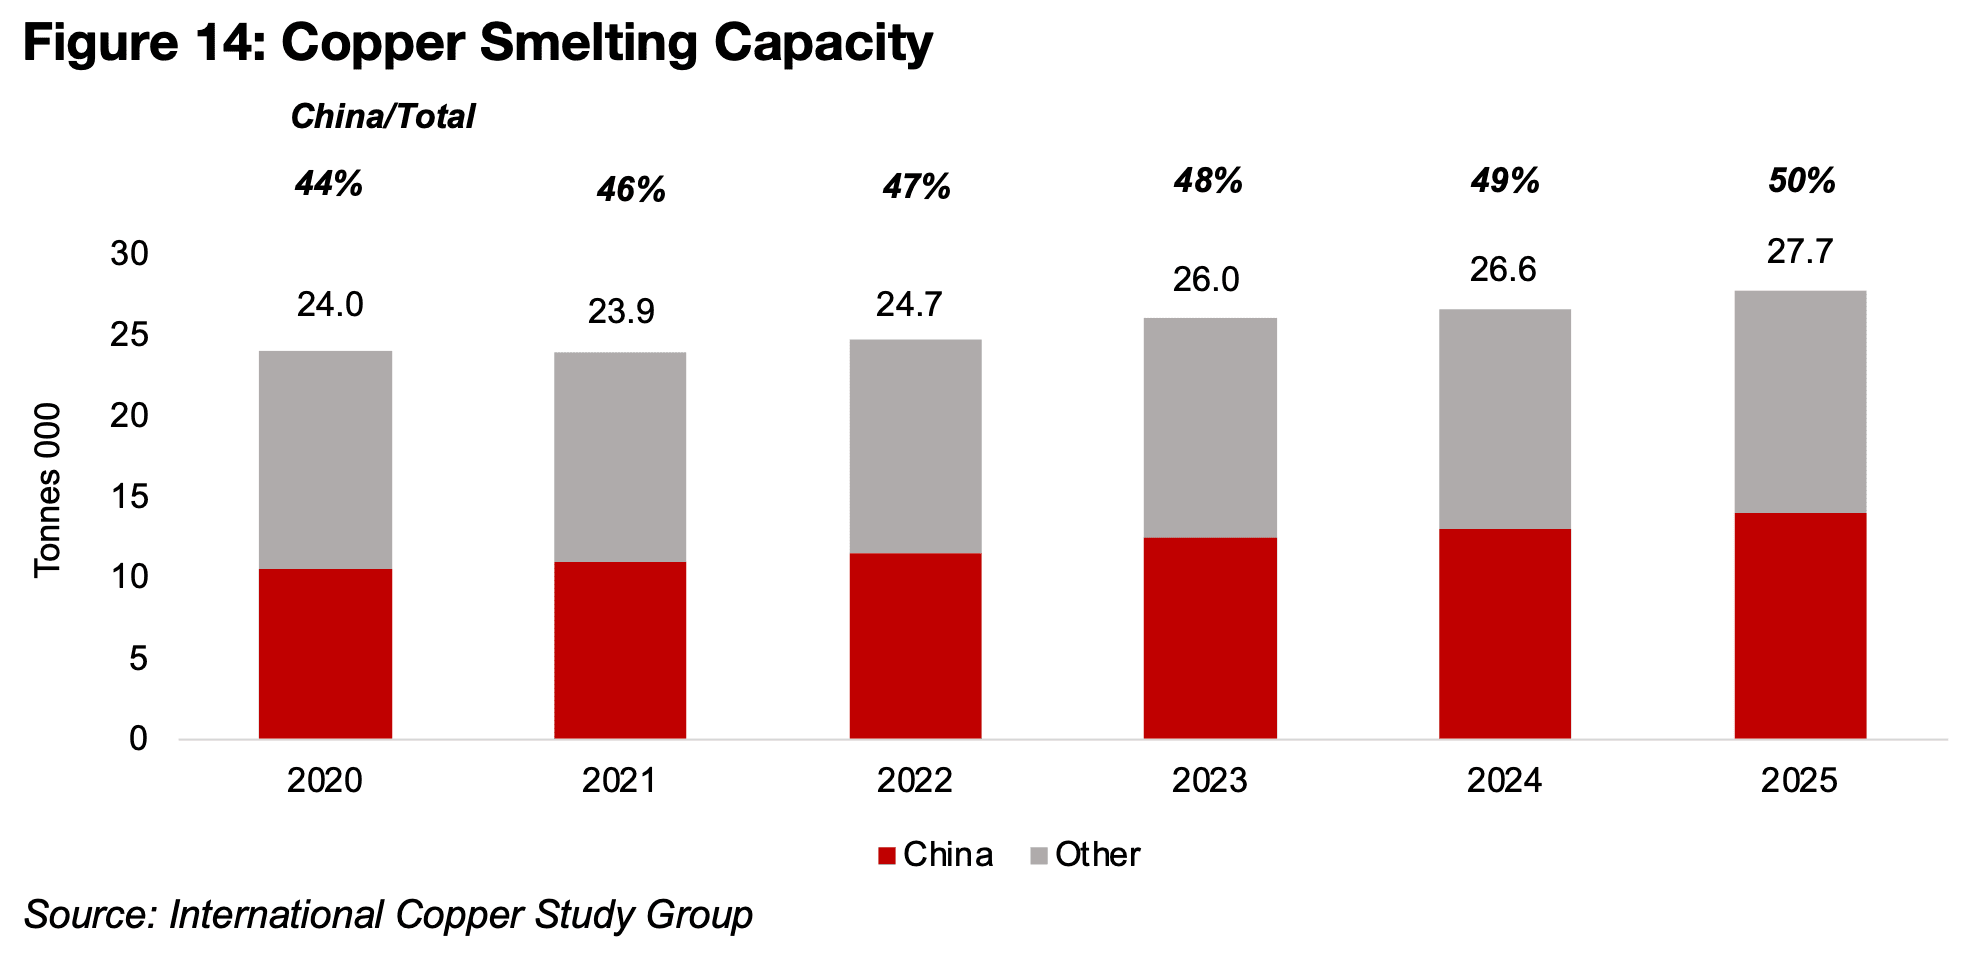
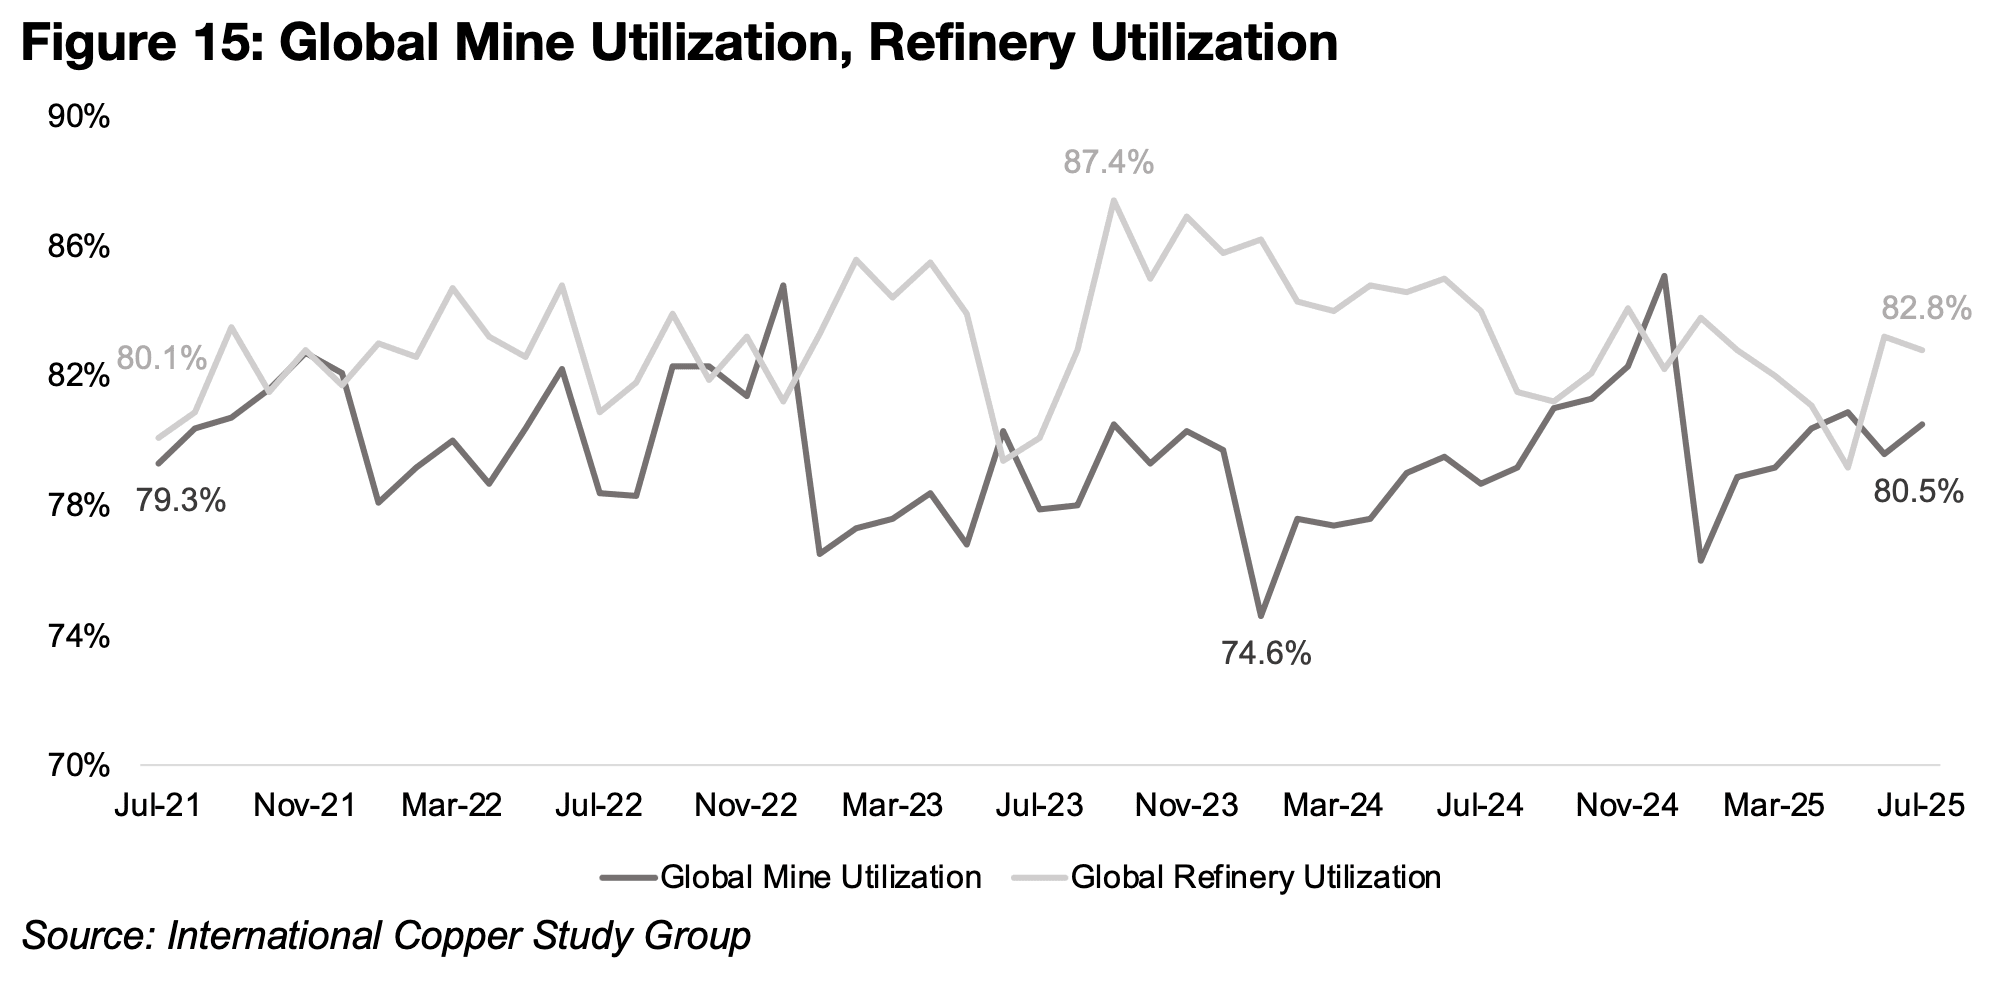
In addition to the disruption to copper mine supply this week, there were also discussions this week in China about difficulties in other parts of the industry, specifically copper smelting capacity. There has been a huge ongoing expansion of capacity in China’s smelter capacity, which is expected to see it rise to 50% of the global total this year, up from 44% in 2020 (Figure 14). For the industry step prior to smelting, which is the extraction directly from mines, global utilization rates have risen from recent lows of 74.6% in January 2024 to 80.5% as of July 2025, although this figure will be likely to decline substantially from September 2025 on the Grasberg shutdown (Figure 15). For the step after smelting, refining, utilization has declined from a recent peak of 87.4% in September 2023 to 82.8%.
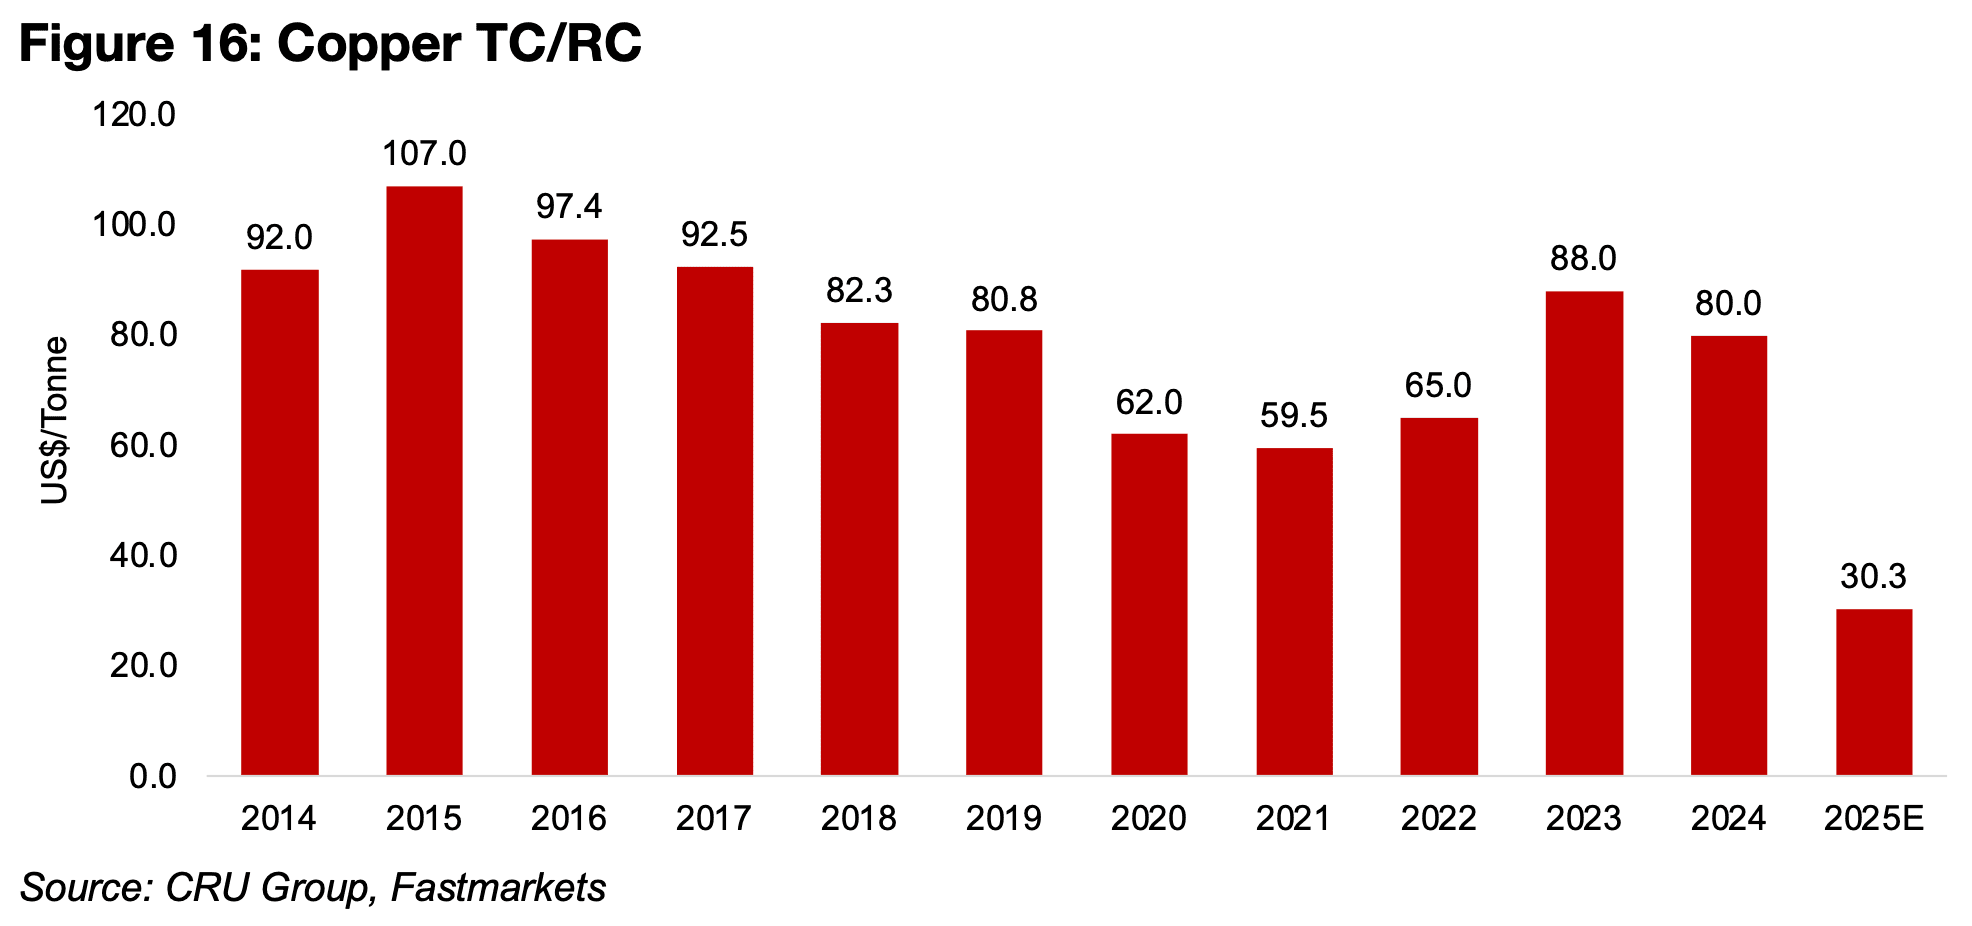
The oversupply of China’s smelting capacity has put major pressure on global copper Treatment and Refining Charges (TC/RC), which are expected to decline to just US$30.3/tonne in 2025 (Figure 16). This is about half the previous lows of around US$60/tonne in 2020 and 2021, which was driven by the global health crisis, with TC/RC historically usually at US$80/tonne or above over the past decade, and peaking at US$107/tonne in 2015. These low rates have led to many smelters operating below profitable levels and driven them to suspending or shutting down capacity. This could further exacerbate the issues of low supply that are likely to be generated by the Grasberg shutdown for the rest of this year and into 2026.
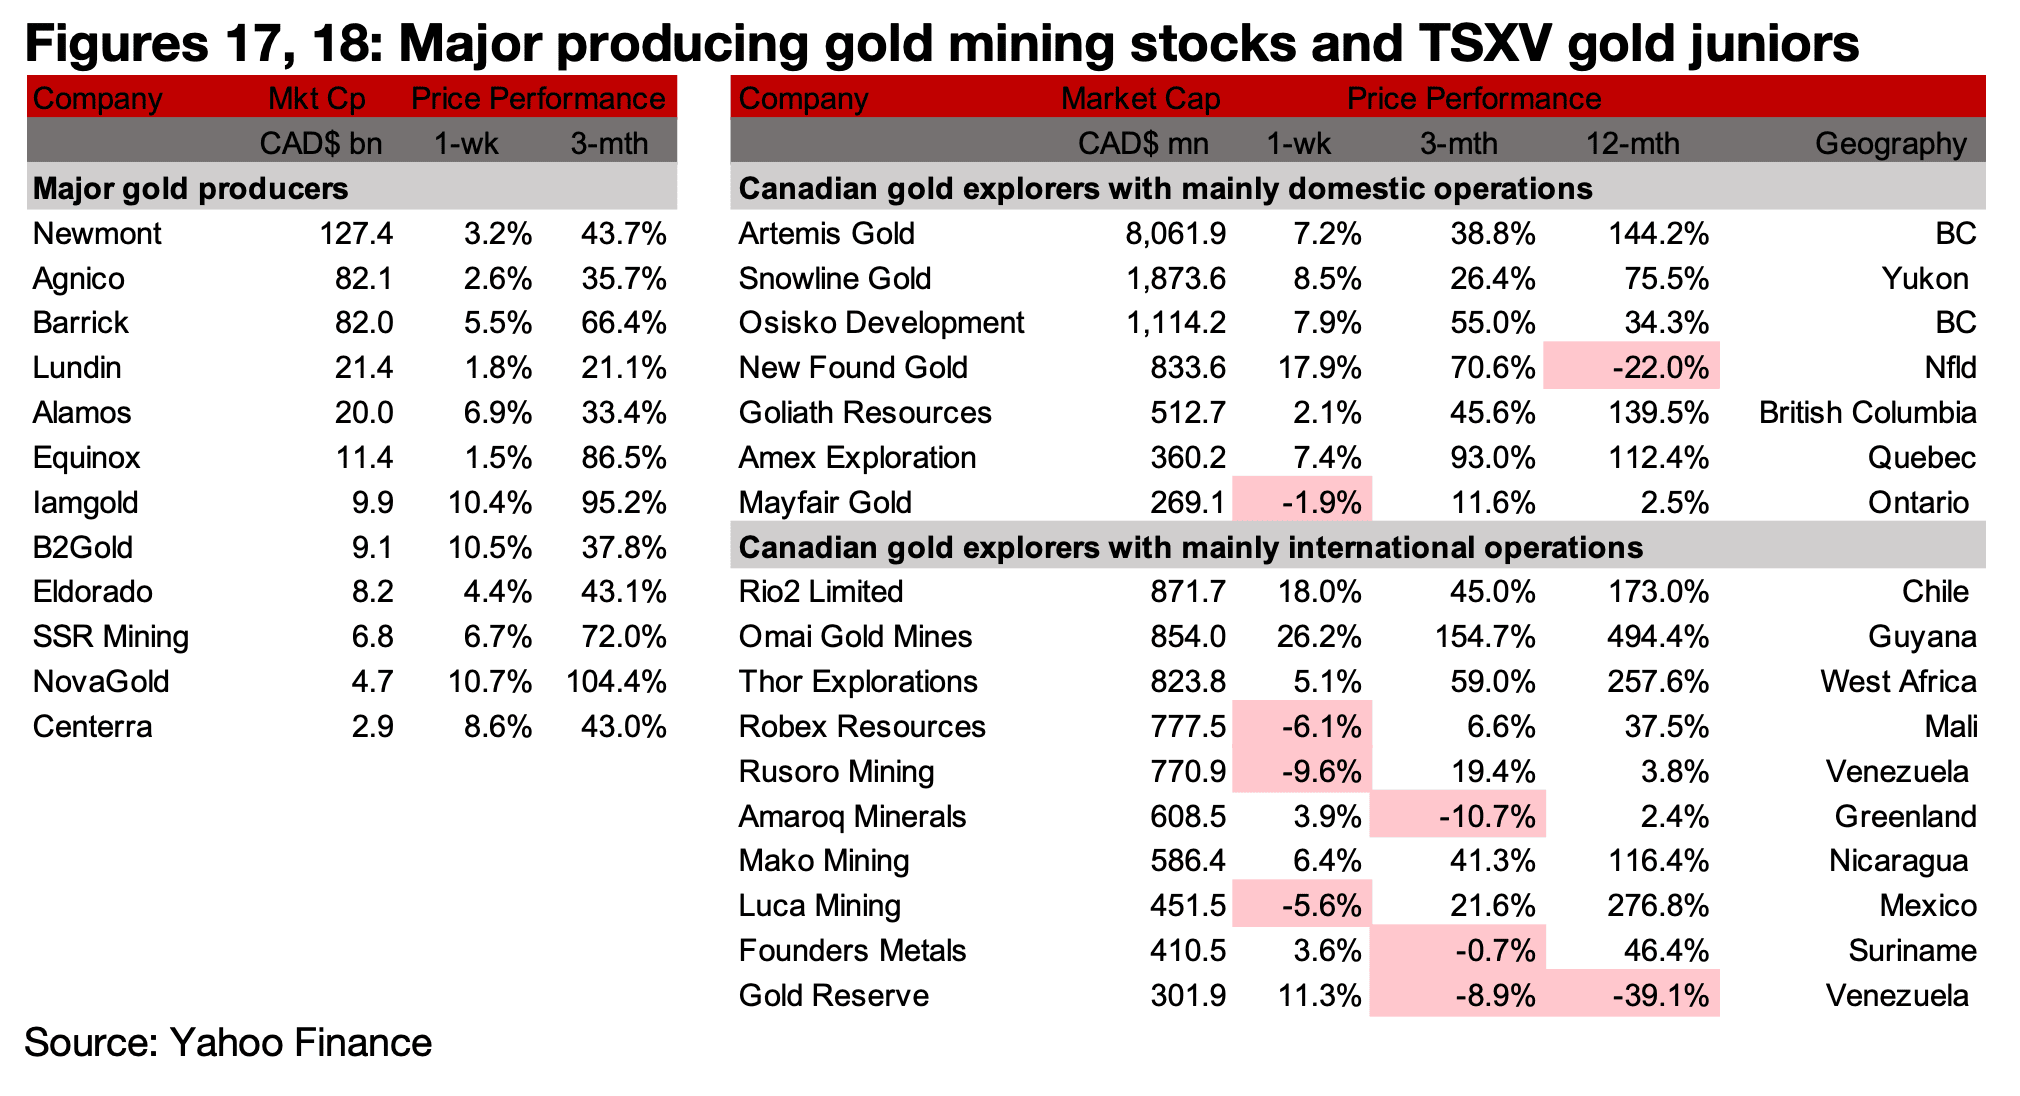
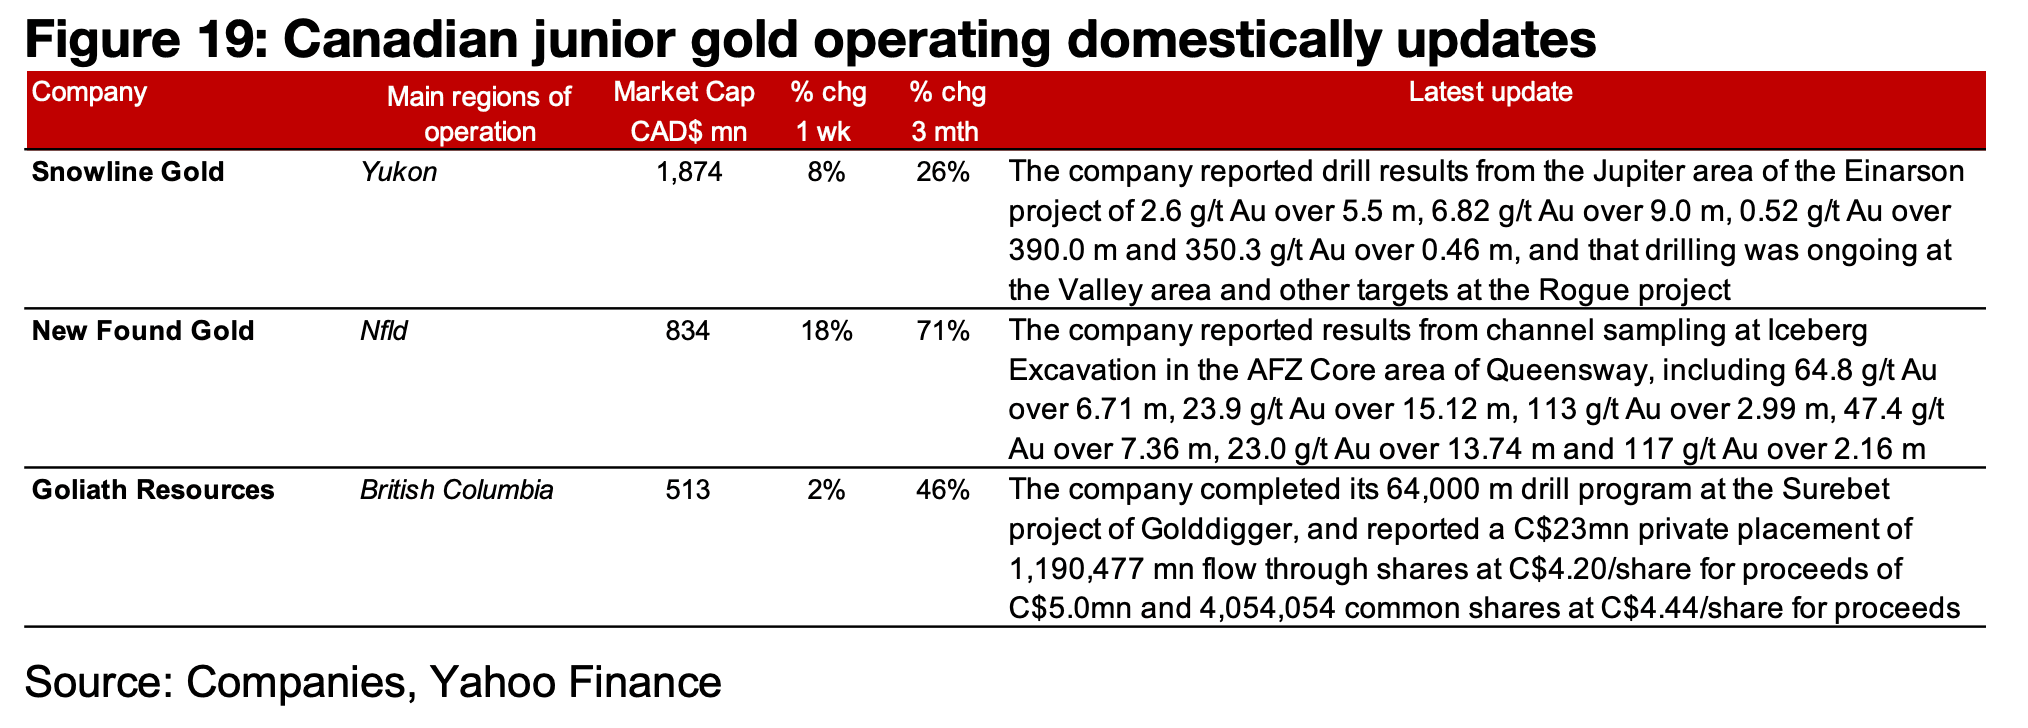
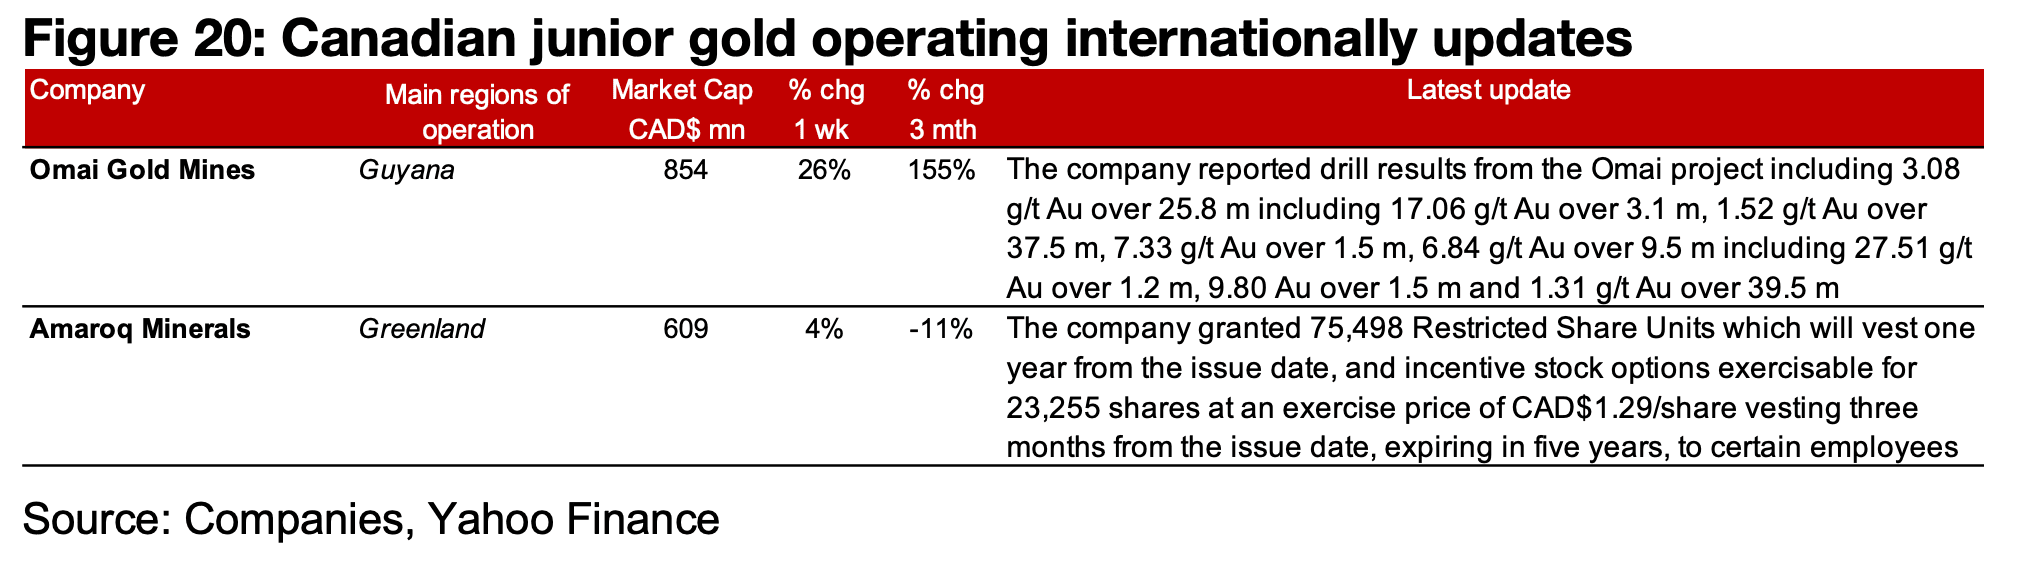
The major producers and most of the TSXV gold stocks were up on the gain in the metal price (Figures 17, 18). For the TSXV gold companies operating mainly domestically, Snowline Gold reported drill results from Jupiter at Einarson and provided an update on drilling at the Valley and other targets of Rogue. New Found Gold reported channel sampling from Iceberg Excavation in the AFZ Core area of Queensway and Goliath completed its drill program at the Surebet project of Golddigger and announced a C$23mn private placement (Figure 19). For the TSXV gold companies operating mainly internationally, Omai reported drill results and Amaroq granted Restricted Share Units and incentive stock options (Figure 20).
Disclaimer: This report is for informational use only and should not be used an alternative to the financial and legal advice of a qualified professional in business planning and investment. We do not represent that forecasts in this report will lead to a specific outcome or result, and are not liable in the event of any business action taken in whole or in part as a result of the contents of this report.
Author
Ben McGregor authors the Weekly Roundup at CanadianMiningReport.com, providing sharp analysis of the metals and mining sector. With a talent for spotting trends, Ben distills complex market shifts into clear, engaging insights on TSXV junior miners. His weekly updates cover gold, copper, uranium, and more, blending data-driven perspectives with a knack for identifying opportunities. A vital resource for investors, Ben’s work navigates the dynamic junior mining landscape with precision.