
June 29, 2026
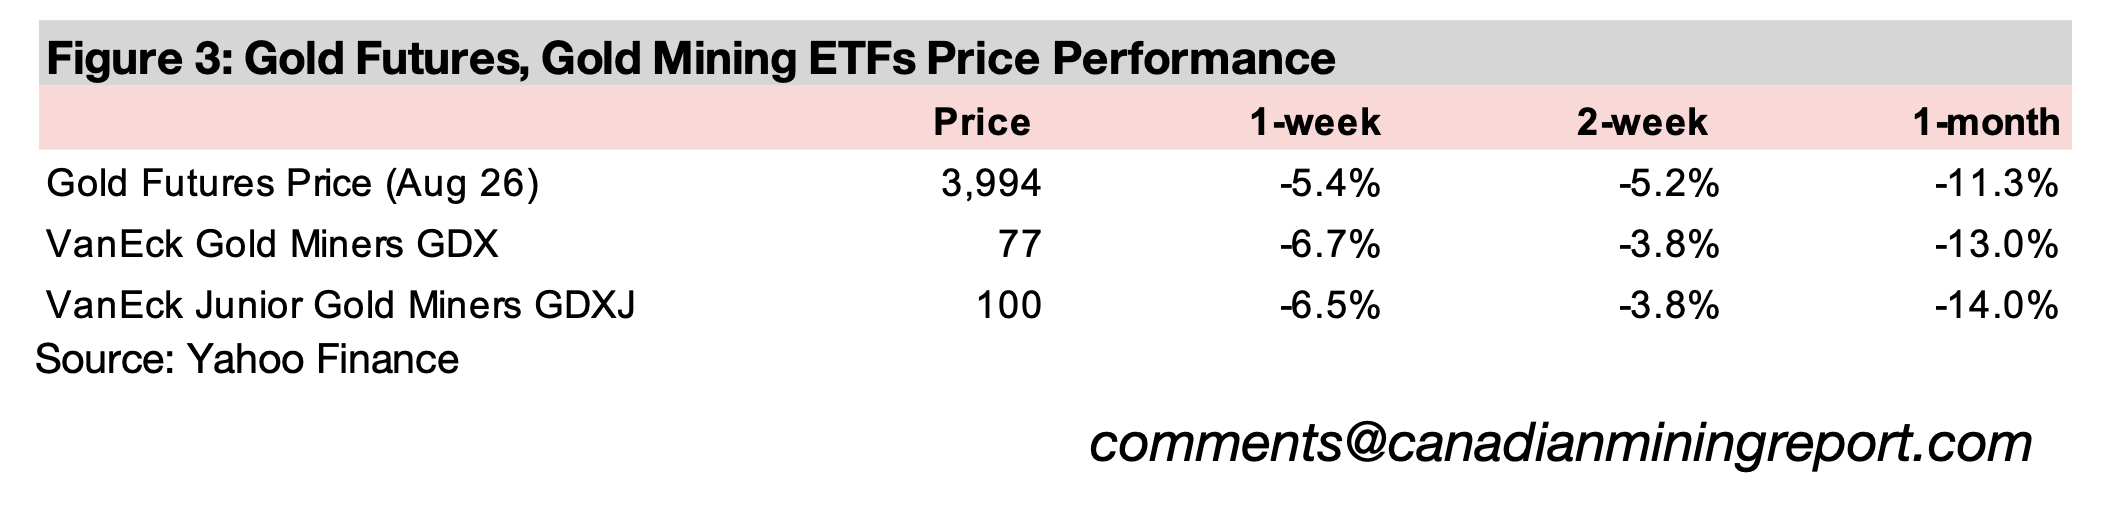
Gold declined -5.4% to US$3,994/oz, dropping below US$4,000/oz for the first time since November 2025, as a tentative peace continued to hold in the Middle East peace which reduced the geopolitical risk premium priced into the metal.
Mining sector valuations have pulled back to moderate levels in recent months, especially in contrast to tech, with high multiples even after a recent decline, while Benz saw major gains after announcing a Mineral Exploration Target for Glenburgh.
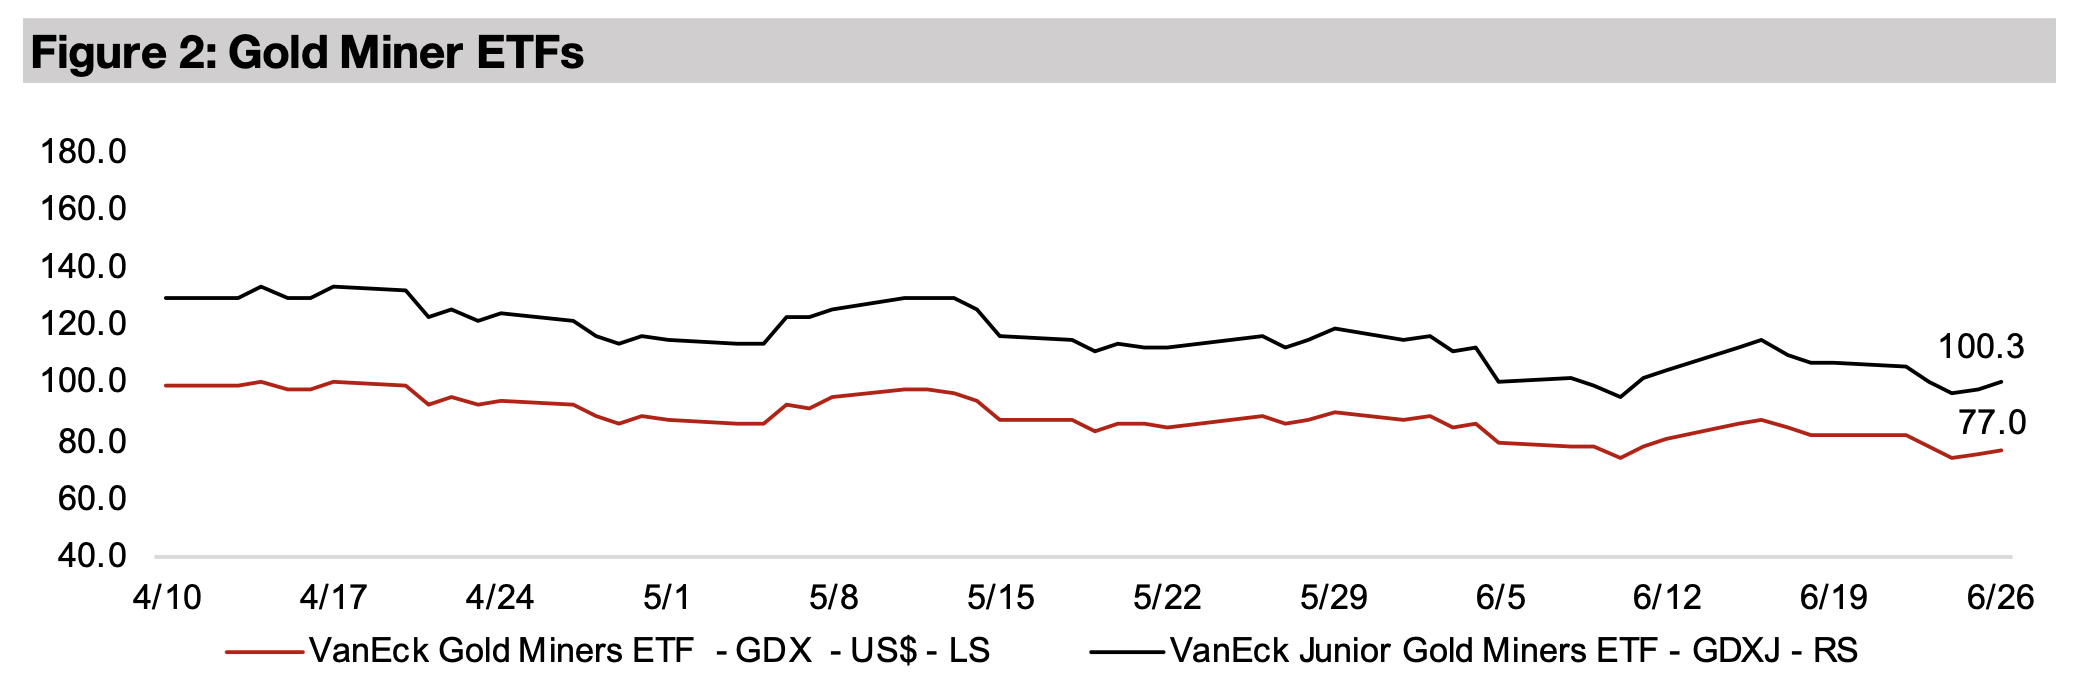
The gold stocks declined, with the GDX down -6.7% and GDXJ losing -6.5%, finally capitulating after rising in the previous two weeks even as the metal dropped, with large caps down especially on a downturn in tech, but small caps still gaining.


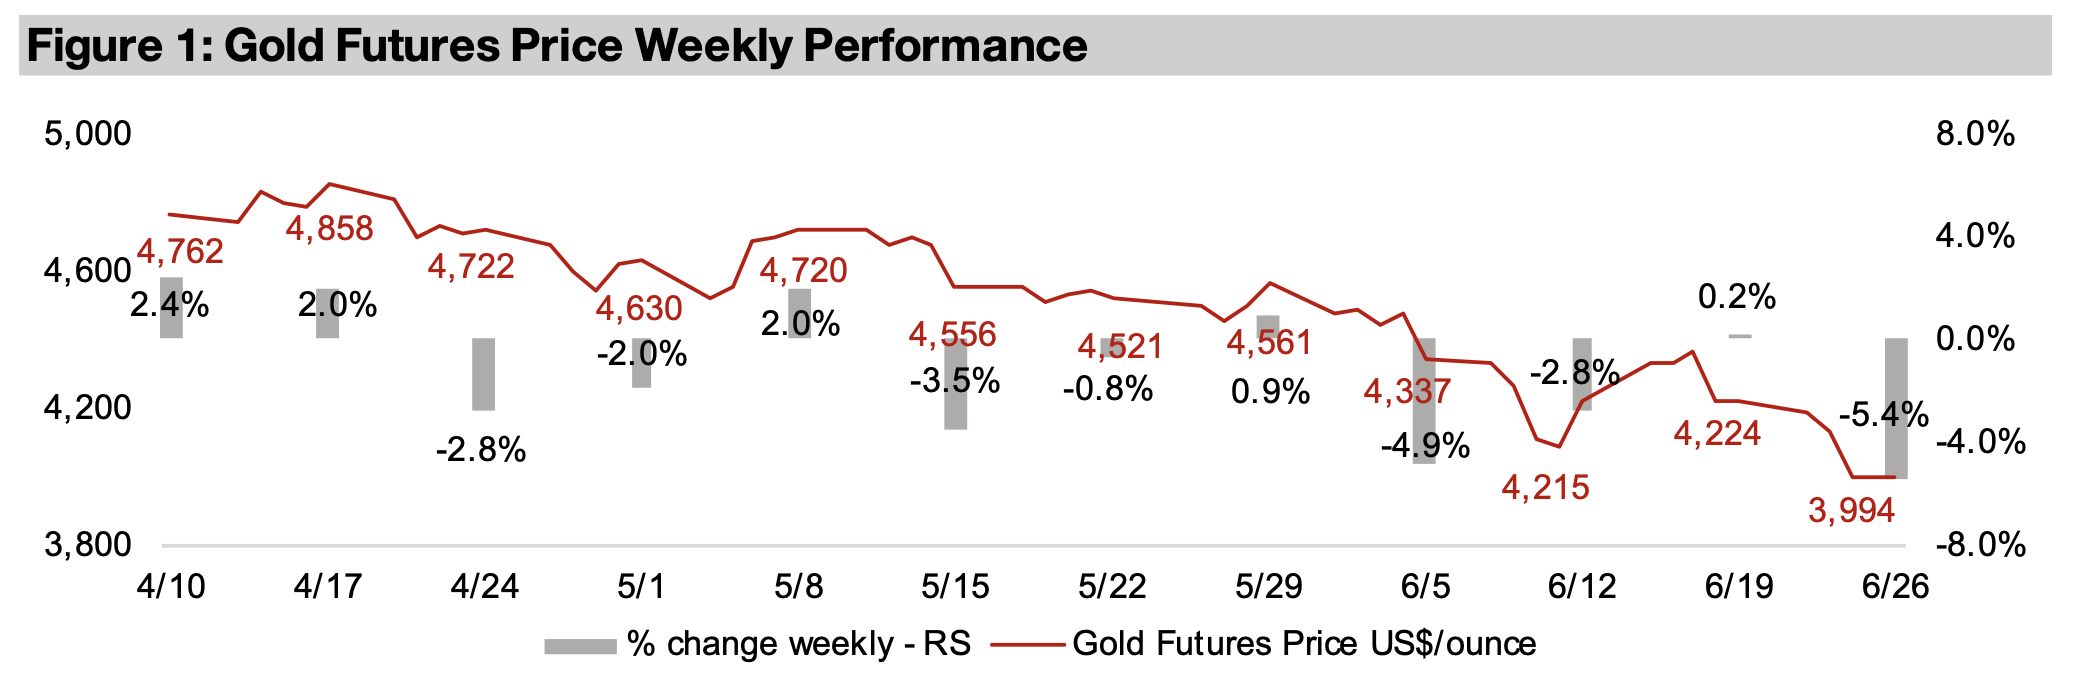
The gold price declined -5.4% to US$3,994/oz, slumping below the US$4,000/oz
benchmark for the first time since November 2025, as peace in the Middle East
reduced the geopolitical risk premium priced into the metal. The ‘speculative period’
in gold that peaked from late-2025 into early-2026 seems to have now fully ended,
with a reversal starting by February 2026 accelerated by the effects of the war from
March 2026. The large caps dropped, with the S&P 500 down -1.2%, driven by a
slump in tech, with the Nasdaq plunging -4.5%, although the Russell 2000 small cap
index still rose 0.6%, showing markets were taking on some risk away from tech.
The gold stocks, which had diverged from the decline underlying metal price in the
previous two weeks and actually risen, finally capitulated, with the GDX down -6.7%
and the GDXJ dropping -6.5%. However, with the sector leveraged to the gold price,
we would usually expect to see a larger movement in the stocks versus the metal,
but they only were below it by about a percent. This suggests that there could be
some support from relatively low valuations for the sector. We have shown recently
that the gold sector had some of the highest returns in 2025, not that far below even
tech, but with price to book valuations only about a third the level.
The high 2025 return on equity for the gold sector is also based on an average gold
price far below US$4,000/oz, and even at US$3,000/oz all major producers would be
seeing wide margins. If the gold price starts to settle at around US$4,000/oz for the
next year, extremely strong profitability for the sector will continue. The outlook for
costs in the industry could also improve given the major drop in the oil price, with
energy a high proportion of the expenses for miners. However, with the average AISC
for the majors still well below US$2,000/oz, even if inflation does remain high, the
industry could still absorb quite a significant jump in costs.
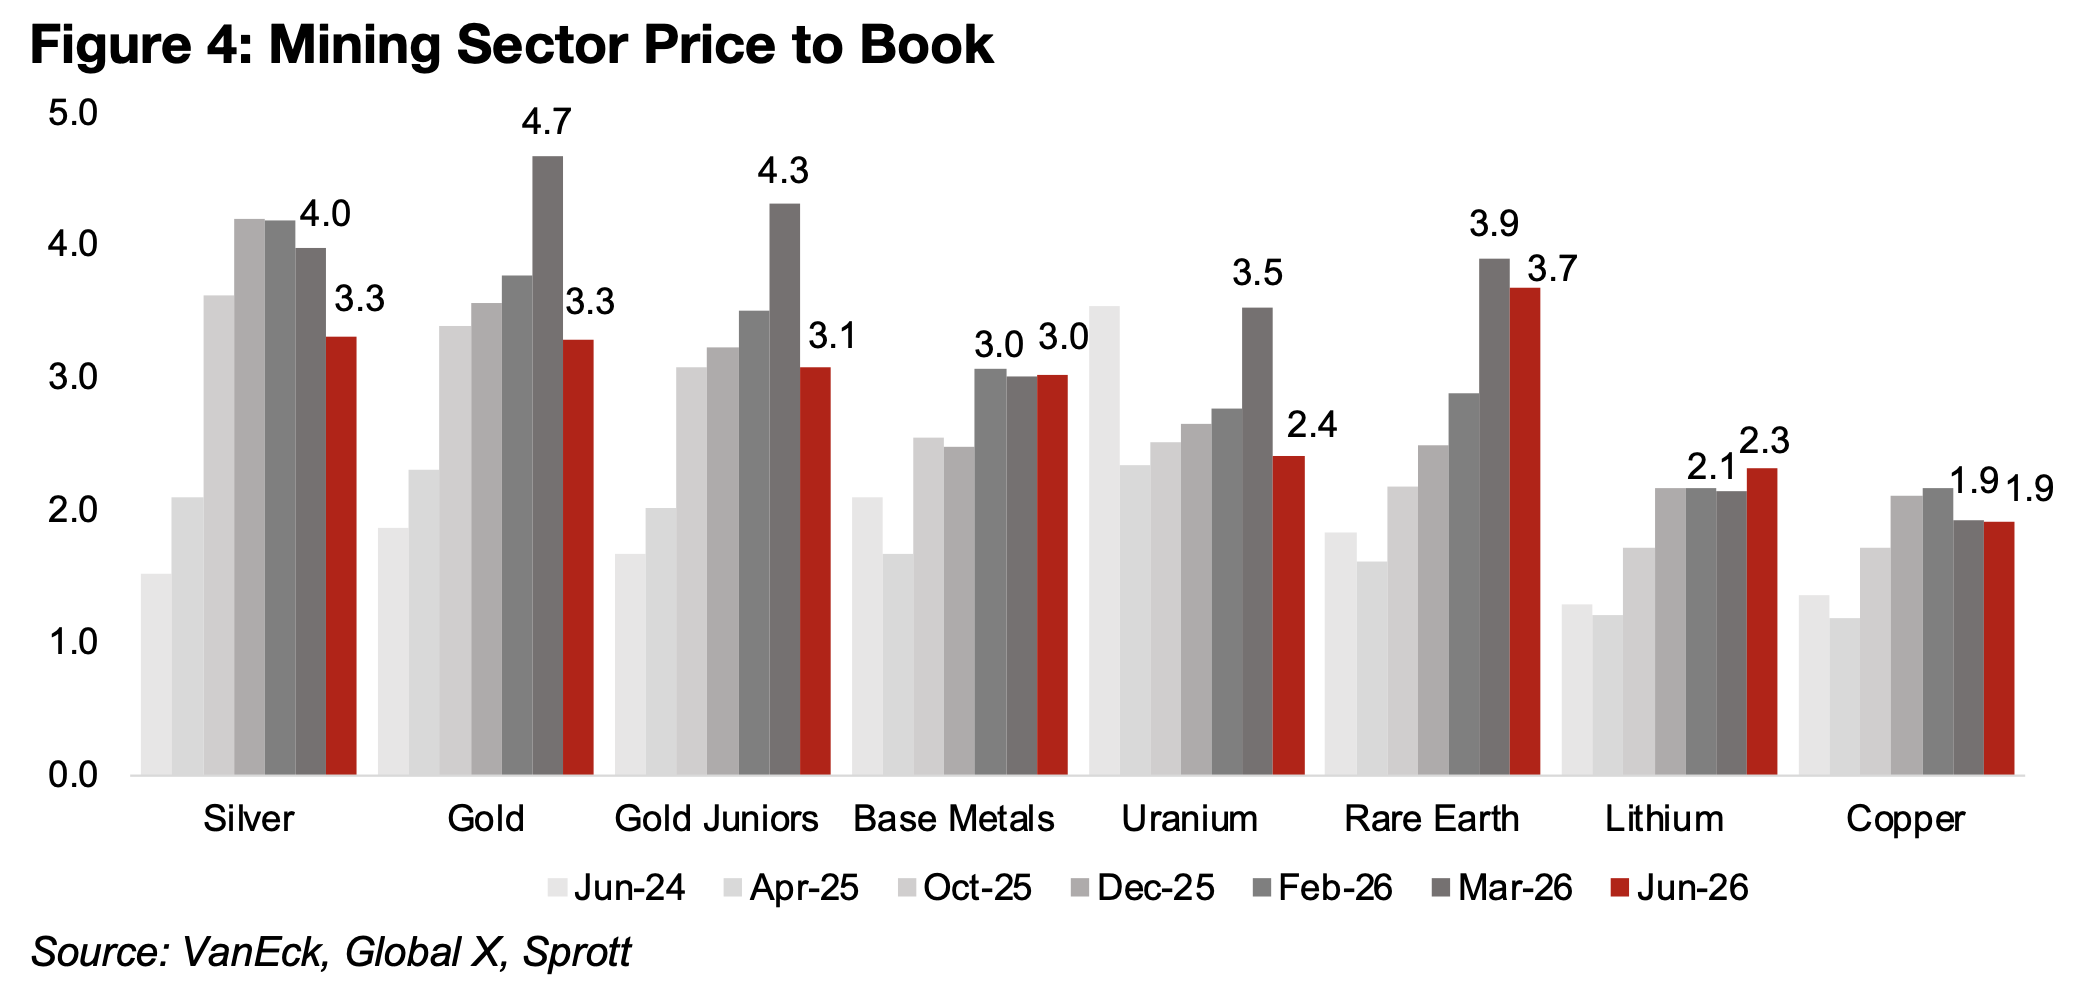
Gold stock valuations have declined significantly over the past three months, with the
price to book of the GDX ETF of gold producers back to just 3.3x from a peak of over
4.7x in March 2026, and the GDXJ ETF of juniors declining to 3.1x from a peak of
4.3x in the same month (Figure 4). This puts both at around the levels of around
October 2025, again suggesting that a highly speculative period where prices and
valuations were getting excessive has given way to something likely more closely
reflecting the underlying fundamentals for the sector.
The other mining sectors that had seen valuations jump to reasonably high levels in
early 2026 have also seen price to book multiples drop to more moderate levels. The
silver sector P/B is down to 3.3x from a peak at 4.2x, uranium has dropped to just
2.4x from 3.5x and rare earths has declined to 3.7x from 3.9x. Copper valuations have
edged down to 1.9x, and remained low throughout even the boom earlier this year,
peaking at only 2.2x. The lithium sector has seen the only rise in valuations, to 2.3x
from 2.2x, as the metal price has been recovering after a slump from late 2022
through 2023 and then a long trough from 2024 to 2025.
The tech drop in the US seems to have partly been a contagion from a plunge in South Korean stocks, with the Kospi index collapsing -8.3% on the first day of last week, triggering a circuit breaker which halted trading. This was especially driven by the semiconductor sector, with the country having with two of the largest global chip companies, Samsung Electronics and Hynix, and the industry having seen a huge bubble this year on the AI boom.
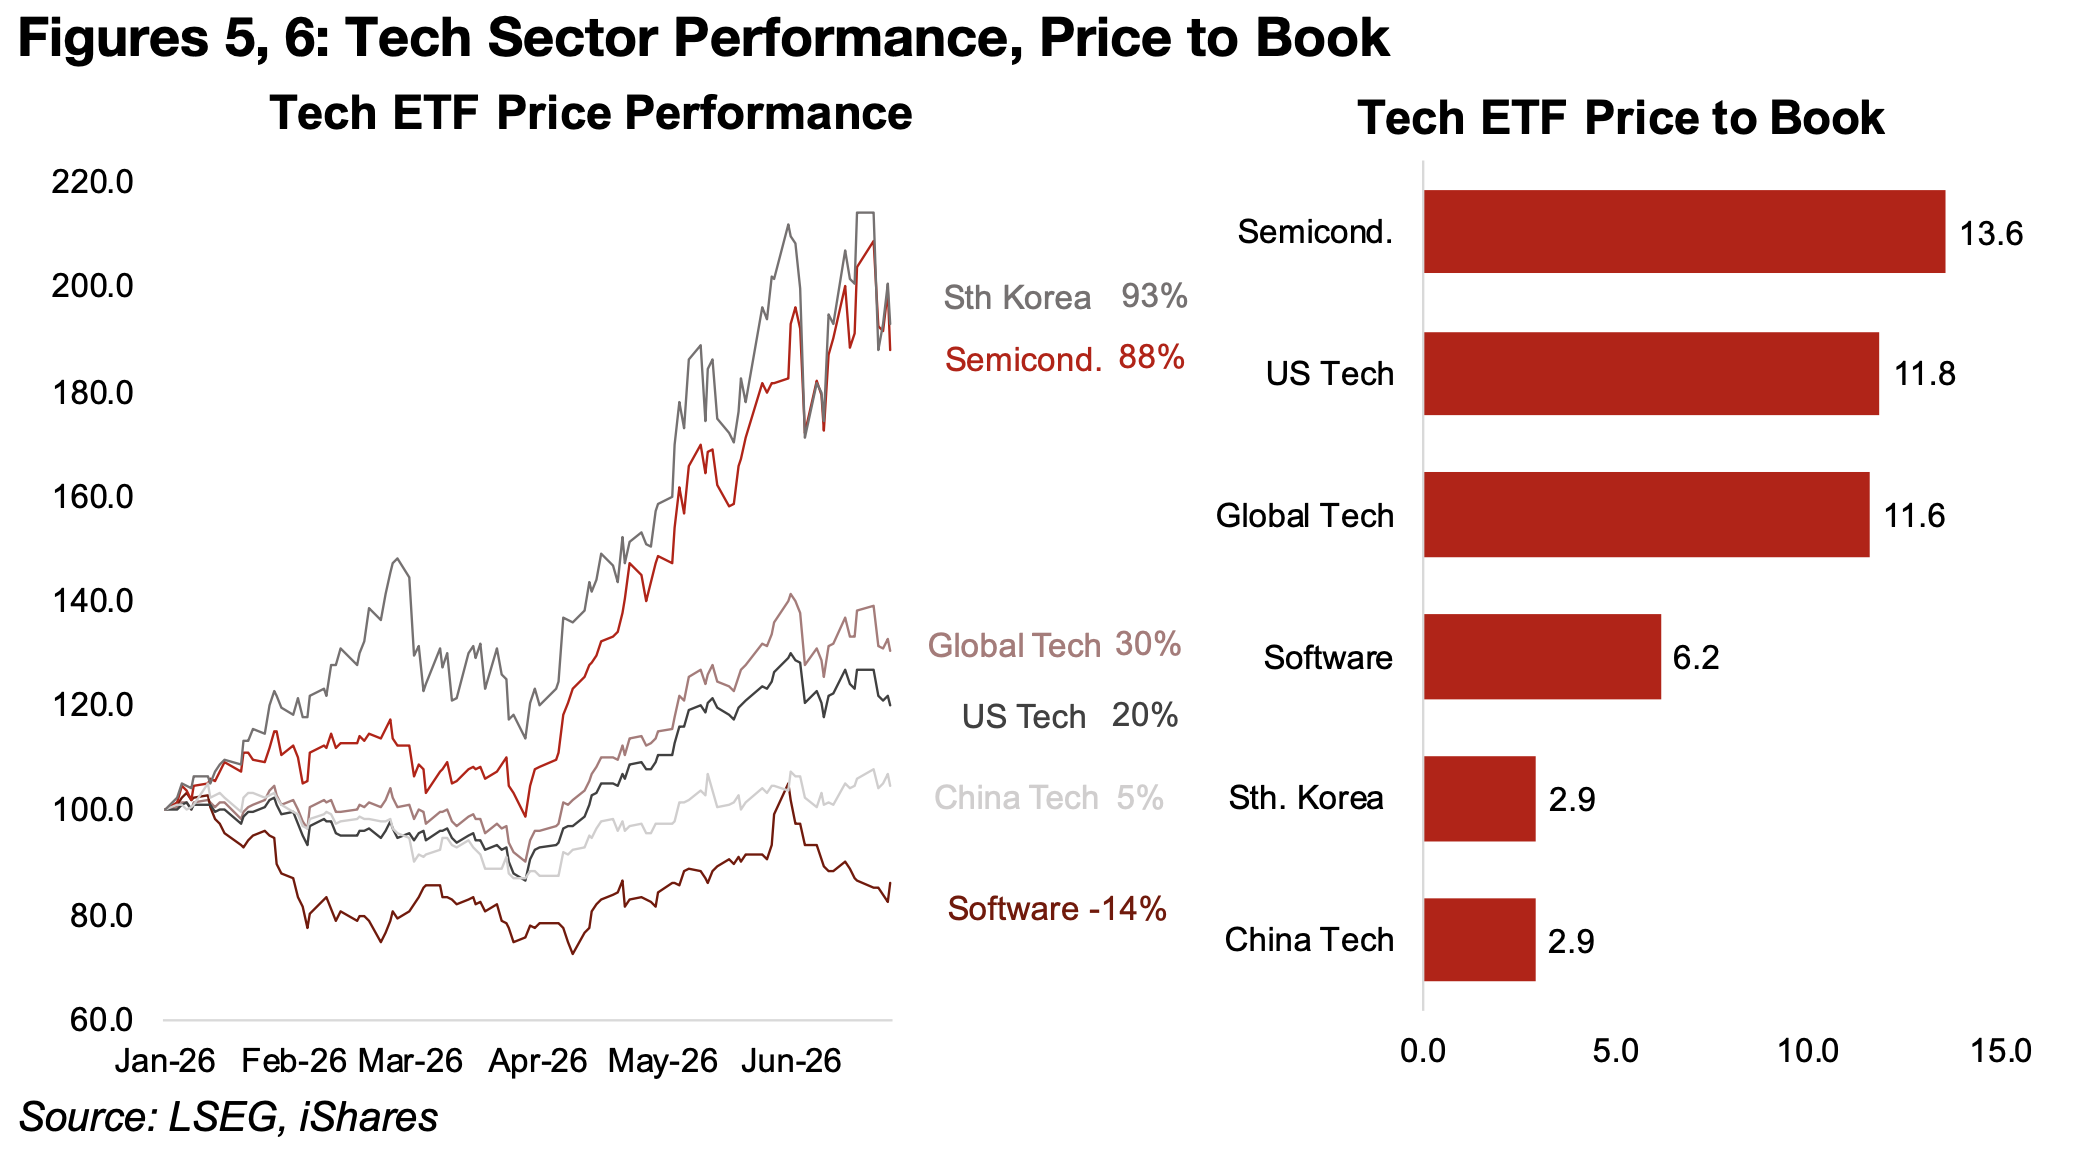
These two companies are over 50% of the country’s market cap, and can therefore
drive major moves in the overall index, and Samsung Electronics dropped -12.2% on
and Hynix -7.5% last week on Monday June 22, 2026. They also have a high
weighting in the global semiconductor index, and the correlation with this sector and
the South Korean market is shown in Figure 5. The immediate driver of the decline
appears to have been market expectations that the companies would announce plans
for huge capital expenditure. While normally this might have been expected to boost
the share prices of the companies, there may be increasing concerns that they will
be able to make sufficient returns on these investments. The decline is therefore a
major warning sign that the market may be losing some confidence in the AI boom,
and that it could be peaking.
Even after the major pullback in both over the past week, the boom this year has still
seen the South Korean index and semiconductor sectors with gains of 93% and 88%
respectively. This could indicate that both may have much further to fall, especially
as the semiconductor sector, in contrast to gold and other mining sectors, does not
appear to have the support of relatively low valuations. Semiconductors have by far
the highest price to book multiple, at 13.6x, of the global tech sector, even ahead of
US tech, at 11.8x, and twice the level of software, at just 6.2x (Figure 6). China tech
is at a far more moderate price to book valuation of just 2.9x, and South Korea also
trades at 2.9x, suggesting the other sectors in the country outside of semiconductors
have quite low multiples. This high multiple does not appear to give semiconductors
much room to disappoint on earnings, and there have already been concerns raised
about the sustainability globally of AI-related earnings growth.
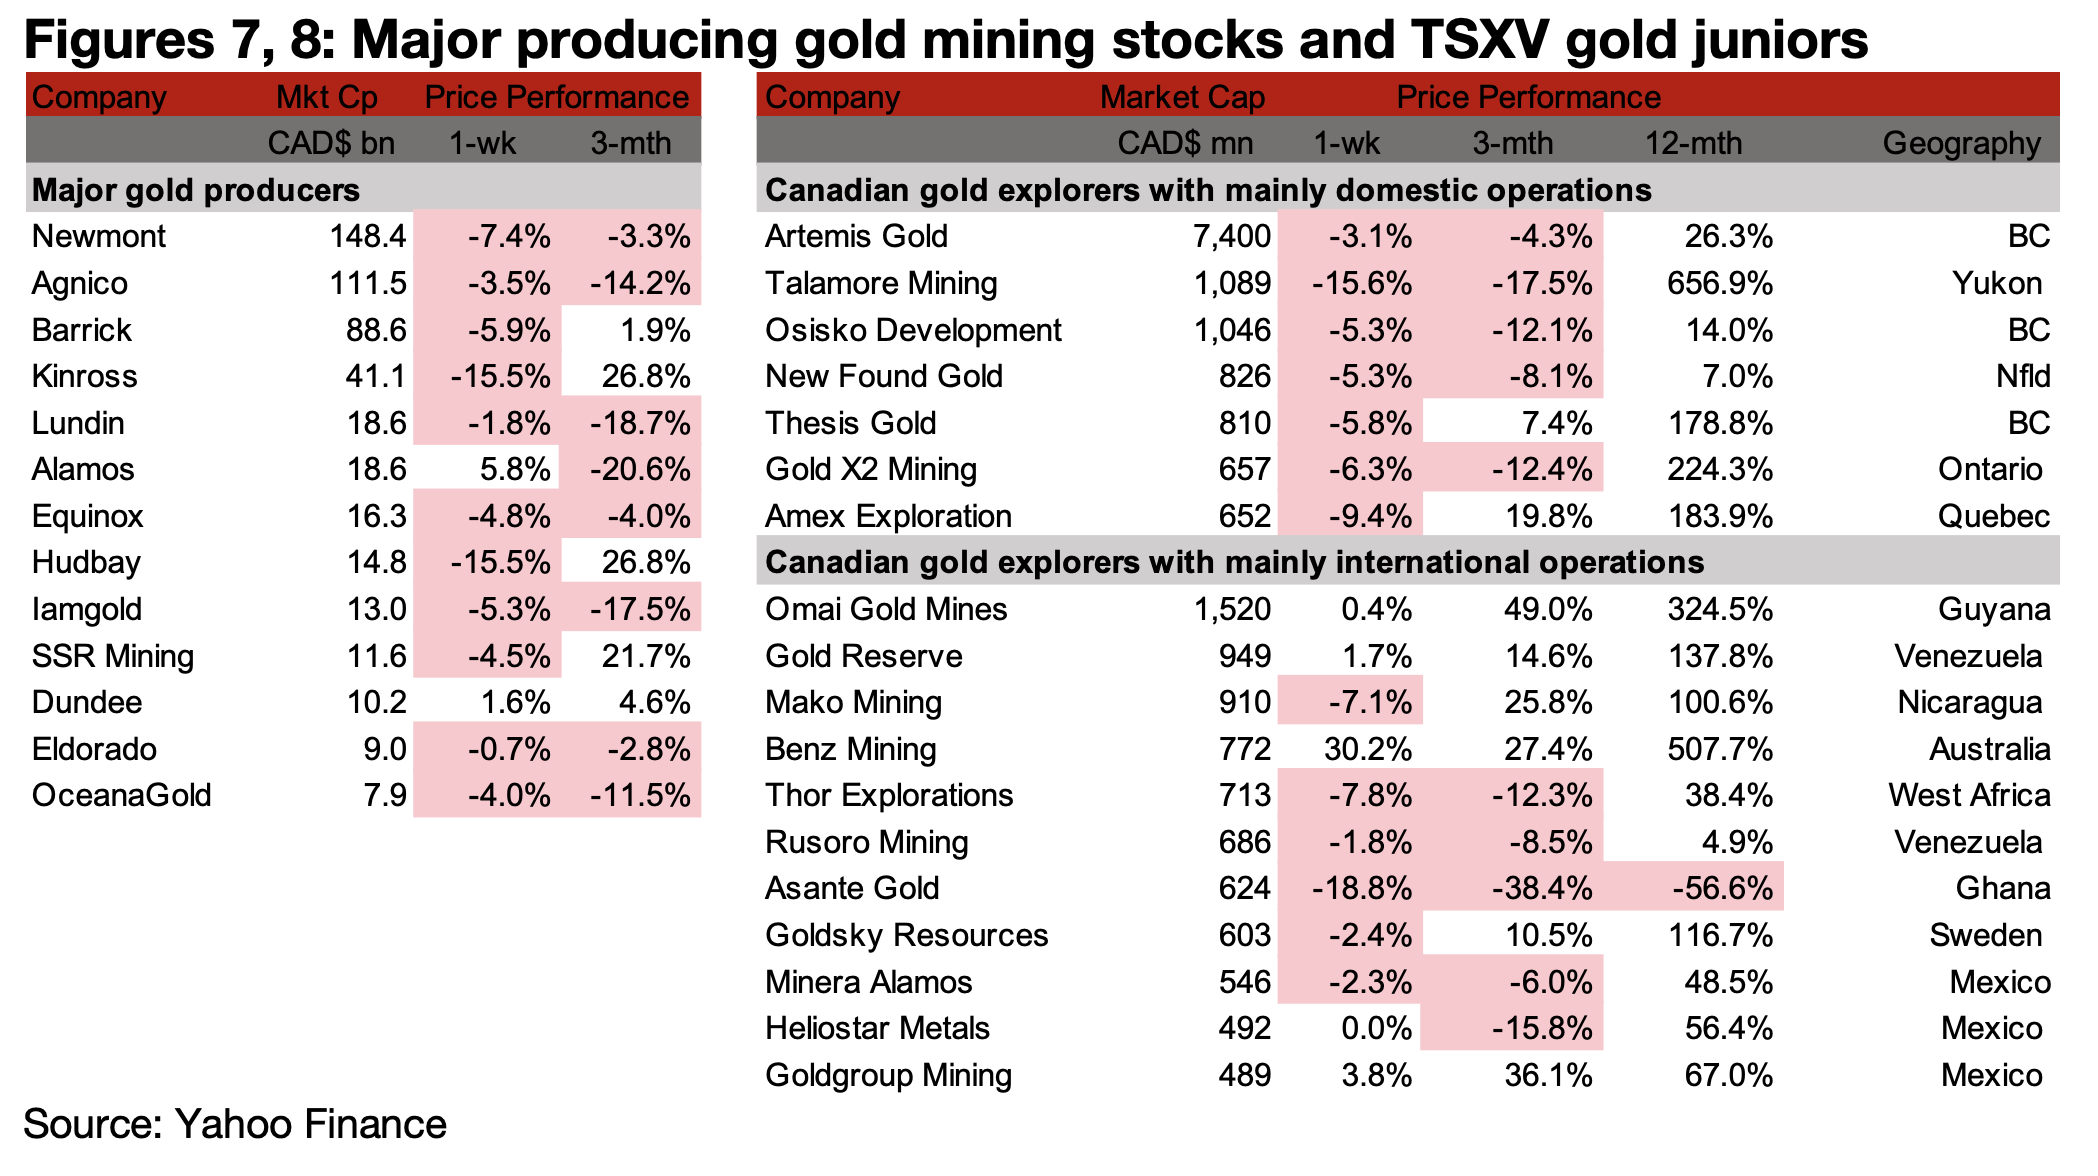
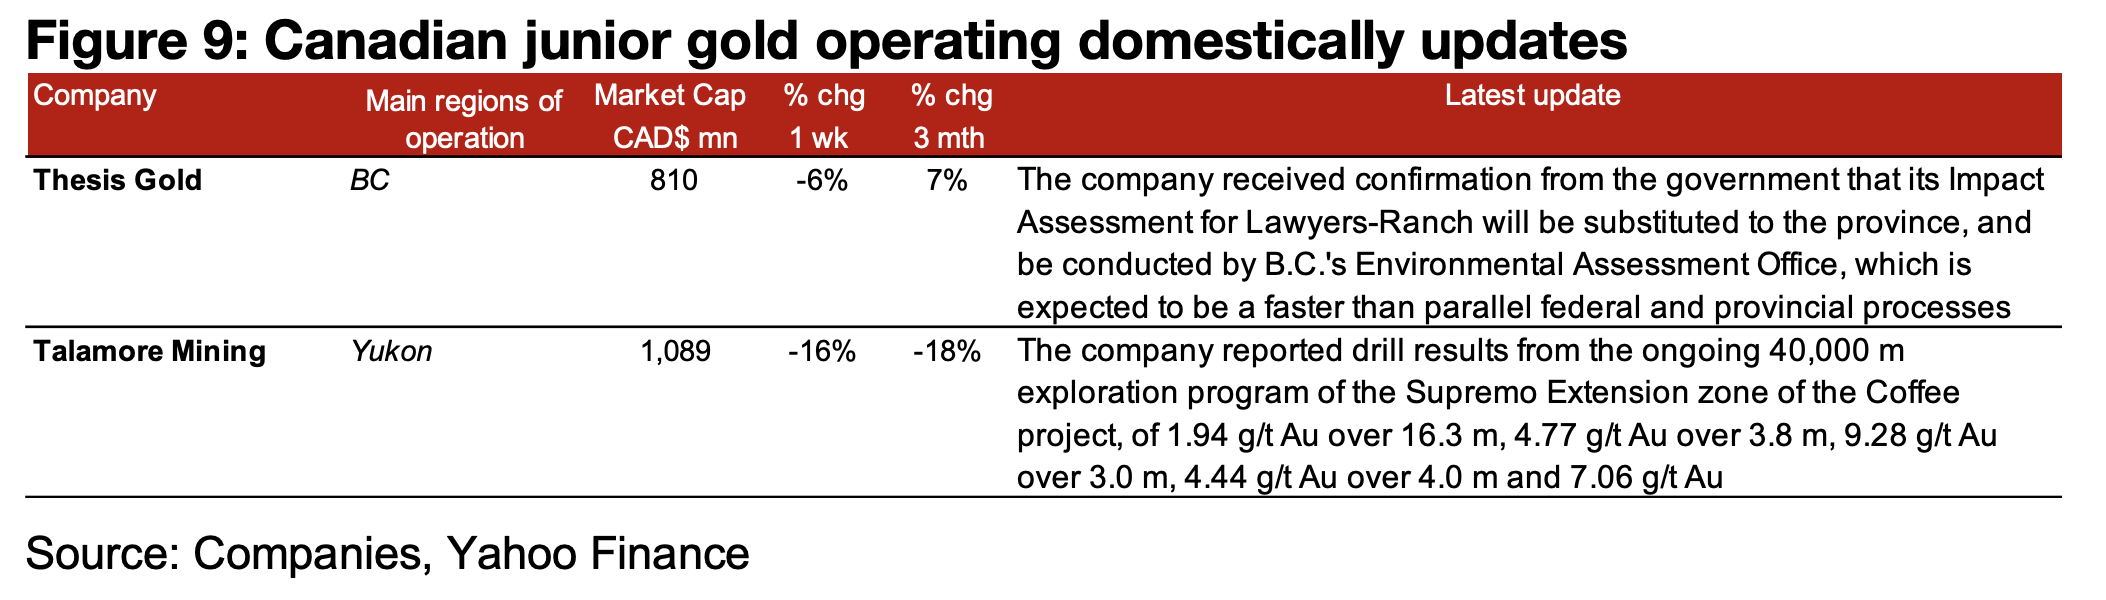
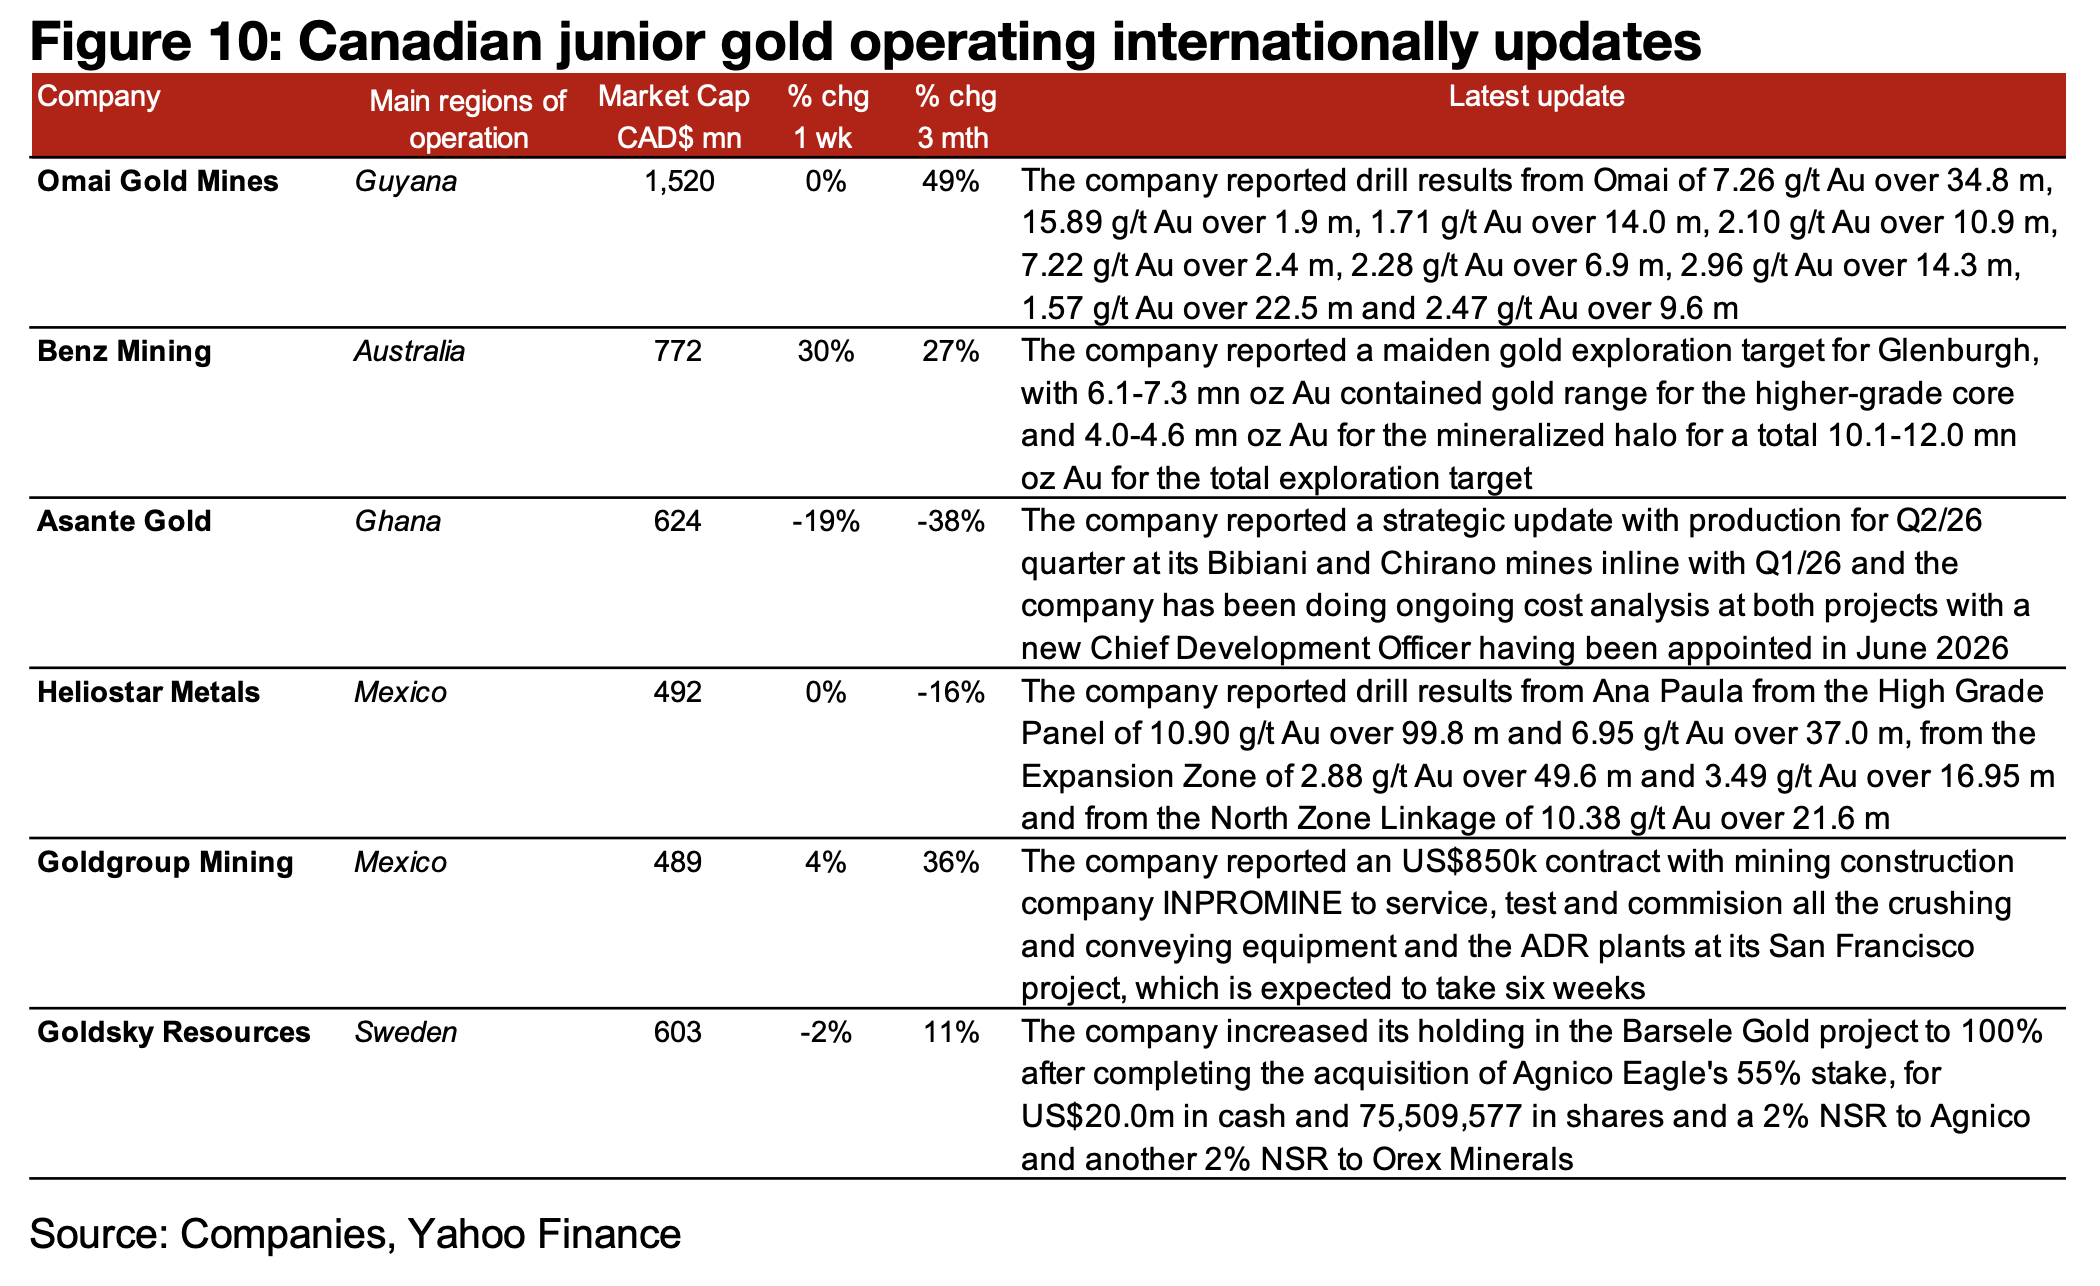
The major producers and TSXV large gold declined on the drop in the metal price (Figures 7, 8) For the TSXV gold companies operating mainly domestically, Thesis Gold reported that its Impact Assessment could be completed more quickly as it would be substituted to the British Columbia provincial level with no parallel federal assessment, and Talamore reported drill results from its exploration program at the Supremo Extension zone of the Coffee project (Figure 9). For the TSXV gold companies operating mainly internationally, Omai reported results from the Omai project, Benz Mining announced a Glenburgh maiden gold exploration target, Asante provided a strategic update on Bibiani and Chirano, Heliostar announced drill results from Ana Paula, Goldgroup reported an US$850k contract for its equipment and ADR plants at San Francisco and Goldsky completed its acquisition of Agnico’s 55% of Barsele, increasing its holding to 100% (Figure 10).
Benz Mining announced a Maiden Exploration Target for its Glenburgh project, which
was apparently viewed favourably by the market, as its share price rose 30.2% for
the week, far outpacing the significant declines for most of the stocks in the sector.
This is not the Mineral Resource Estimate (MRE) that is typically released by miners
for their projects, with the Maiden Exploration Target indicating considerably less
stringent criteria for the classification. The sector has regulatory requirements that
such releases be clearly distinguished from full Resource Estimates, and the
company has included a clear Cautionary Statement in the press release, as required.
This notes that the quantity and grade is conceptual, with insufficient drilling
conducted so far for a full Resource Estimate.
However, the company does note that the Exploration Target has been supported by
substantial data, with 80% of it drill-defined and assay-supported. Benz Mining
indicates that the additional 20% of the estimate is a more conceptual projection of
the system beyond the current area that has already had significant drilling. However,
the rise in the share price indicates that market overall has quite strong confidence in
this estimate and that it could eventually be converted to Mineral Resource Estimate.
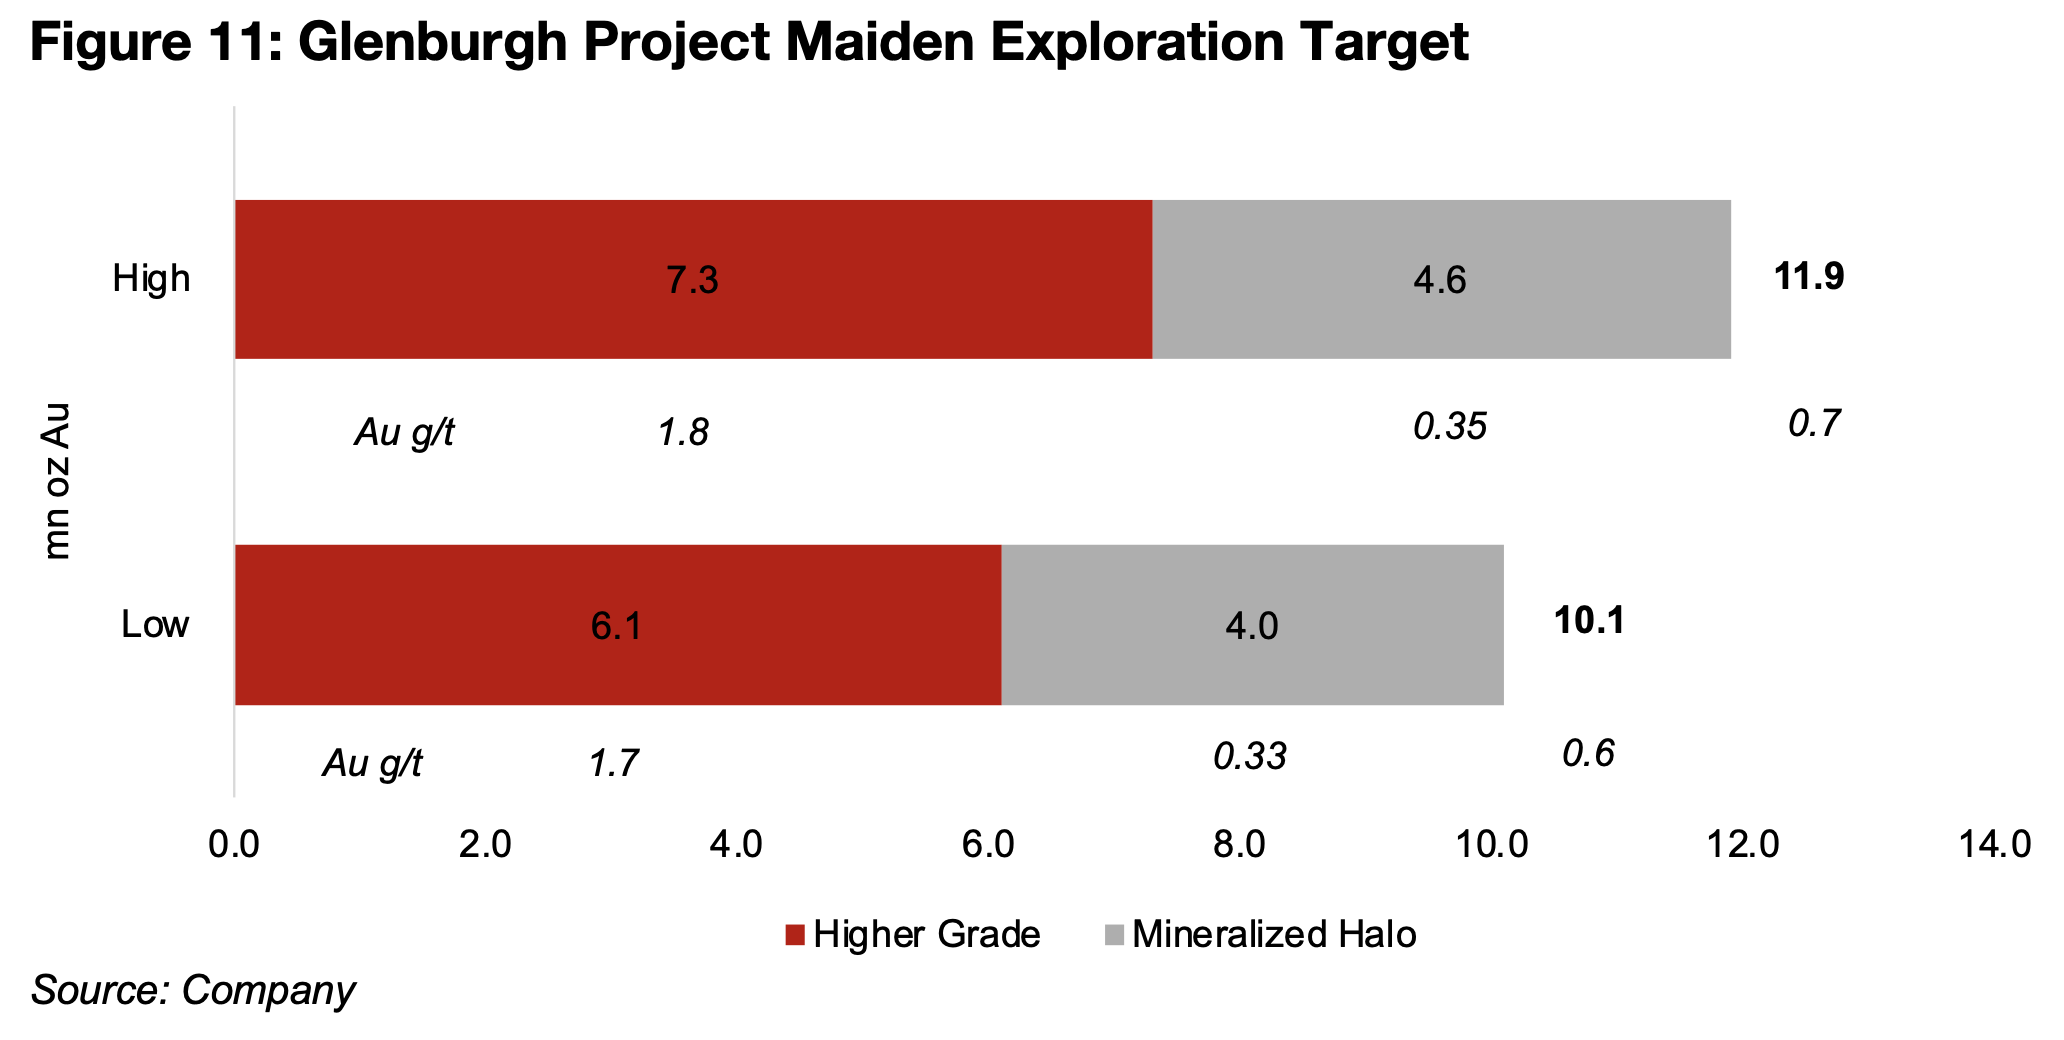
The Maiden Exploration Target indicates two zones, a Higher Grade Zone with a
range of 6.1-7.3mn oz Au, at a grade of 1.7-1.8 g/t Au and a Mineralized Halo of 4.0-
4.6mn oz Au at a grade of 0.33-0.33 g/t Au, with an estimate for the total target
ranging from 10.1k-11.9k oz Au at a grade of 0.6-0.7 g/t Au (Figure 11).
Glenburgh is in Western Australia, with three camps, Hurricane, Icon and Thunderbolt
where Benz has continued drilling in 2026, with a 250k m program planned. The
company has completed much of the permitting process for the project, having
already received the mining lease, clearing permit, water license and native title.
The estimated 11.0mn oz Au would be the largest of the big TSXV gold developers,
even if is reduced significantly for the actual Mineral Resources Estimate (Figure 12),
but has by far the lowest grade of the group (Figure 13). One comparable for the
sector, Osisko Development, has resources of around half this level, at 5.7 mn oz Au,
mainly from Cariboo in British Columbia, but with a small amount of very high-grade
resources from the Trixie Mine, for a reasonably high average grade of 3.56 g/t Au.
Another, Thesis, is just behind this with 5.23 mn oz Au, mainly for its Lawyers-Ranch
project, but also has a relatively low grade of 1.21 g/t Au.
The TSXV gold developers with the next largest resources are about half this level
again, with Amex at 3.27 k oz Au for Perron, but with an extremely high grade of 8.45
g/t Au, leading the group. Minera Alamos has 2.66 k oz Au in Resources over four
main projects, the already producing Pan Mine, Copperstone and Gold Rock, with
production targeted by 2027, and Cerro de Oro which is expected to start operating
by 2028. New Found Gold has 2.63 k oz Au mainly from Queensway, but also the
smaller Hammerdown project, with a grade of 2.62 g/t AuEq, the third highest for the
group.

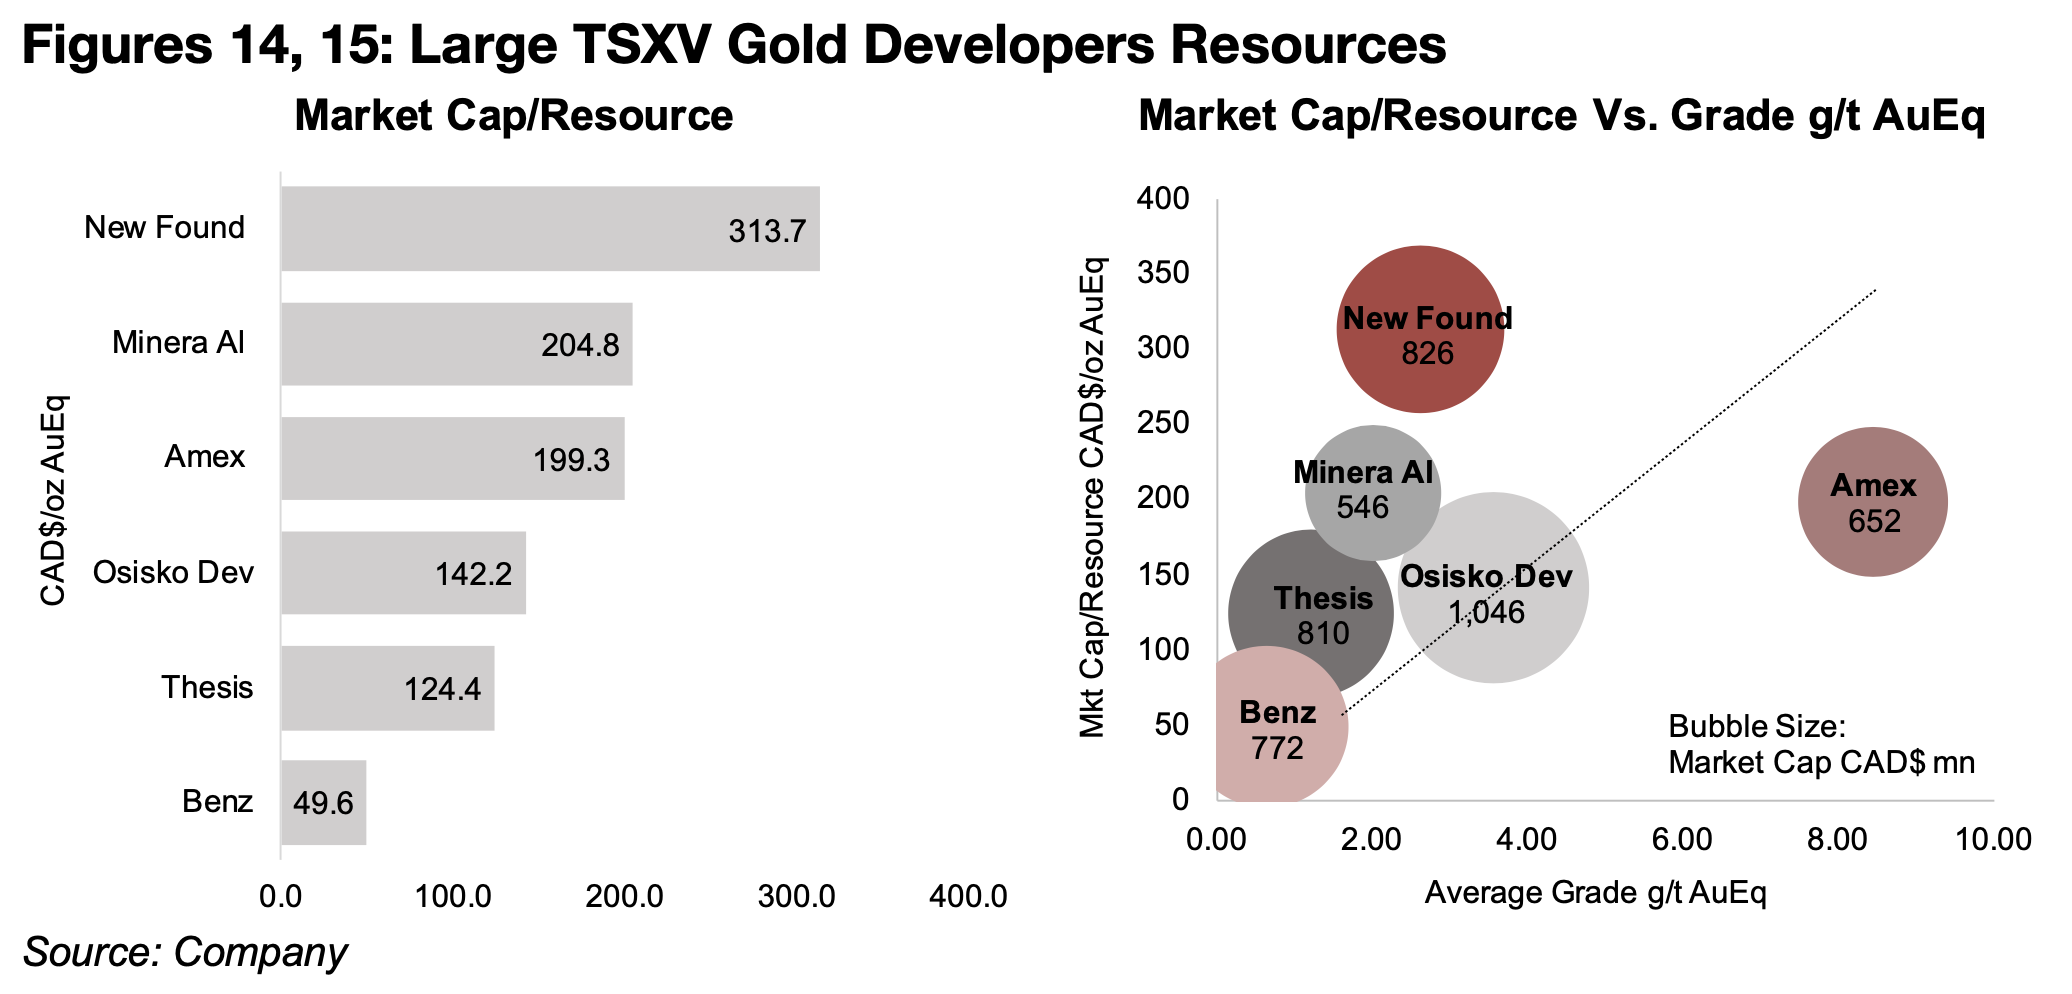
The market is playing the most for New Found Gold of this group in terms of market
cap to resource, at CAD$313.7/oz AuEq, with Minera Alamos and Amex at similar
levels of CAD$204.8/oz and CAD$199.3/oz (Figure 14). Osisko Development and
Thesis both have a considerably lower market cap to resource of CAD$142.2/oz and
CAD$124.4/oz. Benz Mining has by far the lowest market cap/resource at just
CAD$49.6/oz, which will be partly because of the lower confidence in the Mineral
Exploration Target released versus a real Mineral Resource Estimate, but also
because of the low grade of the project.
We would expect that the market will generally pay more for a higher grade, and that
the market cap/resource should rise along with the g/t AuEq. While this is broadly
what we see in Figure 15, there are some major deviations from the market cap
weighted valuation line. This is especially the case for New Found Gold, which is well
above the line, and Amex, which is considerably below. This can be attributed in
some cases to cost differences, which can be seen if a PEA has been released for
the project, with high upfront capital costs or all-in-sustaining cost per ounce
potentially weighing on the valuation.
New Found Gold’s high market cap/resource is likely partly because of its very low
upfront capital costs for Queensway of just US$109mn, with the company having
access to the existing Pine Cove Mill which has greatly reduced upfront costs, and
Hammerdown can also access the mill, giving it a low US$34mn in initial capex. This
compares to Osisko Development’s Cariboo, which has 1.89 mn oz Au in expected
output, only moderately higher than the 1.49 mn oz Au of New Found Gold’s
Queensway, but a far higher initial capex of US$621mn, although the latter’s
sustaining capex is about twice the level of the former, and there is a similar AISC/oz
for both projects.
Disclaimer: This report is for informational use only and should not be used an alternative to the financial and legal advice of a qualified professional in business planning and investment. We do not represent that forecasts in this report will lead to a specific outcome or result, and are not liable in the event of any business action taken in whole or in part as a result of the contents of this report.
Author
Ben McGregor authors the Weekly Roundup at CanadianMiningReport.com, providing sharp analysis of the metals and mining sector. With a talent for spotting trends, Ben distills complex market shifts into clear, engaging insights on TSXV junior miners. His weekly updates cover gold, copper, uranium, and more, blending data-driven perspectives with a knack for identifying opportunities. A vital resource for investors, Ben’s work navigates the dynamic junior mining landscape with precision.