
March 23, 2026
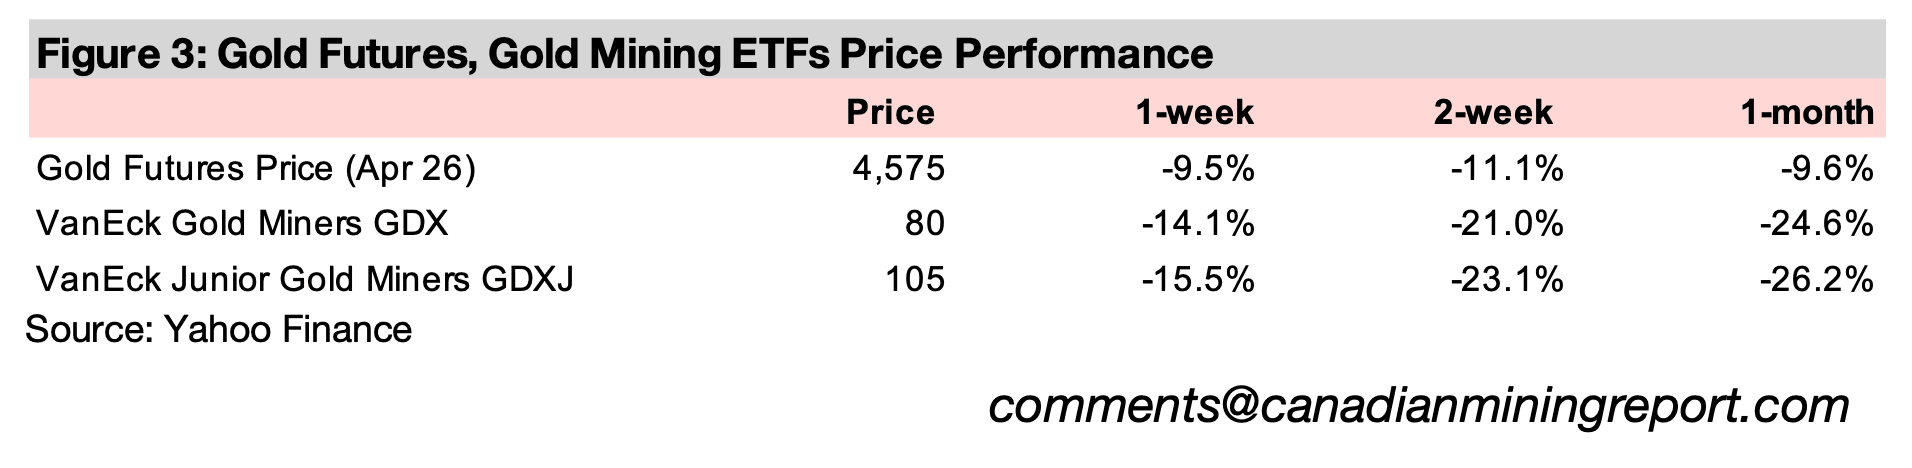
Gold collapsed -9.5% to US$4,575/oz, its worst weekly drop in decades, with the immediate trigger the US Fed holding rates flat and indicating the potential for hikes, although a major factor was also likely rising speculative excesses in recent months.
The Middle East crisis has induced a major rebalancing for the mining sector after a major bull run, with metals and stock ETF prices reverting from major deviations above trend, and several key relative ratios returning towards their averages.
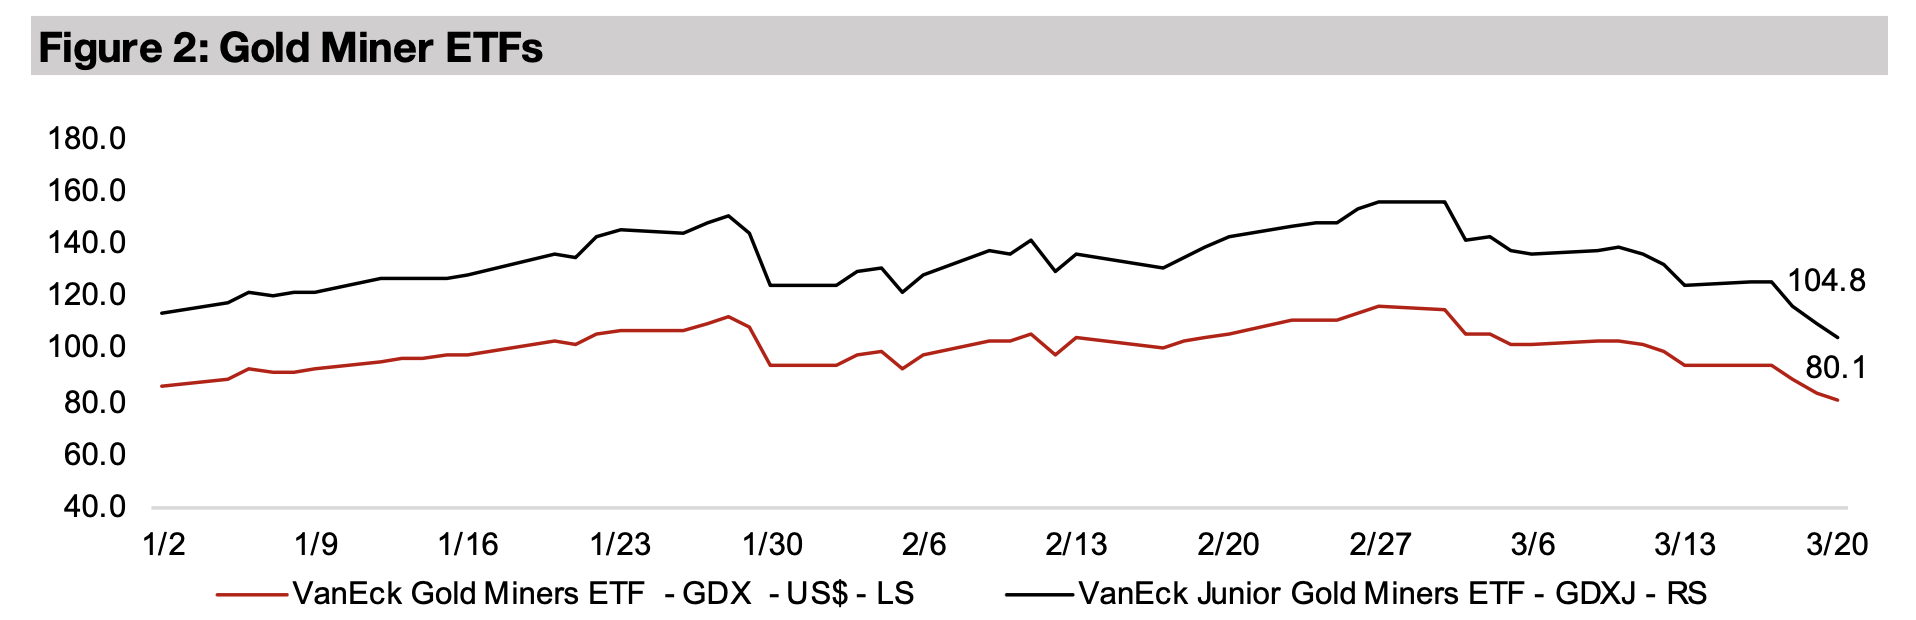
The gold stocks crashed on the plunging metal price, with the GDX down -14.1% and GDXJ off -15.5%, with the two ETFs now down -30.8% and -32.9% off their peaks, far underperforming the slump in equities, with the S&P 500 down -2.5%.


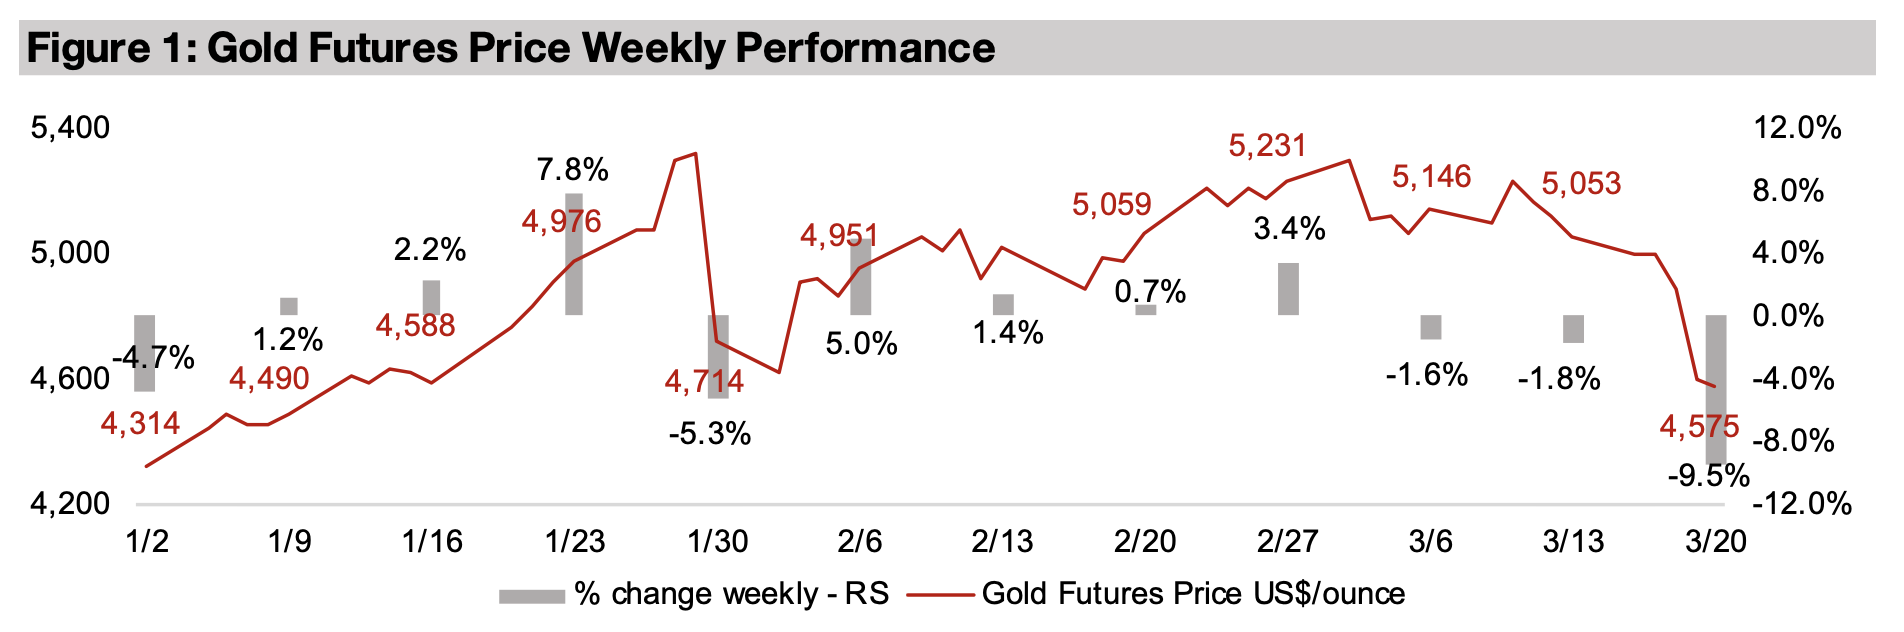
The gold price crashed -9.6% to US$4,575/oz, seeing one of its worst weeks in decades, on a combination of huge geopolitically-induced economic shifts and an extended bull run that had likely seen the build up of some speculative excesses. The major specific trigger this week was the US Fed keeping rates on hold, and indicating even the possibility of hikes if the surge in oil prices boosts inflation. This contrasts significantly with the outlook prior to the Middle East conflict, with further monetary easing from not the just Fed, but most major central banks, generally expected for 2026. As an expansion in the global money supply tends to be the core underlying driver for gold long-term, the potential that this may shift instead into a contraction was a significant enough driver for such a severe drop in the price.
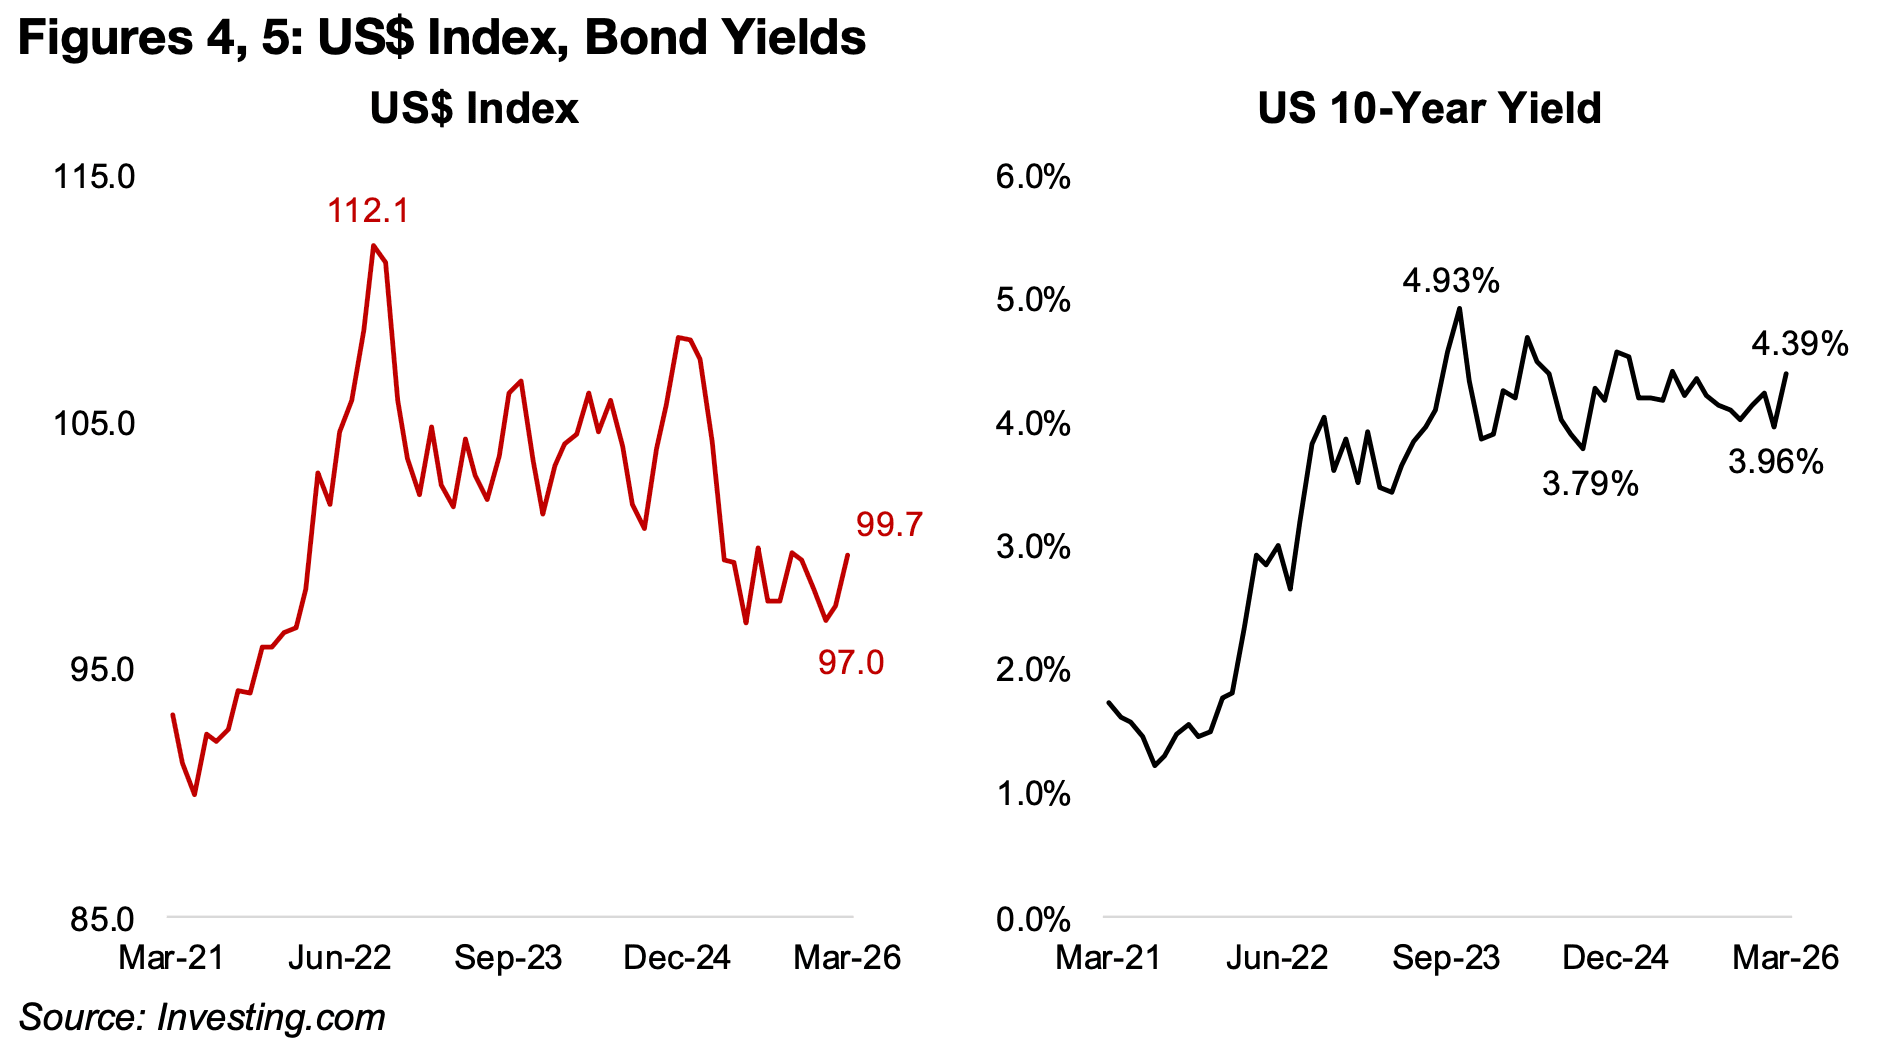
Two other key fundamental drivers, the US$ and yields, have also moved against gold
on the Middle East crisis, with it tending to move inversely to both. The dollar index
has jumped to 99.7 from recent lows of 97.0, with the currency suddenly viewed again
as a safe haven. This role had been questioned in recent years, with some major
trading blocs in emerging markets considering alternatives to the dollar, while the
surge in tariffs had increased global concerns over trading and investment in the U.S.
(Figure 4). However, the conflict in the Middle East has outweighed these issues, with
oil priced in dollars and many major emerging markets huge importers of the fossil
fuel and suddenly needing double the dollars to import the same physical amount of
the good. The U.S. is also a major global oil exporter, and limits on other sources of
supply has driven up demand for the country’s fossil fuels. The potential for rate hikes
could also support the US$ as relatively high yields could draw in fund flows.
The market already seems to be pricing in higher rates, with the nominal US$ 10-year
bond yield jumping to 4.39% from recent lows of 3.96% (Figure 5). With inflation still
low for now, this could also mean that real yields have also risen, which tends to put
pressure on yield-less gold. However, the outlook for real yields over the next few
months remains unclear, as they could actually decline if the spike in inflation
outpacing the increase in nominal interest rates. Overall, with the suddenly increased
risk of a potential monetary contraction, a rising US$ and real yields, at least part of
the recent decline in gold does have some fundamental basis.
As geopolitical risk has also obviously surged on the conflict, and this has been a
major support for gold in recent years, it might have been expected to offset the other
fundamentals factors outlined above to a degree. However, this may have been offset
by another key risk for gold and many other metals, which is a likely major rise in
speculation in the sector over the past six months of the mining bull market. This
trading can often be on margin and unwind rapidly if prices start to pullback. Also,
the broader markets decline can be an issue for the sector, if markets sell off
profitable metals and mining positions to cover leveraged losses in other assets.
There have already been major withdrawals from gold sector ETFs and such an
abrupt slump could dramatically reduce retail interest in the sector, which has been
a huge driver for much of the past year. Another major driver over nearly two decades
has been central bank buying, and while it has still remained relatively strong as of
the most recent data, there has been a recent slowdown. The decline in the price and
surge in geopolitical risk could actually see global central banks increase gold
purchases. However, this is unlikely to be enough to offset the other negative
fundamental drivers, and this could be a major turning point in sector sentiment.
The other precious metals have also continued to come down from highs, being partly
driven by the same monetary factors as gold, but also with industrial drivers, which
are also at risk now given likely reduced expectations for global growth on the crisis.
The silver price has declined -13.5%, the palladium price -17.6%, and platinum -7.0%
over the past month, with only the latter outpacing the -9.4% drop in gold.
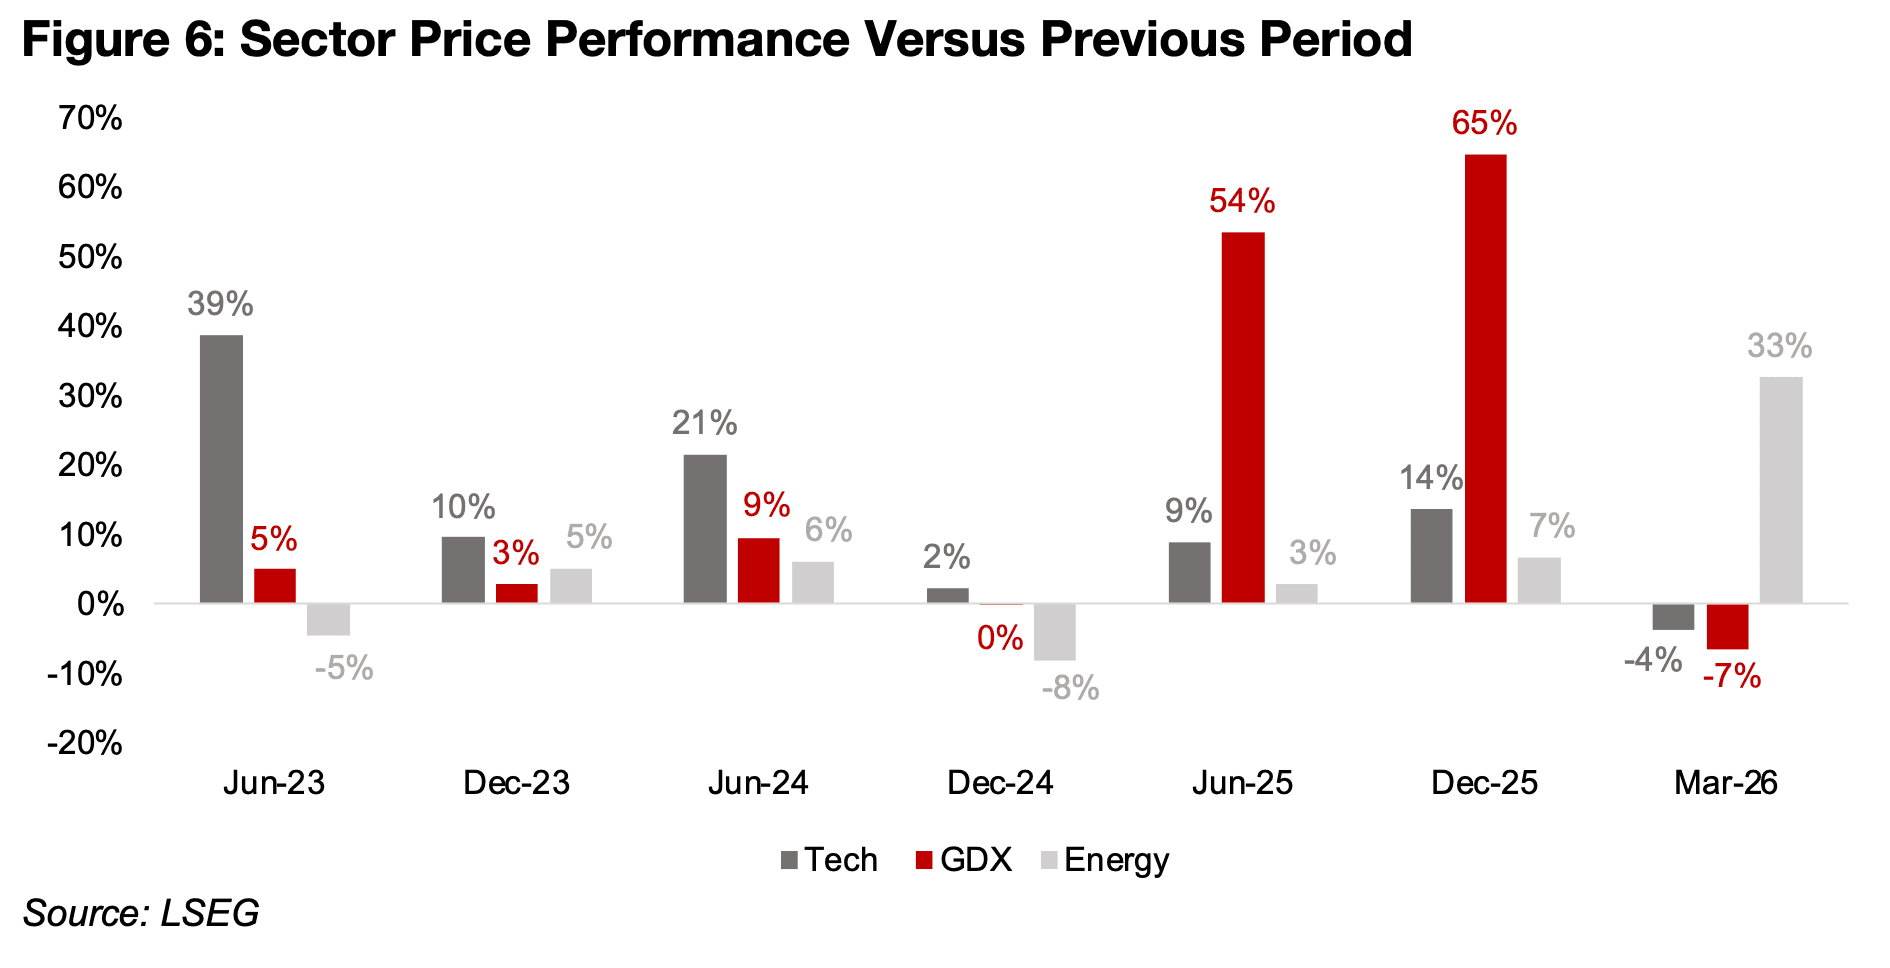
The crisis has catalyzed a considerable sector rebalancing which was already
ongoing to some degree. One major shift has obviously been the major
outperformance of the energy sector, but there has also been an underperformance
of tech for the first time in over two years. The energy sector has risen 33% since the
end of 2025, compared to a -4% drop in tech and -7% in gold stocks. The tech sector
had outperformed both of these sectors significantly through both 2023 and 2024
and was ahead of energy in 2025, although gold stocks saw by far the strongest gains.
This could indicate quite a fundamental shift in the sentiment between sectors, with
the tech boom finally fading, especially given its extremely high multiples.
In contrast, energy, especially fossil fuels, which had fallen out of favor with markets
for many years, is suddenly seeing a dramatic spike in interest and it still has quite
low valuations. For the gold sector, it was also always going to be difficult to surpass
the huge returns of 2025, and the metal price this week has been sharp enough that
it could dampen sentiment significantly. Valuations for the sector have actually
become reasonably expensive over the past few months, barring a further major rise
in the metal price this year, which now seems less likely.
While the fundamental drivers have been key in the gold slump we suspect that it
may have not been so severe without a buildup of likely speculative excesses in
recent months. This major bull run was not only in gold and gold stocks, but most of
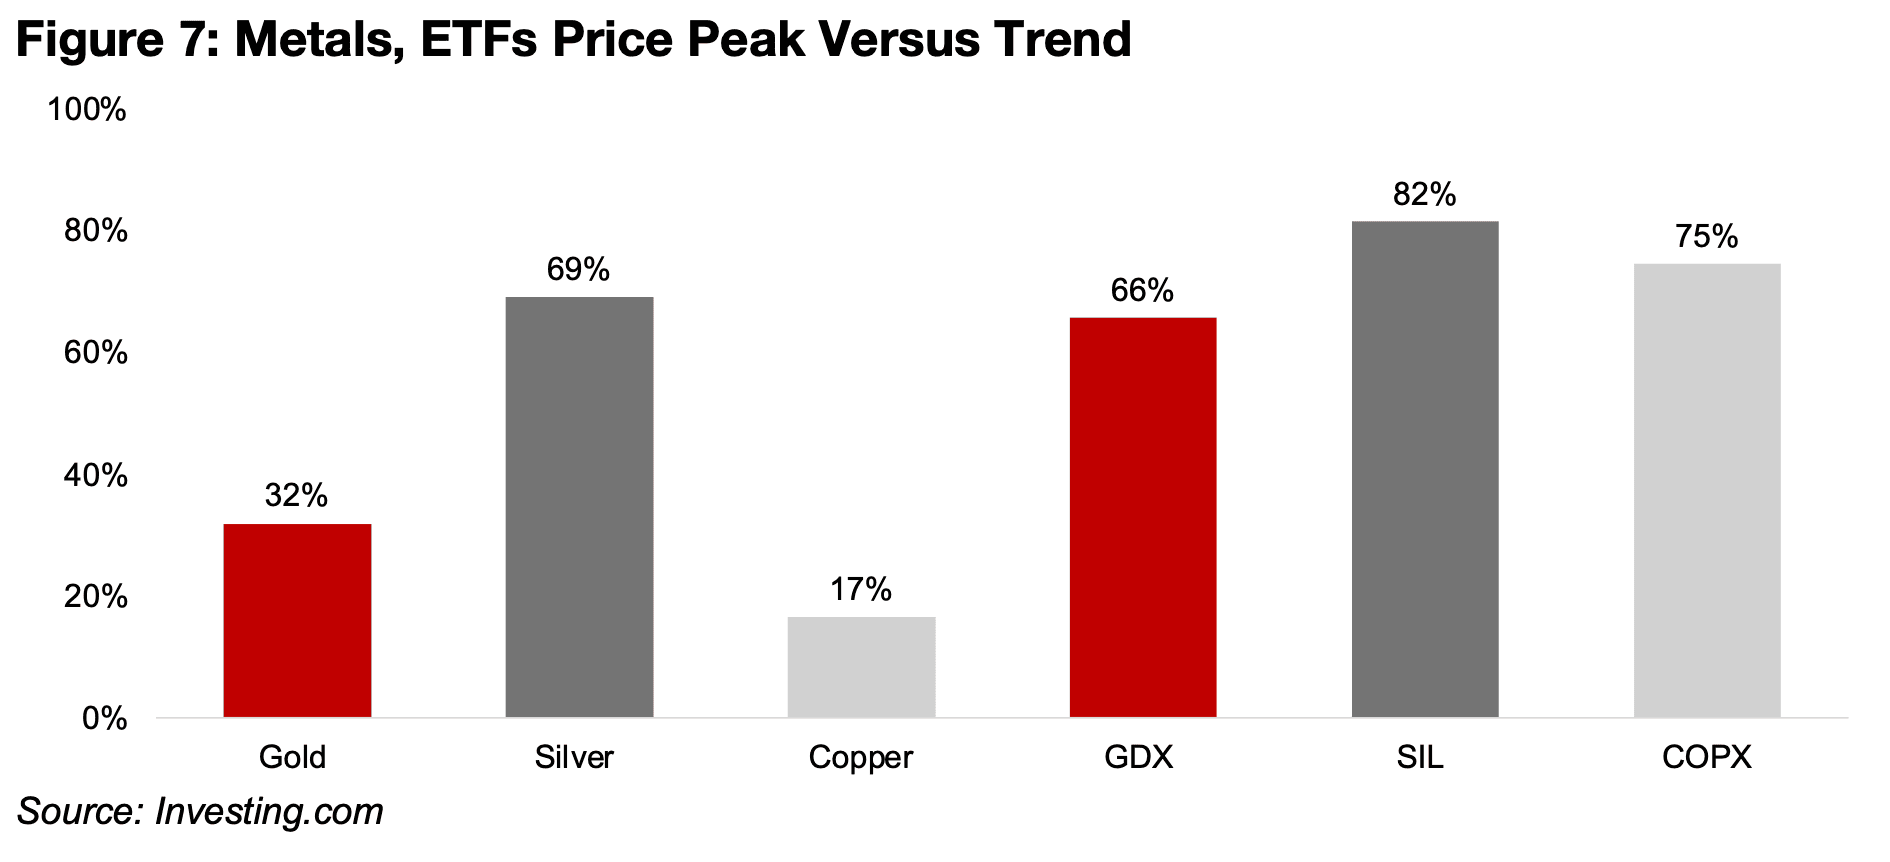
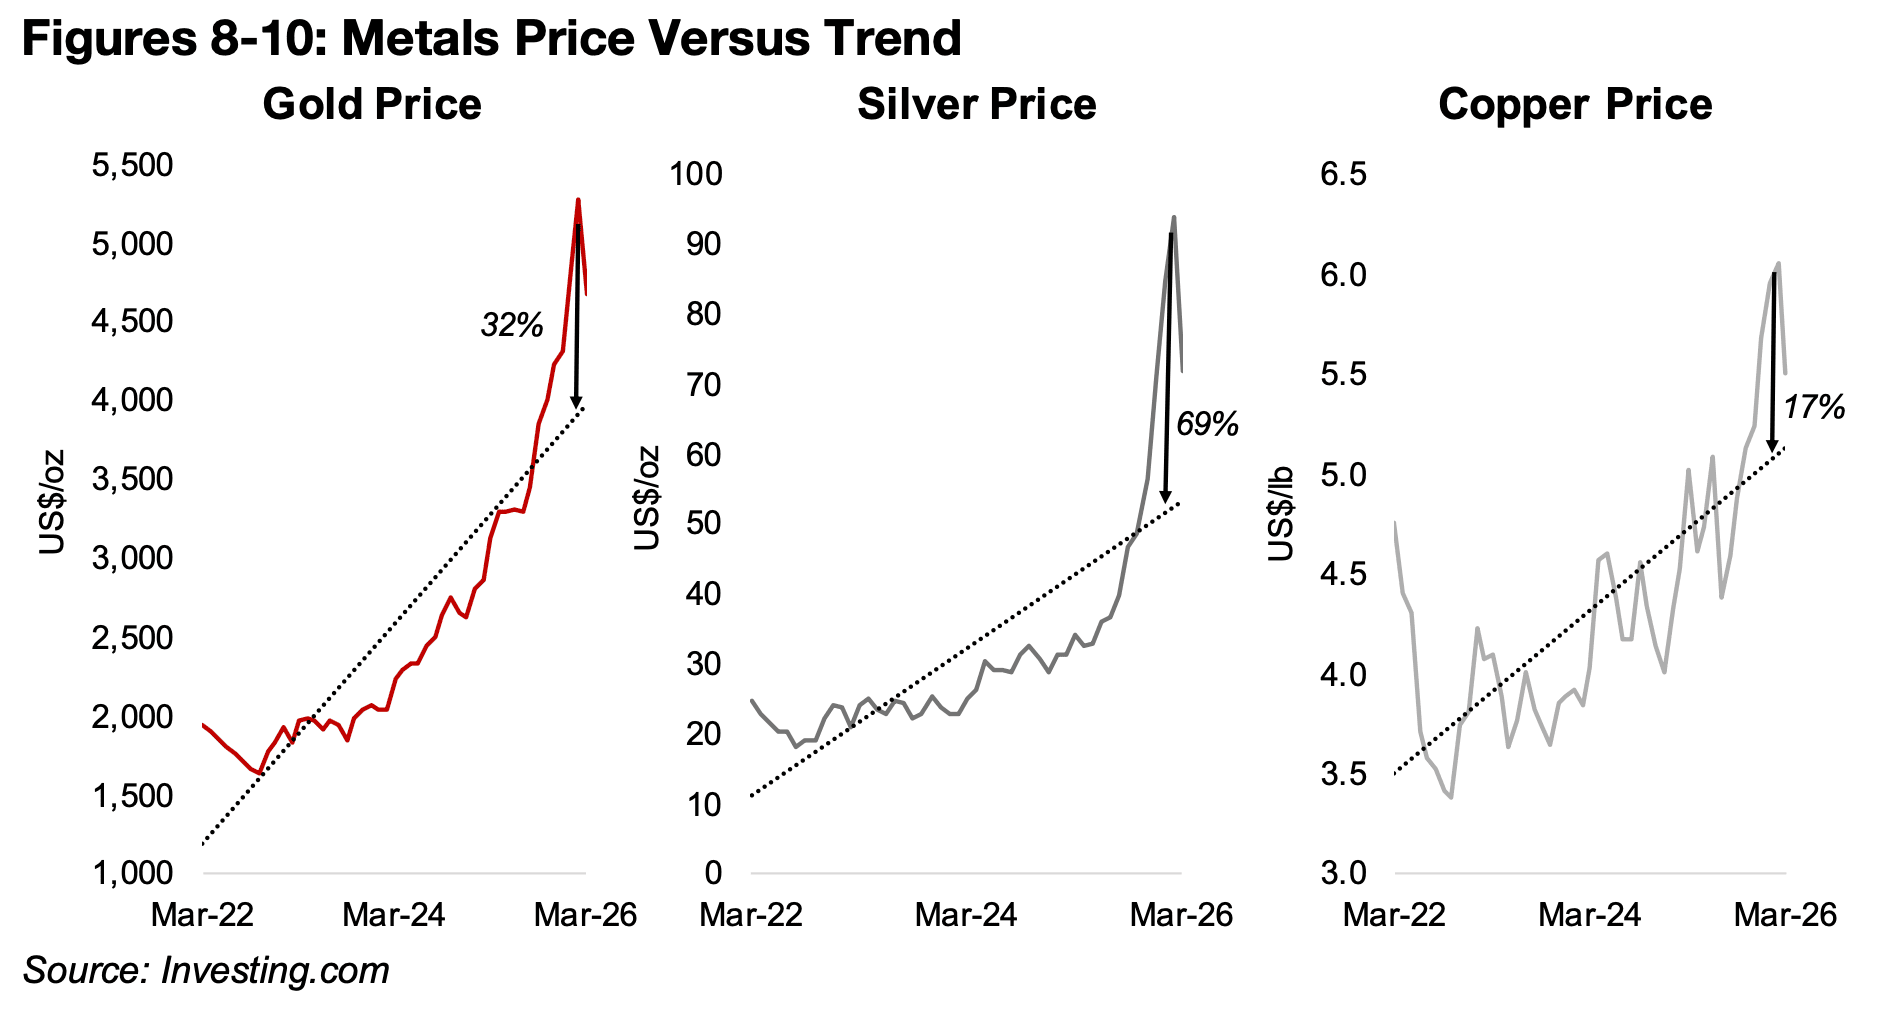
the major metals, especially from H2/25. In Figures 7-13 we show how far gold, silver
and copper and their respective ETFs had moved above their medium-term trends
since March 2022. Figure 7 summarizes the percentage above the trend line that each
of the assets had reached at their recent peaks, with a major gap for the entire group.
For the metals prices, silver had clearly moved the most above the trend, with a gap
of 69% at the peak, compared to 32% for gold and only 17% for copper (Figures 8-
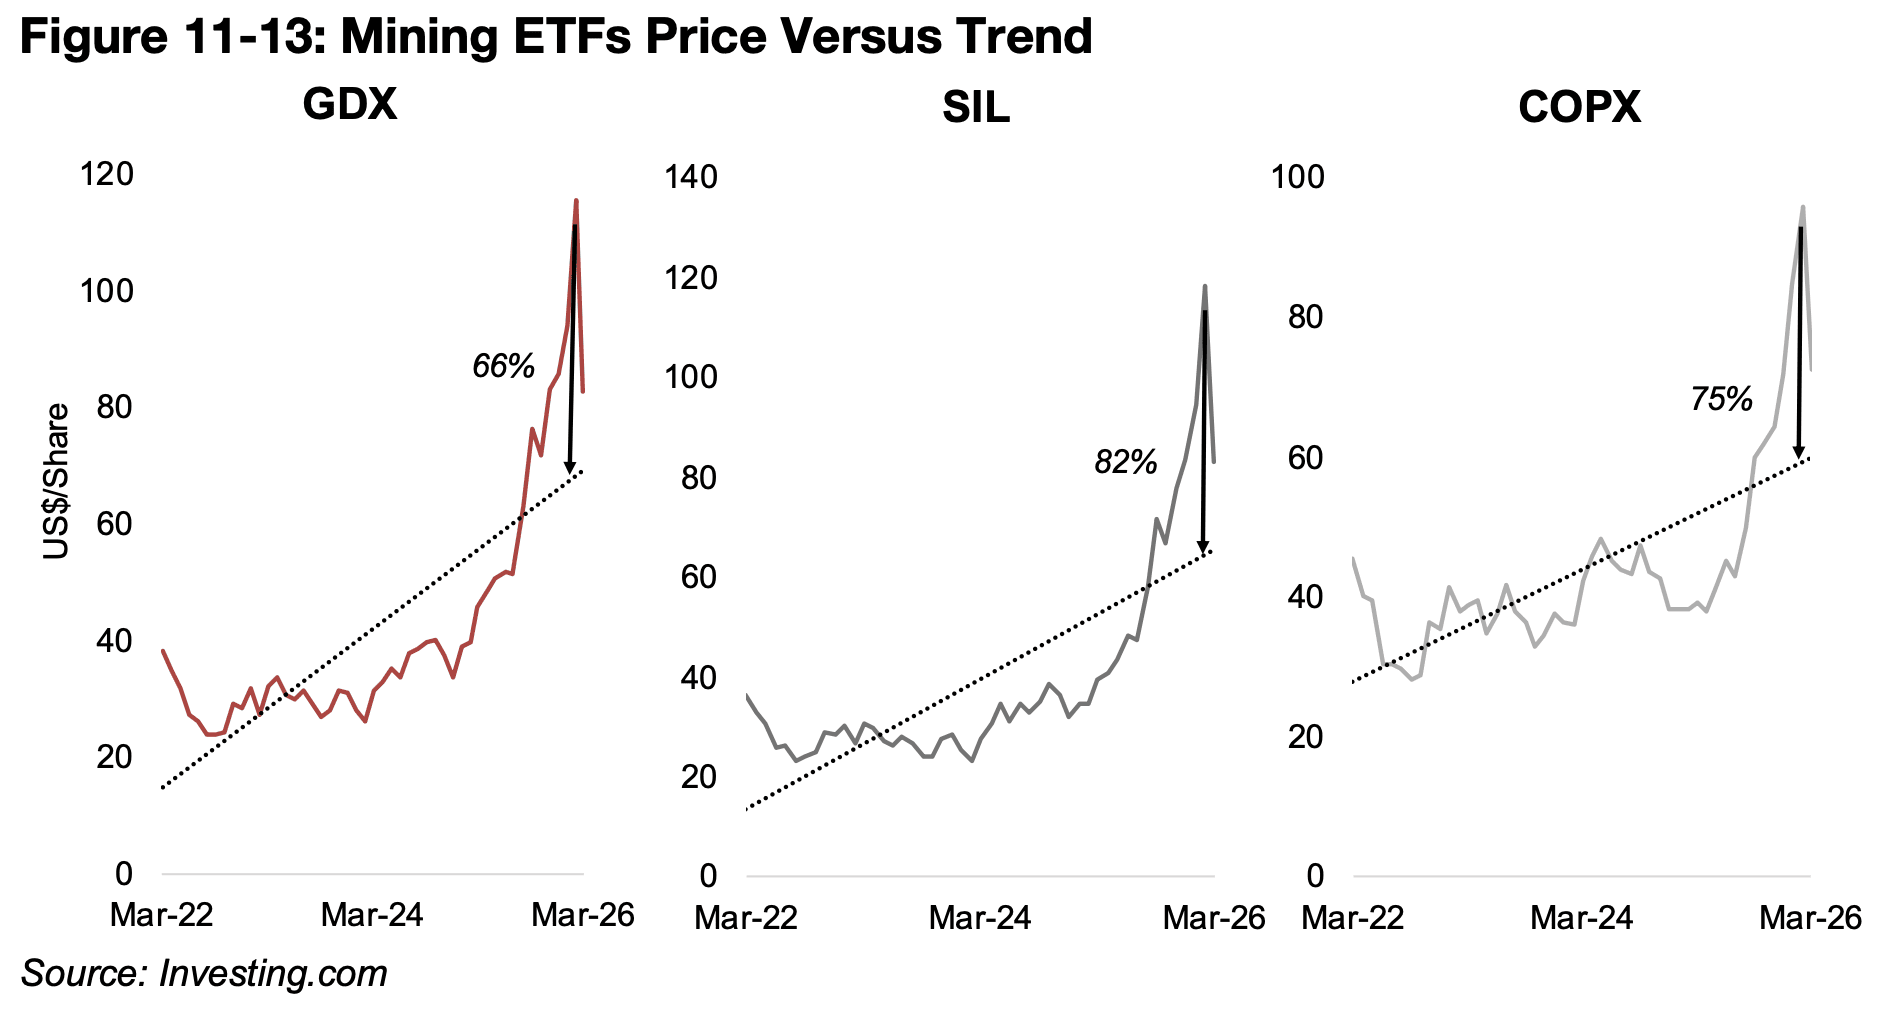
10). With the mining stocks ETFs leveraged to the metals prices, and given the extra
boost from likely increasing speculation in the previously aggressive bull market, they
moved much farther ahead of the trend. The silver sector again saw the highest
excess, with the SIL ETF of silver producers 82% above the trend, although the COPX
ETF of copper producers was close to this level, at 75%, with the spread for the GDX
gold producers at 66% (Figure 11-13). There are actually few pure silver producers,
and much of the revenue from the major stocks in the SIL have a large contribution
from gold, and this likely actually reduced the gap with the trend line.
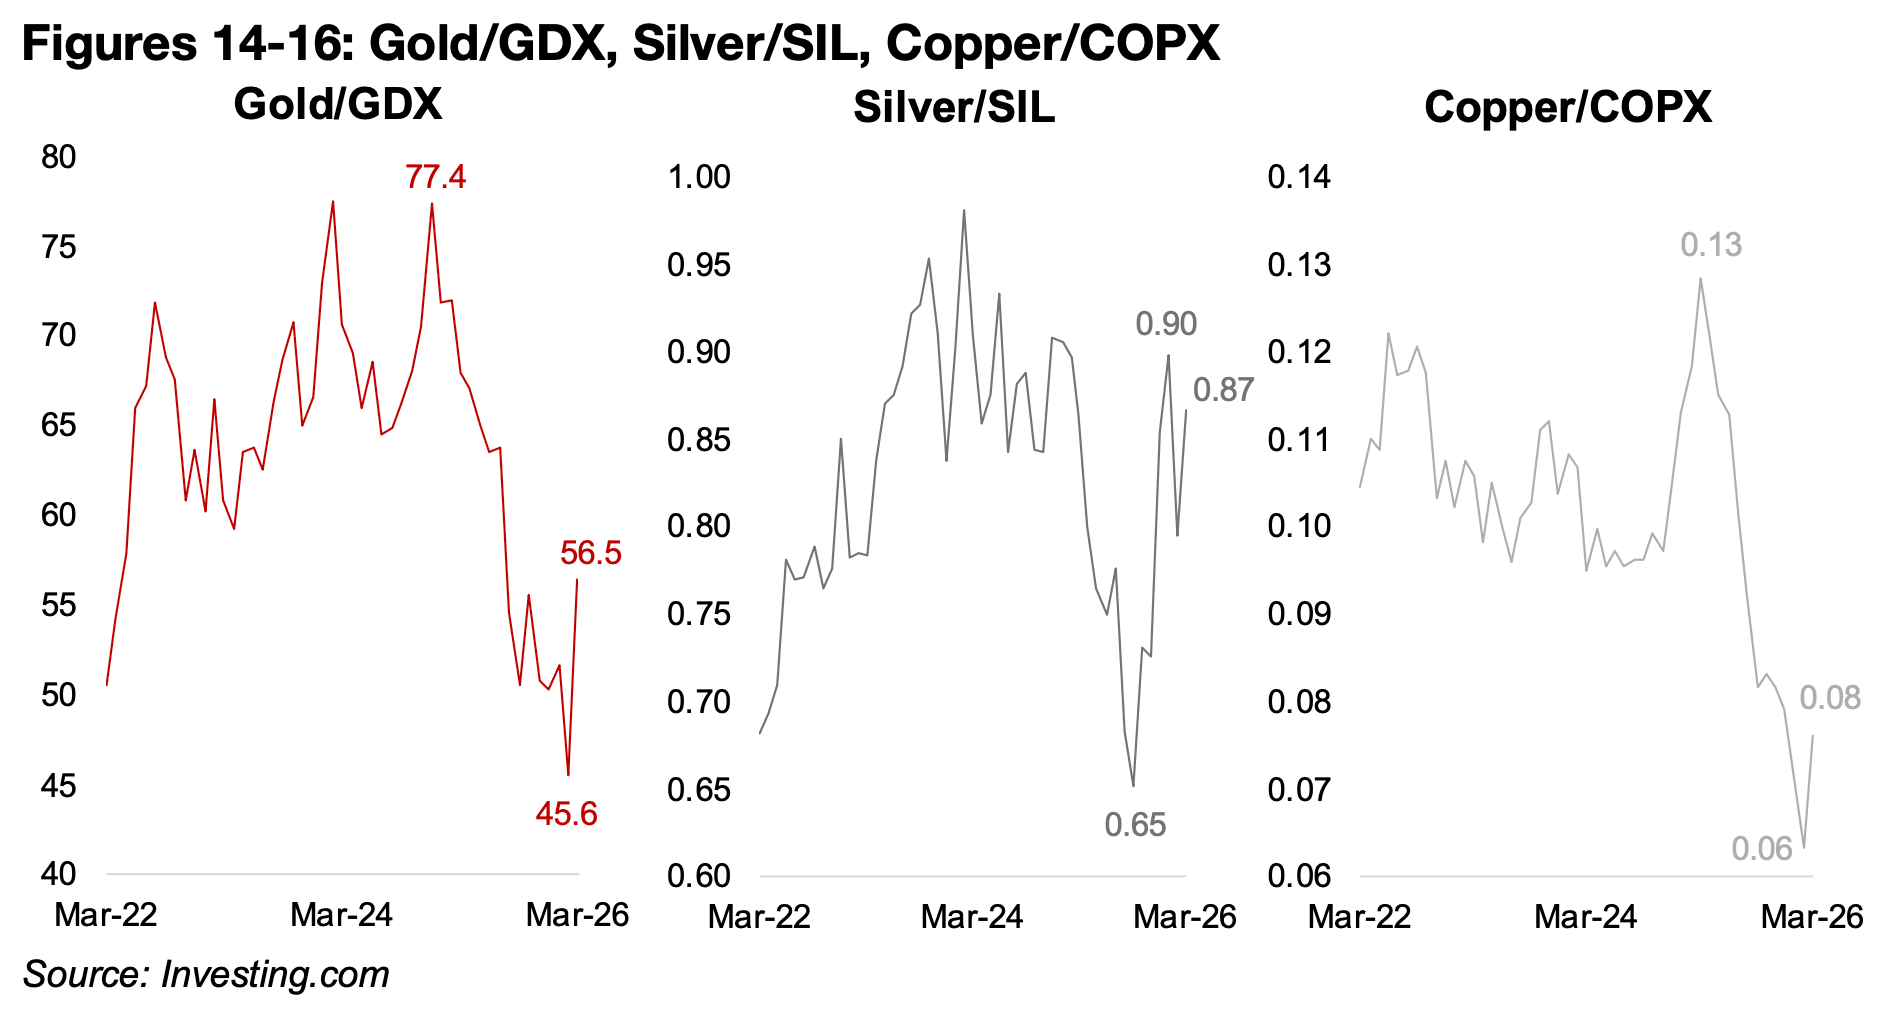
The ratio of the metals to stock ETF prices diverged extremely from 2022-2024 averages in late 2025 and early 2026 with the gold/GDX, silver/SIL and copper/COPX all slumping and only the silver/SIL ratio has returned to back to near its average (Figures 14-16). Another major issue driving the huge mining stock drop beyond the metal price decline has been a sudden pricing in of potentially rising costs on the increase in energy costs. Increases in operating expenses for the sector had been subdued over the past two years and the market certainly did not seem to be expecting a major shock on the cost side in the major bull run from H2/25 through to January 2026.
Further evidence of rising imbalances over the past few months were the gold to silver and copper to aluminum ratios. After gold to silver was range bound around 70.0x90.0x from 2022 to 2024, major distortions occurred in 2025, with a jump to over 100.8 in early 2025 as gold rose but silver lagged, but then it plunged to a low of 56.2x by January 2026 as silver surged (Figure 17). Neither of these moves seemed indicative of a stable situation for metals markets, and silver especially seemed to have an increasingly speculative element, which was exposed by the recent slump.
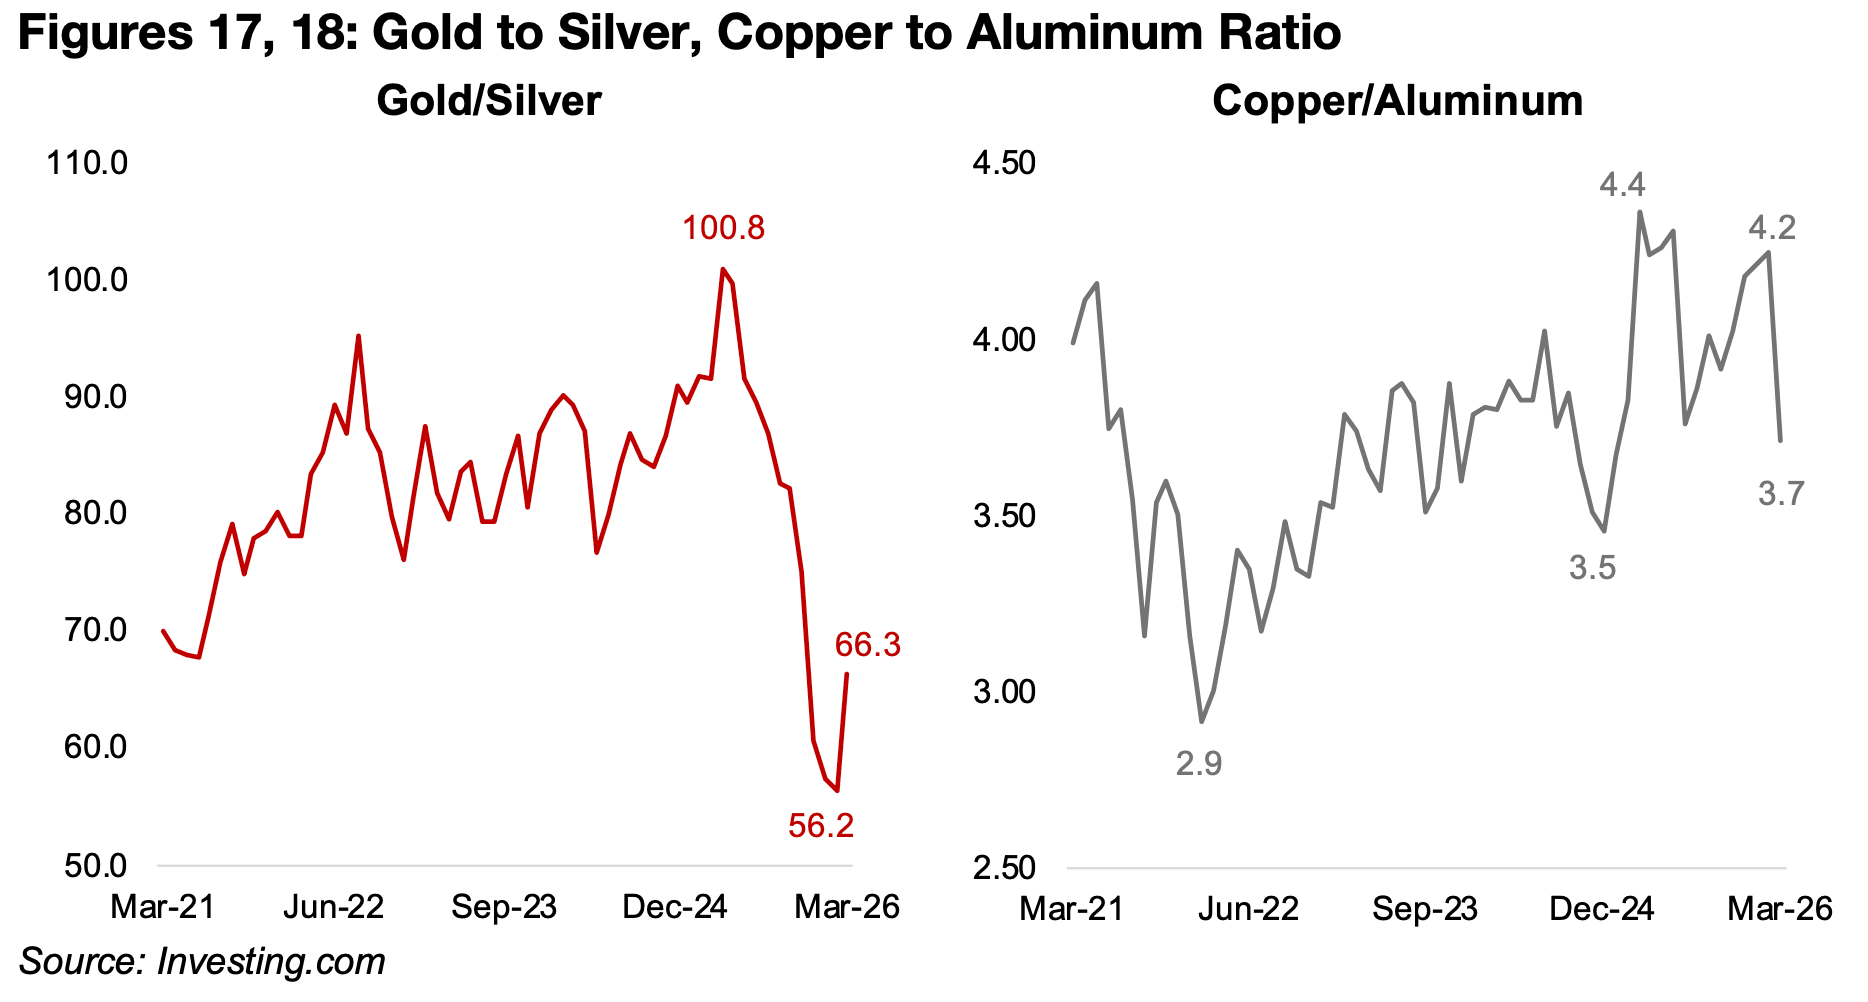
The copper to aluminum ratio had also gotten extremely high in early 2026, up from
lows of 3.5x in December 2024 to over 4.0x twice in 2025 on a spike in the copper
price (Figure 18). The price ratio between these metals will tend to revert to the
average as they can be substituted for industrial use to some degree, and high prices
in one encourages greater use of the other. However, substitution was not actually
the major driver of the plunge in the ratio to 3.7x over the past two weeks. It was
instead a jump in aluminum on the Middle East conflict, with over 5.0% of production
capacity in the region, including, Bahrain and the UAE, which were both under attack.
Beyond the metals sector alone, within the resources sector overall there had also
been a major imbalance, with the gold to oil ratio becoming extremely high, reaching
at its peak nearly 90.0x, nearly three times the five-year average of around 30.0x.
However, with the surge in the oil price over the past weeks and now the plunge in
gold, this ratio has come down by more than half and is heading for the recent
average. Historically large deviation in the gold to oil ratio from the average have often
been corrected by major oil shocks.
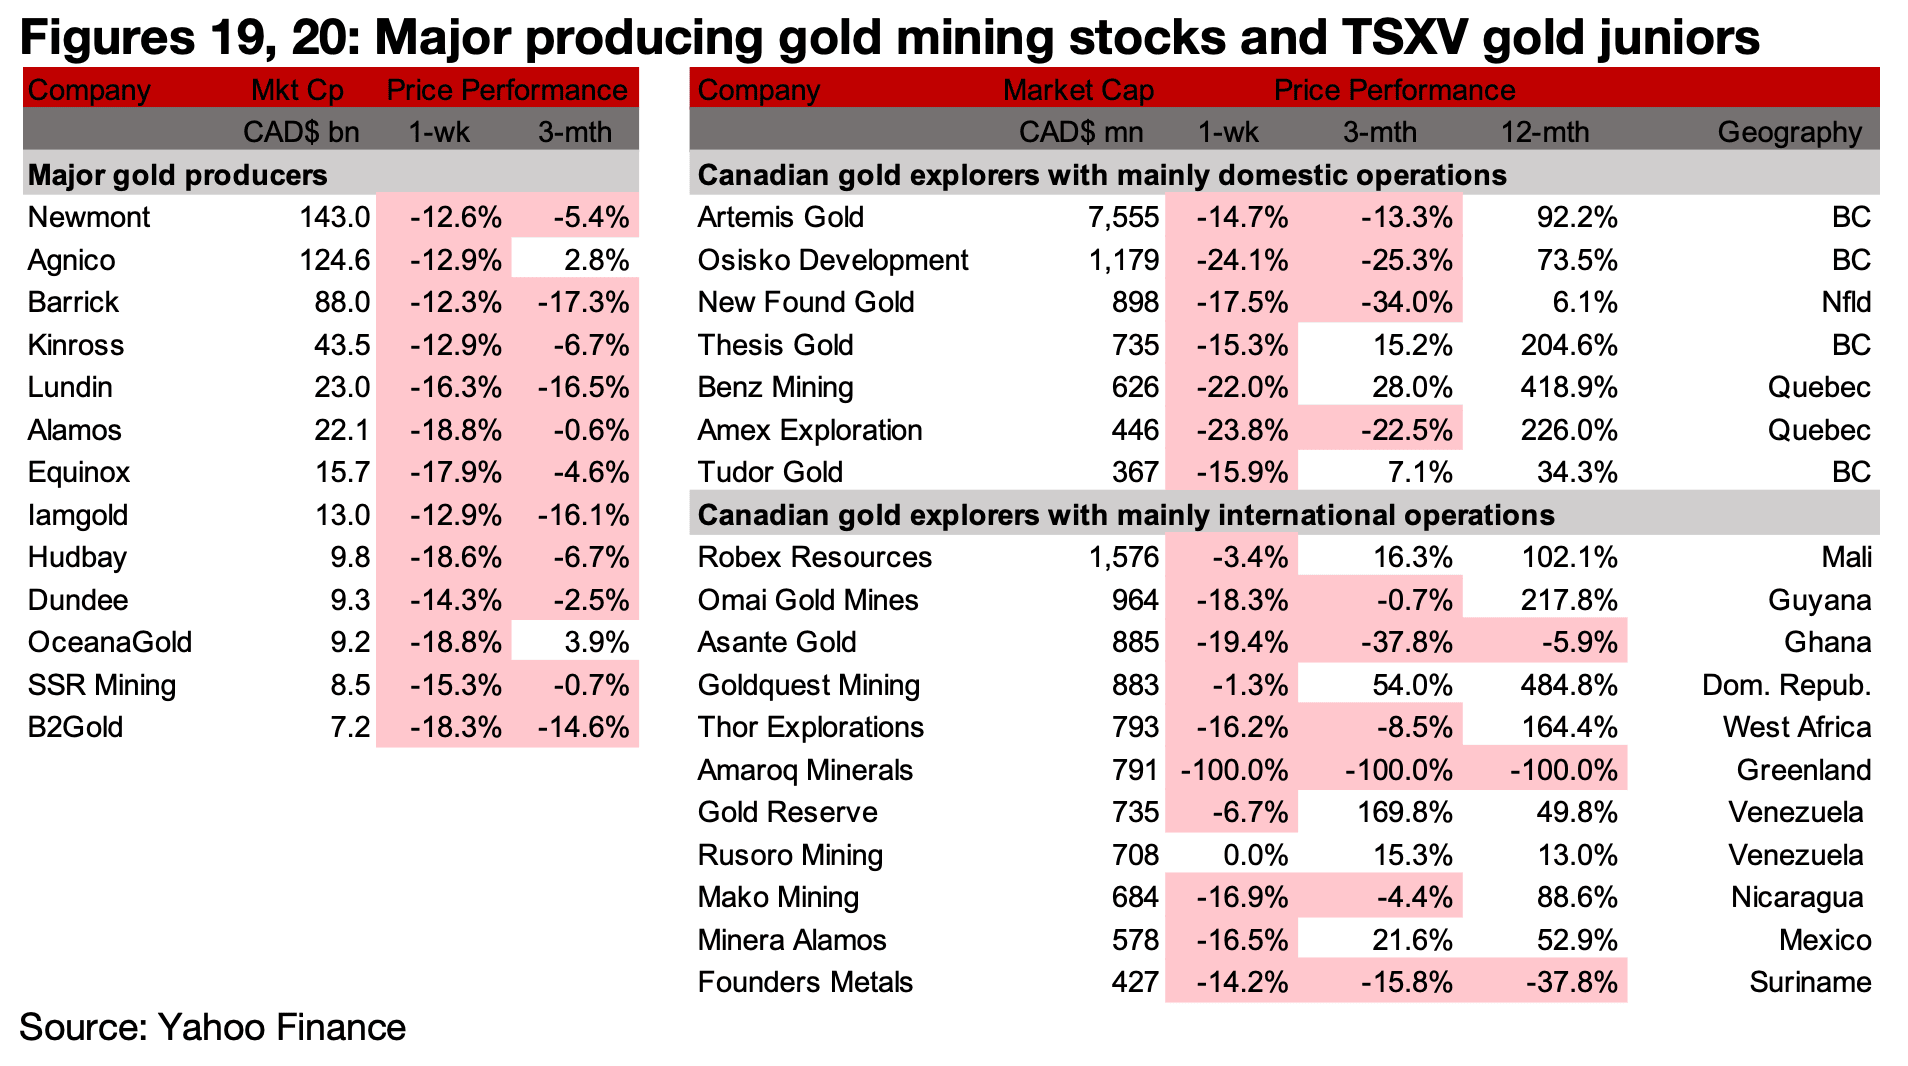
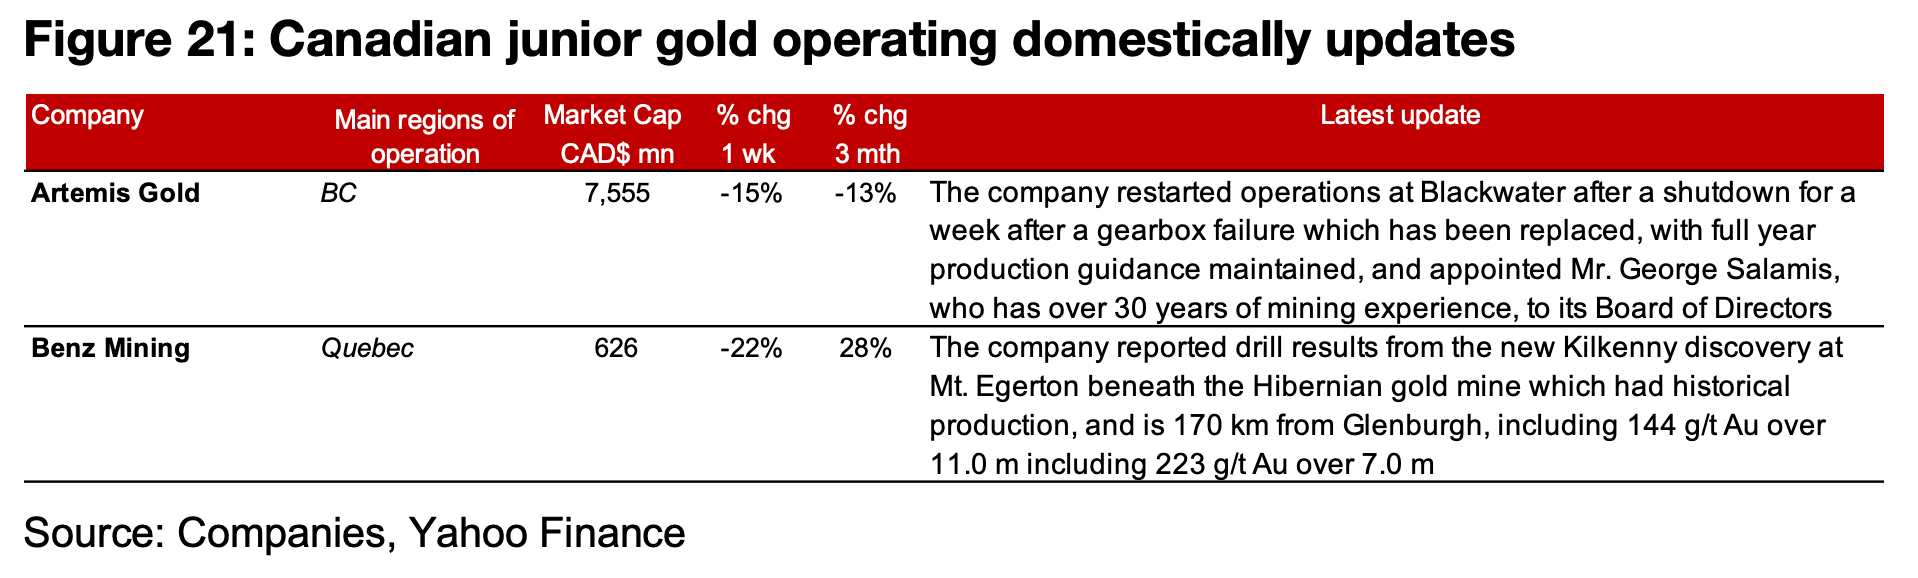
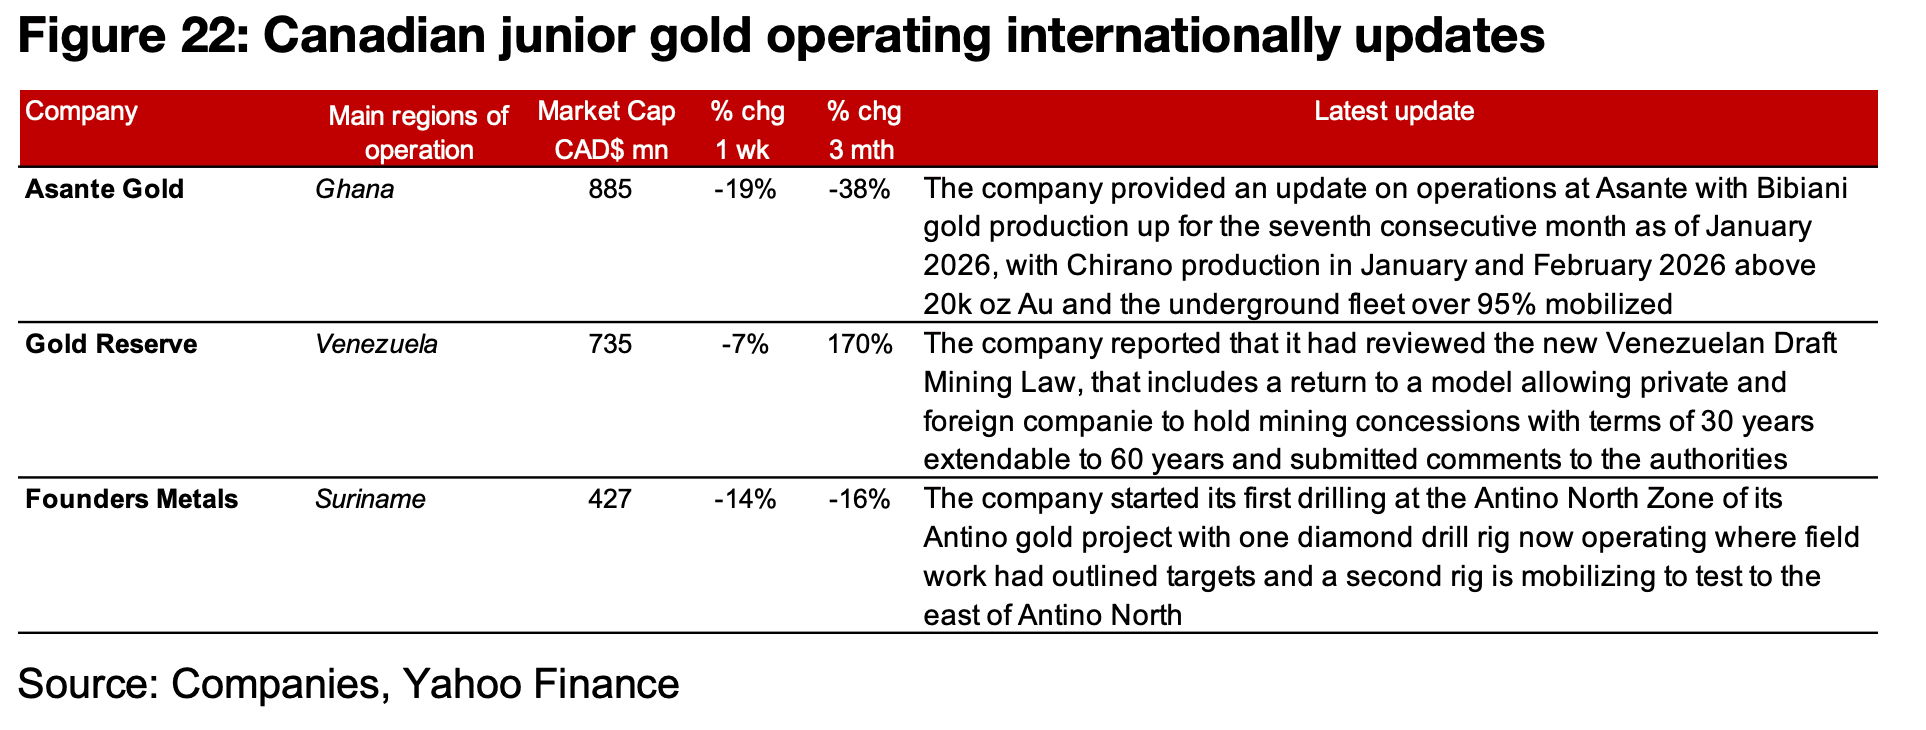
The major producers and TSXV gold saw major declines on the huge drop in the gold price (Figures 19, 20). For the TSXV gold companies operating mainly domestically, Artemis restarted production at Blackwater after a week-long shutdown and appointed Mr. George Salamis to its Board and Benz reported drill results from the new Kilkenny discovery at Mt. Egerton (Figure 21). For the TSXV gold companies operating mainly internationally, Asante provided an operational update, Gold Reserve reported that it had reviewed the new Venezuelan Draft Mining Law and Founders started it first drilling at Antino North (Figure 22).
Disclaimer: This report is for informational use only and should not be used an alternative to the financial and legal advice of a qualified professional in business planning and investment. We do not represent that forecasts in this report will lead to a specific outcome or result, and are not liable in the event of any business action taken in whole or in part as a result of the contents of this report.
Author
Ben McGregor authors the Weekly Roundup at CanadianMiningReport.com, providing sharp analysis of the metals and mining sector. With a talent for spotting trends, Ben distills complex market shifts into clear, engaging insights on TSXV junior miners. His weekly updates cover gold, copper, uranium, and more, blending data-driven perspectives with a knack for identifying opportunities. A vital resource for investors, Ben’s work navigates the dynamic junior mining landscape with precision.