
November 03, 2025
Gold declined -3.3% to US$3,982/oz, but showed signs of stabilization near the end of the week from a large decline ongoing since mid-October 2025, with economic news limited and the move appearing to be mostly a post-parabolic pullback.
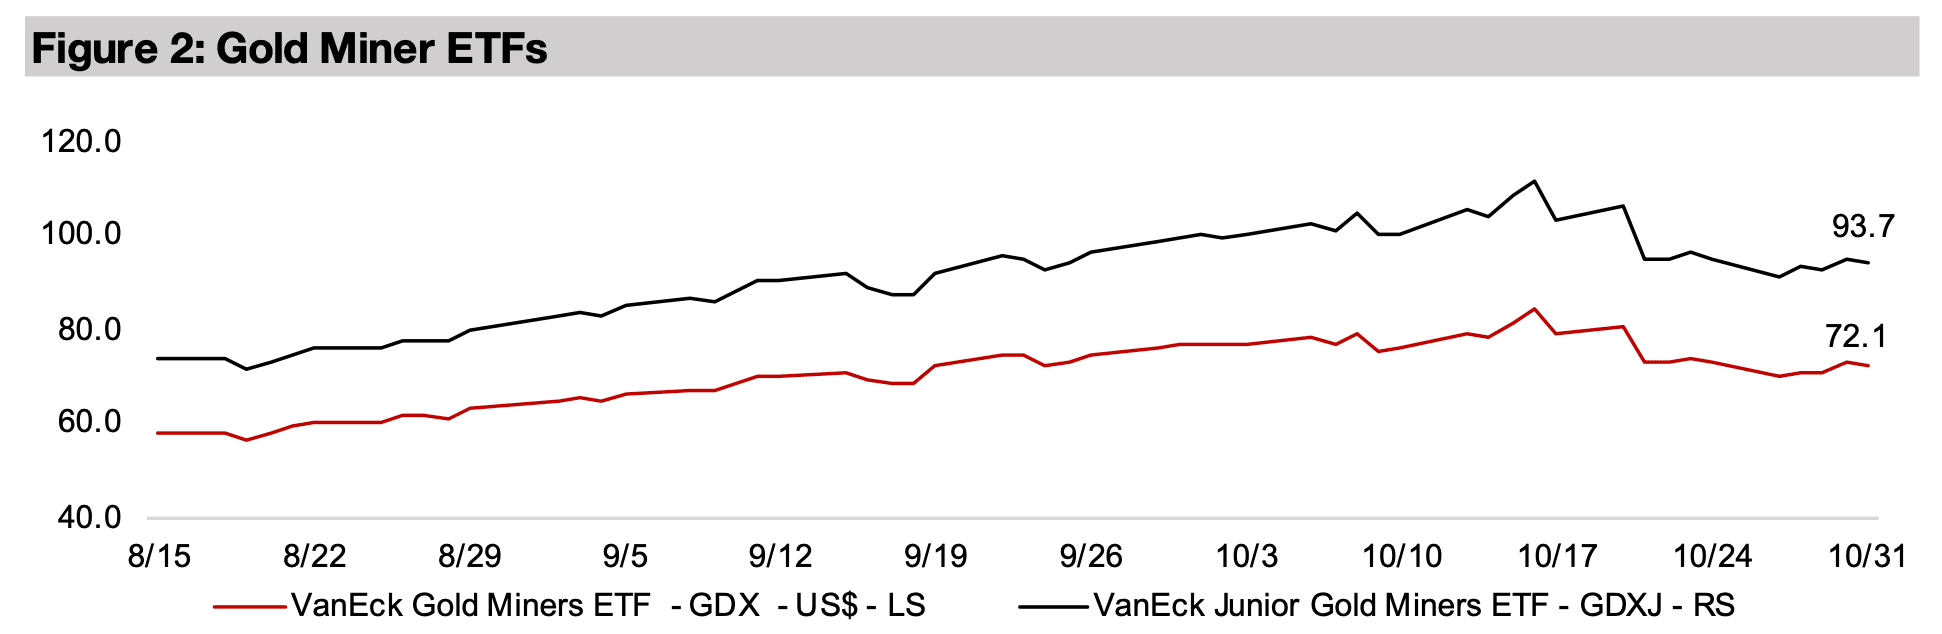
Gold stocks declined, with the GDX and GDXJ down -1.0% and -1.3%, but by significantly less than the metal price drop, while equities were subdued with the S&P 500 off -0.1%, Nasdaq up 0.8% and Russell 2000 gaining 0.5%.


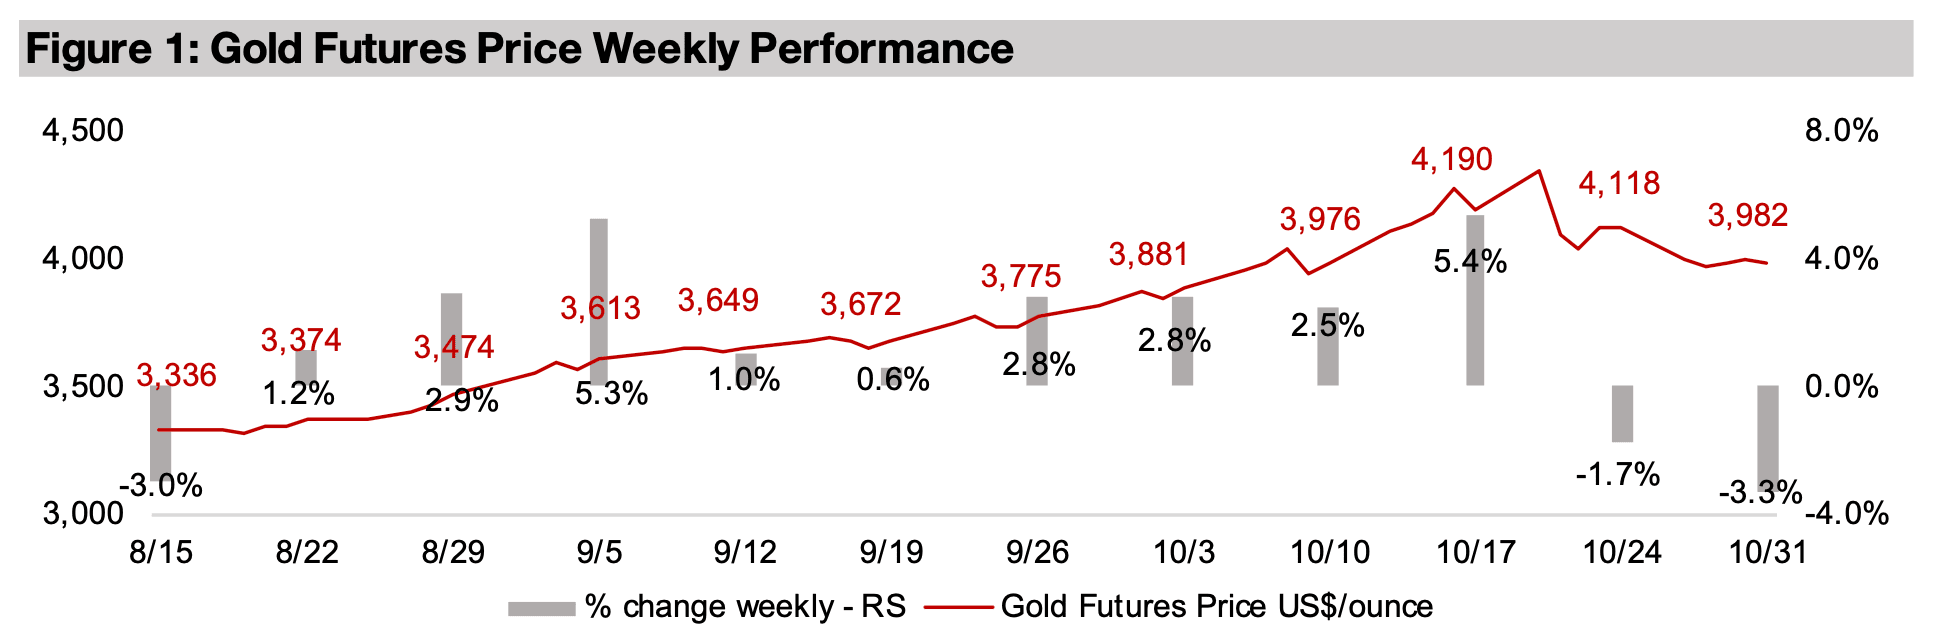
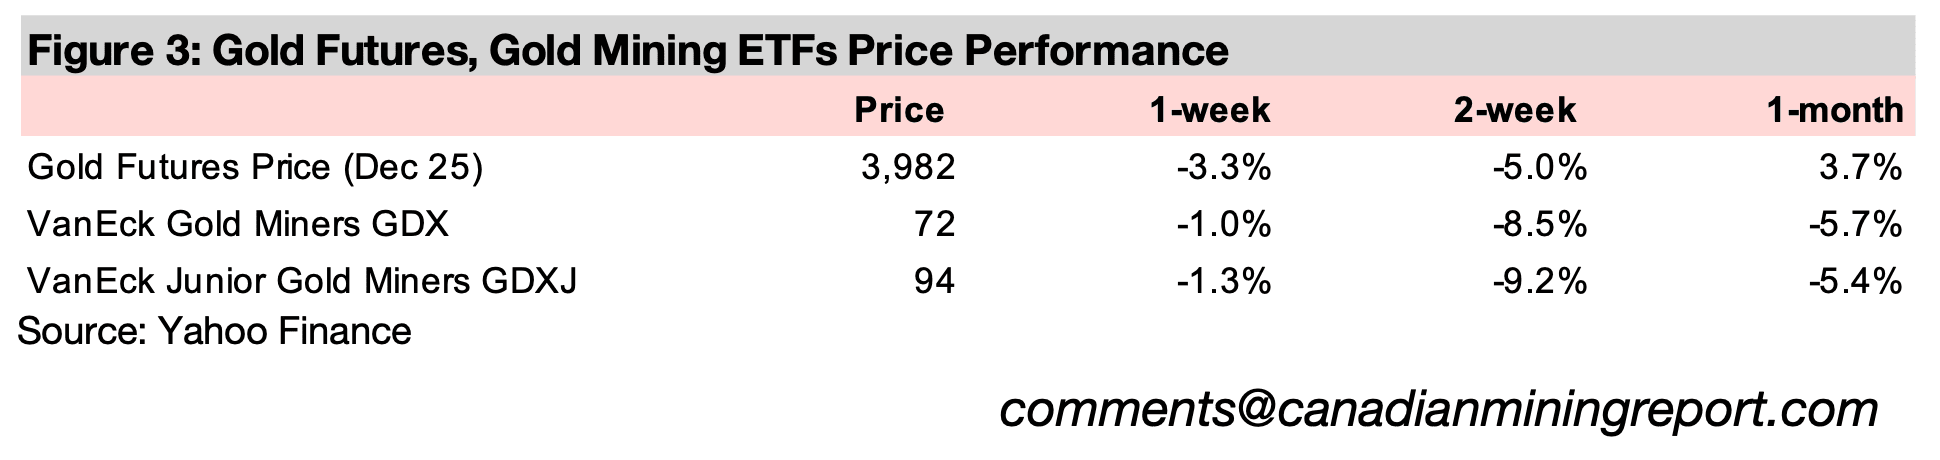
The gold price declined -3.3% to US$3,982/oz, but started to stabilize near the end
of the week from the major decline that started in mid-October. With limited major
news driving the drop it appears to have been a typical trading pullback after over a
three-month parabolic move for gold and other precious metals. The volatility could
indicate that gold and silver have moved into a less balanced, more mature phase of
their bull markets. The uptrend for both started from 2019-2020, followed by
stagnation from 2021-2023, with major gains again from 2024. The jump in platinum
and palladium has been much more recent, starting only in mid-2025.
Equity markets were subdued on a lack of major economic data, with the S&P 500
nearly flat, down -0.1%, the Nasdaq up 0.8% and Russell 2000 rising 0.5%. The gold
stocks actually outperformed the decline in the metal price, with the GDX down -1.0%
and GDXJ off -1.3%. Even after the two-week slump for both these ETFs they are still
significantly outperforming the markets in 2025, up 108.9% and 103.9%, respectively.
The TSXV Mining Index is up 93.7% from a heavy weighting to the gold sector, and
even MSCI Metals and Mining, which has large exposure to iron ore and copper and
less to gold, has still outperformed, up 33.2% this year.
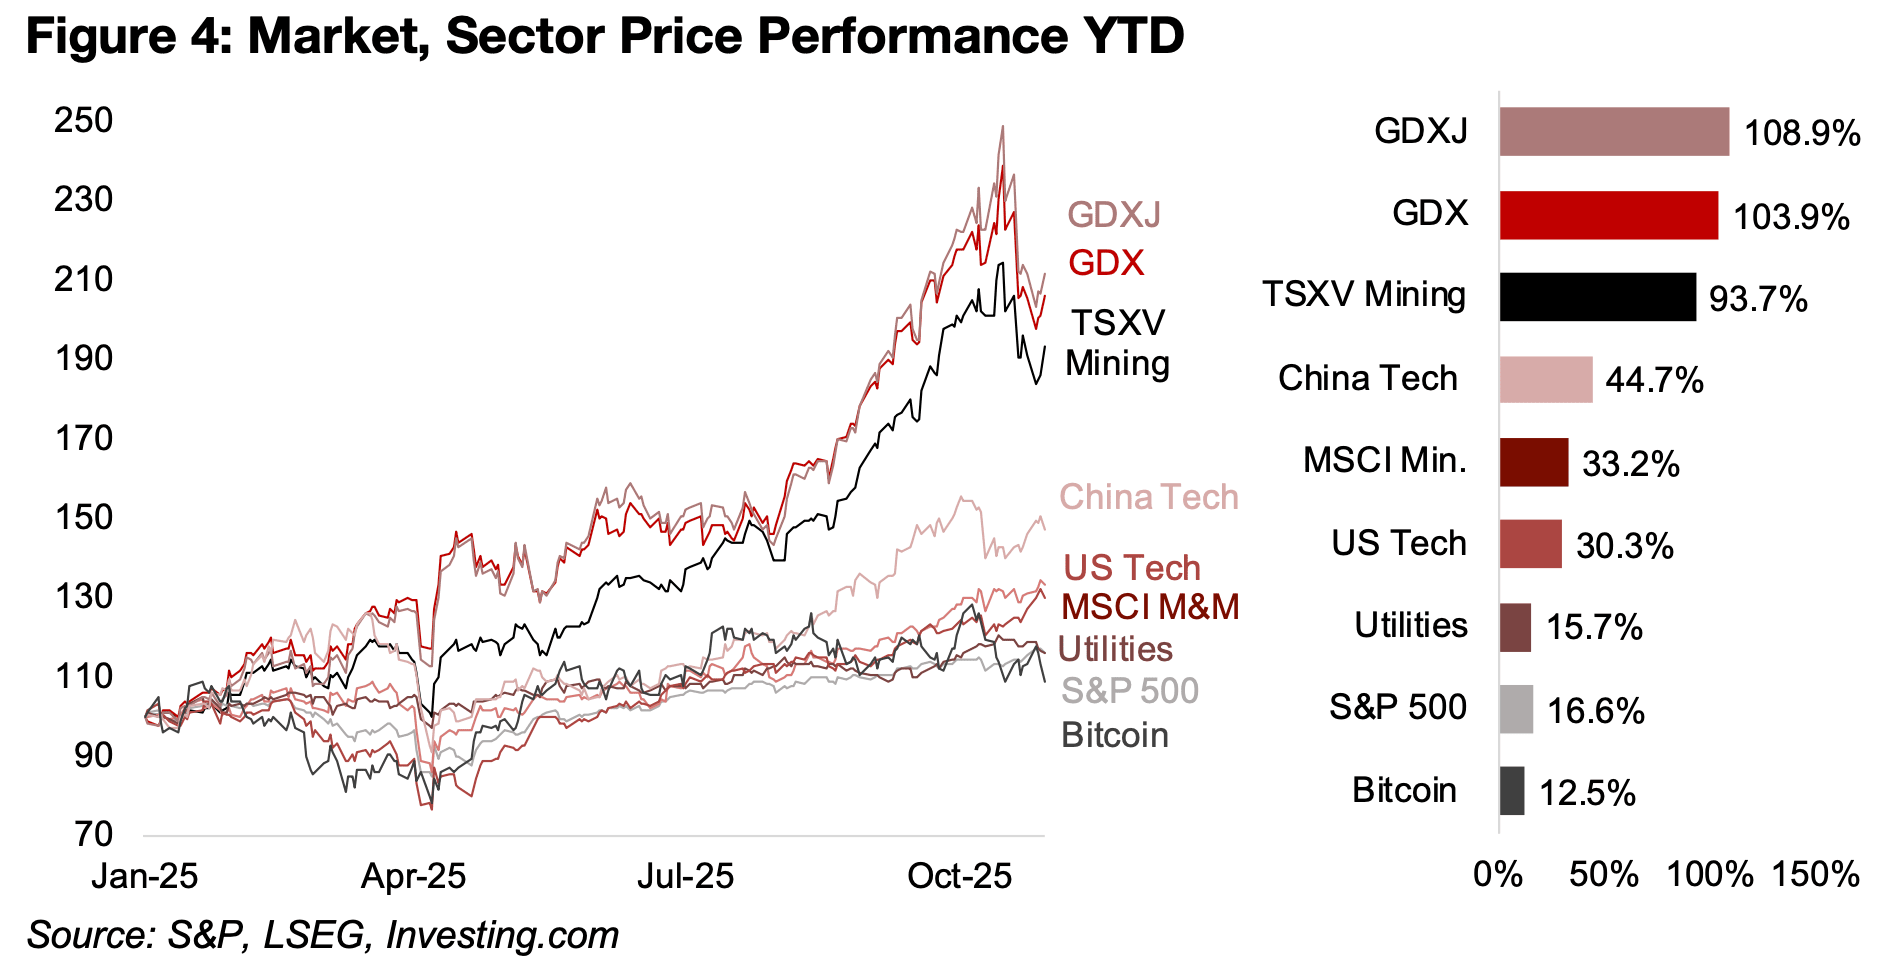
Mining is ahead of US tech, up 30.3% in 2025, with growth shifting to China, where
the sector has risen 44.7%. The tech boom had appeared to be subsiding by mid-
2025, with gains nearly even with utilities, with the strength of this highly defensive
sector indicating markets were heavily hedging risk. However, tech has again taken
off in recent months, around doubling the 16.6% gains of the S&P 500, although with
utilities just behind this, up 15.7%, it indicates hedging has continued, and the
underperformance of Bitcoin, up just 12.5%, is another sign of cautious markets.
The later stages of gold bull markets tend to have two or three major reversals in their
parabolic phase, and first pullback for this cycle has now occurred. While there may
be lingering caution over the sector short-term, the recent highs seem unlikely to be
a peak for this bull market, with many drivers remaining. A bear case for gold would
be a mid-2010s-like situation with very low interest rates and inflation, robust
economic growth and low geopolitical risk, the combination of which is historically
extremely rare. In contrast we now have high interest rates and inflation versus recent
decades, moderate economic growth and very high geopolitical risk.
Even if one or two of these factors improves, the others may still provide enough risk
for gold to remain relatively high, although it could pause before a further uptrend.
The core driver of the metal long-term, monetary expansion, is trending up, especially
with the Fed having joined the global central bank rate cuts over the past two months.
The euphoria over precious metals that had been building from July 2025 to mid-
October 2025 was looking increasingly unstable and a dampening of the sentiment
was not unwarranted, but does not yet suggest a shift into a bear market.
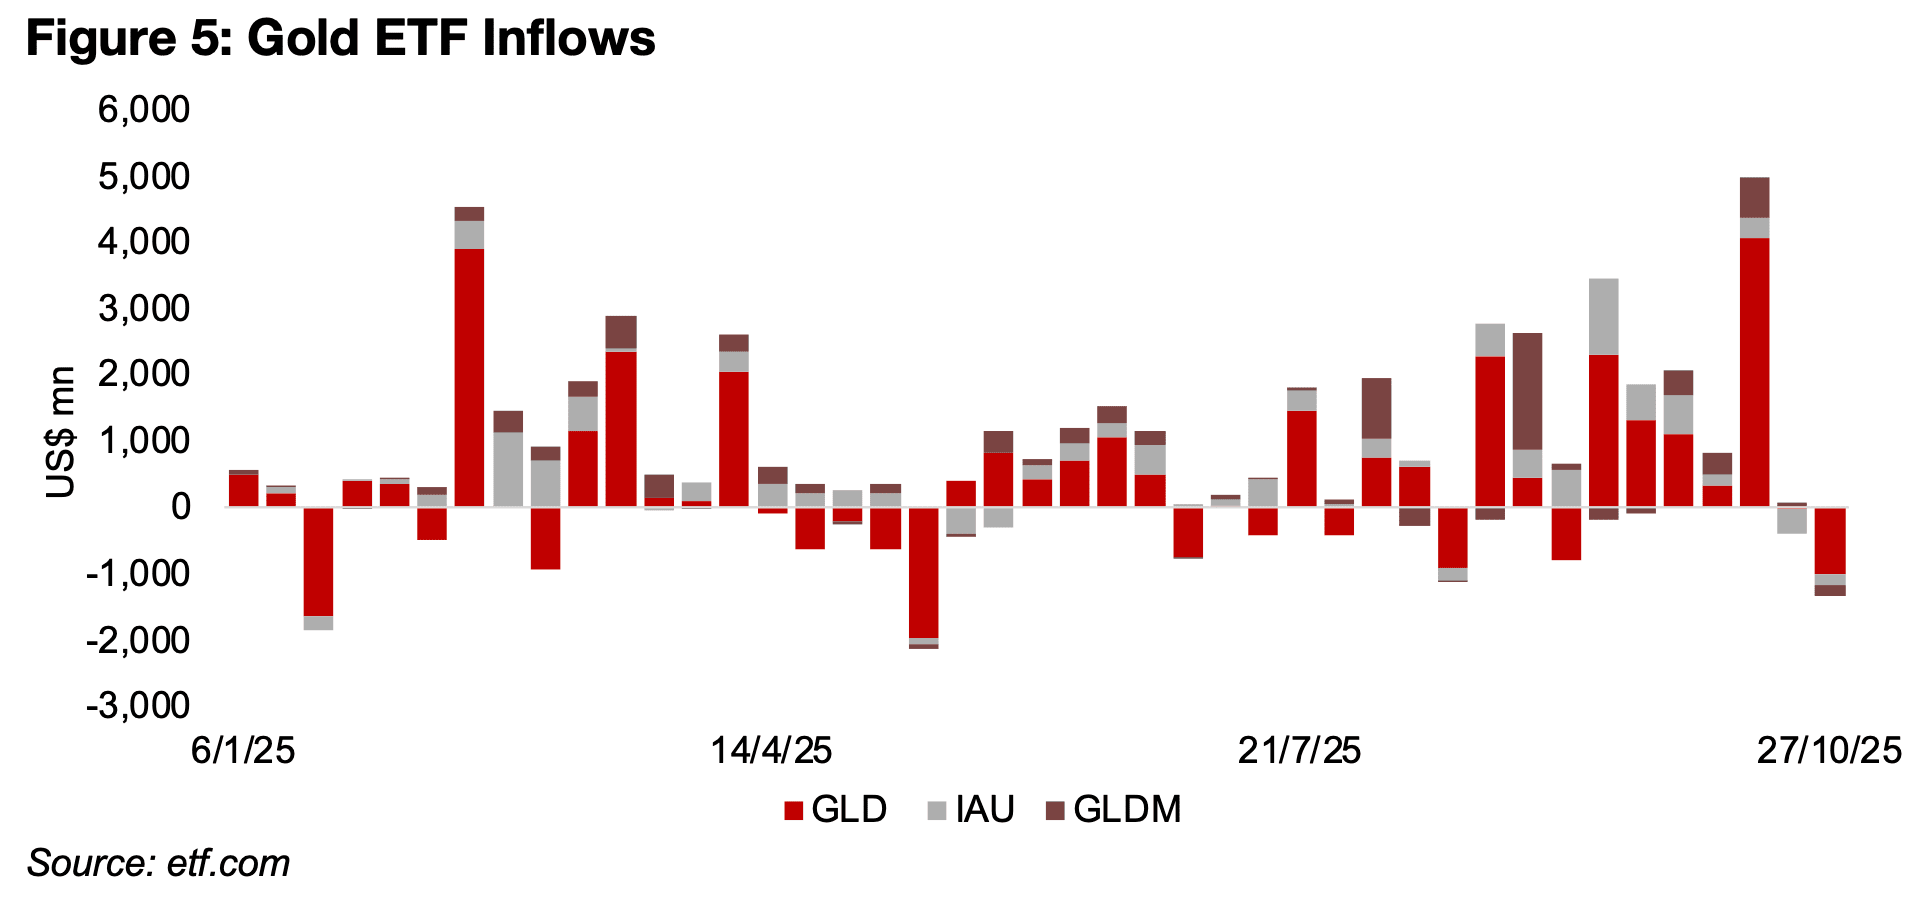
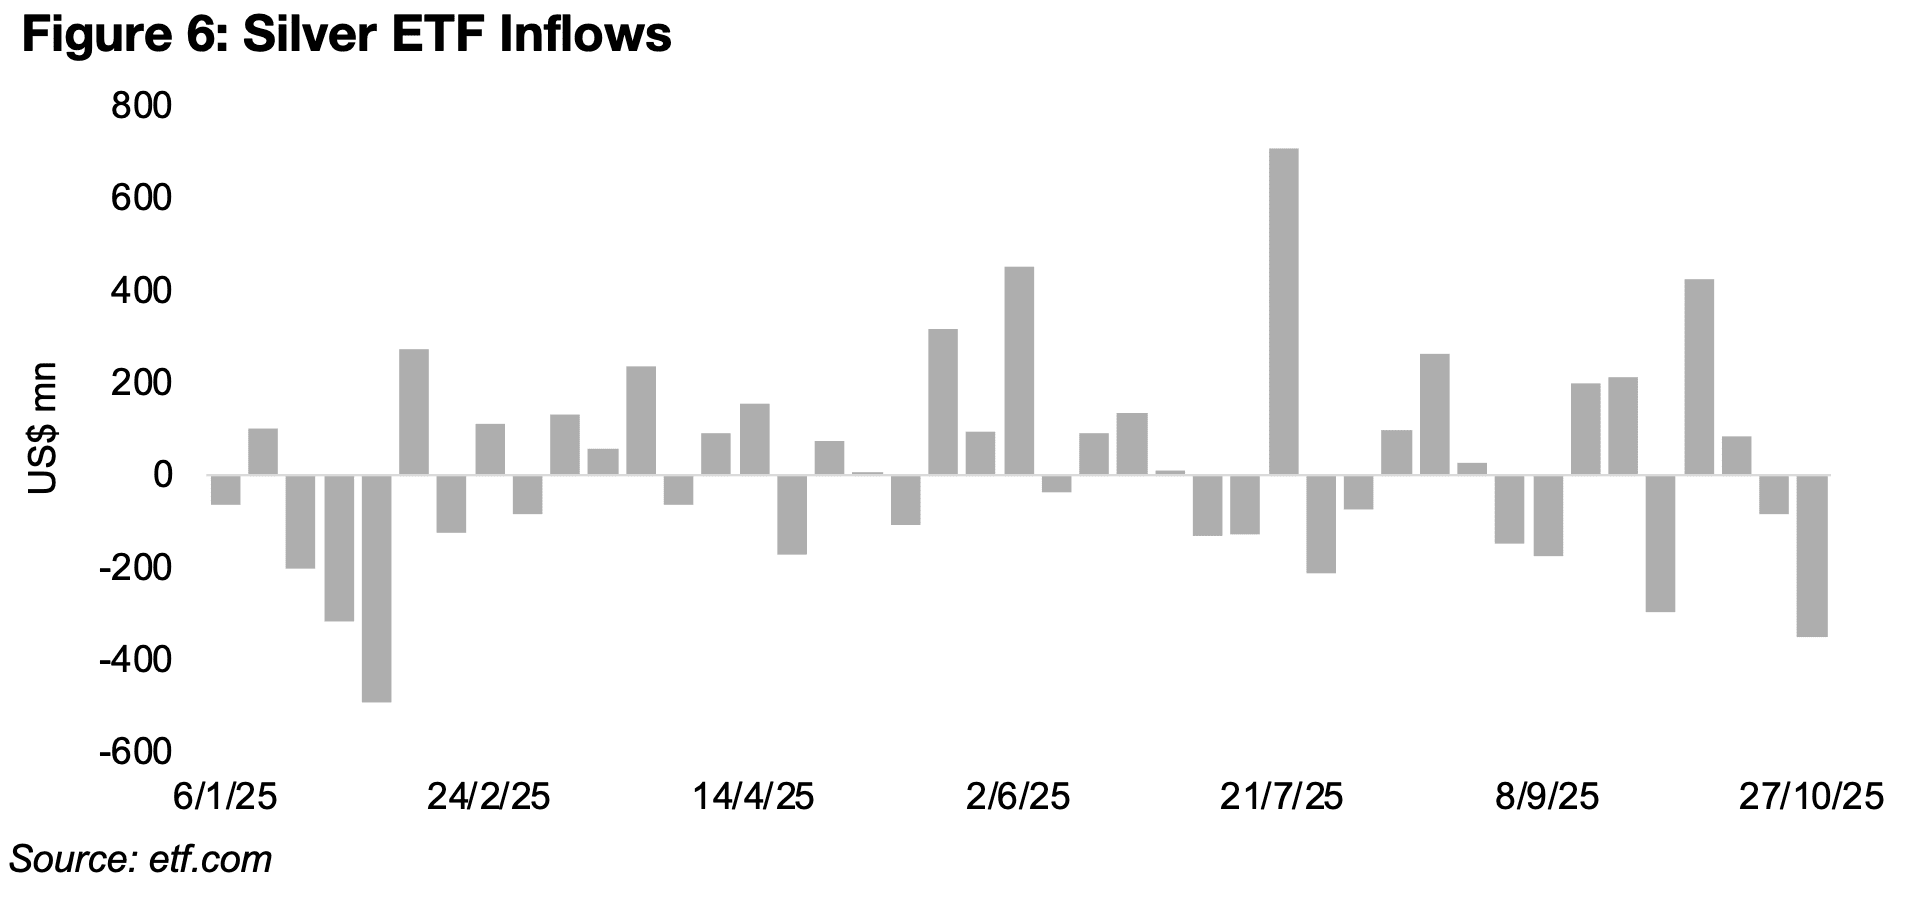
The major gold and silver ETFs saw large net outflows, as would be expected given the drop in the metals prices. The largest ETFs benchmarked directly to the gold price, GLD, IAU and GLDM, saw one of their largest combined declines for the year last week (Figure 5). However, this was still not the lowest week of 2025, with larger outflows for two other weeks this year, one in May and January. However, this followed the highest weekly combined inflows into these ETFs ever, far offsetting the decline over the past week. The largest ETF tracking the silver price, SLV, also had its third largest weekly outflows for the year, with the two largest net declines this year in January 2025. However, in contrast to the gold ETFs it had not seen high inflows over the preceding two weeks, and its highest inflows were in July 2025.
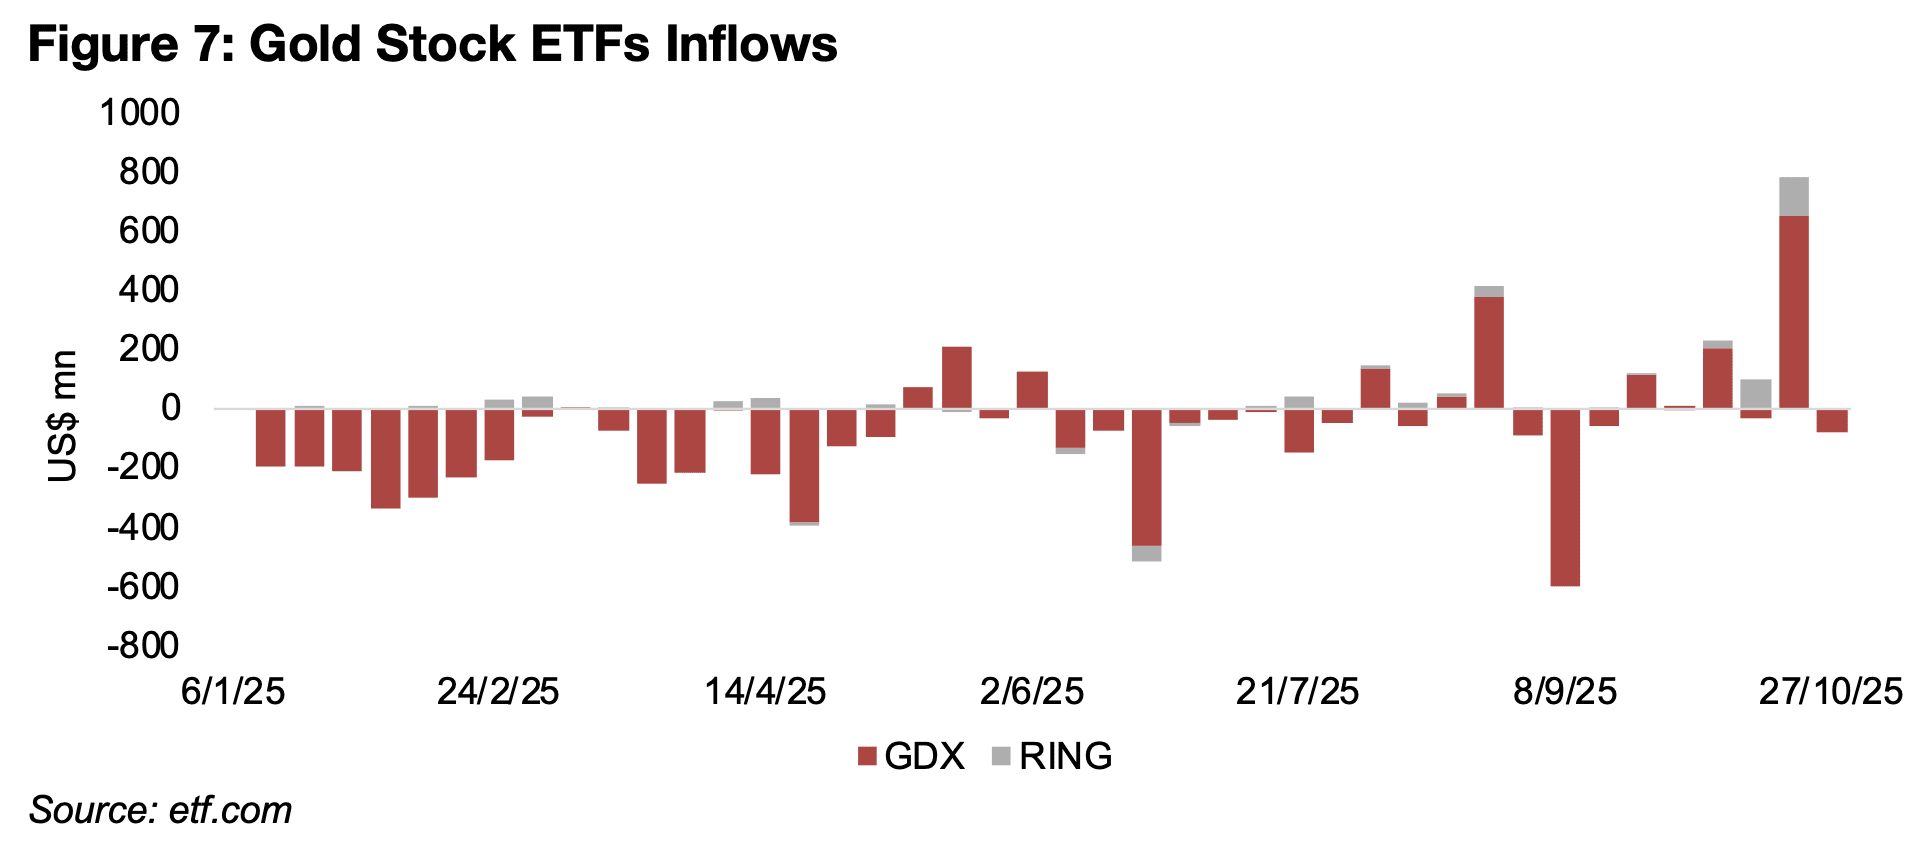
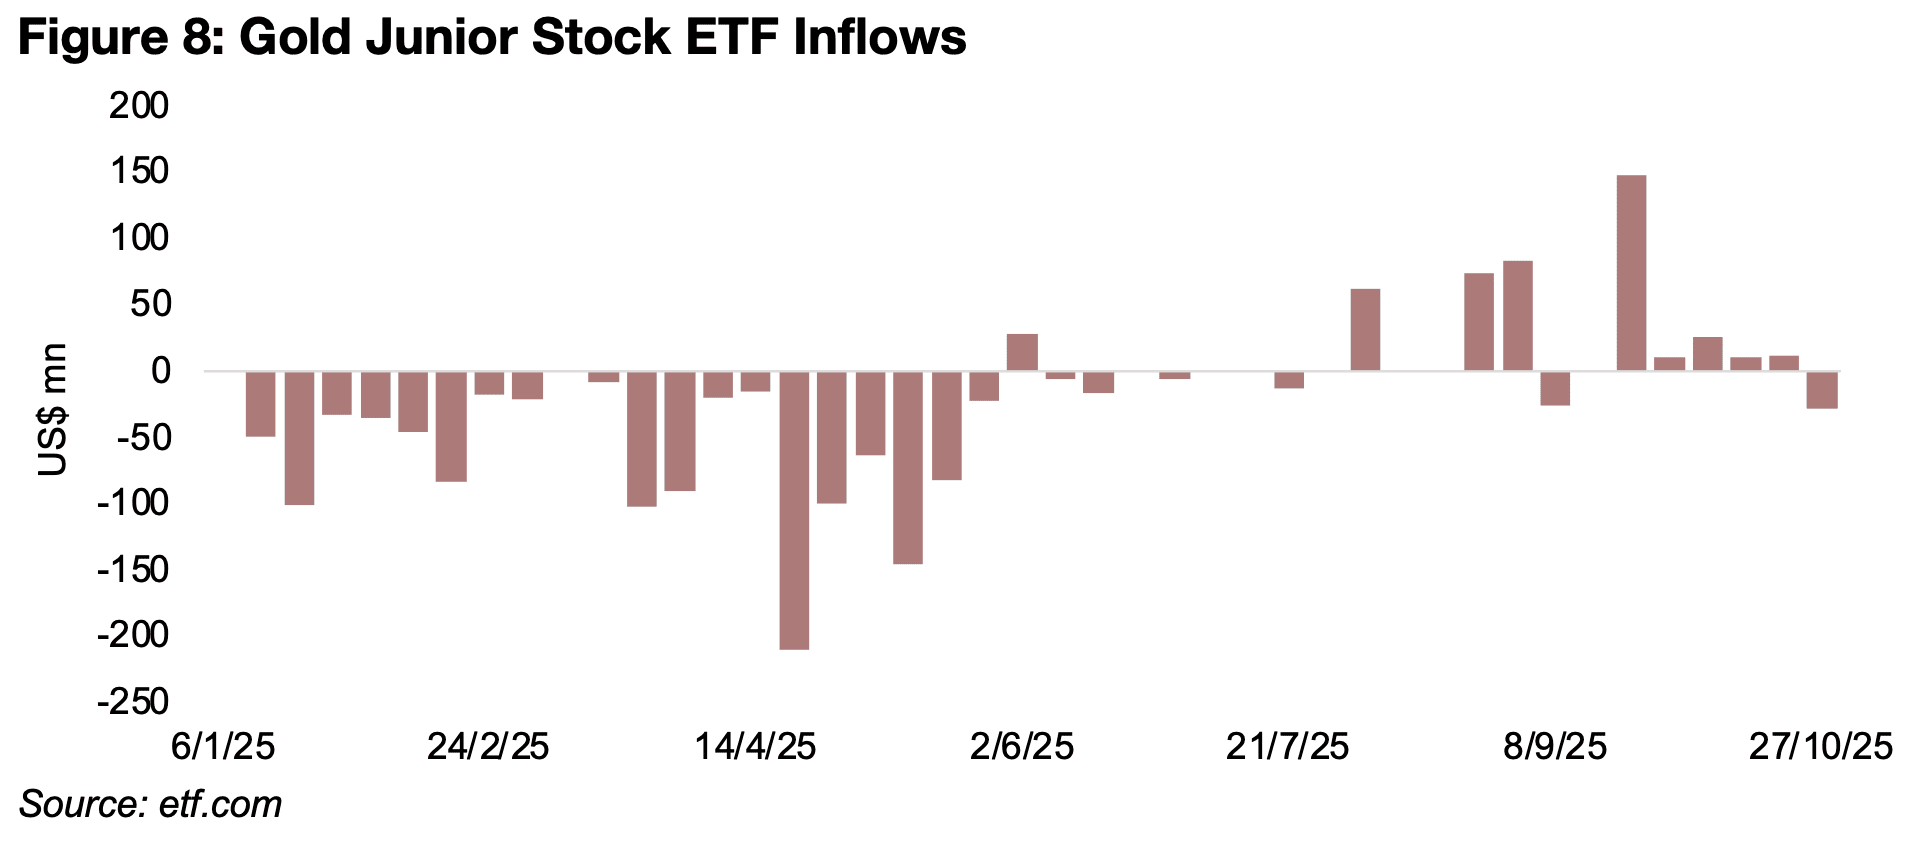
While the combined flows into gold stock ETFs GDX and RING, which is almost entirely weighted to the former, did decline last week, it was only by a small amount (Figure 7). The drop was nowhere near the consistent large outflows over most of the first five months of the year, or the largest weekly decline in September. Similar to the gold price ETFs, the decline also followed the combined largest week of inflows ever. The outflows from the junior gold stock ETF GDXJ were also quite low, especially in contrast to major net outflows almost every week over H1/25 (Figure 8). The inflows into the GDXJ for this year peaked in September 2025, much earlier than for the GDX and RING, followed by relatively low net inflows for four weeks before the decline last week. We could expect the outflows for the GDXJ this year to be lower, relative to its total assets, than the ETFs for the major producers, as there has been a shift towards caution in markets this year, with less market interest in smaller, riskier stocks.
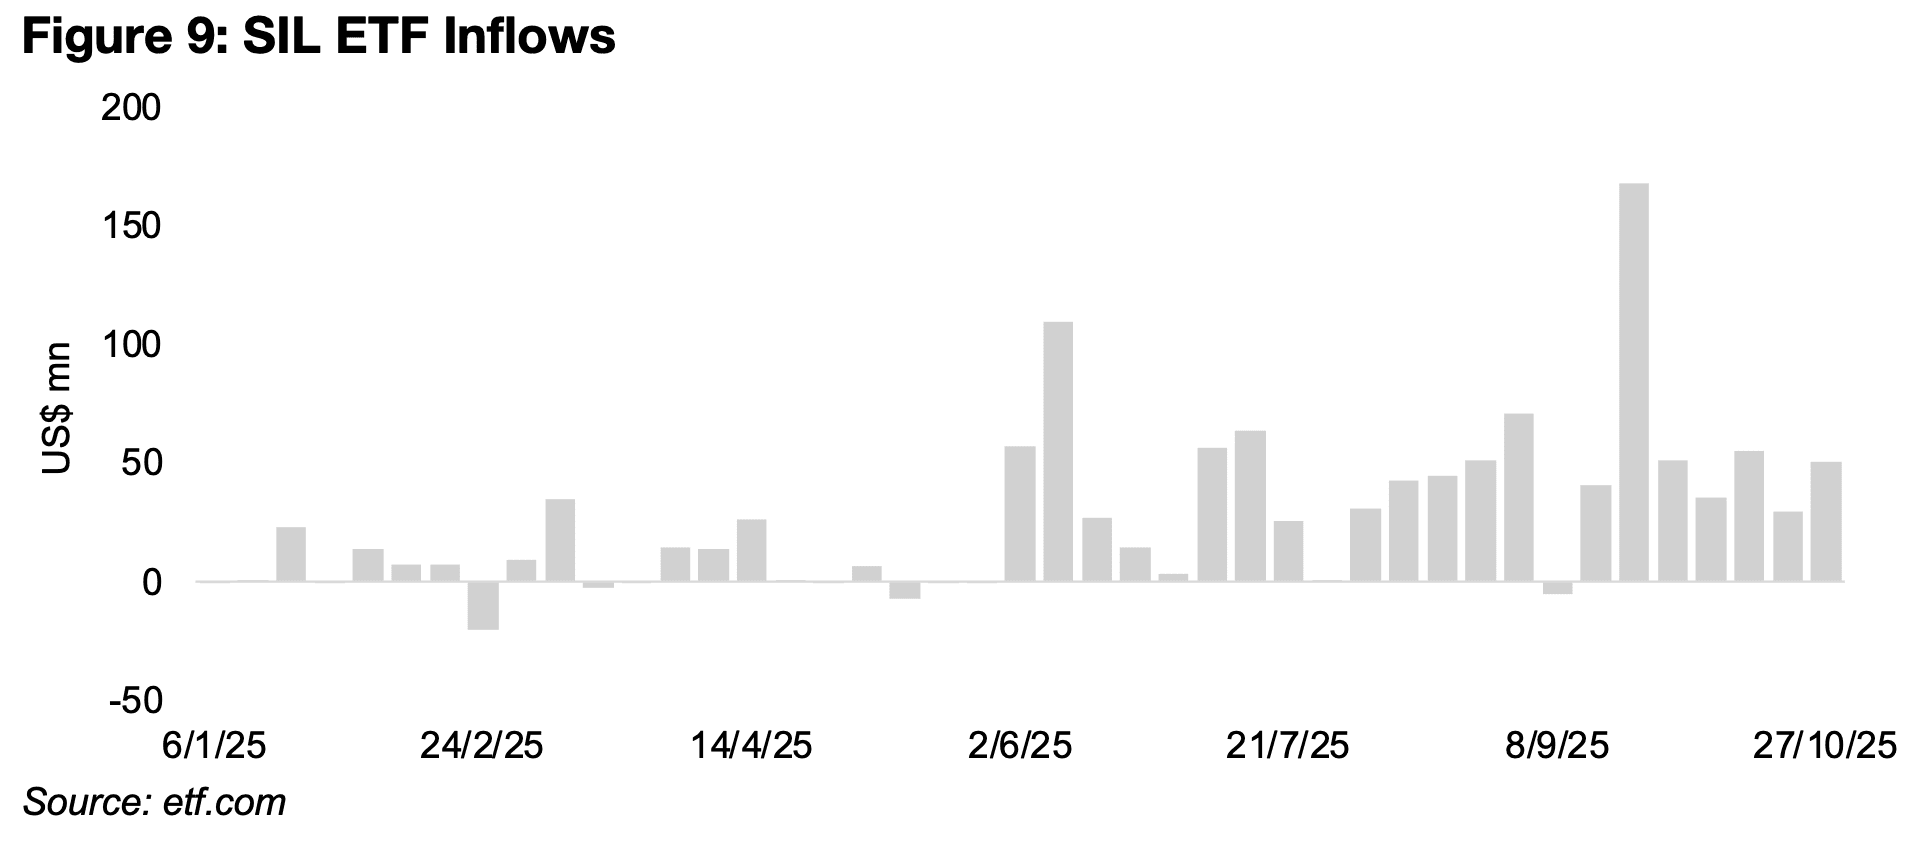
Interestingly the SIL silver stock ETF did not see outflows at all last week even as the
metal price dropped, and it continued the very strong inflows seen over H2/25 (Figure
9). While inflows were lower over H1/25, there were also no major outflows, in contrast
to the major outflows of the GDX and GDXJ. This may be because the market is still
viewing the silver price as relatively low versus its fundamentals. While the ratio of the
gold to silver price had gotten very high versus the medium-term average earlier this
year, the gain in silver in recent months saw this ratio come more into balance.
However, silver still looks very low versus gold based on long-term historical averages,
and some in the market hypothesize that this could support a significant rise in silver.
The price to book of the SIL has actually risen moderately above the valuation for
both the GDX and GDXJ, suggesting that the stocks have become relatively
expensive, and yet the relatively strong inflows continue. This could indicate that the
market is still expecting an outperformance of silver versus gold to come, which could
reduce the relative valuations of the SIL versus the gold stock ETFs.
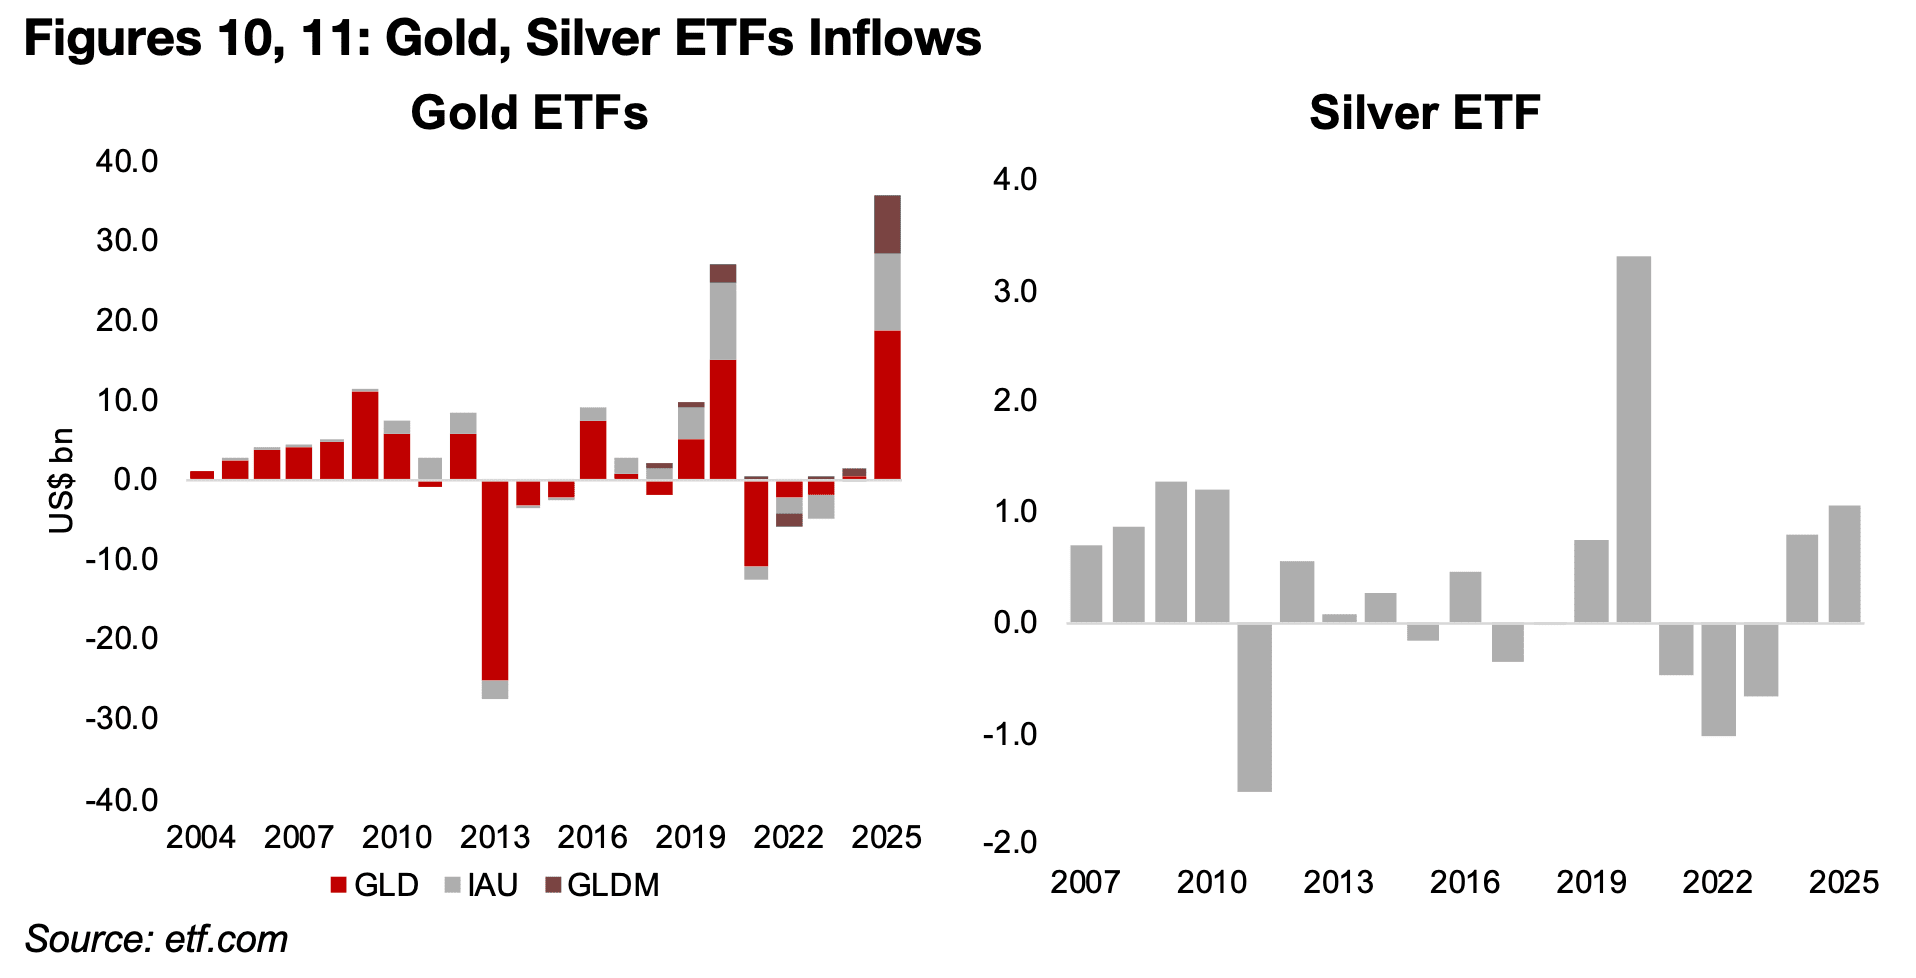
The annual data show how massive a year 2025 has been for the gold price ETFs,
which have had a combined US$35.6bn in net inflows this year, far surpassing the
previous high of US$27.1bn in 2020 (Figure 10). Most of the outflows from these ETFs
over the past two decades were in just two years, with US$-27.5bn in 2013 at the
start of the gold bear market that lasted from until 2018, and US$-12.1bn in 2021,
with some reversal of the major gains in the previous year. While the silver price ETF
inflows at US$1.1bn so far in 2025 are at their highest in five years, this is still far off
the peak of US$3.3bn in 2020 (Figure 11). The lows for the silver price ETF were
reached in 2011, two years before the worst outflows for the gold price ETFs.
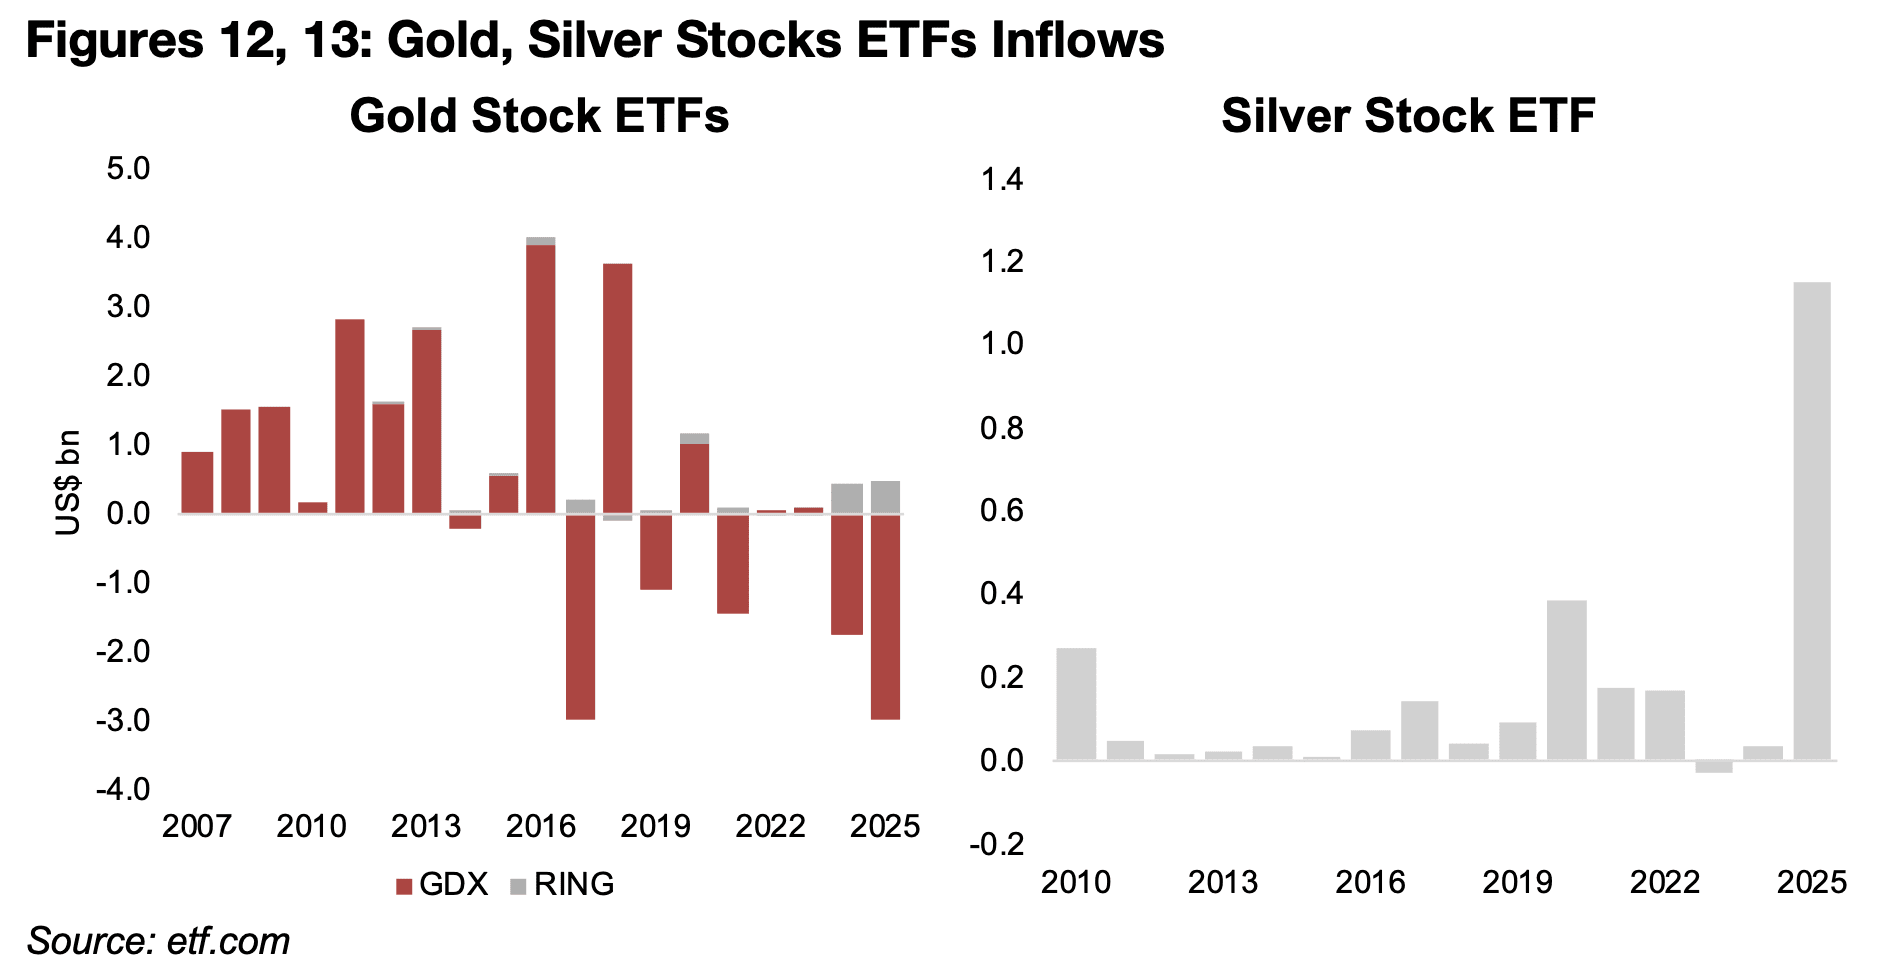
The gold stock ETFs have actually had major outflows for the past two years, mainly driven by a drop in the GDX, which might not be expected given the rise in the gold price (Figure 12). However, with the market cap of the gold stocks underlying these funds surging, it shows that there is certainly major net buying in the sector, which apparently has been done by direct purchases of the underlying equities, rather than indirectly through the ETFs. In contrast, the silver stock ETF has seen huge net inflows relative to its history, of US$1.15bn, at three times the previous highs of US$0.4bn in 2020 (Figure 13).
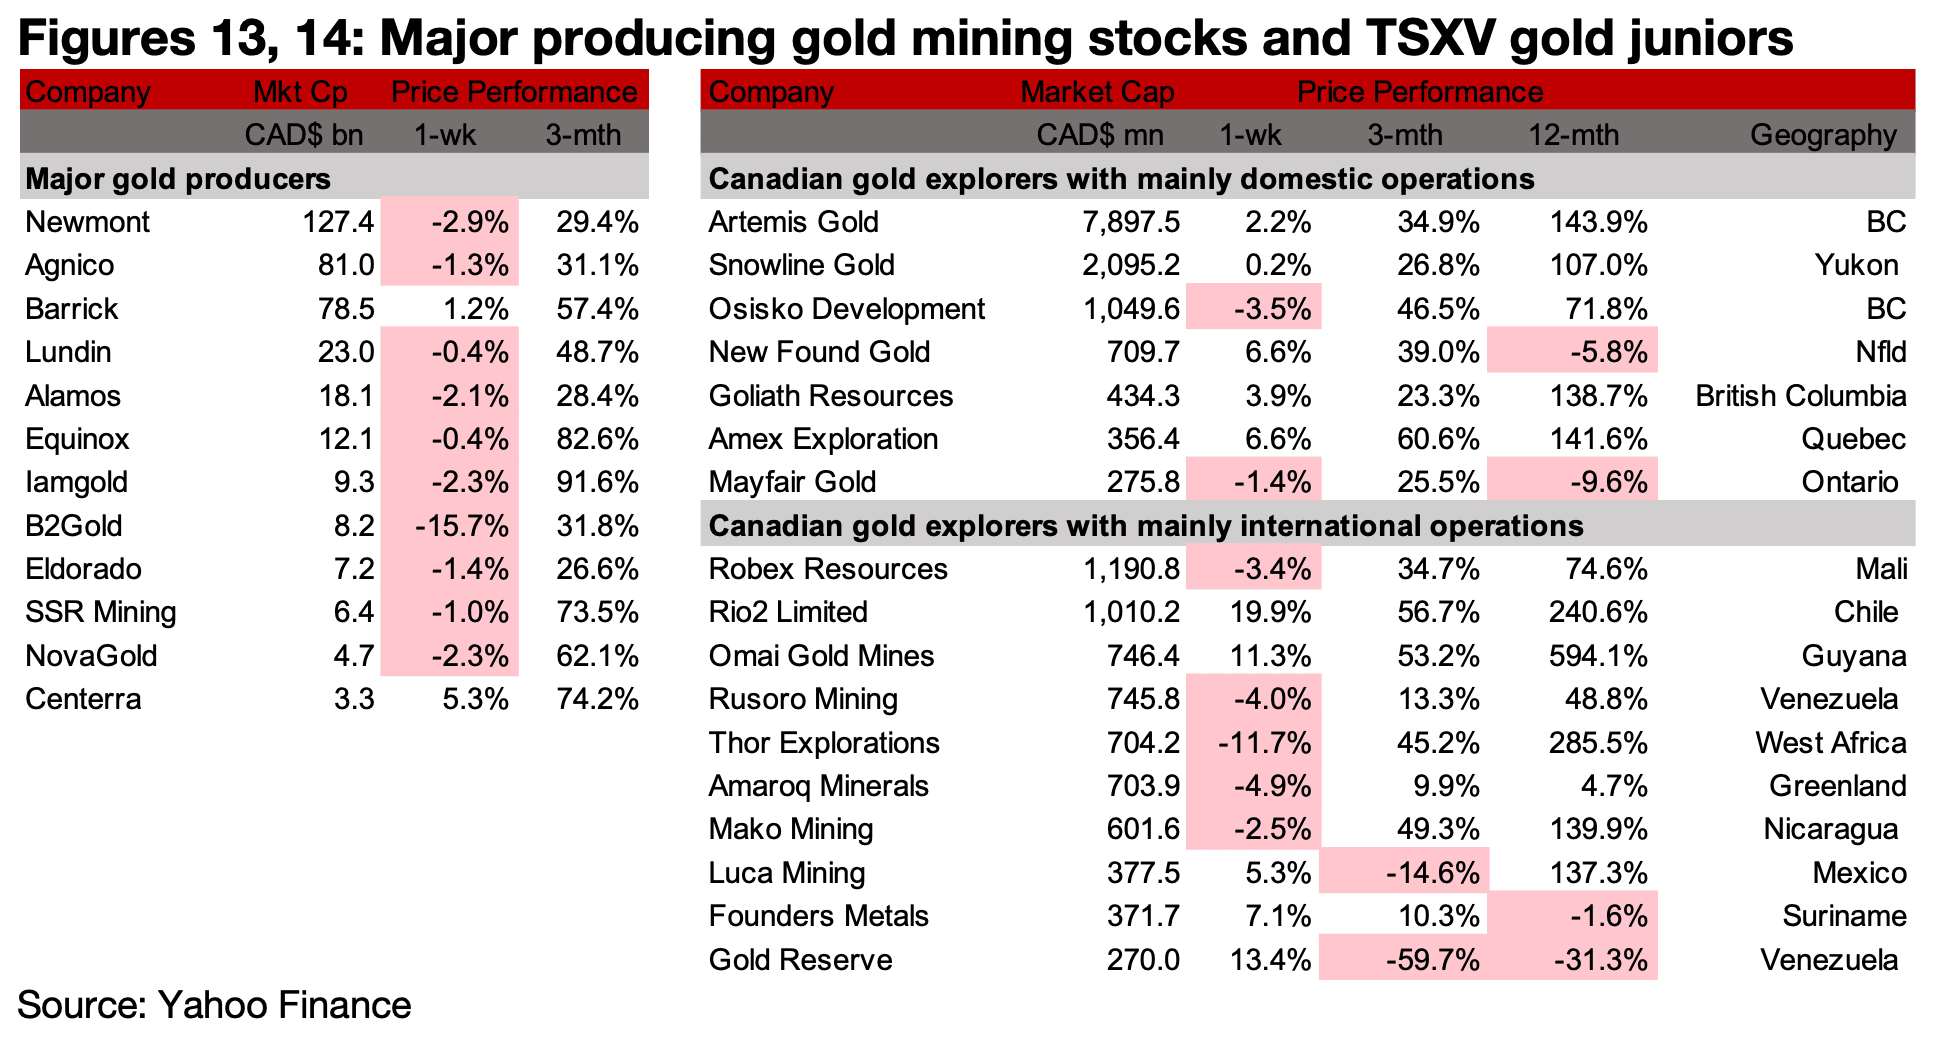
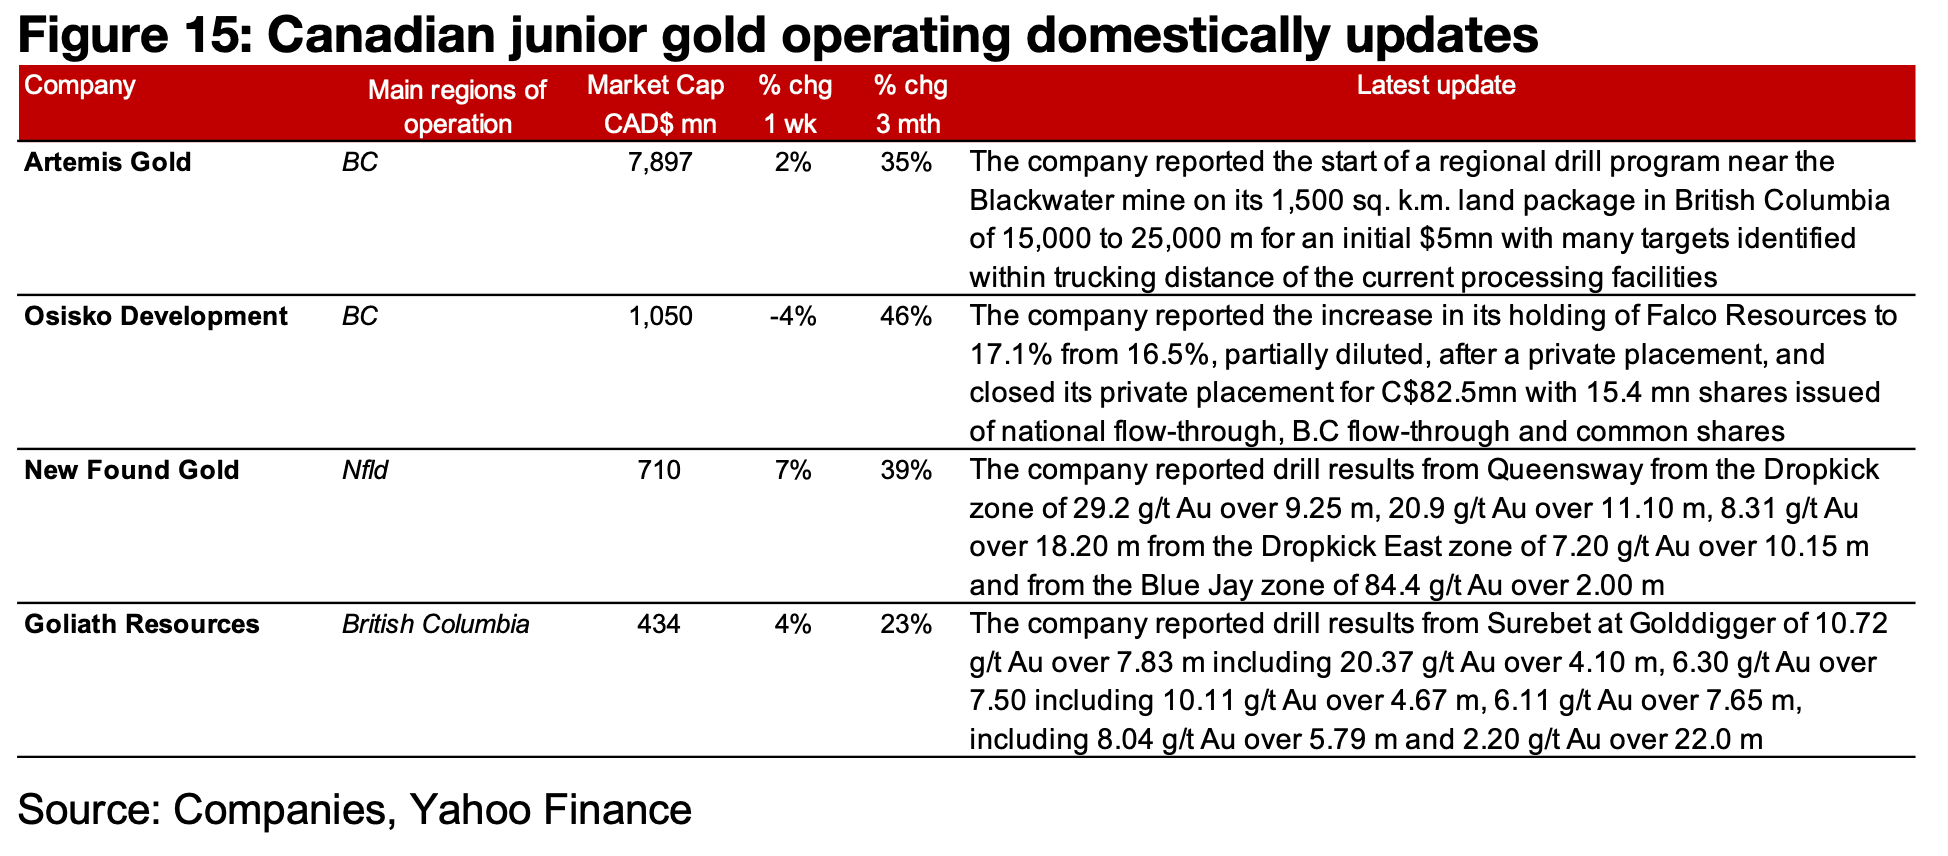
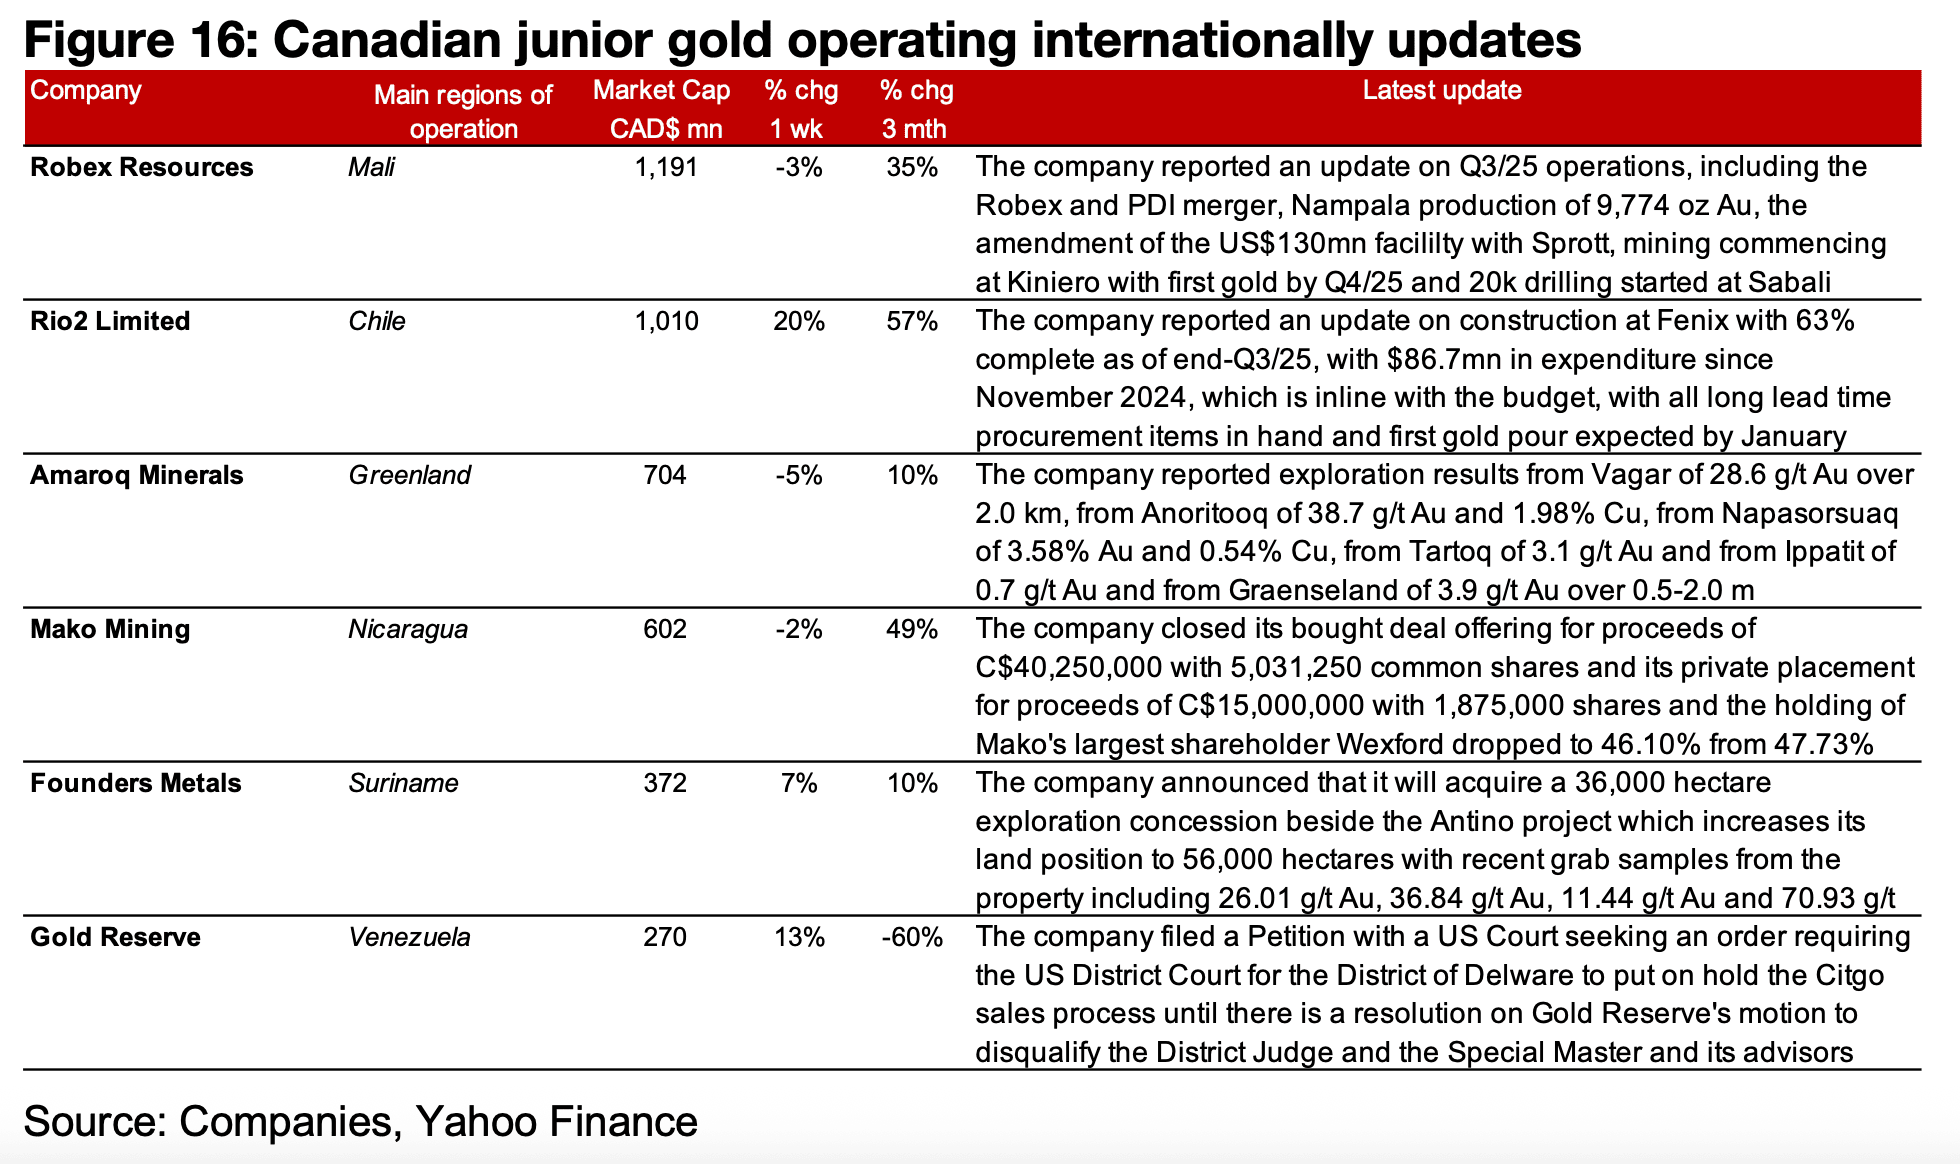
The major gold producers mainly declined although TSXV gold was mixed (Figures 13, 14) For the TSXV gold companies operating mainly domestically, Artemis started a regional drill program around the Blackwater mine, Osisko Development reported an increase in its holding of Falco Resources and closed its C$82.5mn private placement, New Found Gold reported drill results from the Dropkick, Dropkick East and the Blue Jay zones of Queensway and Goliath announced drill results from Surebet at Golddigger (Figure 15). For the TSXV gold companies operating mainly internationally, Robex reported an update on Q3/25 operations, Rio2 Limited announced an update on construction of Fenix, Amaroq reported exploration results from several new targets, Mako closed its two financings, Founders acquired an exploration concession beside Antino and Gold Reserve filed a petition with the US Court to put on hold the Citgo sale process until a resolution of its motion to disqualify a Judge, Special Master and advisors (Figure 16).
Disclaimer: This report is for informational use only and should not be used an alternative to the financial and legal advice of a qualified professional in business planning and investment. We do not represent that forecasts in this report will lead to a specific outcome or result, and are not liable in the event of any business action taken in whole or in part as a result of the contents of this report.
Author
Ben McGregor authors the Weekly Roundup at CanadianMiningReport.com, providing sharp analysis of the metals and mining sector. With a talent for spotting trends, Ben distills complex market shifts into clear, engaging insights on TSXV junior miners. His weekly updates cover gold, copper, uranium, and more, blending data-driven perspectives with a knack for identifying opportunities. A vital resource for investors, Ben’s work navigates the dynamic junior mining landscape with precision.