

August 17, 2026
The gold price rose 2.2% to US$4,437/oz, building on last week’s 7.2% gains, as July 2026 US inflation data was relatively flat versus the previous month and broadly inline with expectations and there were no major shifts in the Middle East situation.
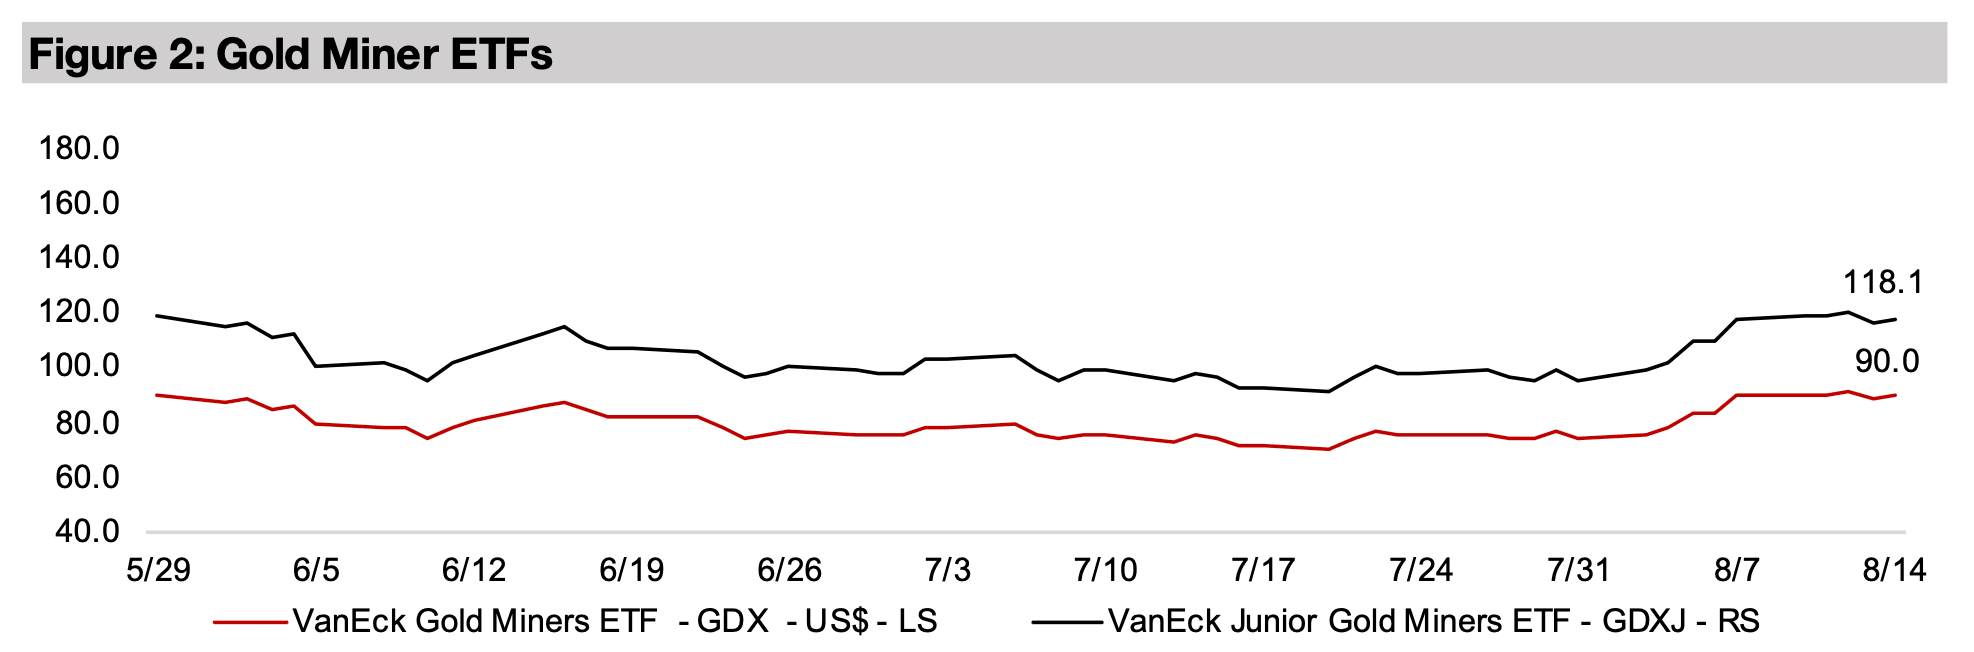
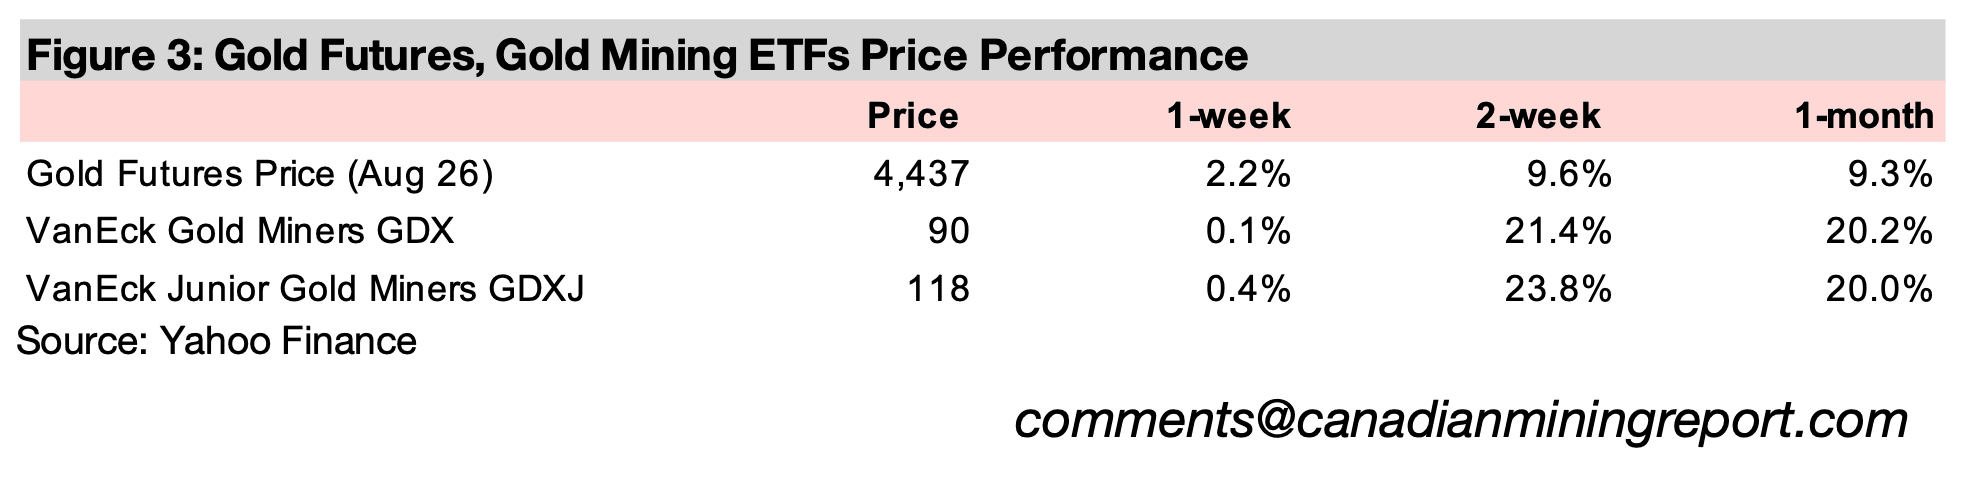
The gold stocks were relatively flat, with the GDX up 0.1% and the GDXJ rising 0.4%, as some of the strongest gains for the ETFs in nearly two decades from last week were maintained, with large cap equities near flat and outpaced by small cap gains.


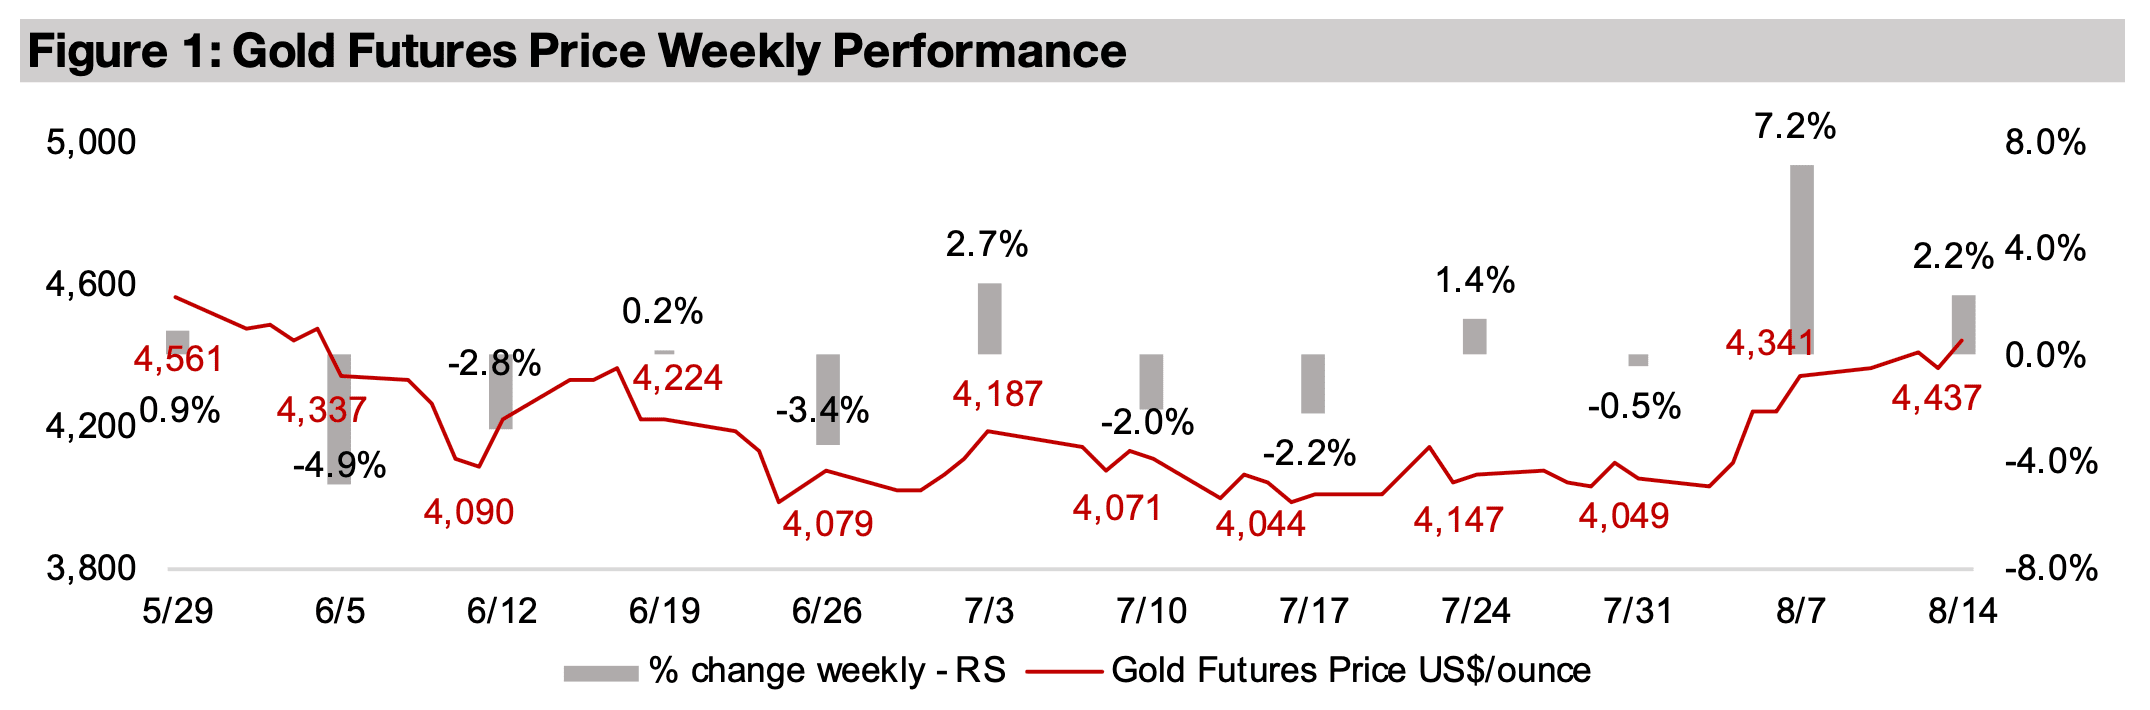
The gold price rose 2.2% to US$4,437/oz, following a 7.2% gain last week, which
was its strongest since January 2026. The main economic data was US inflation, with
the CPI for July 2026 rising 3.4% yoy and core inflation up 2.5%, inline with
expectations. The PPI, seasonally adjusted, was flat month on month, versus
consensus estimates for a 0.2% increase, while the core PPI rose 0.2% compared to
expectations for 0.3%. These figures did not indicate a major shift in the inflation
outlook and in turn the probability of a Fed hike, especially in contrast to the previous
week’s slump in US employment data which saw a dramatic drop in expectations for
higher rates. While this had been coupled with significant progress in cooling tensions
in the Middle East, there was no major change in the geopolitical situation this week.
This drove muted moves in the metal and large cap equities, with the S&P 500 up
0.4% and hitting all-time highs mid-week and the Nasdaq near flat, gaining just 0.2%.
Small caps were relatively strong, with the Russell 2000 adding 1.4%, with the sector
likely benefiting from its much lower valuations, with a price to book ratio of just 2.73x,
versus 5.73x for the S&P 500 and 9.96x for the Nasdaq, and a price to earnings ratio
of 12.64x, versus 30.66x and 40.52x for these larger cap indices. The gold stocks
consolidated, with the GDX rising 0.1% and GDXJ gaining 0.4%, after their largest
gains in nearly two decades in the previous week, surging 21.3% and 23.3%. This
came after gold and the ETFs were flat for nearly two months, which likely set up the
rebound after a 24.3% slump in the metal price from late January 2026 to mid-July
2026. The sector also had support from relatively low valuations, with the GDX and
GDXJ P/B multiples at 2.73x and 2.44x, and their P/E multiples at 12.64x and 12.77x.
The major decline in the gold price and extended bottom seems to have curbed any
speculative excesses in the sector from earlier this year, and it may have even
overcorrected somewhat to the downside. There were fundamental drivers for the
decline, especially the fear of rising real yields, which tend to move inversely to the
metal. These concerns had been supported especially from March 2026 to June 2026
by high oil prices and a strong US employment situation, which both implied high
inflation and therefore pressure on Fed to hike. However, the reduced geopolitical
tensions, which have driven down oil prices well down from their highs, and the
sudden weakening of US employment data has led to a rapid reevaluation of this
outlook, as shown by the soaring price of gold and stocks in the sector.
The market had also seemed to view even a continued high conflict, high oil price,
high yield scenario as sufficiently priced in at around US$4,000/oz for gold, as this
level held through June 2026 and July 2026 even before the worsening employment
statistics and improving geopolitical situation. We have backed out the implied gold
prices for the major gold companies based on consensus estimates and the market
seems to expect only moderate gains from current levels over the next few years.
We have assumed that the companies meet their 2026E guidance, and that
production remains at this level for 2027E and 2028E. Taking current revenue
estimates for the companies still implies only around a US$4,000/oz to US$4,500/oz
gold price for the next few years, not significantly ahead of current levels. This
indicates that if the gold price again heads back towards US$5,000/oz, especially in
a more gradual, sustainable trend than the previous spike towards this level, that
there could be considerable upside to the current revenue forecasts for the majors.
The broader market, and especially later speculative entrants, were likely quite
shocked by the abrupt reversal of gold, and it seemed to have diverted the focus
away from what was still extremely strong fundamentals for the sector. The gold price
still averaged just over US$4,500/oz in Q2/26, driving a huge margin for the sector,
given costs per ounce for the majors of still under US$2,000/oz. While the average
gold price so far in Q3/26 has been just over US$4,100/oz, this is still far ahead of
expenses. If we take the jump in the average gold price to US$4,863/oz in Q1/26 as
a major, but temporary outlier, followed by an unwinding of these bets in Q2/26, if the
average price for gold reaches around US$4,300/oz for the Q3/26, it would effectively
be continuing the uptrend that ran from Q1/24 to Q4/25.
The main risk to a continued rebound in the gold price is that the Middle East conflict
erupts again and drives up the oil price and inflation. However, this could be quite
different to inflation expectations earlier this year, and they may no longer have the
added pressure of a very strong US employment outlook if jobs data from the country
continues to disappoint.
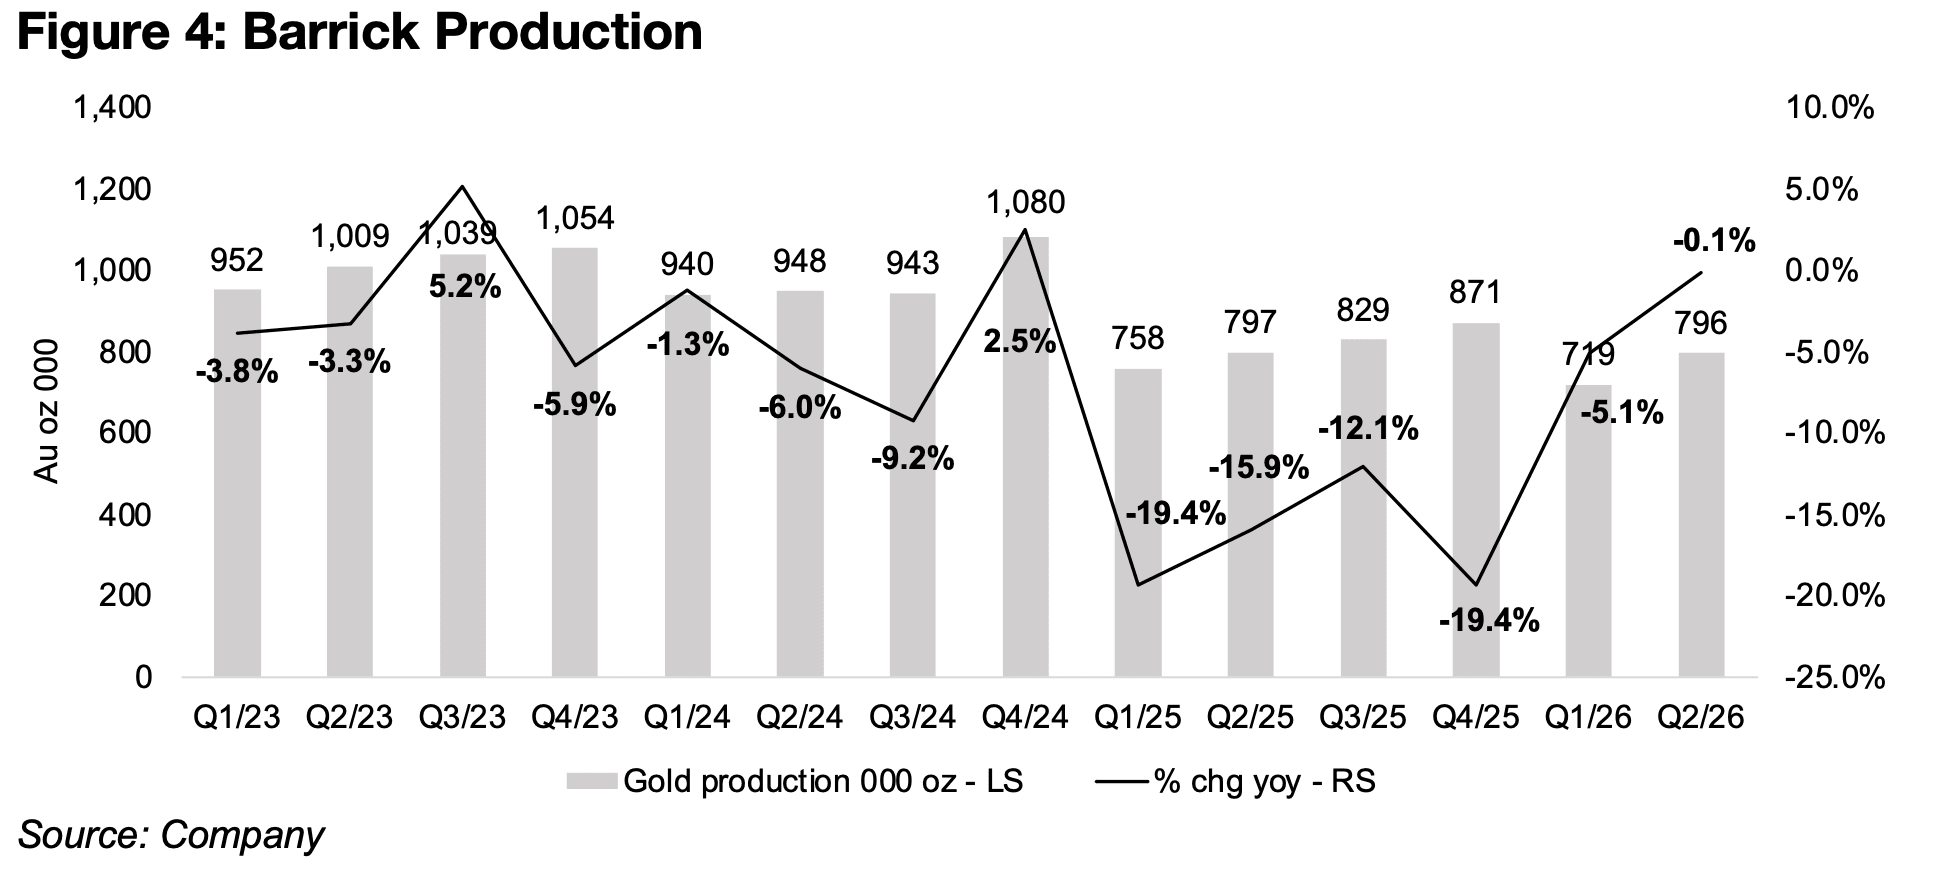
With Barrick reporting Q2/26 earnings over the past week, the results season is nearly
complete, with only Gold Fields still to report, near the end of August 2026. Barrick’s
results were ahead of the other majors significantly in terms of production growth,
which was actually flat yoy, down just 0.1% to 796k oz Au, versus a large decline for
the others (Figure 4). This is a major recovery from its lowest recent growth rate of -
19.4% in Q4/25, with the decline easing to -5.1% in Q1/26. The company’s gold
production has seen a decline from Q1/25 to an average of just under 800k oz Au per
quarter, versus the 2023 to 2024 average of just under 1,000k oz Au.
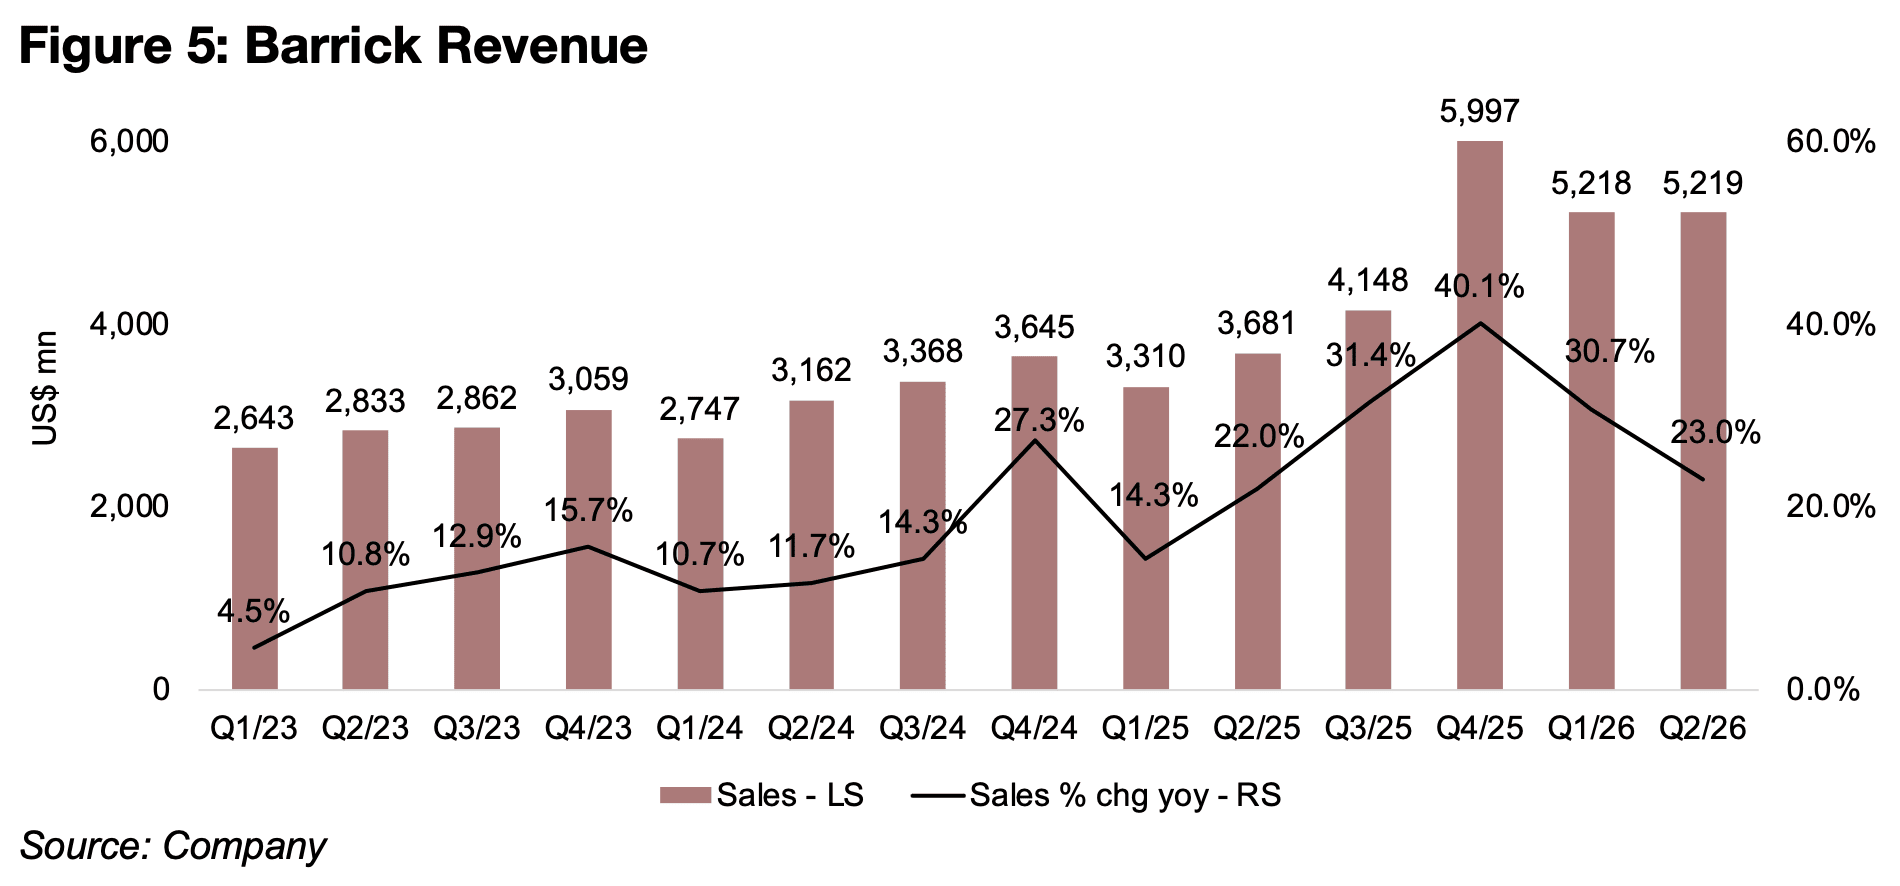
Even as the realized gold declined qoq, revenue was nearly flat at US$5.22bn, still
down from the US$5.98bn peak in Q4/25 (Figure 5). However, the growth rate has
declined yoy to 23.0%, down from 30.7% in Q1/26 and a 40.1% peak in Q4/25.
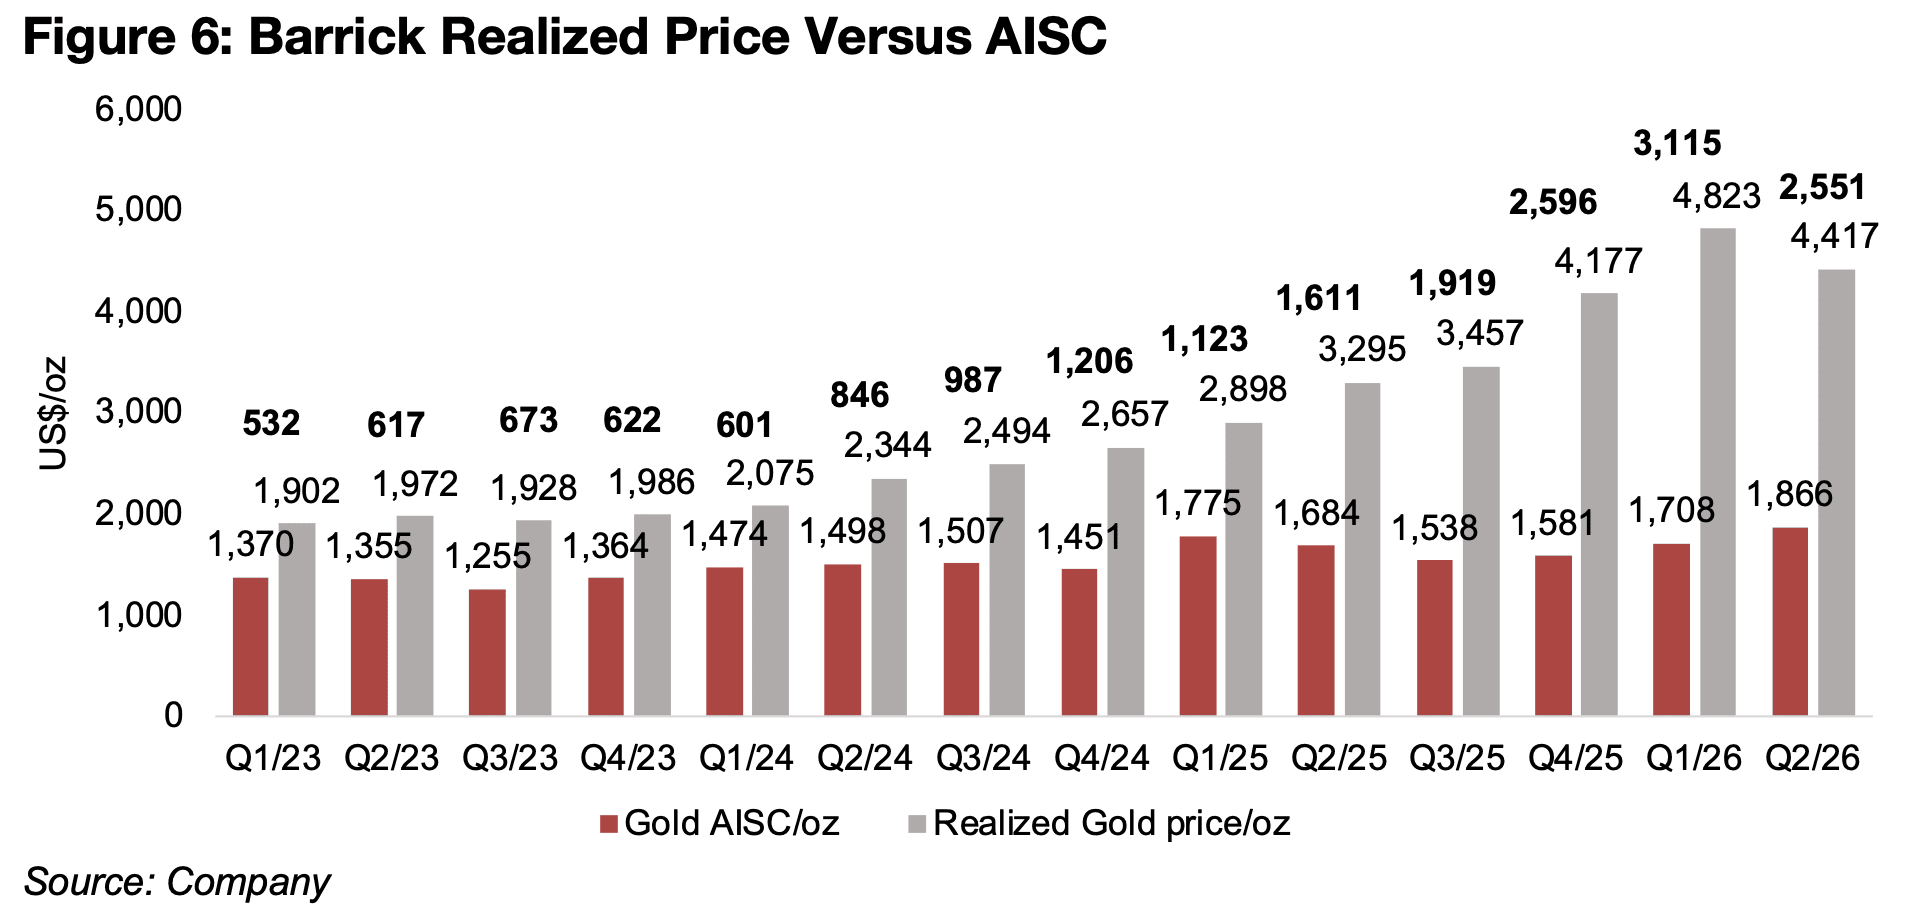
However, the growth was still substantially above the levels from 2023 to 2024. Costs
have increased substantially to US$1,866/oz, up qoq from US$1,708/oz in Q1/26 and
yoy from US$1,684/oz (Figure 6). However, this was far outpaced by the rise in the
realized gold price yoy to US$4,417/oz from US$3,295/oz in Q2/25, for an increase
in the spread to US$2,551/oz from US$1,611/oz.
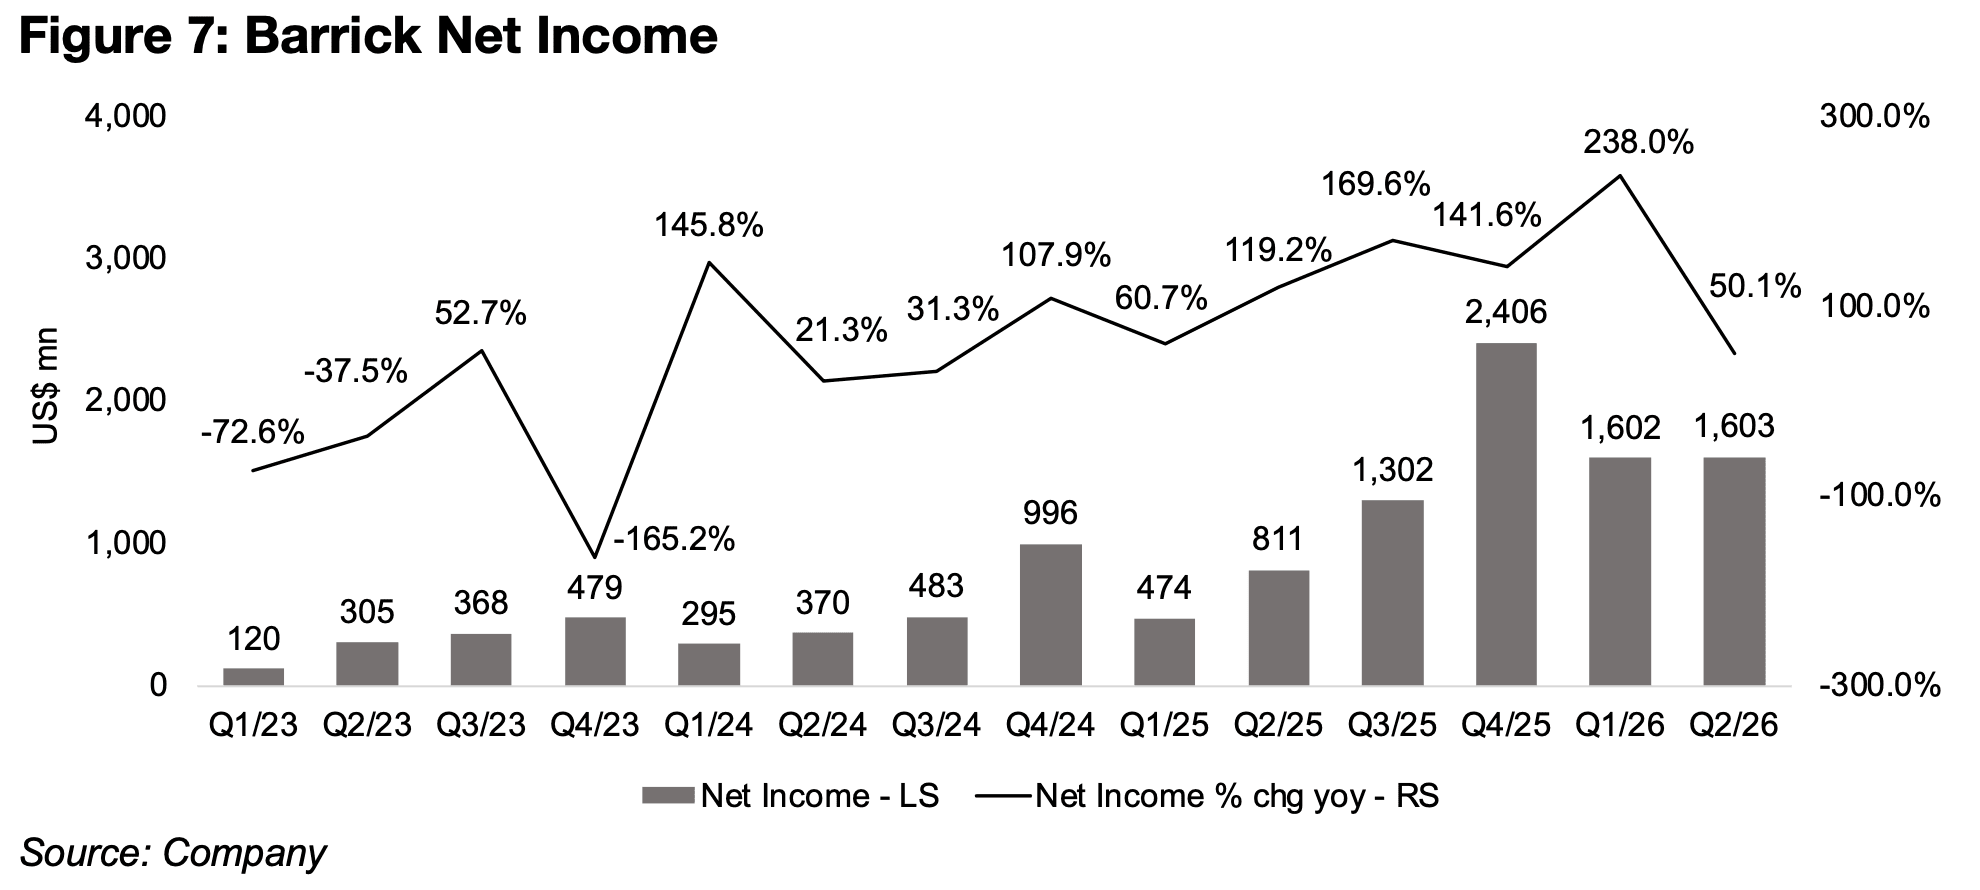
Net income was almost exactly flat qoq at US$1,603bn, but down from the US$2,406bn from Q4/25, with the growth rate yoy declining to 50.1%, its weakest since the 31.3% of Q3/24 (Figure 7). The company had seen extraordinary items hit net income in some quarters from 2023 through to early 2025.
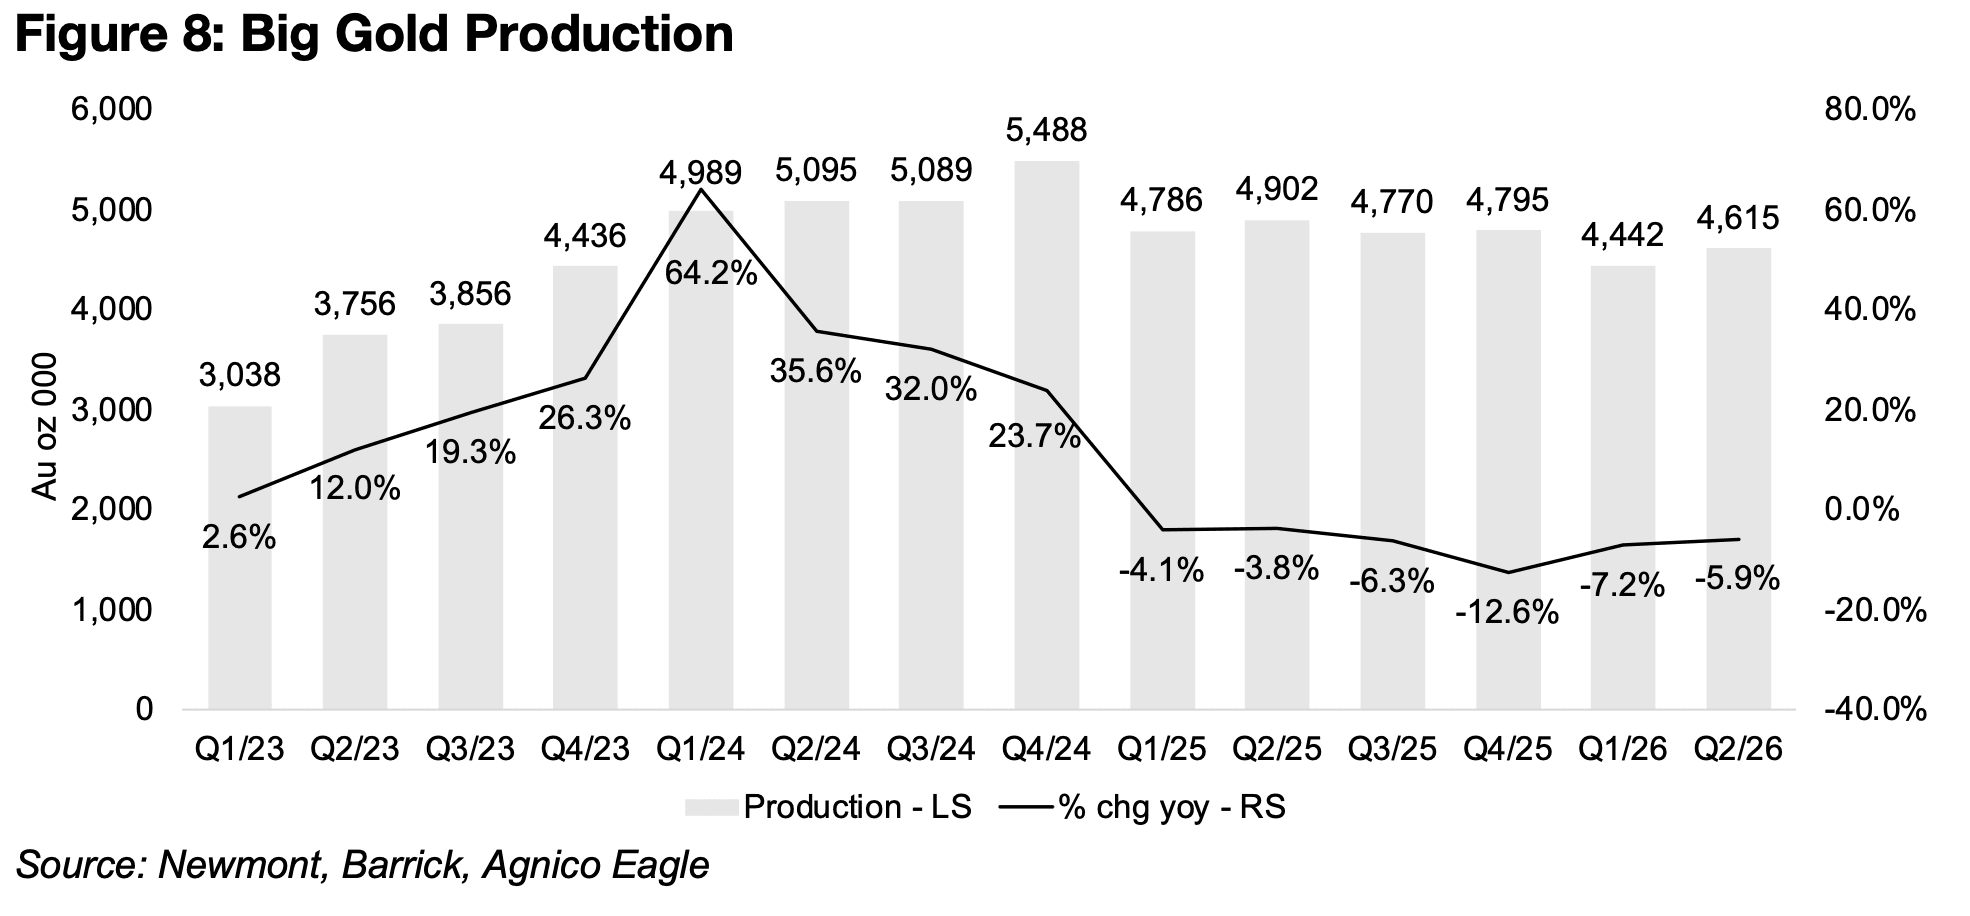
With the largest Big Gold companies, Newmont, Barrick and Agnico Eagle having now all reported Q2/26, we can look at broader industry trends. The biggest hurdle remains the decline in production yoy since the start of Q1/25, although this has eased over the past quarters from lows of -12.6% in Q4/25 to -5.9% in Q2/26 (Figure 8). However, it is still well off the rates during production growth boom from around Q3/23 to Q4/24. Production also actually picked up qoq in Q2/26 to 4,615k oz Au, up from 4,442k oz Au in Q1/26, which was the lowest level since Q3/24.
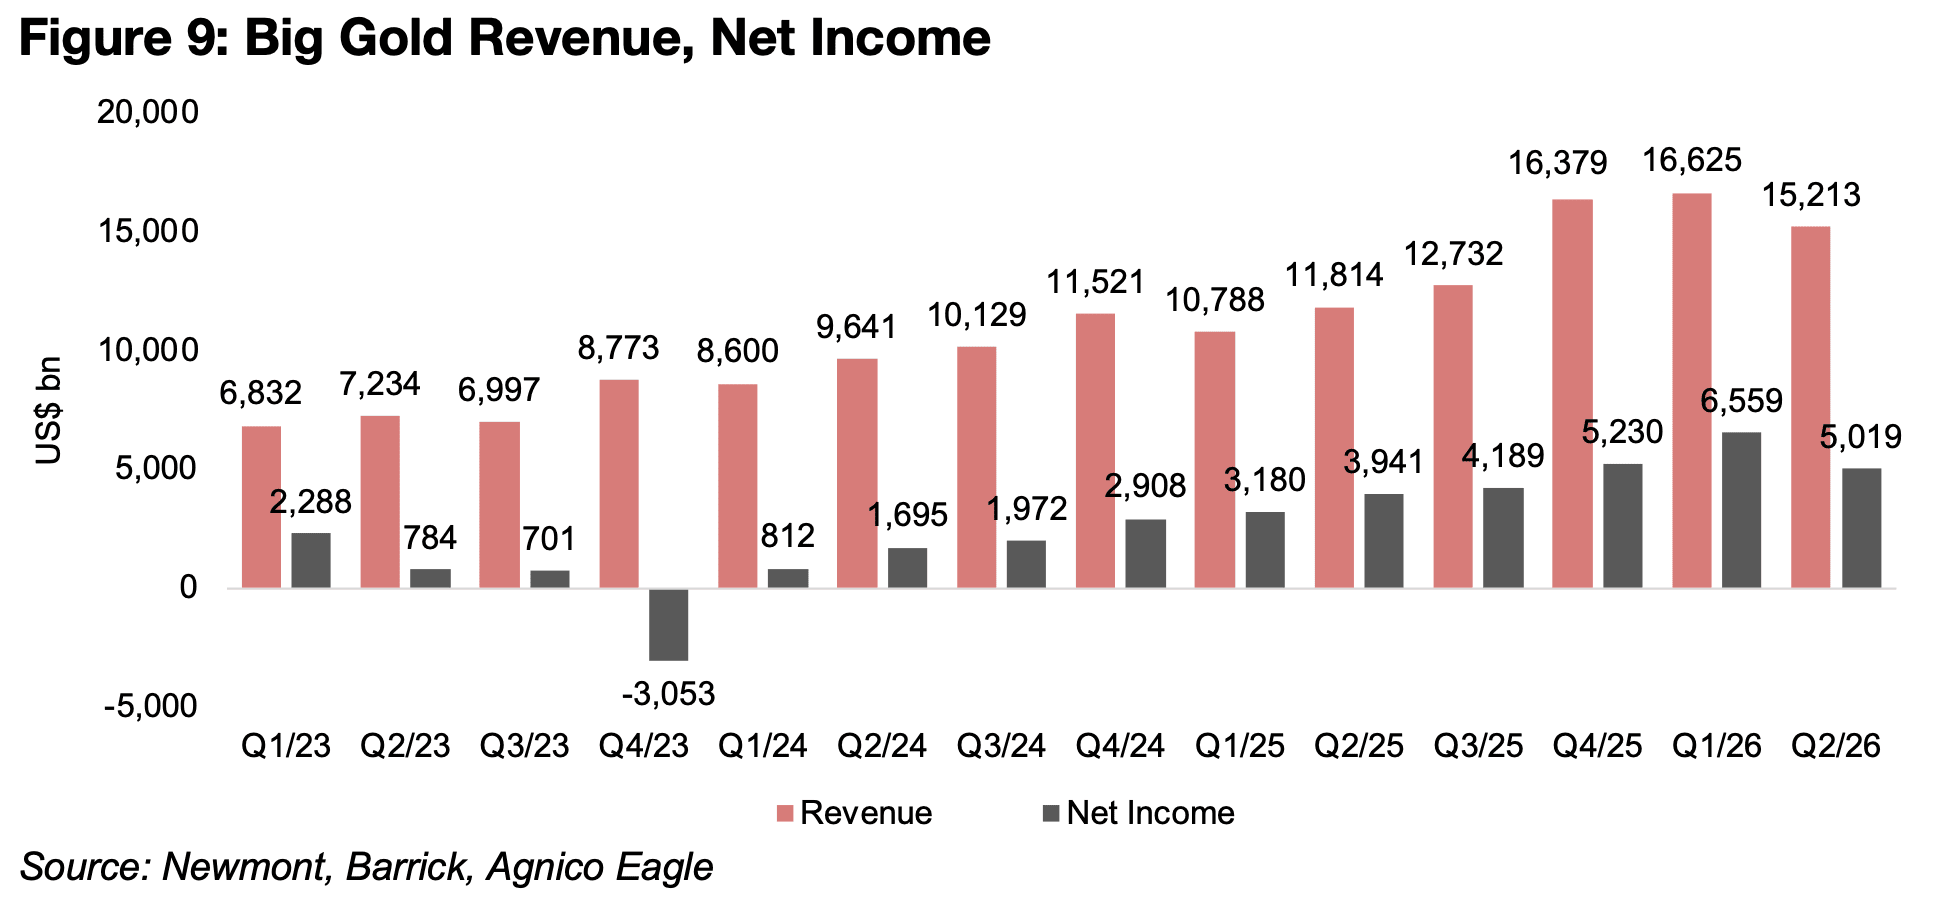
Big Gold’s revenue in Q4/25 and Q1/26 clearly stand out at over US$16.0bn given
the surge in the gold price during these periods, and if we consider them outliers, the
Q2/26 seems to show a return to a previous uptrend from Q1/23 through to Q4/25
(Figure 9). Net income for the sector shows a similar trend, with it last hit by a major
exceptional item in Q4/23, and then steady growth qoq from Q1/24 to Q3/25, and an
outstanding jump in Q4/25 and Q1/26 before the decline in Q2/26 seems to show a
return to the previous trend.
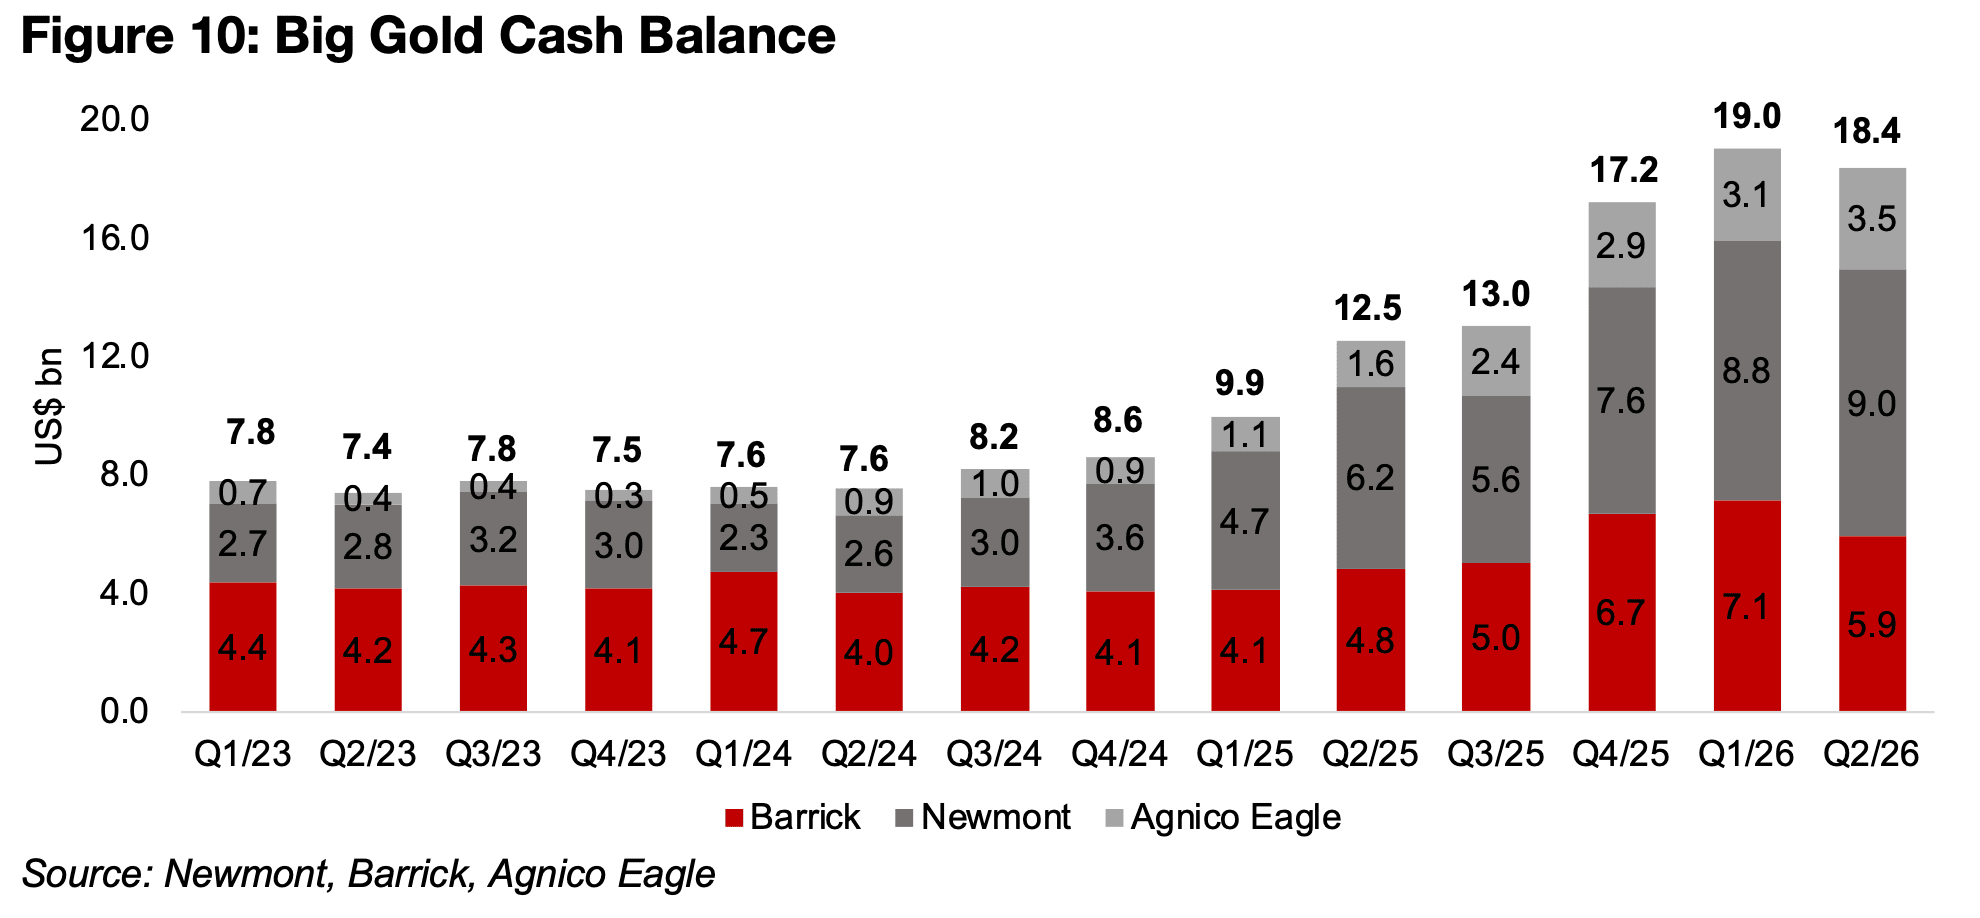
While Big Gold’s total cash did decline qoq to US$18.4bn from its US$19.0bn peak,
is it still up from US$17.2bn in Q4/25, and yoy has increased by nearly US$6.0bn
(Figure 10). Newmont has the largest cash at US$9.0bn, around the same as the other
two companies together, with Barrick at U$5.9bn and Agnico Eagle at US$3.5bn.
This has a strong implication for junior mining financing, as it would take considerable
time for the companies to pay out a large proportion of this cash in dividends. Even
if the companies decided on a large return of cash to shareholders, some of this is
very likely to go towards acquisitions, especially given the large decline in production
growth for the companies. They will be looking to replenish reserves, and while some
of the companies are doing substantial exploration, there are likely to be many
attractive targets to buy currently, especially given the relatively low valuations of the
gold sector.
The majors may have been less dissuaded from large investments in the sector,
especially compared to the short-term speculators that entered the market in late
2025 and early 2026, given that they will be considering a much longer-term horizon
for the industry. We estimate that with their current cash the three companies could
purchase over 70% of the market cap of the TSXV gold miners, and that especially
reasonably sized producers and developers with reasonably advanced projects could
be potential targets for the majors.
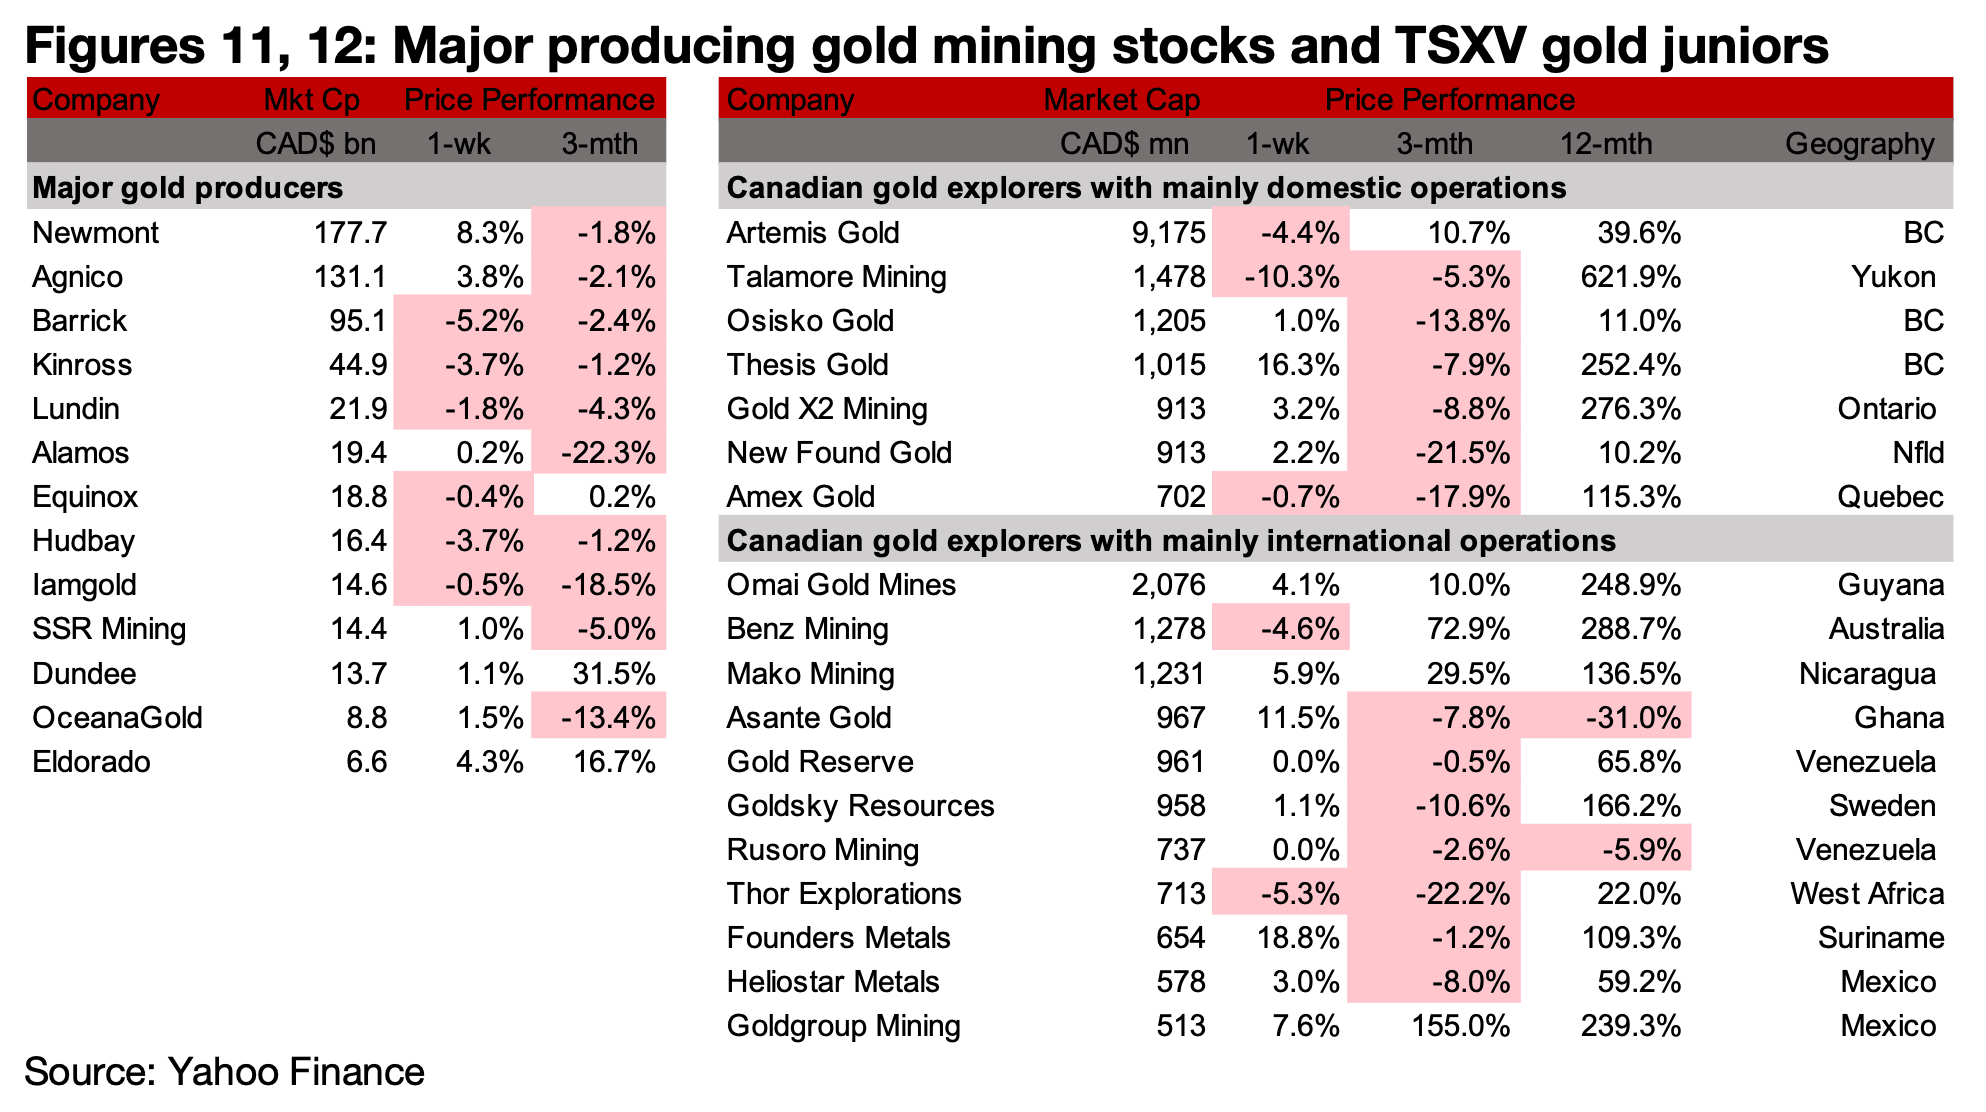
The major producers were mixed as the sector consolidated some its huge gains
from last week, while most of large TSXV gold rose (Figures 11, 12). For the TSXV
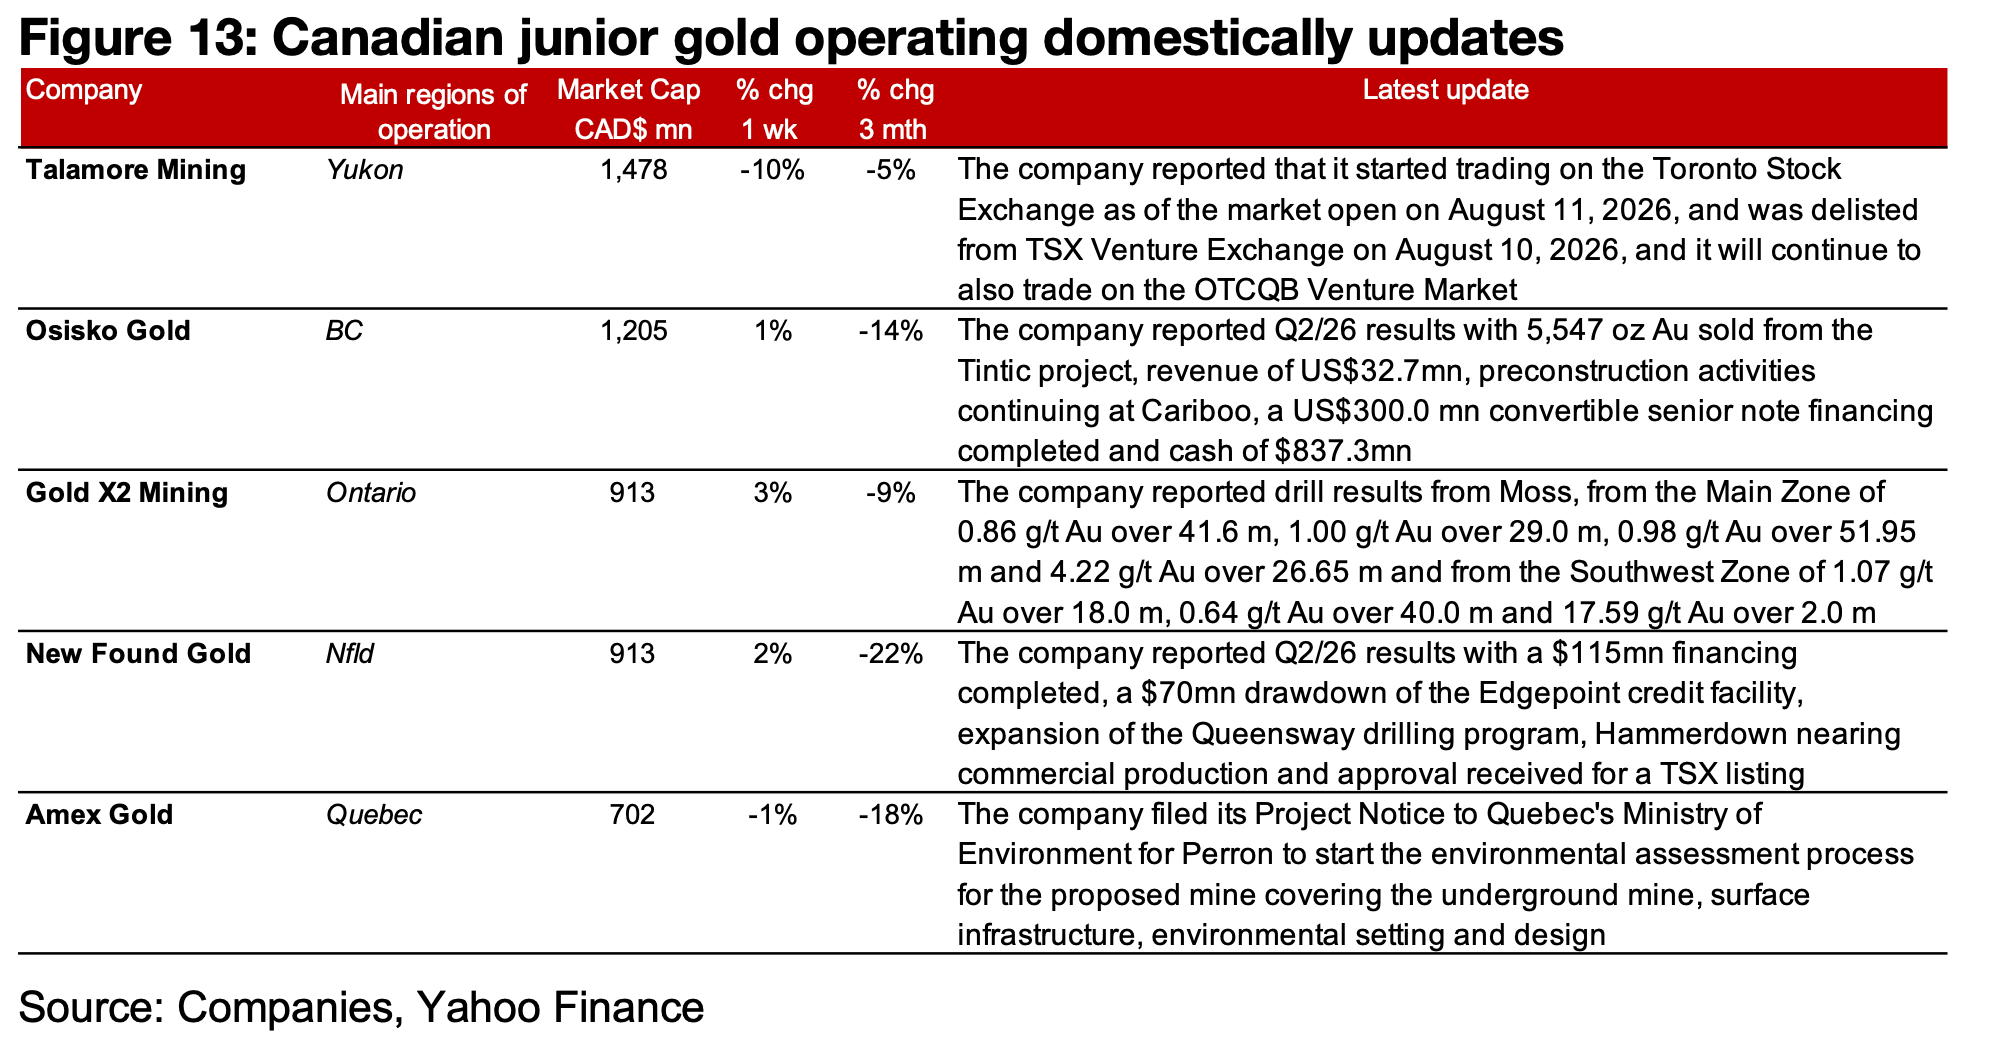
gold companies operating mainly domestically, Talamore began trading on the
Toronto Stock Exchange, Osisko Gold reported Q2/26 results including sales from
Tintic, Gold X2 announced drill results from Moss, New Found Gold reported Q2/26
results and Amex Gold filed its Project Notice for Perron to Quebec’s Ministry of
Environment (Figure 13).
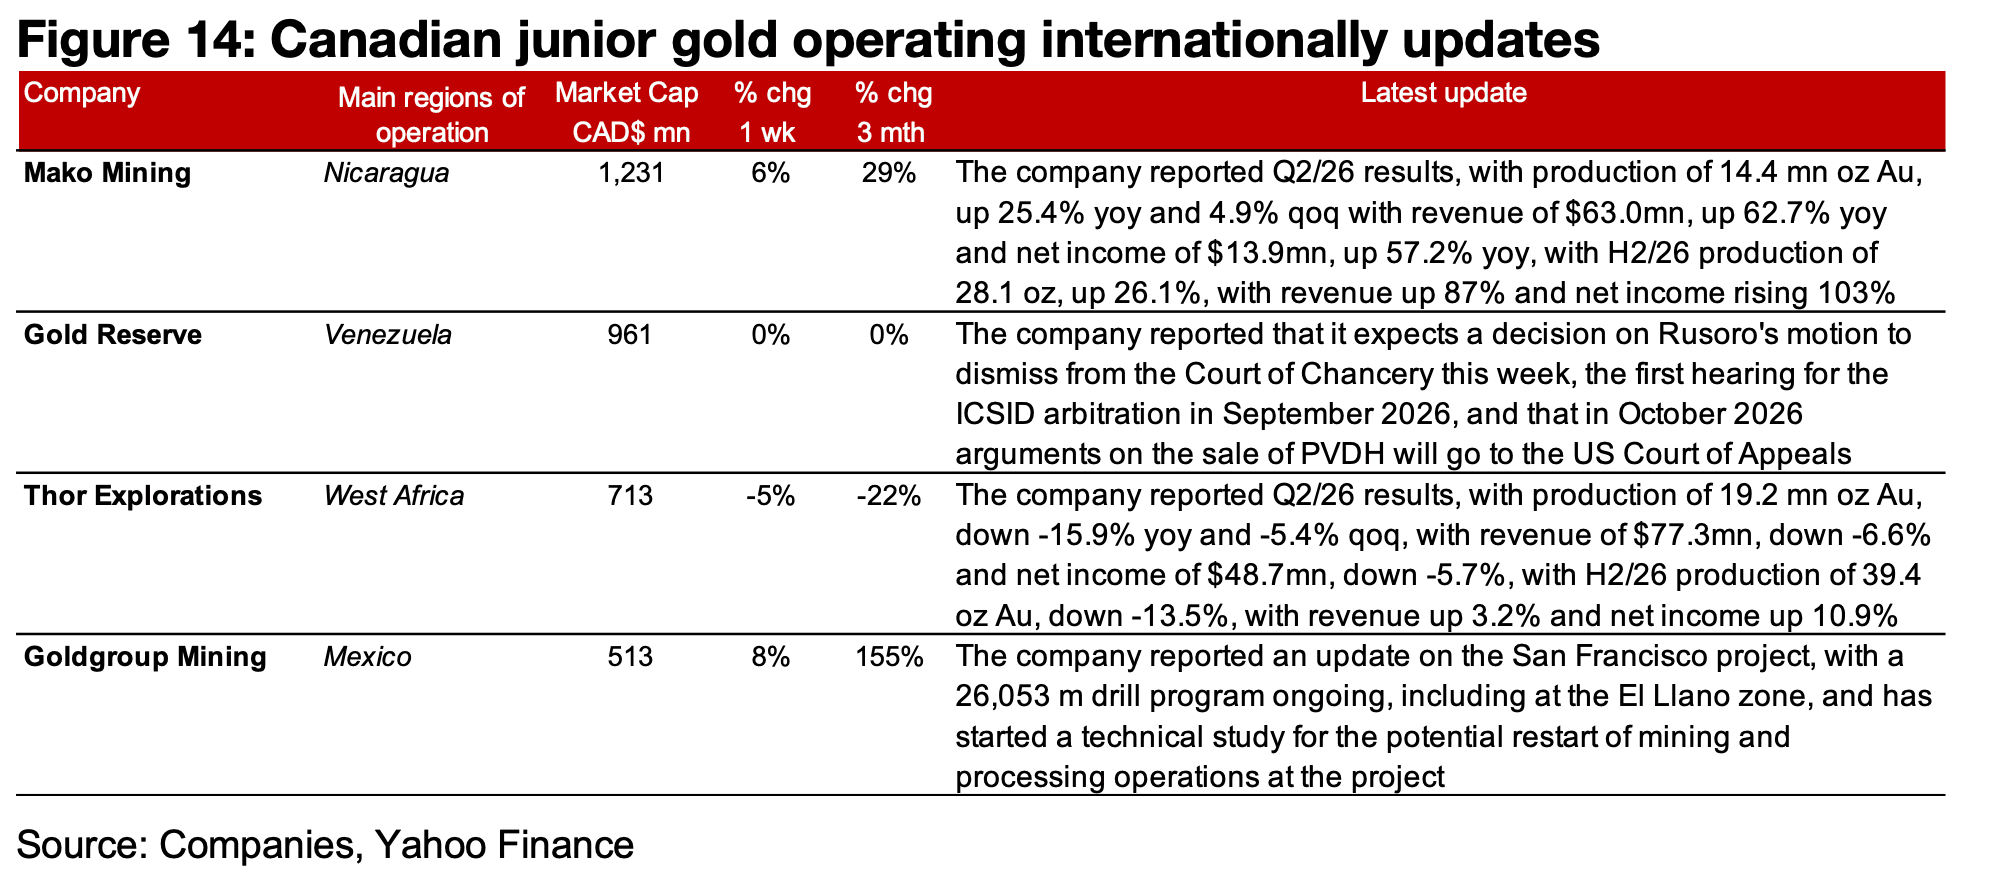
For the companies operating mainly internationally, Mako Mining reported Q2/26
results, Gold Reserve provided an update on its legal proceedings, including a
decision on its motion to dismiss from the Court of Chancery, the ICSID arbitration
hearings and arguments on the sale of PVDH at the US Court of Appeals, Thor
Explorations reported Q2/26 results, and Goldgroup reported an update on the San
Franciso project (Figure 14).
Disclaimer: This report is for informational use only and should not be used an alternative to the financial and legal advice of a qualified professional in business planning and investment. We do not represent that forecasts in this report will lead to a specific outcome or result, and are not liable in the event of any business action taken in whole or in part as a result of the contents of this report.
Author
Ben McGregor authors the Weekly Roundup at CanadianMiningReport.com, providing sharp analysis of the metals and mining sector. With a talent for spotting trends, Ben distills complex market shifts into clear, engaging insights on TSXV junior miners. His weekly updates cover gold, copper, uranium, and more, blending data-driven perspectives with a knack for identifying opportunities. A vital resource for investors, Ben’s work navigates the dynamic junior mining landscape with precision.