
June 01, 2026
Minera Alamos expects a major expansion in production from 11k oz Au in 2025 to 35k oz Au in 2026E with the first full year of production from the Pan mine, acquired in Q4/25, which could rise to 72k oz Au in 2027E as two other mines start operating.
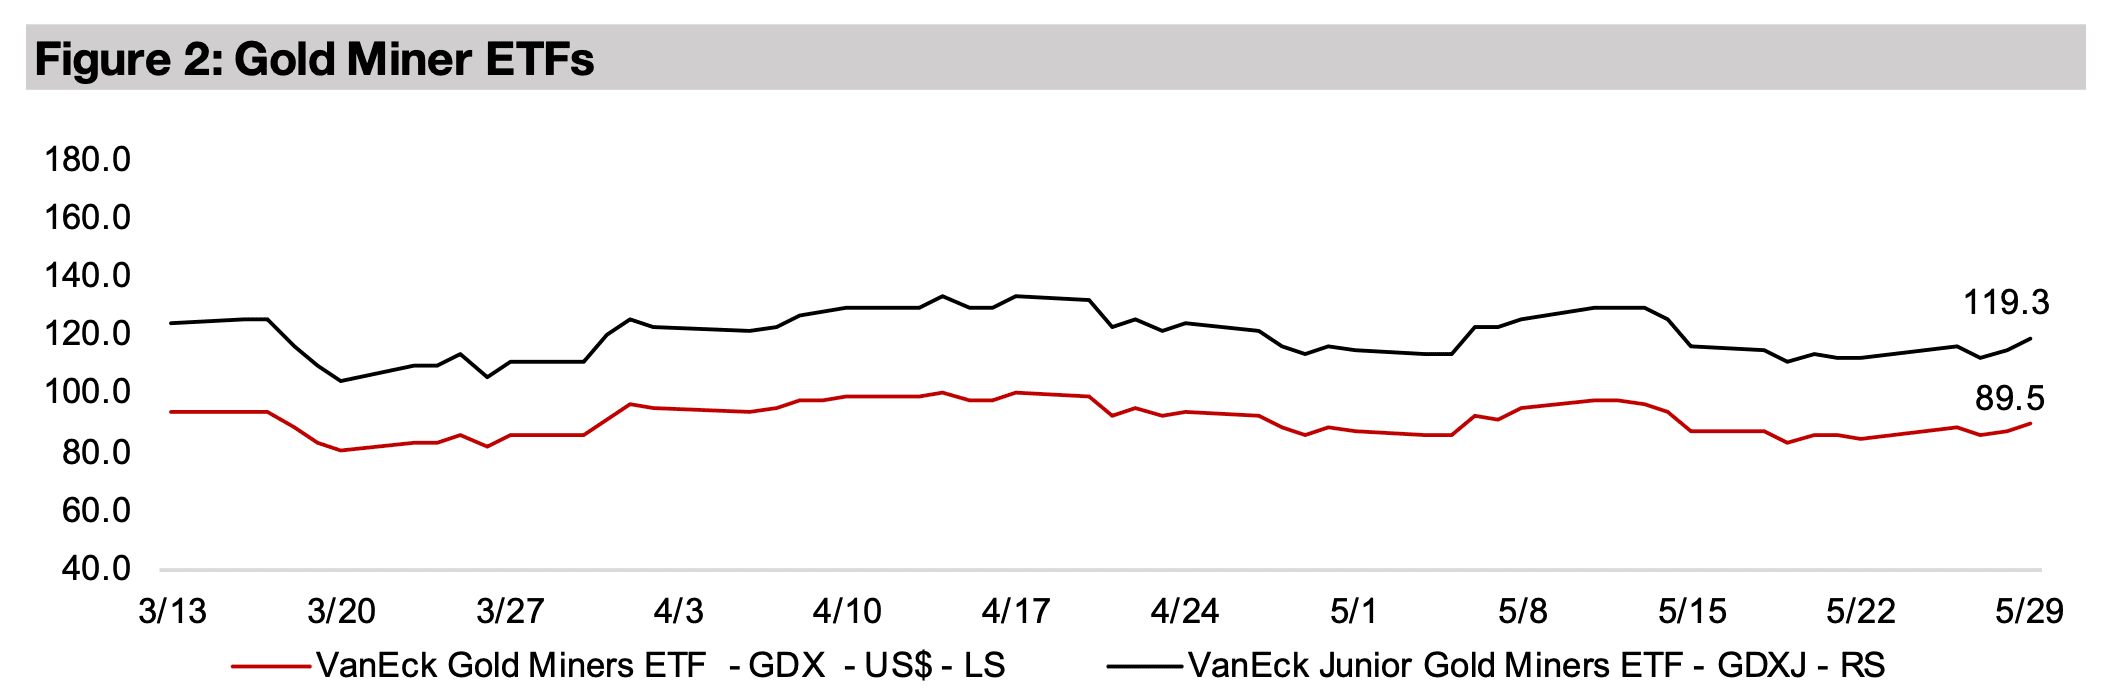
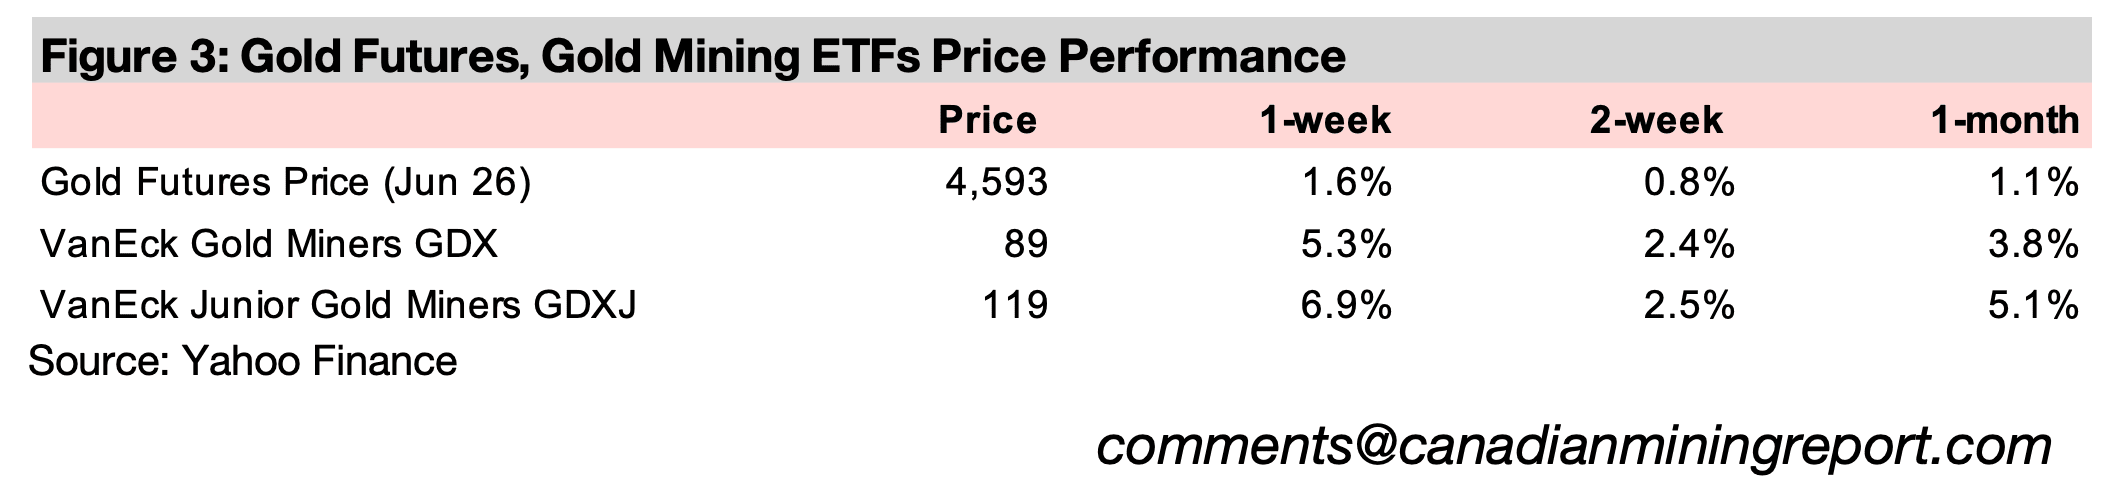
The gold stocks gained on the metal price, with the GDX up 5.3% and GDXJ rising 6.9%, while equities continued to soar, with the S&P 500 up 1.5%, the Nasdaq rising 2.2% and Russell 2000 gaining 2.3%, with valuations at historical highs.


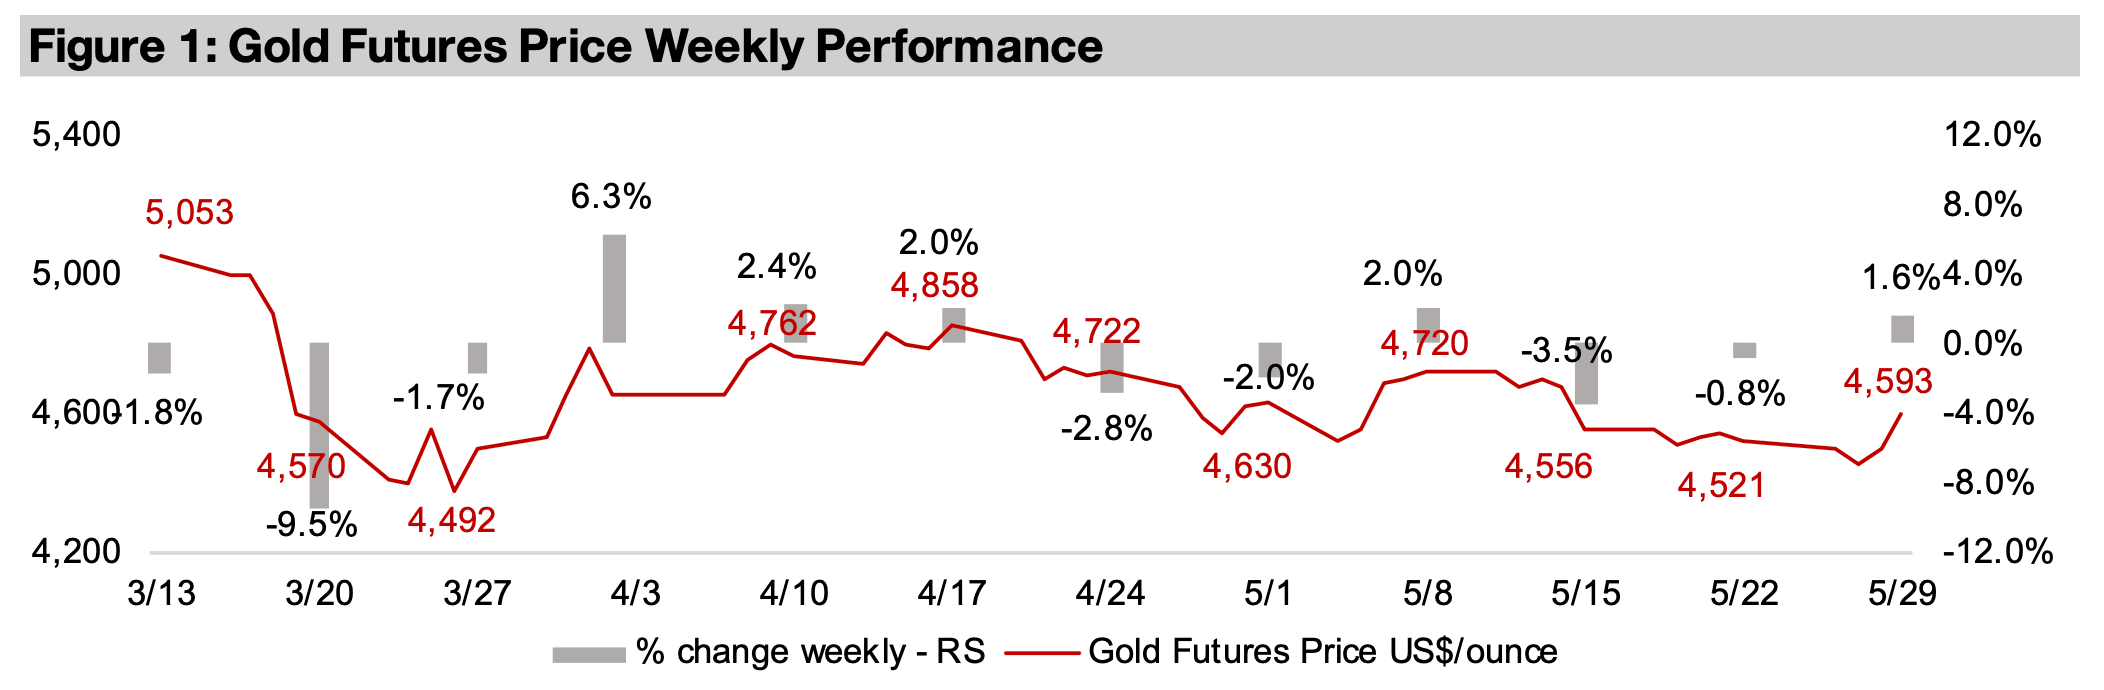
The gold price rose 1.6% to US$4,593/oz, as both the US$ and yields, which tend to
move inversely to metal but are also viewed as safe havens, declined significantly on
some signs of progress in peace talks between the US and Iran. Oil prices also
dropped significantly, which implied a reduction in both the inflationary pressures and
the overall disruption of many economies caused by limits on imported fuel since the
start of the war. The decline in both geopolitical and economic risks, especially
inflation concerns, might have been expected to actually put downward pressure on
gold, offsetting even the boost from the lower US$ and yields. However, with gold
having declined last week towards its lows for the year, the markets may have viewed
it as already sufficiently pricing in the downward risks to the metal.
Markets have also tended to purchase gold as a hedge even in strong risk-on periods
since around 2025, and this trend has likely continued. Even if there is an end to the
conflict and oil prices return to their previous levels, there are still the substantial
imbalances in the global economy that existed prior to the war which remain major
risks. One of these is certainly the high valuations in many global equity markets,
which increased further this week as a two-month rally in markets continued, with the
S&P 500 up 1.5%, Nasdaq rising 2.2% and Russell 2000 adding 2.3%, and all three
hitting new all-time highs.
This has seen a key valuation measure, market cap to GDP, jump to 238% in the US,
by far its highest level ever, and up from just 146% in 2022 (Figure 4). This has been
driven especially by the tech sector, which is now by far the largest of the S&P 500,
at 38% of the market cap. The US tech sector price to book valuation of 12.9x is still
extreme, at well over twice the level of the next three highest sectors, industrials,
healthcare, consumer staples and industrials, at 5.6x, 4.5x and 3.9x.
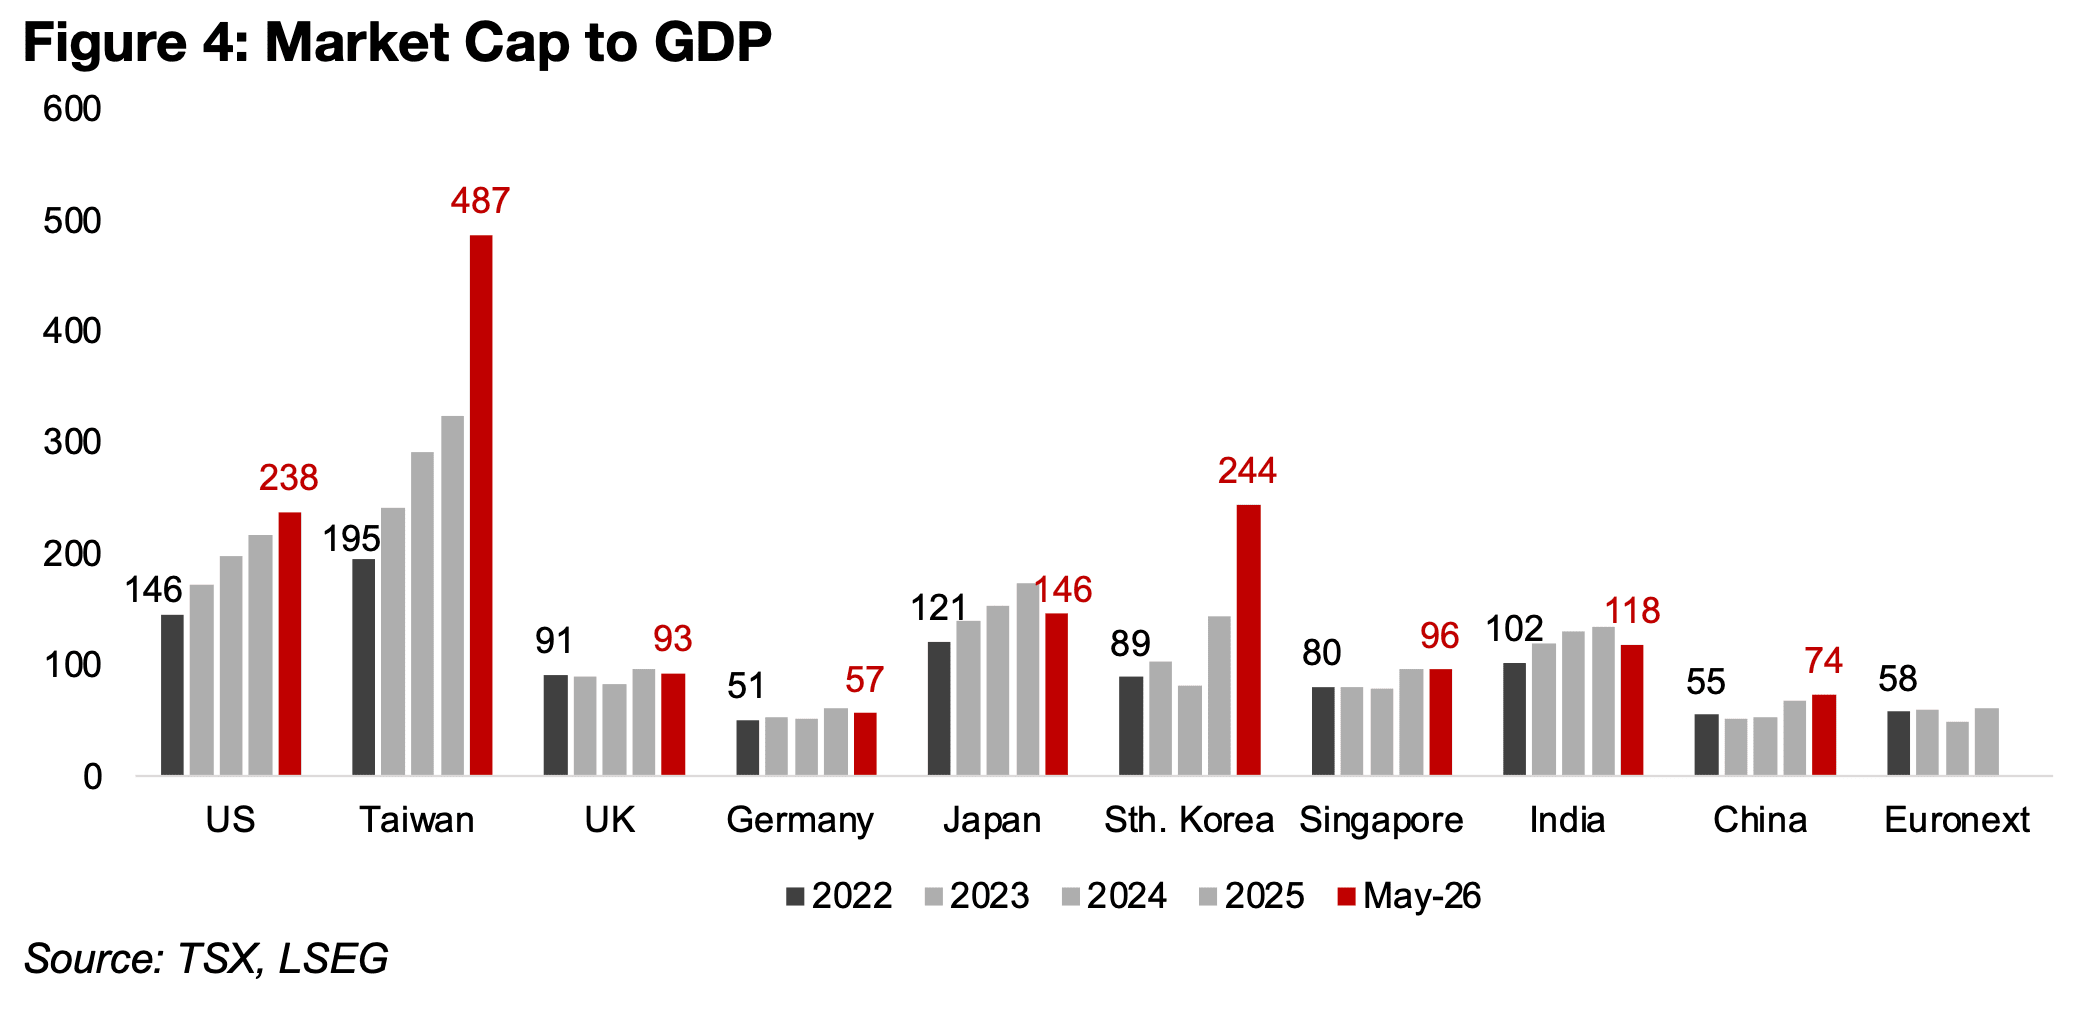
However, the rise in the US market to GDP has been far outpaced by the jump
especially in Taiwan, to 487%, up from 195% in 2022, but also South Korea, to 244%,
up from just 89%. This has been driven especially by the major AI chip companies in
these countries, where the concentration of their equities markets in tech is far higher
than even the US, with sector at 52% of the South Korea market cap and 77% for
Taiwan. This has seen the concentration of global tech gains shift to these two
countries this year after the US and China lead the sector in 2025.
While the market cap to GDP of the UK, Germany, Japan, Singapore, India, and China
have all risen from 2022 to 2026, the increase has been much more moderate, and
several have actually seen their ratios decline this year from peaks in 2025. Many of
these countries are not heavily exposed to the tech or AI boom, with the sector at
16.2%, 11.9%, 7.2%, and 1.1% of the market caps of Germany, China, India and the
UK. However, the lack of AI-related tech exposure and historically exaggerated
valuations could cushion these markets if the bubble in the sector bursts, as seems
to be an increasing risk.
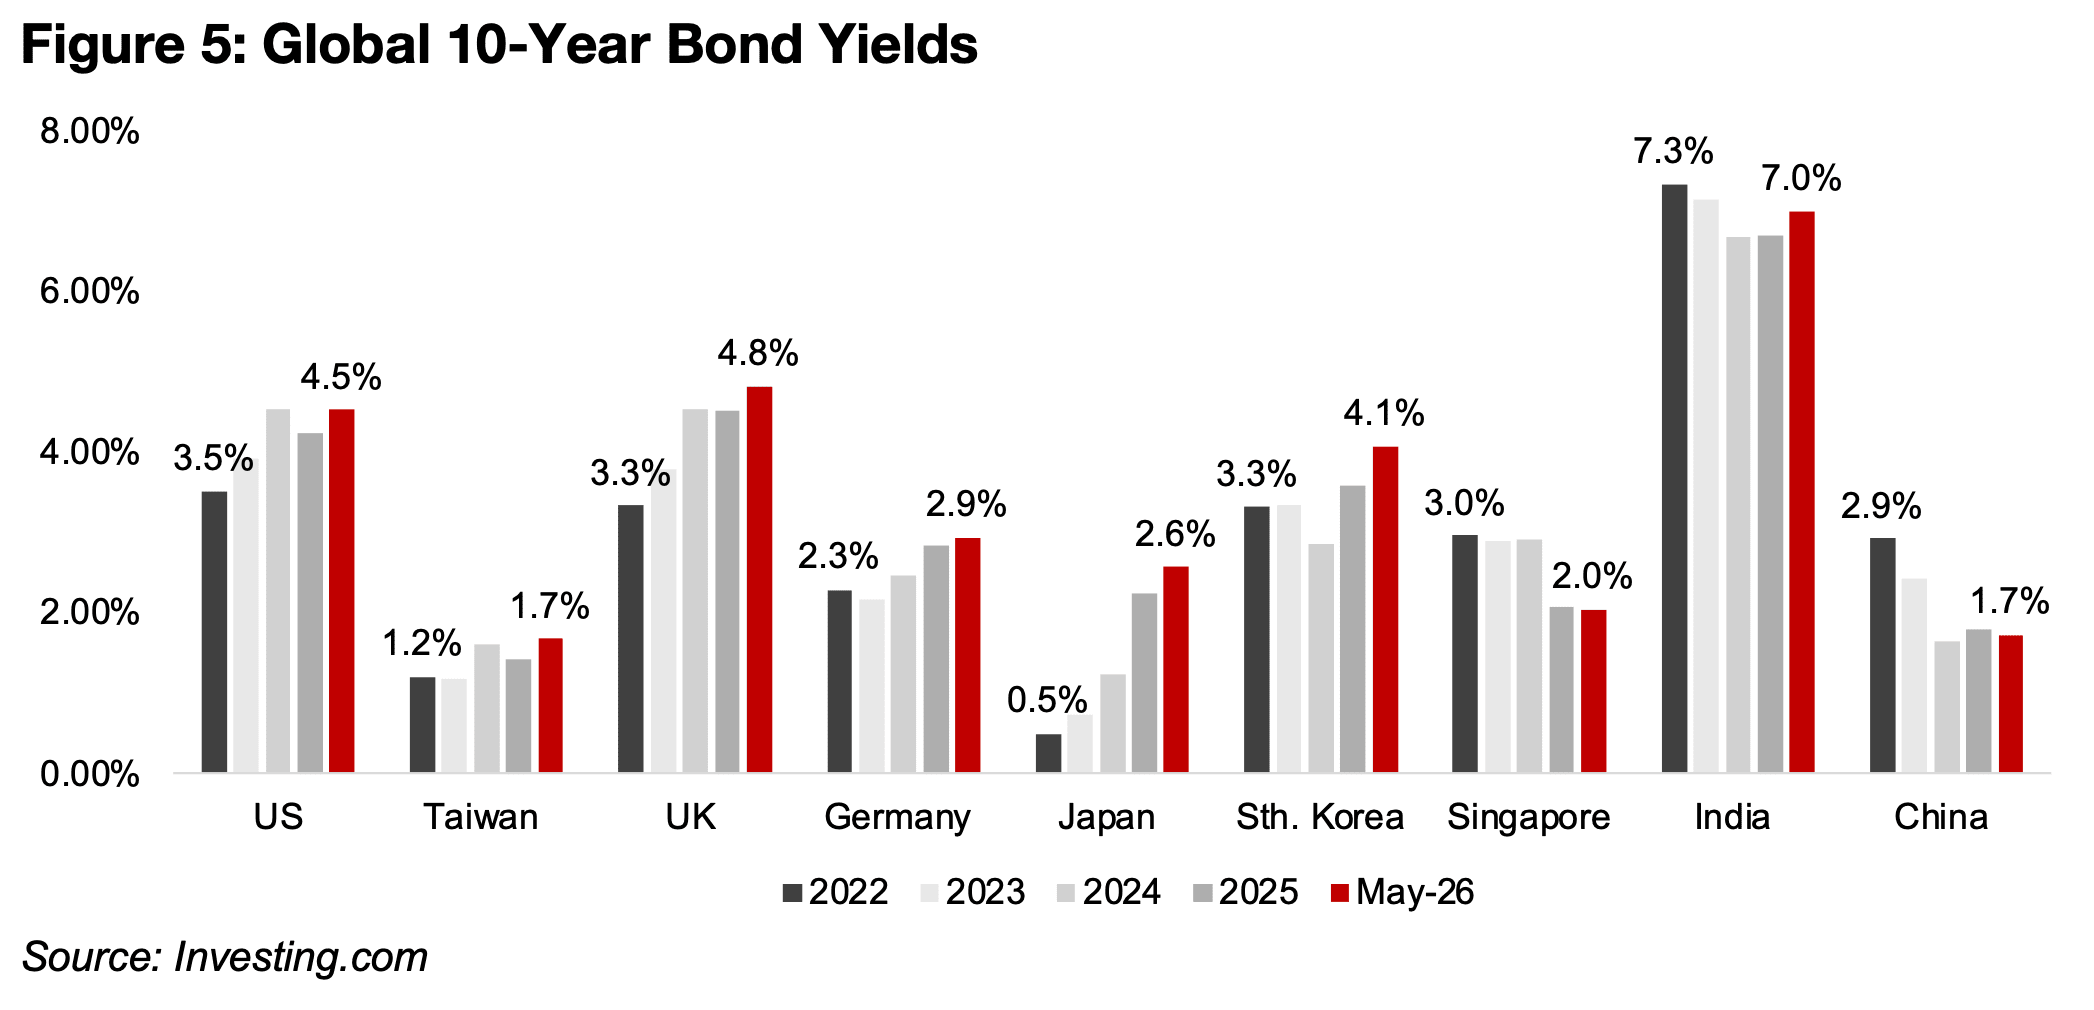
This is partly because of surging global yields, which can put major pressure on markets in several ways, including higher discount rates lowering valuations, rising rates increasing the debt burden of corporations with high debt loads and reducing earnings and discouraging investment even by companies with lower debt. There have been significant jumps in yields since 2022 for most of the major economies, with only China declining significantly, India near flat, and Singapore down substantially, but it only a small contributor to global GDP (Figure 5). Historically the 5.0% mark in yields has often been viewed as a trigger for a pullback in stock markets, with the US and the UK markets the closest this this level.
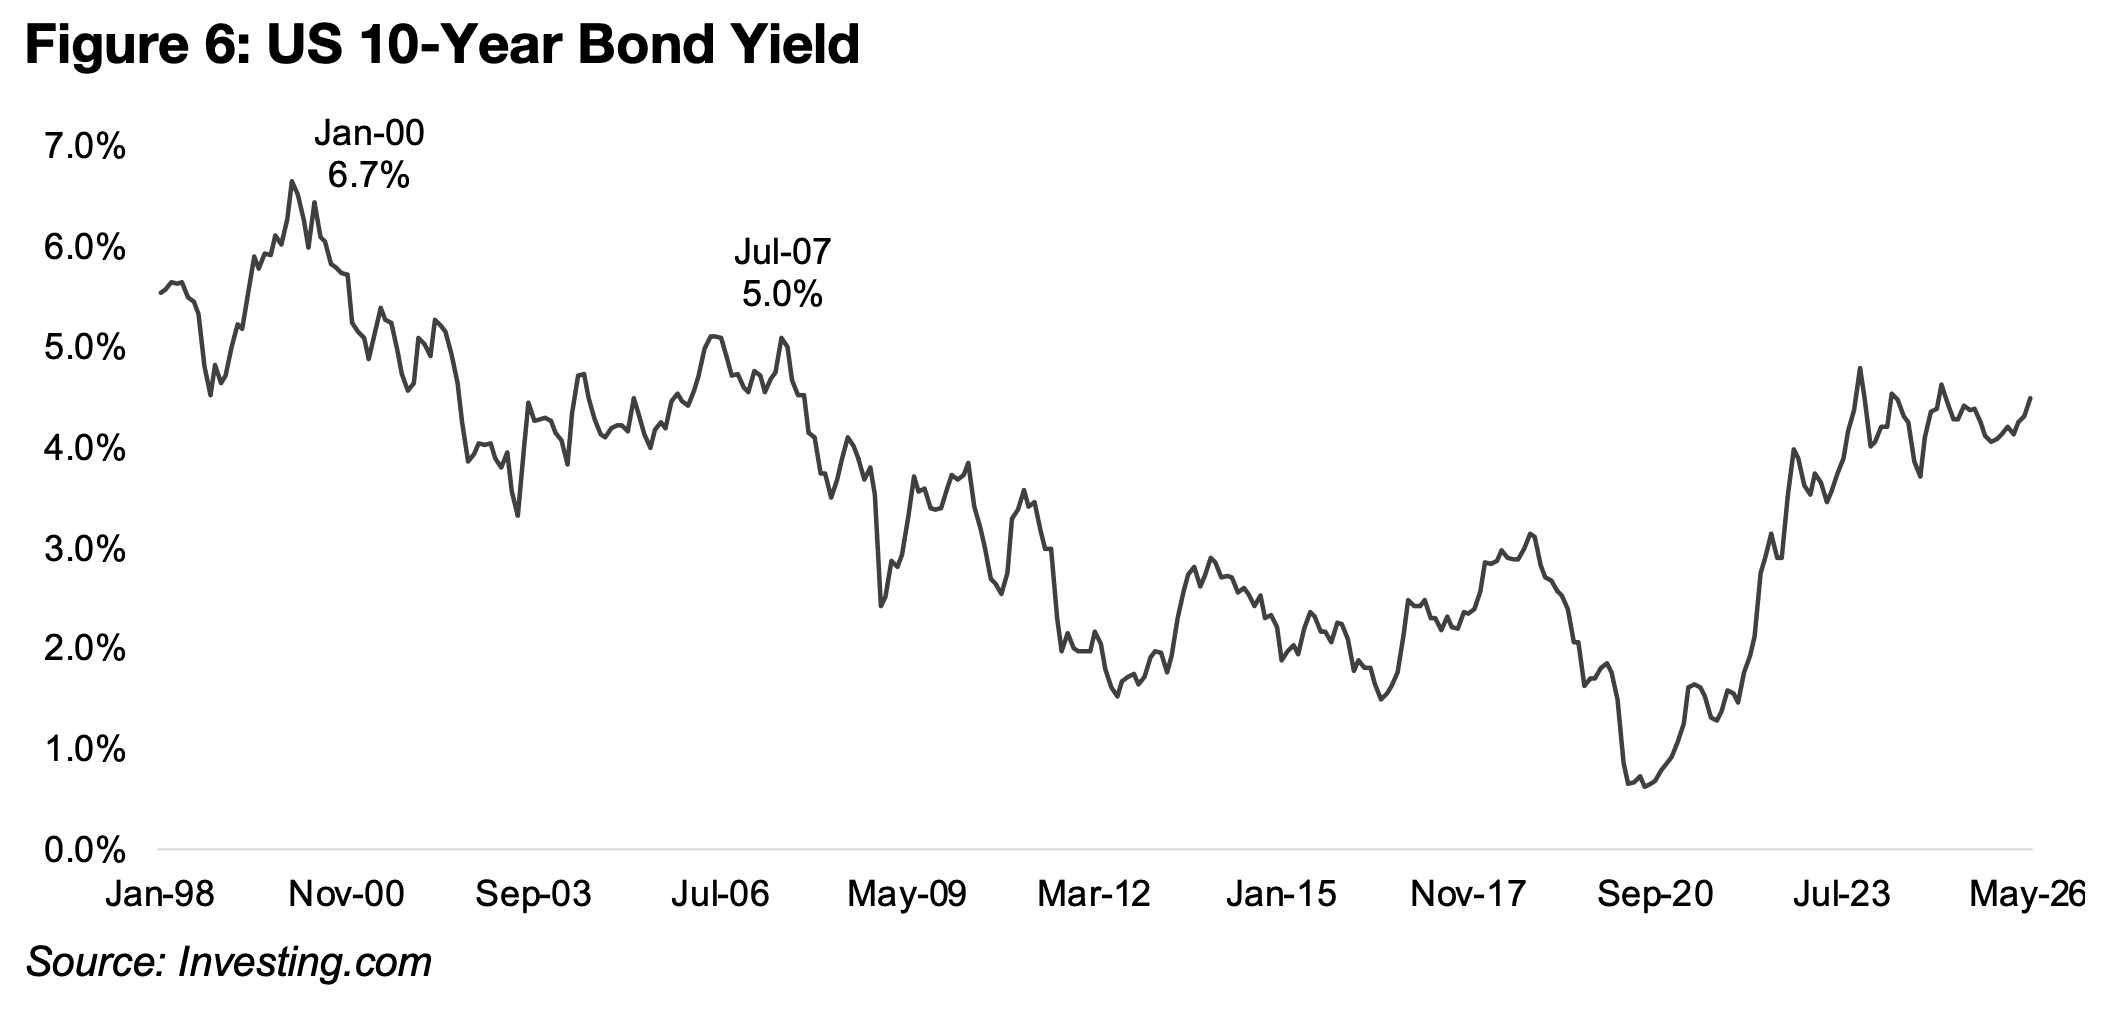
The market crash starting in April 2000 came after the 10-year bond yield in the US
jumped substantially in a relatively short period from 4.5% in October 1998 to 6.7%
in January 2000 (Figure 6). The global financial crisis started about a year after the
US 10-year yield peaked at 5.0% in July 2007. While the market crash in 2020 was
actually preceded by a year of declining in interest rates in 2019, it was driven by the
external shock of the global health crisis, and not the usual economic issues.
While Japan yields is only at about half the 5.0% level, at 2.6%, as it has had
historically much lower average rates, this level could still be an issue, as borrowing
cost have risen effectively over five times from 0.5% in 2022 to 2.6%. This is by far
the most of all these economies, with borrowing costs in the US, UK, Germany,
Taiwan and South Korea up only 29%, 45%, 29%, 39% and 23% from 2022.
One of the most basic effects of higher yields on equities is from the math of
valuations, with a company’s market cap comprising the expected cash flows divided
by the discount rate. Bond yields are a key part of this discount rate, and as they rise,
this divisor also increases, lowering total cash flows and therefore the value of the
company. While this effect of higher discount rates can be offset by higher cash flows,
the market is becoming increasing skeptical of the sustainability of AI earnings.
There is also the issue that rising yields mean higher corporate borrowing costs, and
a huge amount of debt has been driving the continued investment in AI that has in
turn been supporting the stock market. Many of the major AI companies are not
profitable and could need to continue increasing debt to maintain operations,
increasing the burden from the borrowing on the financial performance.
This could lead to risking bankruptcy risks, and if clear signs do appear that the AI
bubble is slowing, there could be a widespread panic given the current heavy
extension of credit to the sector. This could of course pull down the US and the AIdriven Asian markets down significantly, with a decline especially the former likely to
have a major fallout for the rest of the world as the US is such a large global investor.
The higher rates also affect corporate investment, with companies valuing potential
projects similar to the way equities are valued, and the rising discount rate, lowering
the potential value. This could lead to some projects not being undertaken that would
have been with lower interest rates, and dampening economic activity. Also, when
companies have lower stock prices, they may be less likely to do M&A.
Consumption could also take a hit if higher yields eventually reduce stock market
valuations, through the wealth effect. While high stock prices drive a higher perceived
spending power for consumers and encourages purchases, this can go into reverse
as stocks decline, with both consumers and corporations seeing less perceived
wealth and potentially pulling back on purchases or investment projects.
However, all of these problems may actually be good for gold. The very likely reaction
to an AI-debt crisis, plunge in the stock market and lower economic growth, is for
central banks to cut rates and expand the money supply, which is the main driver for
gold. The metal could also benefit from an overall flight to safe-haven assets in this
type of scenario
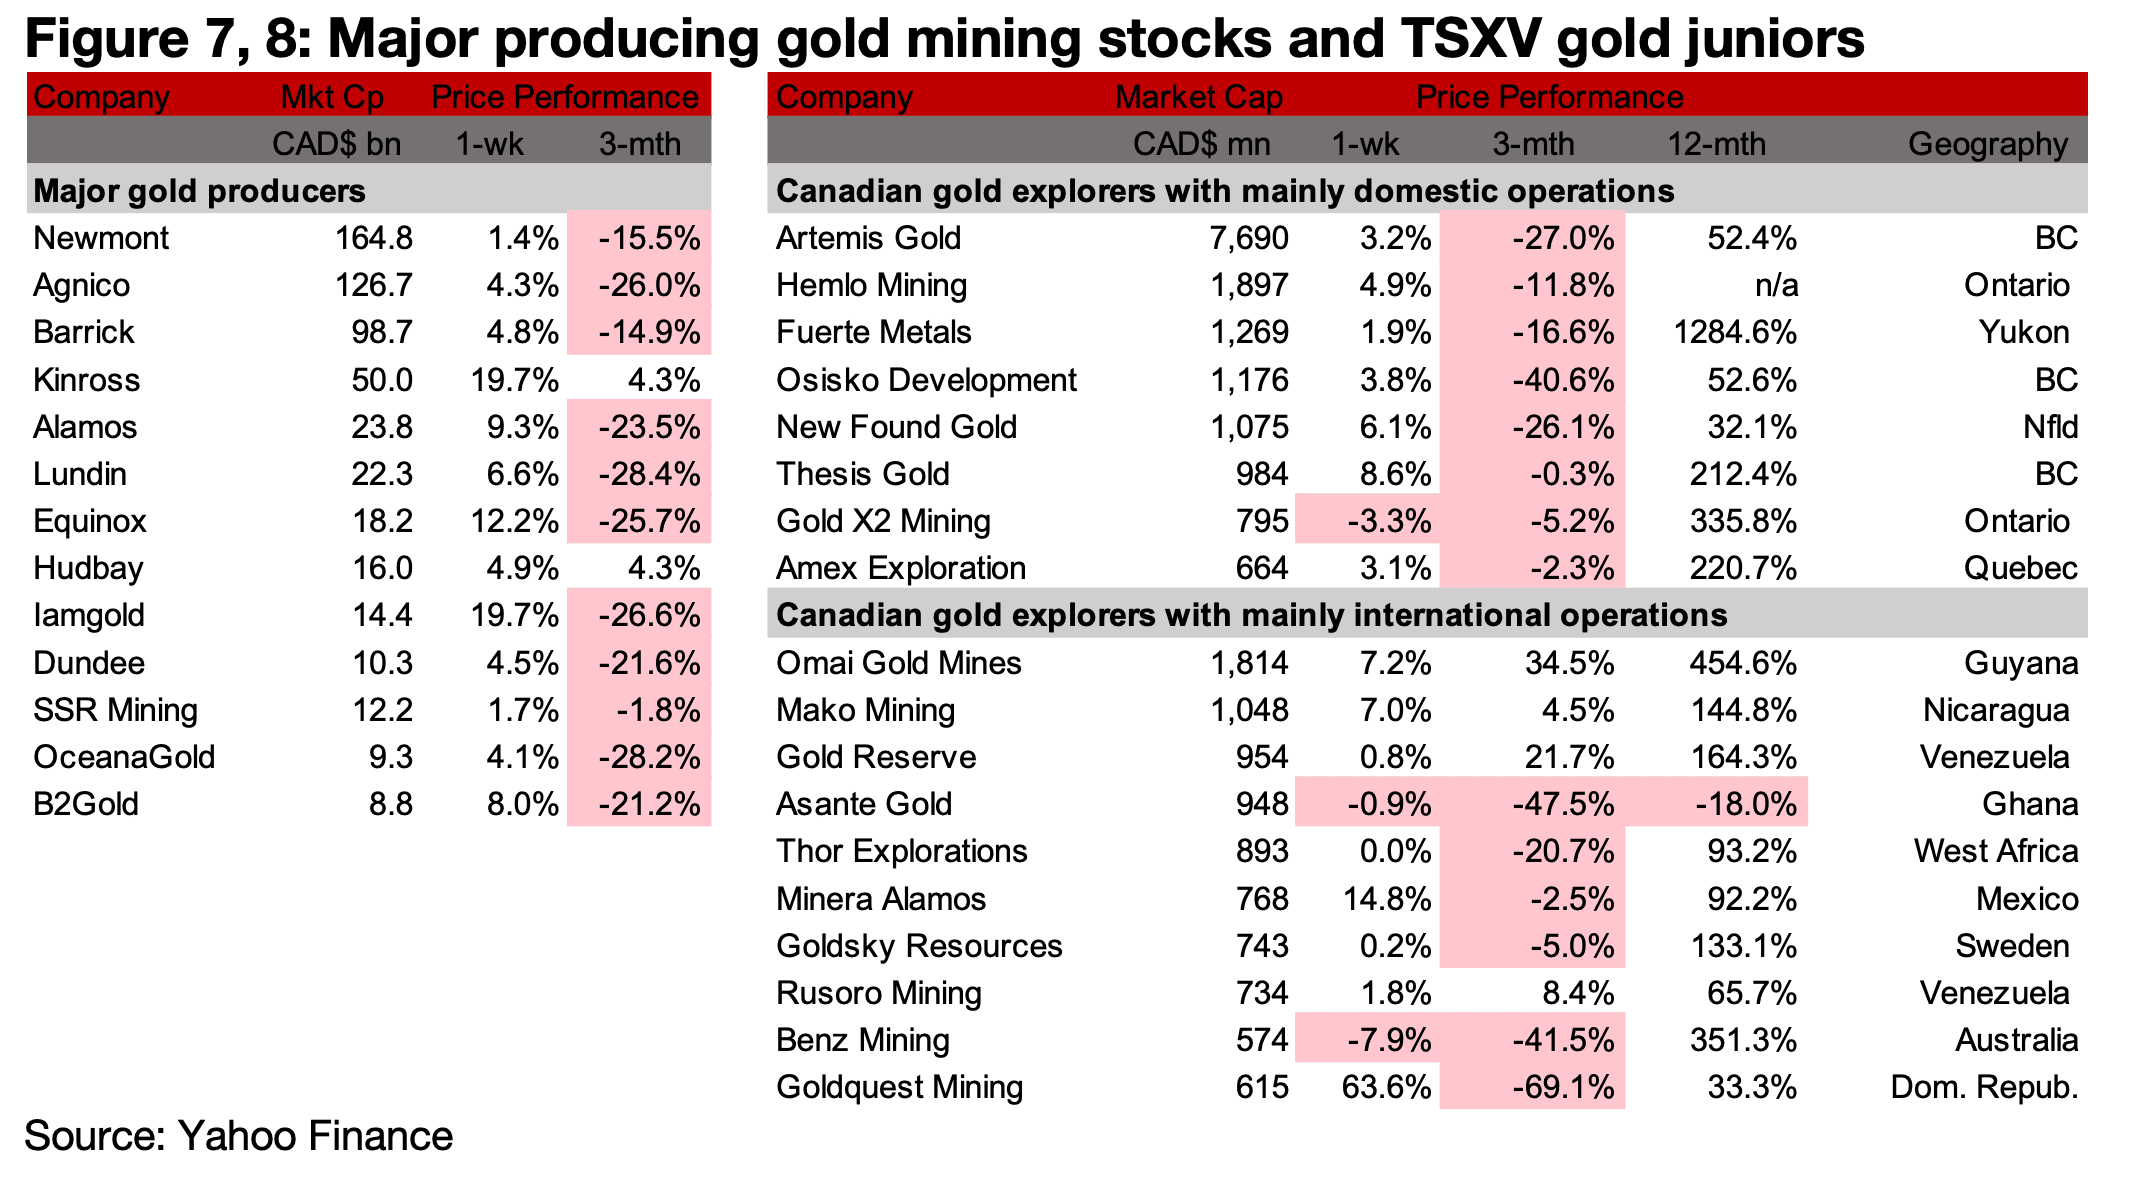
The major producers all gained and most of TSXV gold increased on the rise in the metal price (Figures 7, 8). For the TSXV gold companies operating mainly domestically, Osisko Development closed its US$275.0mn convertible notes (Figure 9). For the TSXV gold companies operating mainly internationally, Minera Alamos reported Q1/26 results, closed its revolving credit facility and announced the PreFeasibility Study for Copperstone and Goldsky reported Q1/26 results and Goldquest released drill results from Romero (Figure 10).

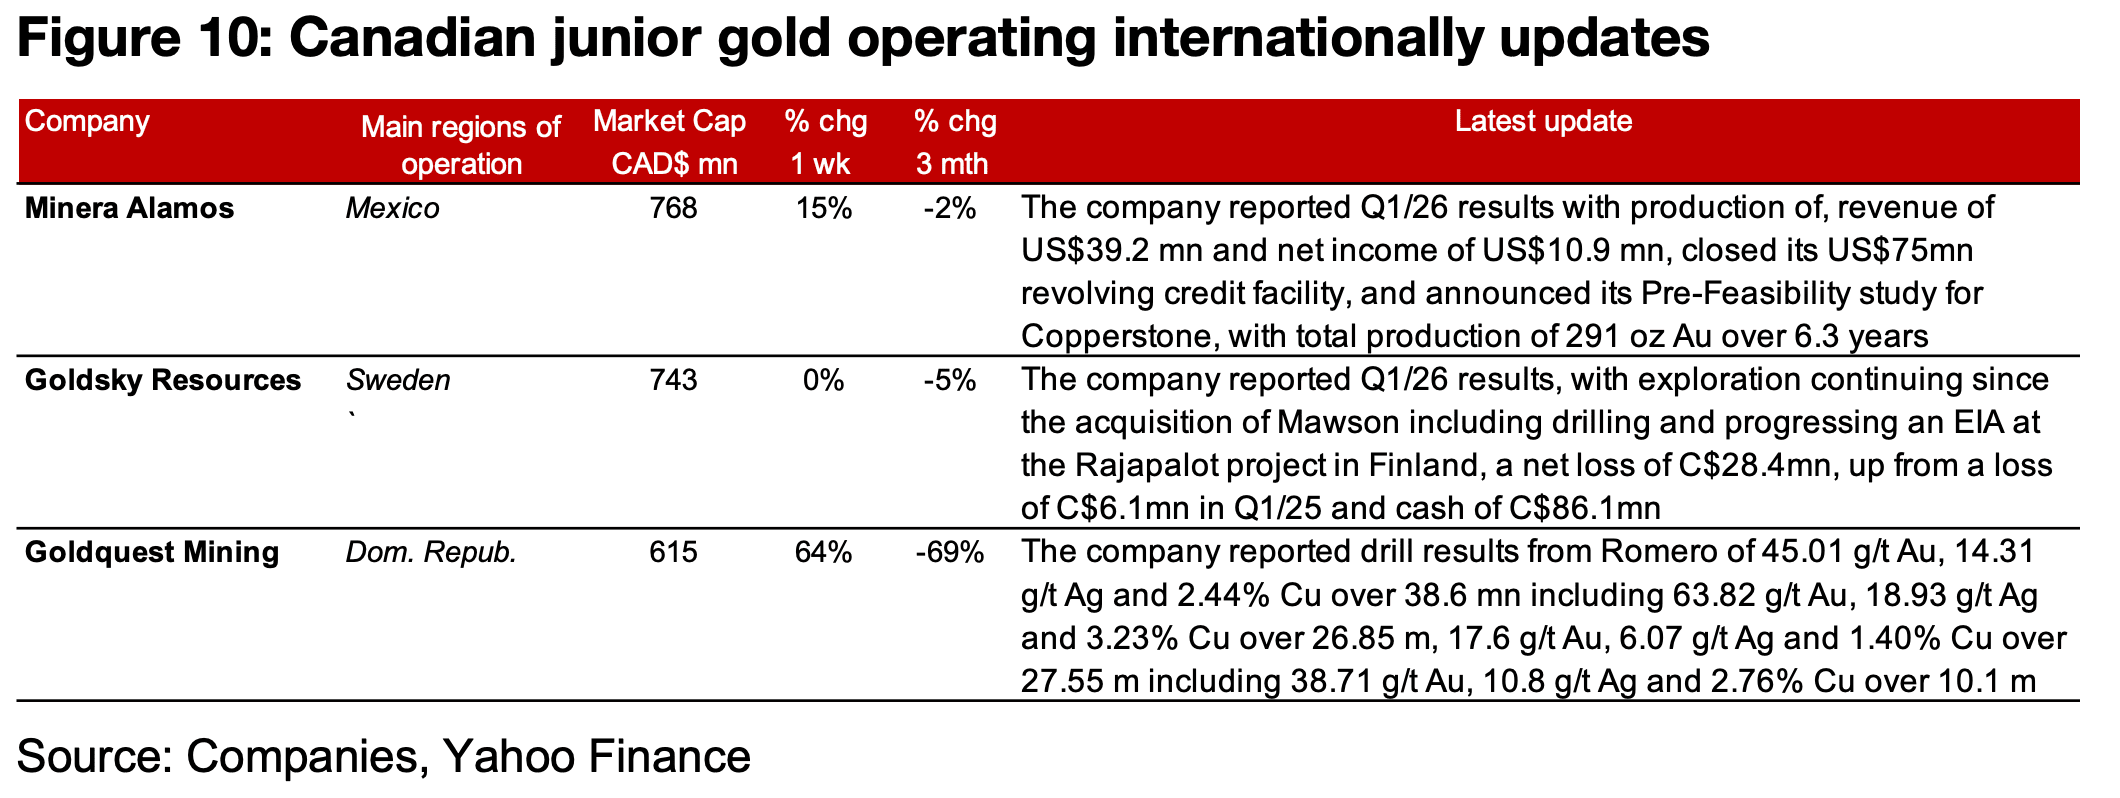
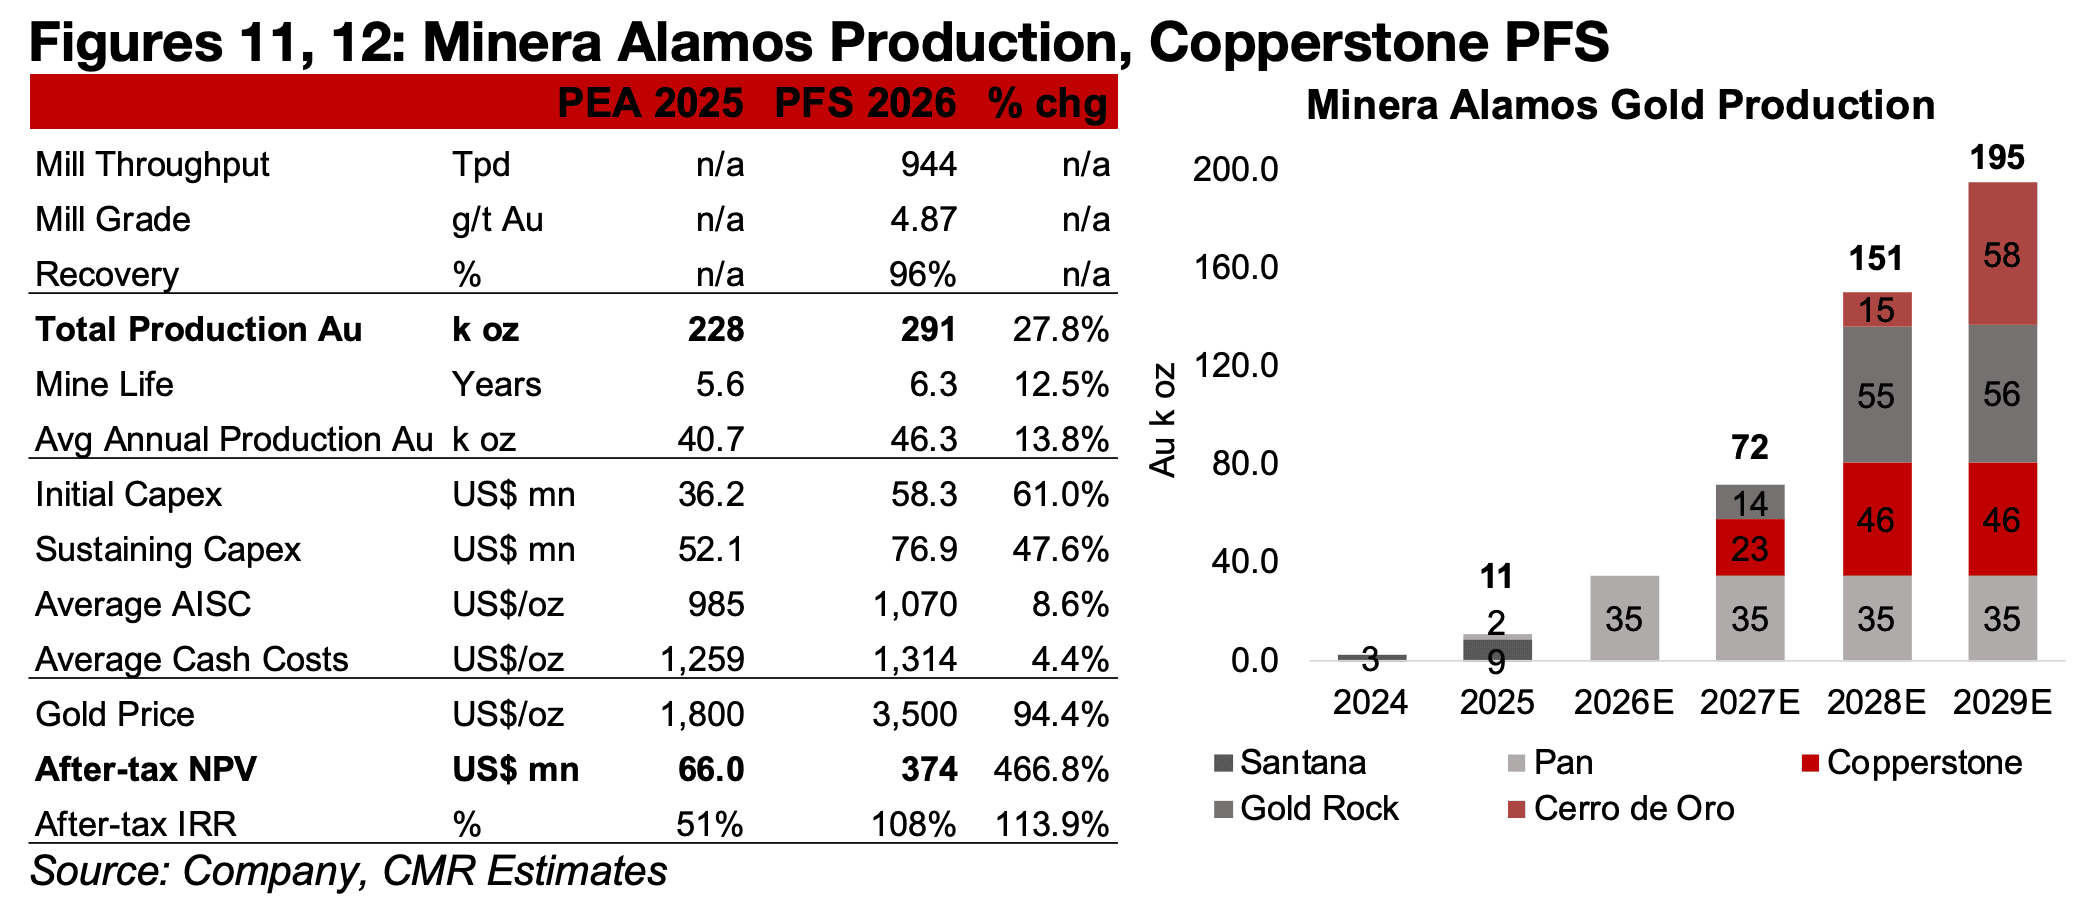
Minera Alamos’ release of the Pre-Feasibility Study for the Copperstone project in
Arizona, U.S. marks key progress towards its estimates for a major increase in
production over the next few years. The company released an updated PEA for the
project in 2025, after acquiring it from Sabre Gold Mines in February of that year. The
PFS outlines total production of 291k oz Au over 6.3 years, up 27.8% from 228 k oz
Au in the PEA, with average annual production of 46.3 oz Au (Figure 11).
The initial capex for the project has increased substantially, to US$58.3 mn, up 61.0%
from the PEA, and the sustaining capex of US$76.9mn, up 47.6%. The average AISC
has risen more moderately, to US$1,314/oz, up 4.4% from the PEA, and the cash
cost is up 8.6%. However, the increased cost has been far offset by jump in the gold
price to US$3,500/oz, up 94.4% from the US$1,800/oz in the PEA, leading to a 466.8%
surge in the NPV for the project, to US$374mn, for a 113.9% IRR.
The production from Minera Alamos in 2025 was mainly from the Pan Mine in Nevada,
U.S., which is also a relatively new acquisition for the company, purchased in October
2025, and contributing 9.16k oz Au in the last quarter of the year (Figure 12). The
company had a considerable gap with no material production in Q2/25 and Q3/25,
prior the Pan mine acquisition. There had been relatively small gold production from
the Santana mine in Mexico of 1.8k oz in Q1/25, and in 2024, with sales of 2.8k oz
Au, down from 5.0k oz Au in 2023 and 9.4k oz Au in 2022. The operations of the mine
were suspended by Q2/25 as the company is still waiting for approvals of amended
permits. The company also previously focused on developing the La Fortuna project,
also in Mexico, with a PEA from 2018.
However, the company expects to see output jump to by far its highest levels ever in
2026E, with 35k oz Au from the first full year for the Pan Mine, with production at
around this level set to continue for at least six years based only on reserves. With
the PFS completed for Copperstone, the company expects production by mid-2027,
which would add 23k oz Au to output next year assuming half of the full-year 46.3 oz
Au estimate. Minera also expects its Gold Rock project in Nevada, which saw a PEA
completed in 2021, to start production by the second half of 2027. Conservatively
assuming Gold Rock output by Q4/27, this would imply an additional 14k oz Au, given
the 55k oz Au in expected annual production.
These estimates would lead to 72k oz Au produced in 2027E, which could double to
151k oz Au in 2028E, with the first full year of output from Copperstone and Gold
Rock, and an additional 15k oz from Cerro de Oro in Mexico, assuming one quarter
of the estimated 58k oz Au annual production. This could rise further to 195k oz Au
in 2029E including a full year of production from Cerro de Oro. The company plans
further drilling and an updated mineral resource estimate for Copperstone, expects a
federal permit for Cerro de Oro and estimates a Gold Rock technical report this year,
with funding in part from the recently closed US$75mn credit facility.
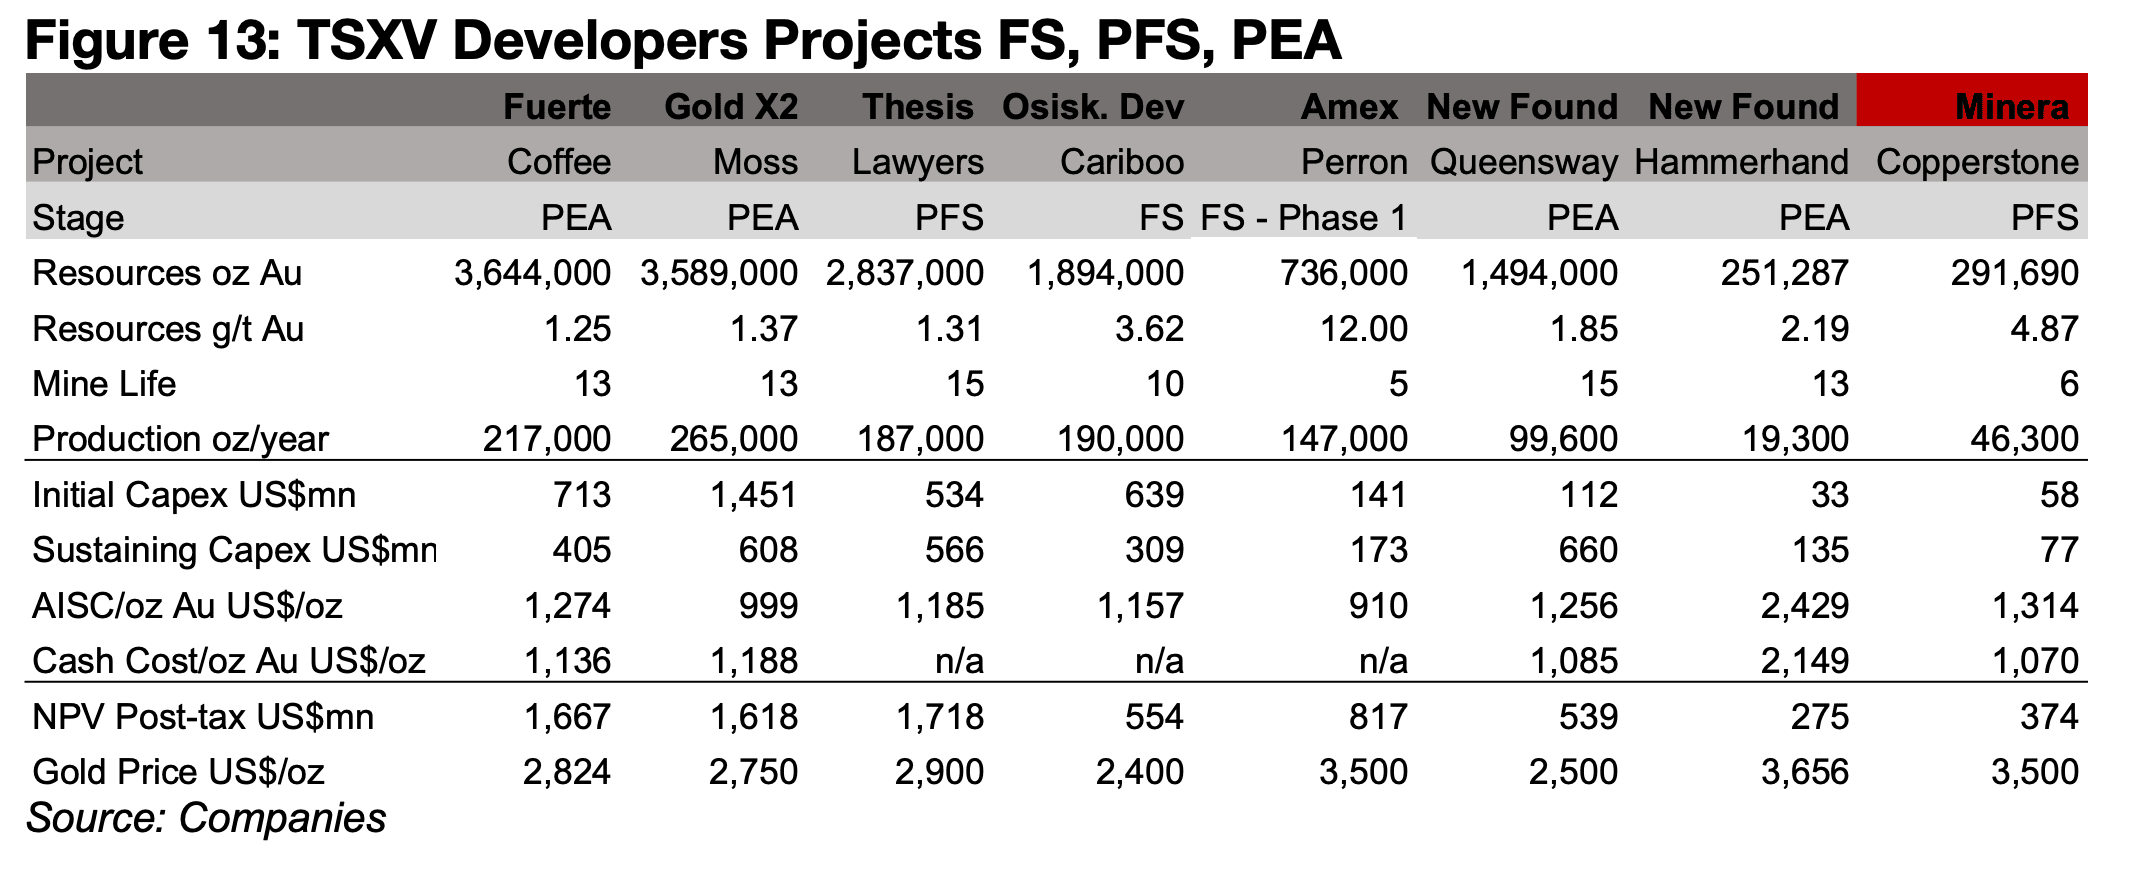
The Copperstone project remains relatively small in the context of the larger TSXV
developers, with its total resources of 291k oz Au similar in size to New Found Gold’s
Hammerhand project, at 251k oz Au, with the total resources of the rest ranging from
763k oz Au to 3,644k oz Au (Figure 13). Even at the 2029E forecast output of 195k oz
Au, the four projects would have an annual production around the level of Thesis’
Lawyers project or Osisko Development’s Cariboo project, with expected production
from Fuerte’s Coffee or Gold X2’s Moss projects considerably higher.
While the AISC of Copperstone is the highest of the group at US$1,314/oz, the PEA,
PFS and FS for the other companies were released before concerns over oil-driven
inflation. The NPVs are also not entirely comparable, given considerably lower gold
prices for most of the large projects, with only New Found’s Hammer Hand and
Amex’s Phase 1 for Perron having been released relatively recently and using similar
gold prices to Minera Alamos. The estimates for many of the companies still apply
gold prices well below US$3,000/oz.
Disclaimer: This report is for informational use only and should not be used an alternative to the financial and legal advice of a qualified professional in business planning and investment. We do not represent that forecasts in this report will lead to a specific outcome or result, and are not liable in the event of any business action taken in whole or in part as a result of the contents of this report.
Author
Ben McGregor authors the Weekly Roundup at CanadianMiningReport.com, providing sharp analysis of the metals and mining sector. With a talent for spotting trends, Ben distills complex market shifts into clear, engaging insights on TSXV junior miners. His weekly updates cover gold, copper, uranium, and more, blending data-driven perspectives with a knack for identifying opportunities. A vital resource for investors, Ben’s work navigates the dynamic junior mining landscape with precision.