
August 04, 2025
The gold price rose 0.4% to US$3,348/oz, after briefly dropping below the US$3,300/oz level for the first time in a month, as July 2025 US BLS employment data disappointed the markets significantly and new US tariffs went into effect.
This week we look at the drivers of the plunging US copper price, reversing its jump of the past few months and Robex Resources’ Q2/25 update with production down, but revenue up on a stronger gold price, and income declining on exceptional items.
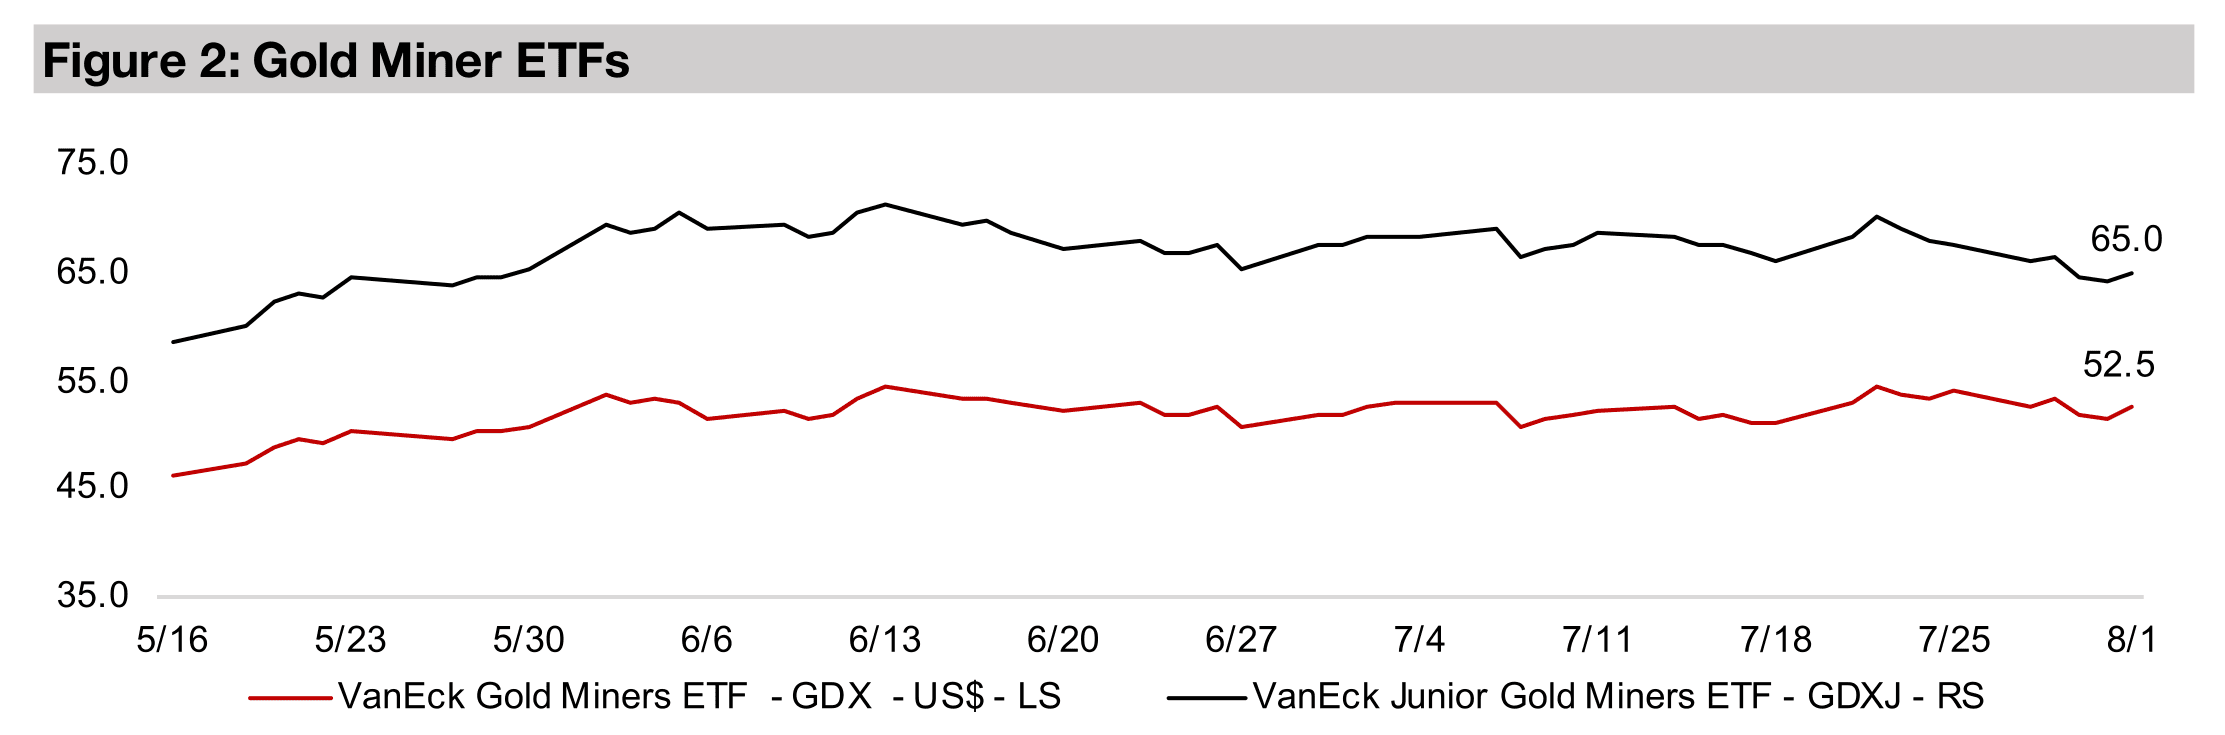
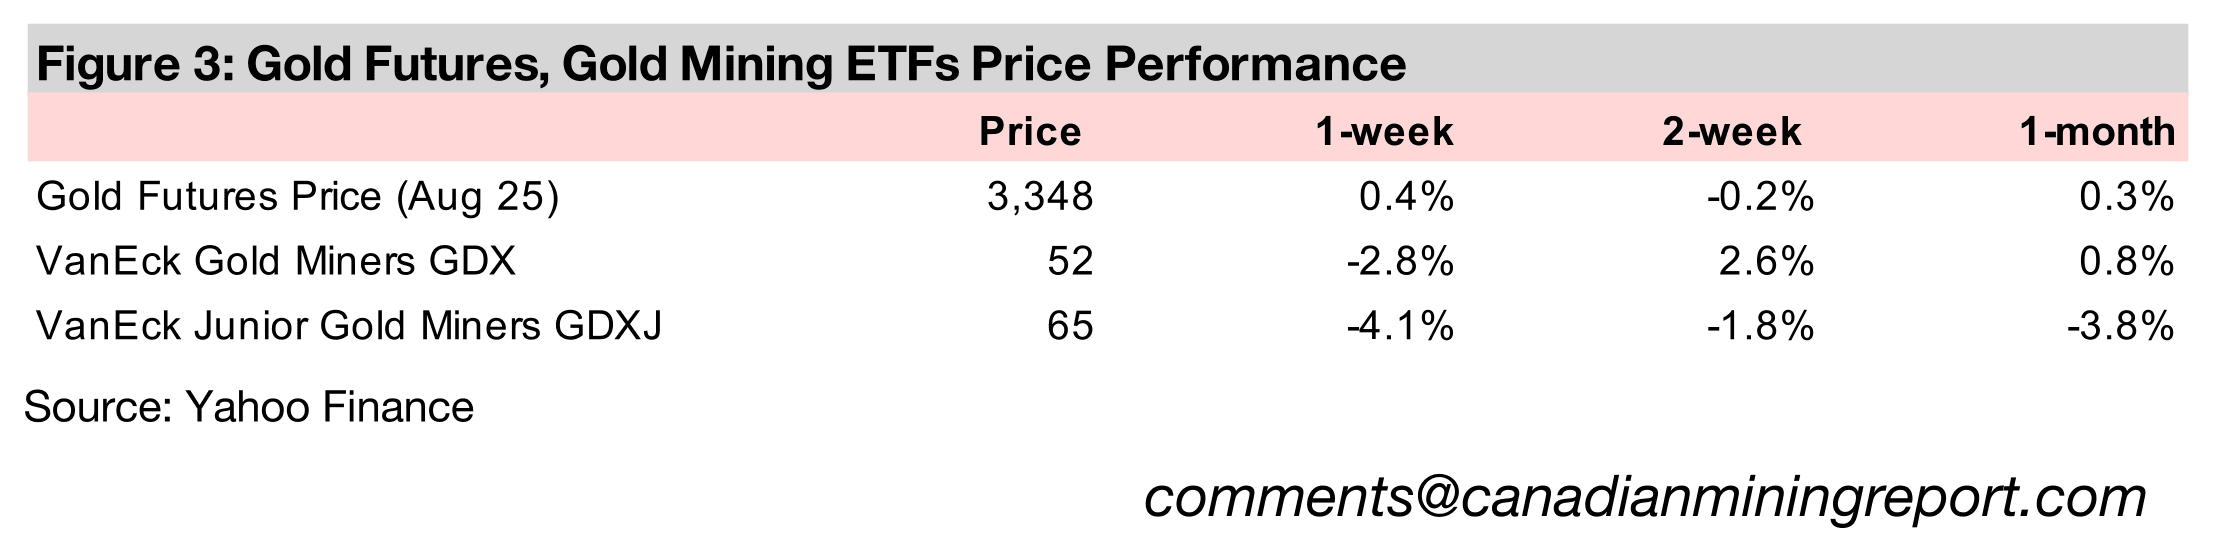
The gold stocks were down even as the metal rose, with the GDX declining -2.8% and GDXJ off -4.1% on a drop in equities, with the S&P 500 and Nasdaq down -2.5%, the Russell 2000 losing -4.4% and Eurostoxx and Nikkei declining -3.6% and -1.5%.


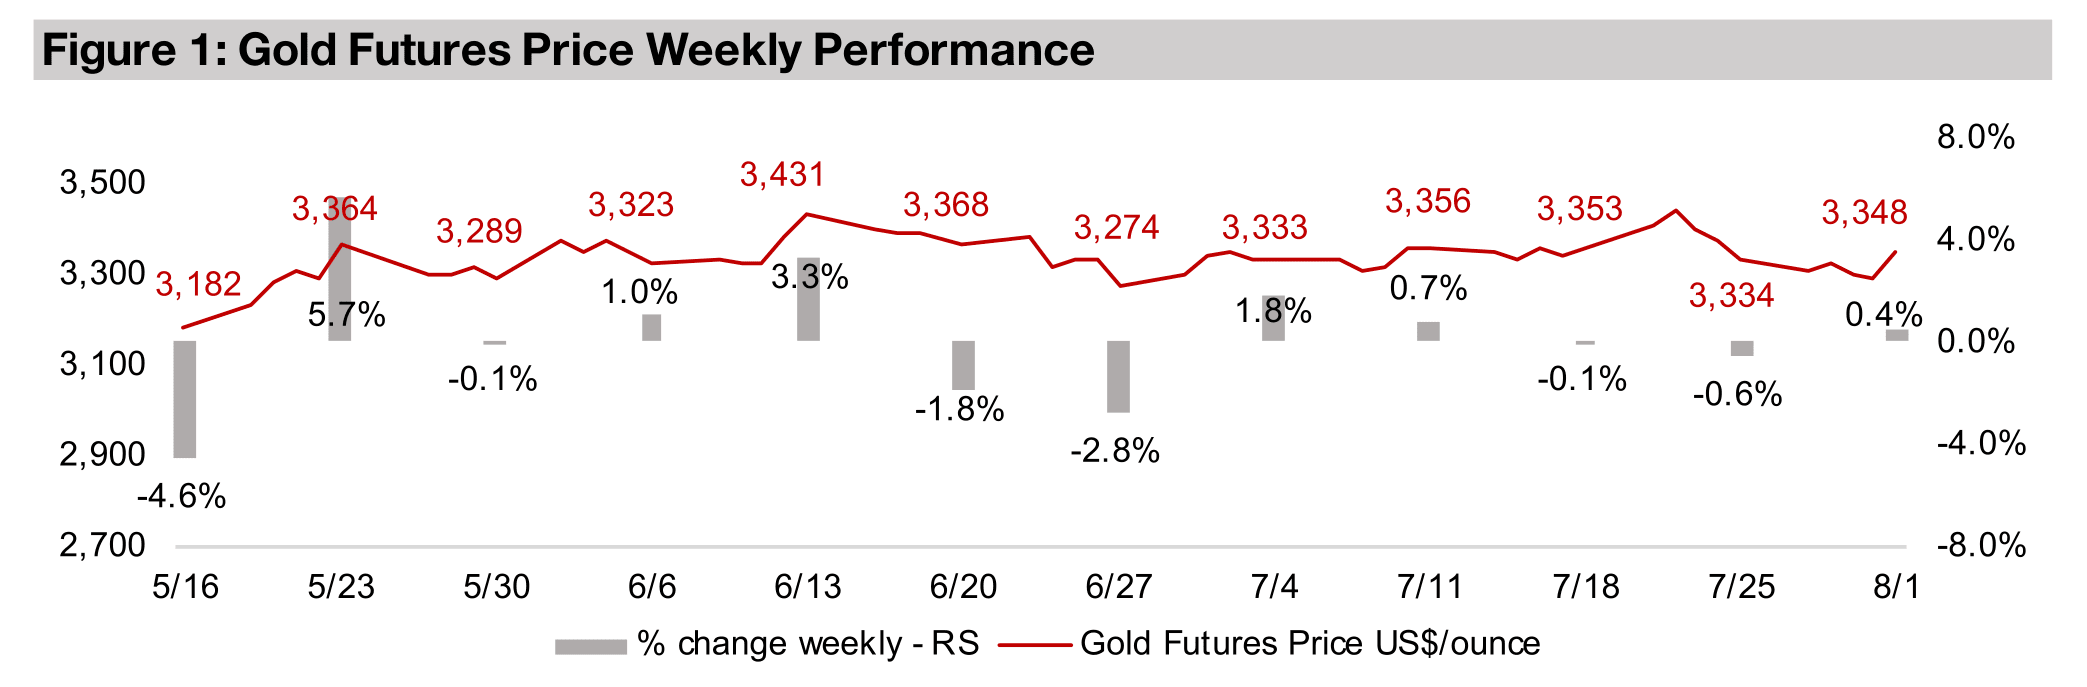
The gold price rose 0.4% to US$3,348/oz, briefly dropping below US$3,300/oz for
the first time in over a month before recovering and maintaining the US$3,200-
US$3,400/oz range that has held since mid-April. The main economic news was US
employment data which were below expectations, and the country’s new tariffs
coming into effect on August 1, 2025. This was not received well by the market, with
the S&P 500 and Nasdaq down -2.5% and small cap Russell 2000 index off -4.4%,
erasing the gains of the past month. The markets were also down internationally, with
the Eurostoxx 600 losing -3.0%, the Nikkei off -1.6% and the Shanghai Index
declining 0.9%. This overall pressure on equities offset the rise in the metal price and
dragged down the gold stocks, with the GDX falling -2.8% and GDXJ losing -4.1%.
While we might have expected the gold price to rise more given the jump in risk, the
market seems to view the metal’s current range as having sufficiently priced in the
tariffs and other economic and geopolitical issues. As to how long the price could
remain at this level, there have been two periods over the past five years where gold
traded for an extended period within roughly a US$200/oz range. The first was from
March 2021 to February 2022, with an average of US$1,799/oz, a low of US$1,678/oz
and high of US$1,903/oz, for a US$225/oz spread. The second was from April 2023
to February 2024, with an average of US$1,978/oz, a low of US$1,838/oz and peak
of US$2,048/oz, for a US$210/oz spread. These periods lasted eleven and ten
months, respectively, suggesting that the current range could persist for some time.
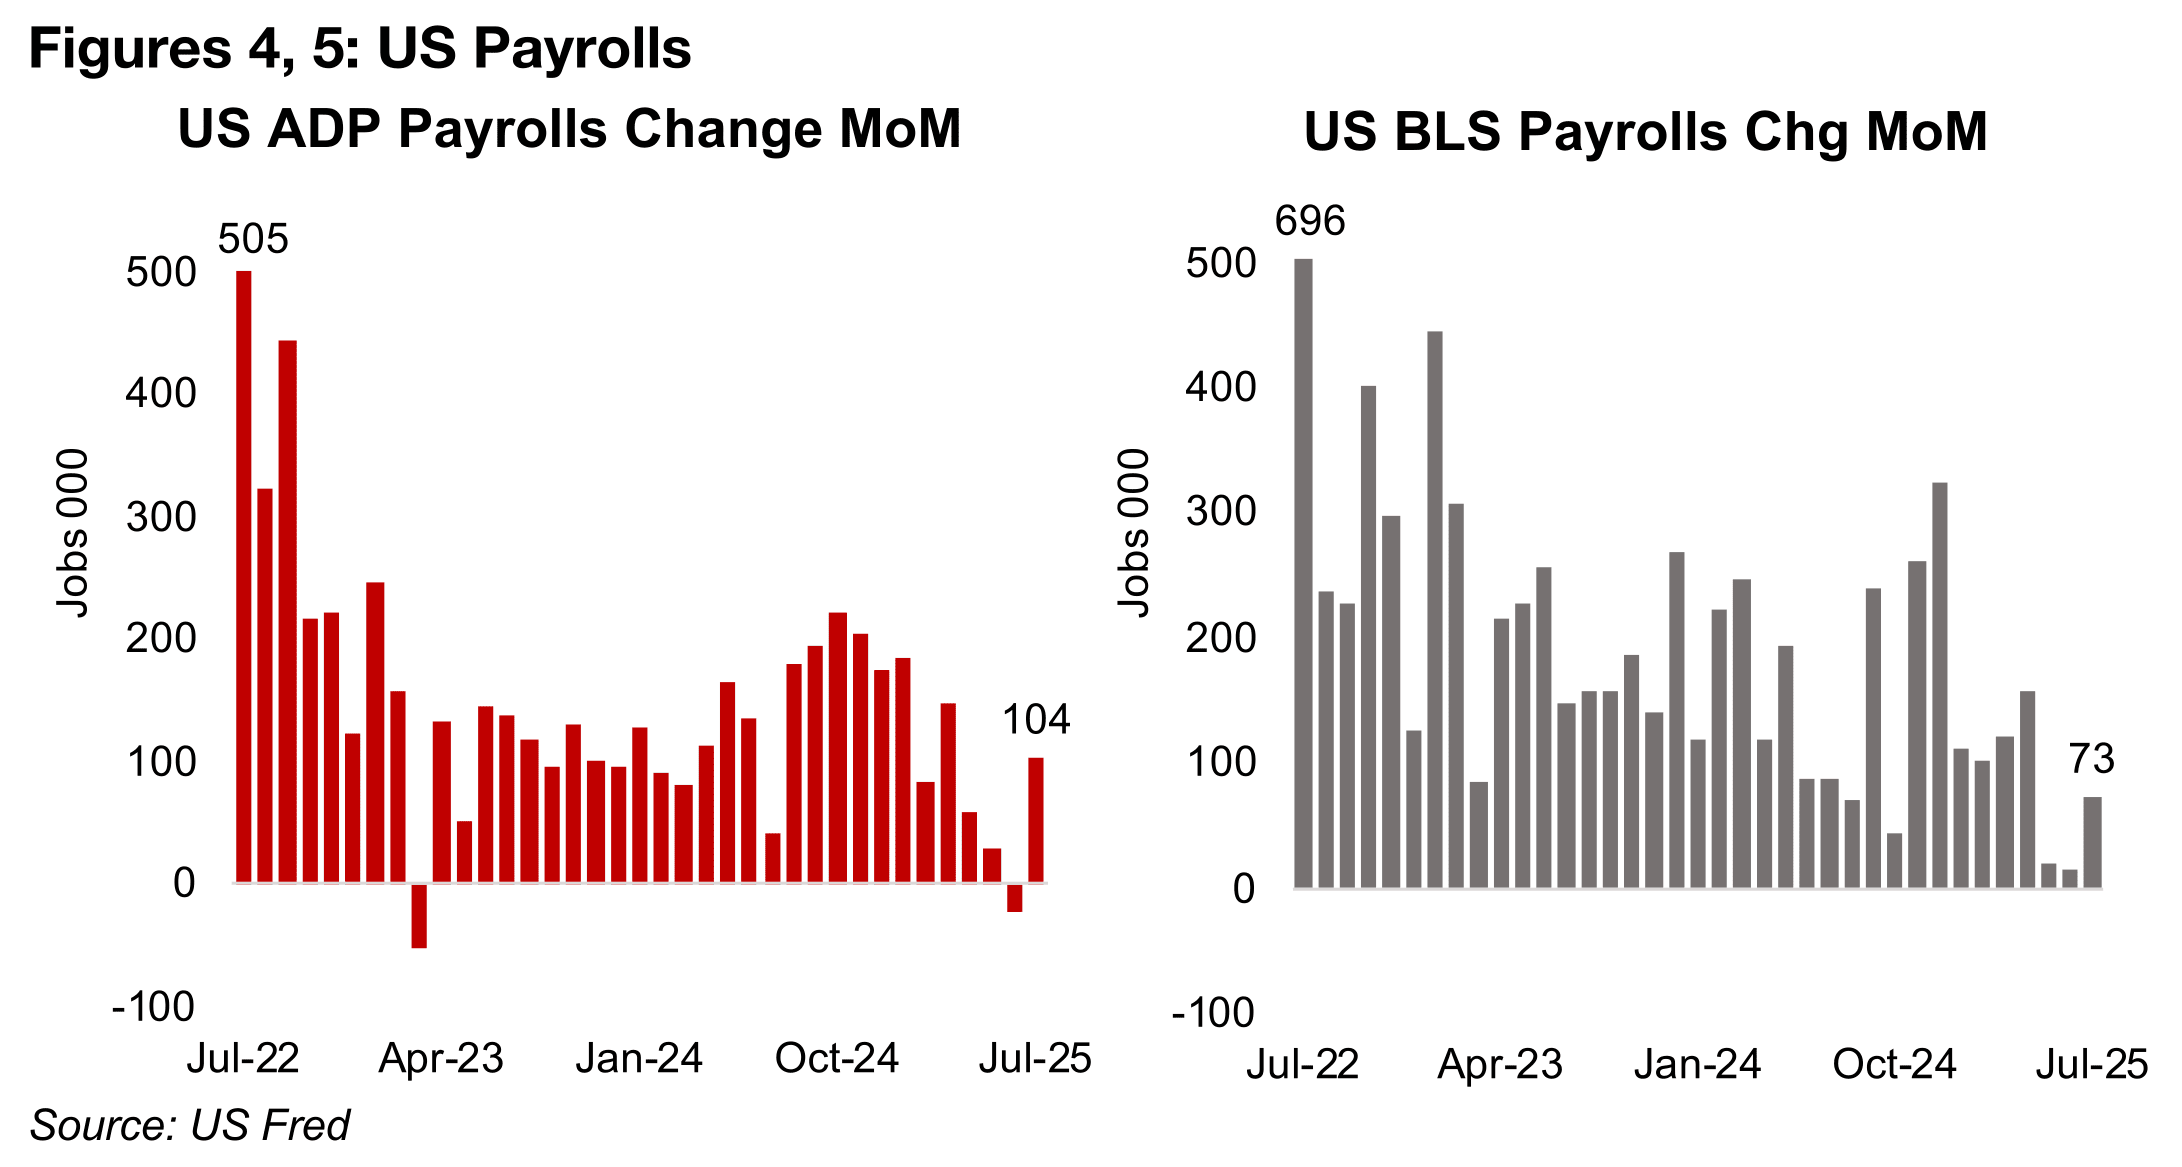
There were two major US employment releases this week, the ADP and Bureau of
Labor Statistics (BLS) payrolls for July 2025. The ADP data was released first, with
104k jobs added, inline with market expectations (Figure 4). The shock came from
the second release from the BLS with only 73k jobs added, well below the 100k low
end of consensus. However, there were also major downward revisions to the May
and June 2025 payroll rises, to just 19k and 14k, respectively, from the previous 144k
and 147k (Figure 5). This was viewed by the US administration as politically motivated
and led to the removal of the BLS head. It followed the government’s earlier claims
that job numbers had been inflated by the BLS prior to the 2024 election to support
the previous administration, and revised heavily downward only after the results.
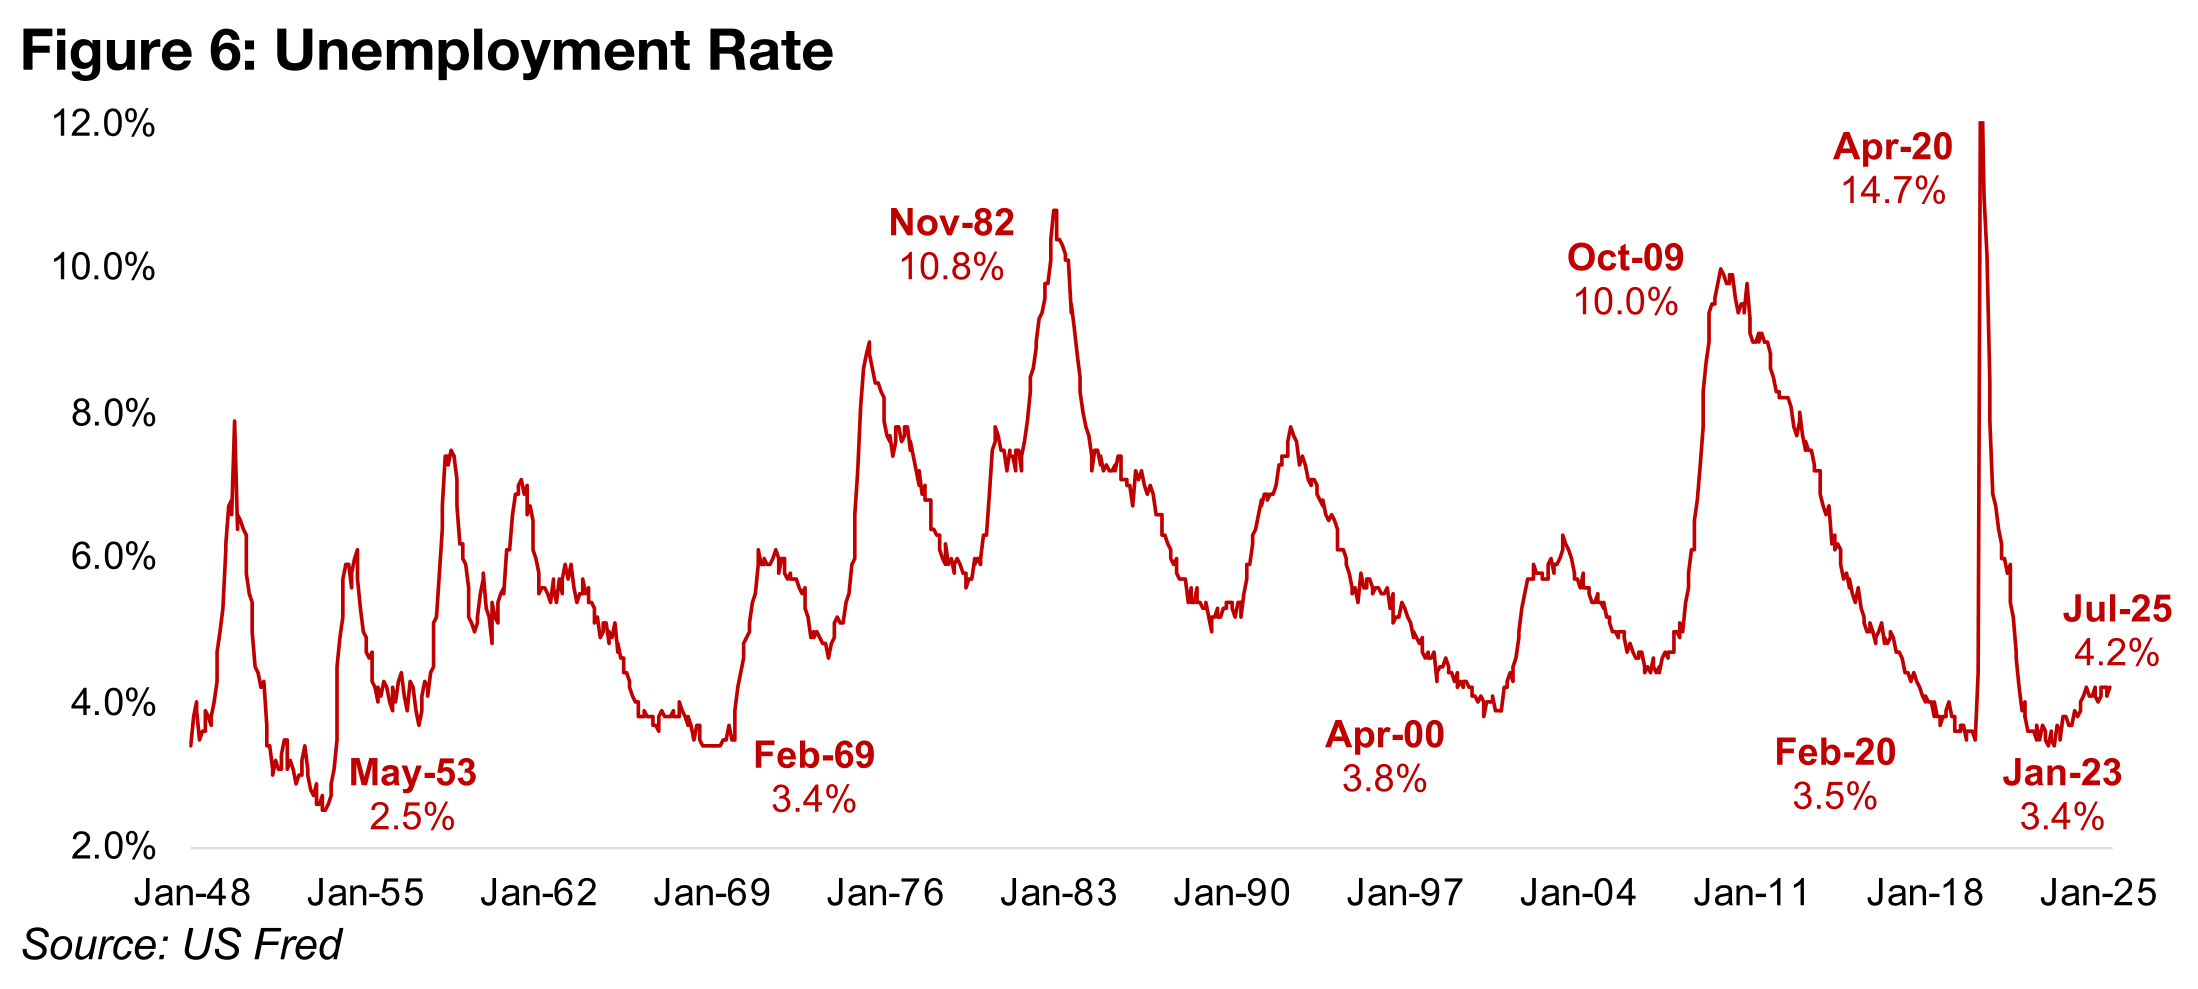
The unemployment rate for July 2025 rose to 4.2% from 4.1% in June 2025, but
overall for the last year it has remained flat, averaging 4.1%, with six months at 4.2%,
five months at 4.1% and one, January 2025, at 4.0% (Figure 6). It has increased less
than a percent from its recent trough of 3.4% in January 2023, which was extremely
low historically, with it nearing that level only twice previously, in February 2020 at
3.5% and in February 1969 at 3.4%. The current rate is still well below historical peaks
of around 10.8% in November 1982 and 10.0% in October 2009, with the 14.7% April
2020 figure an exception driven by the global health crisis.
While gold has remained range bound, the US CME copper price made one of its
largest daily percentage moves ever this week, slumping -22% on July 21, 2025. This
came after the Trump administration announced 50% tariffs on copper from August
1, 2025, but that they would exclude cathode. This abruptly reversed a major run up
in the US CME copper price ahead of the UK LME price that had started in February
2025 after the government announced it would be considering tariffs on the metal
(Figure 7). The shift was largely driven by US traders importing more of the metal to
get ahead of the potentially higher costs starting from August 2025. By July 25, 2025,
the CME price had reached a historically extreme peak in its premium of 30% above
the UK LME price.
The premium already started to decline from July 28, 2025, dropping to 27%, as it
seemed likely copper tariffs would be imposed, ending the rationale for stockpiling
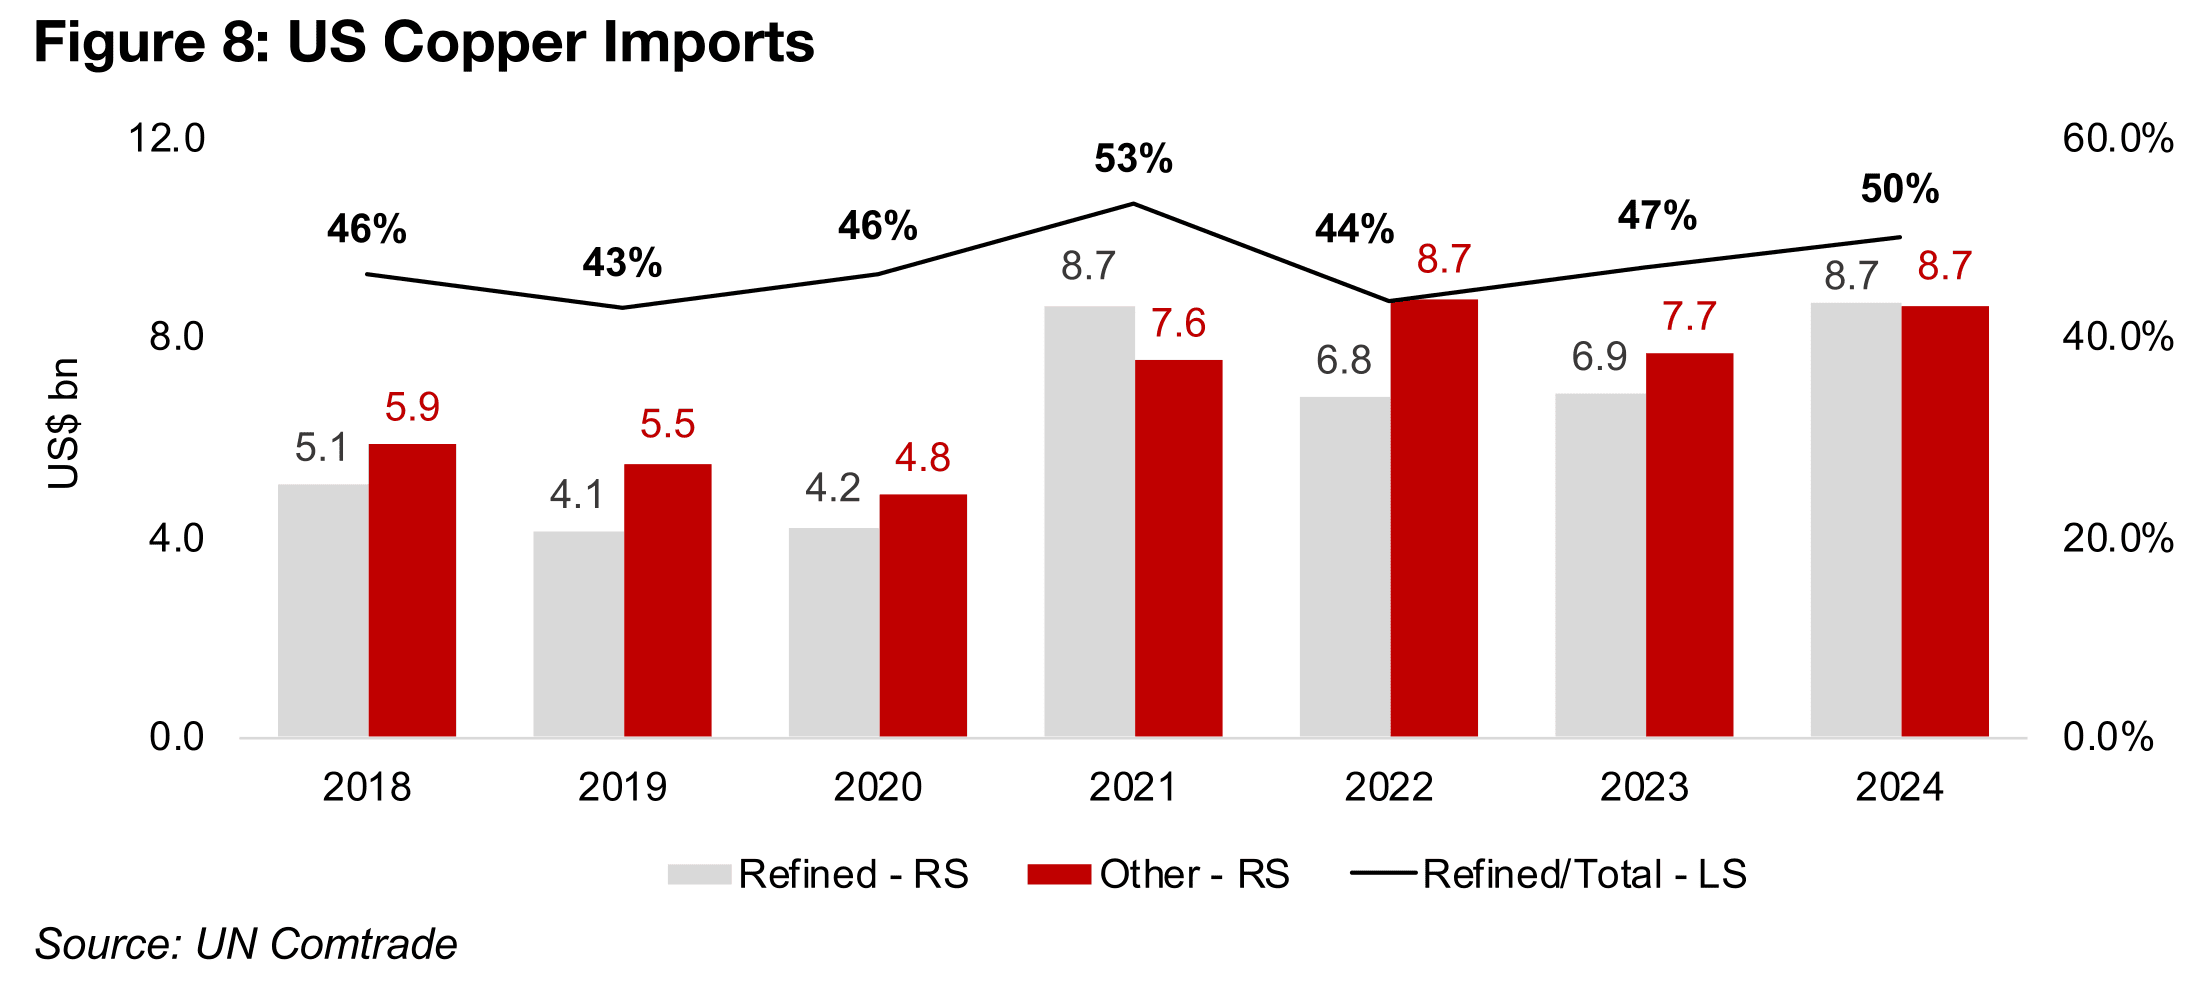
the metal, which would likely eventually drive a price decline. However, the shock in
announcement of the exclusion of cathode from the tariff meant that much of the US
copper inventory buildup over 2025 was not justified in retrospect. Refined copper,
which is mainly cathode, ranged from 43% to 53% of US total imports from 2018 to
2024, implying that the tariffs would not apply to about half of shipments to the
country (Figure 8). This drove a collapse in CME to LME copper price premium to just
3.0% by the end of the week, slightly above the 2.0% average from 2023 to 2024.
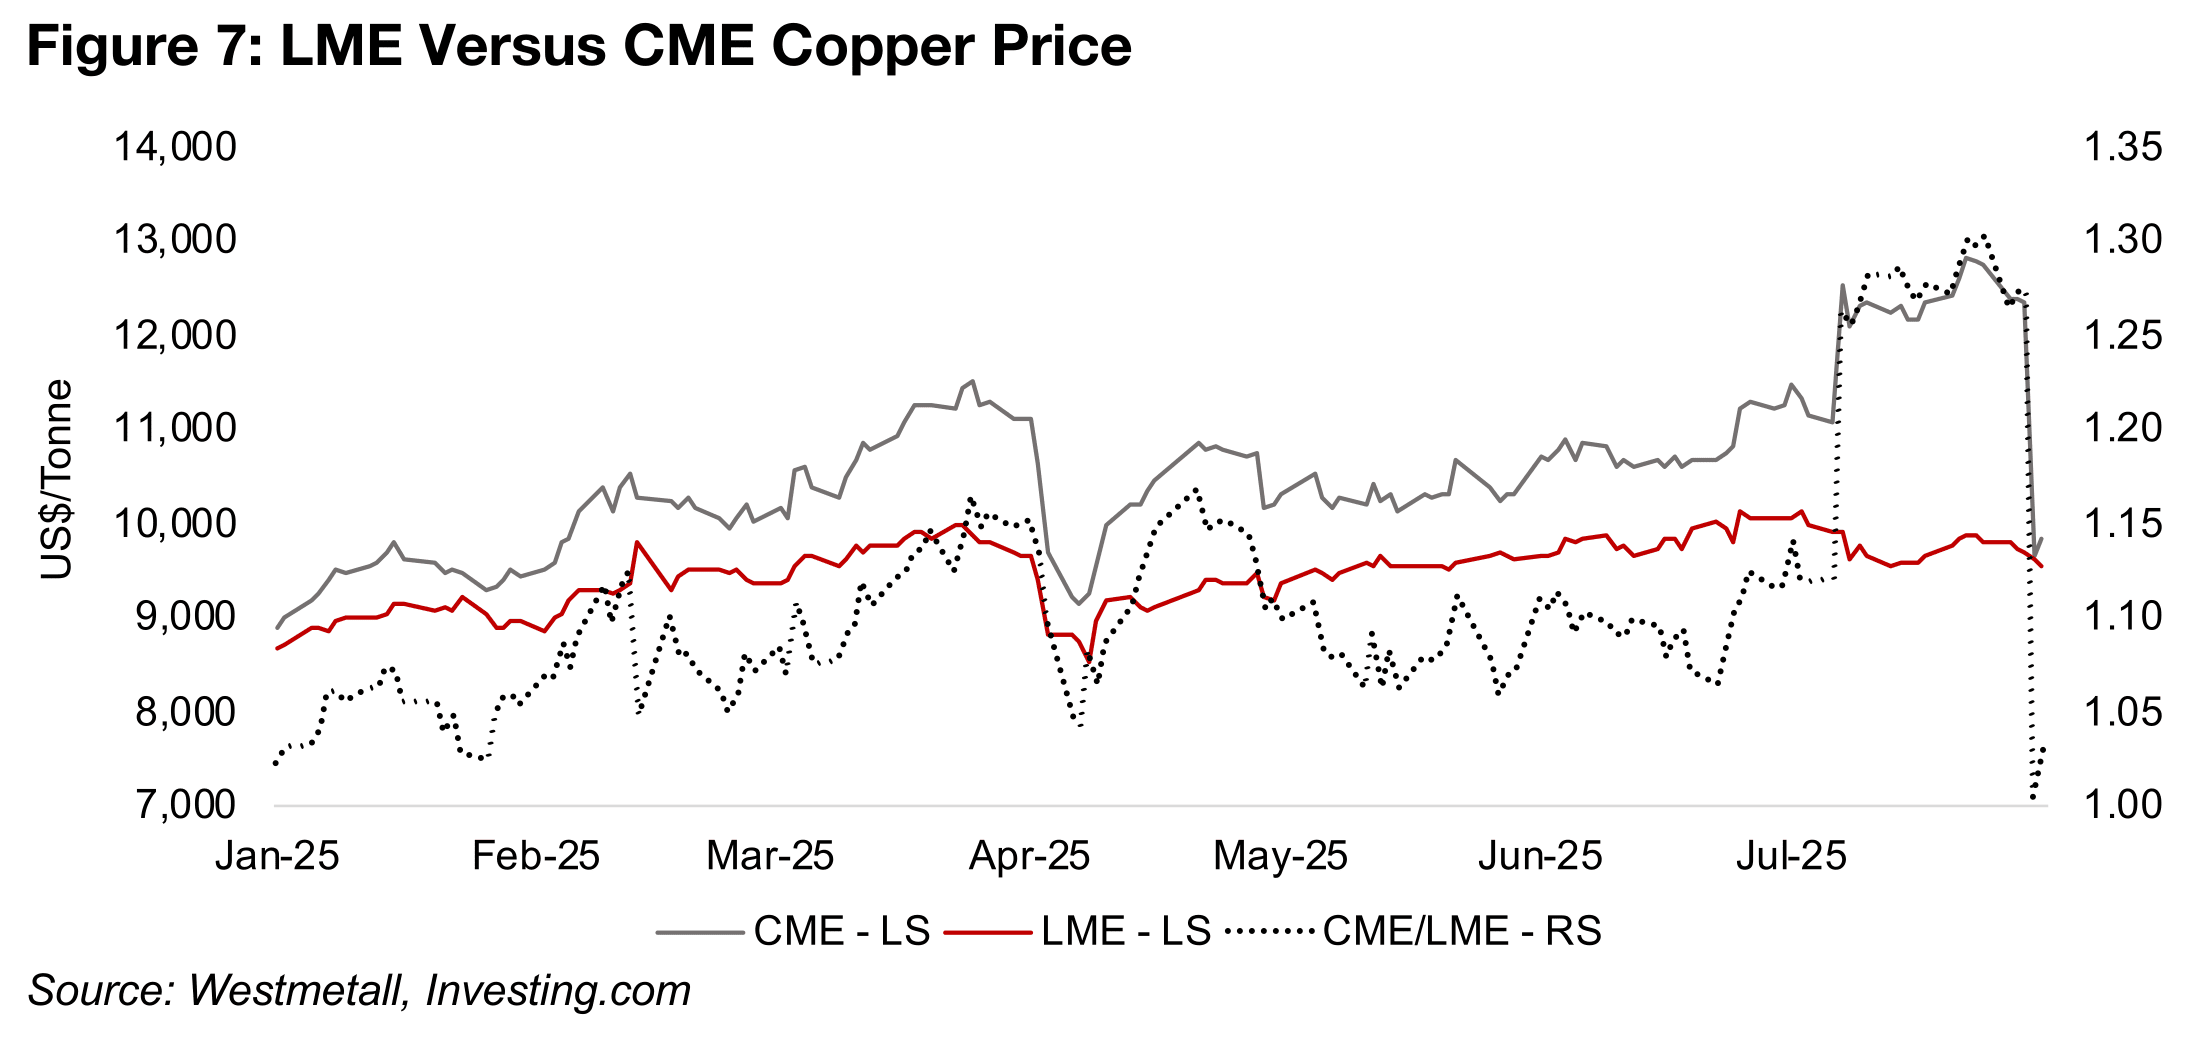
The LME copper price has risen only moderately this year, up 9.8%, and averaged
about US$9,500/tonne, ranging from US$8,600/tonne to US$10,000/tonne. This
suggests that the market does not view the underlying fundamentals of copper to
have improved that much this year, with the US price jump only a short-term
distortion. The outlook for the copper price for the rest of the year remains split based
on some key institutional forecasts. Australia’s Office of the Chief Economist (AOCE)
forecasts a US$9,391/tonne price for 2025, implying a 2.7% rise yoy but a -0.1%
decline half on half for H2/25 based on the average US$9,435/tonne price over H1/25.
The World Bank’s much more bearish US$8,800/oz forecast for 2025 implies a -3.7%
decline in the copper price this year, and a major drop of -13.4% half on half for H2/25.
Notably the AOCE forecast is more recent, from June 2025, and the World Bank
estimate is from April 2025, so the latter could still be revised up to account for the
moderate pickup in copper this year. However, neither source implies a strong copper
market in H2/25, which will be partly related to relatively weak global growth forecasts
for this year, with copper a key proxy for the world economy. The IMF expects growth
to decline for most regions in 2025 yoy, and the recent US employment data hints at
some weakness developing in the country, although its accuracy is still in question.
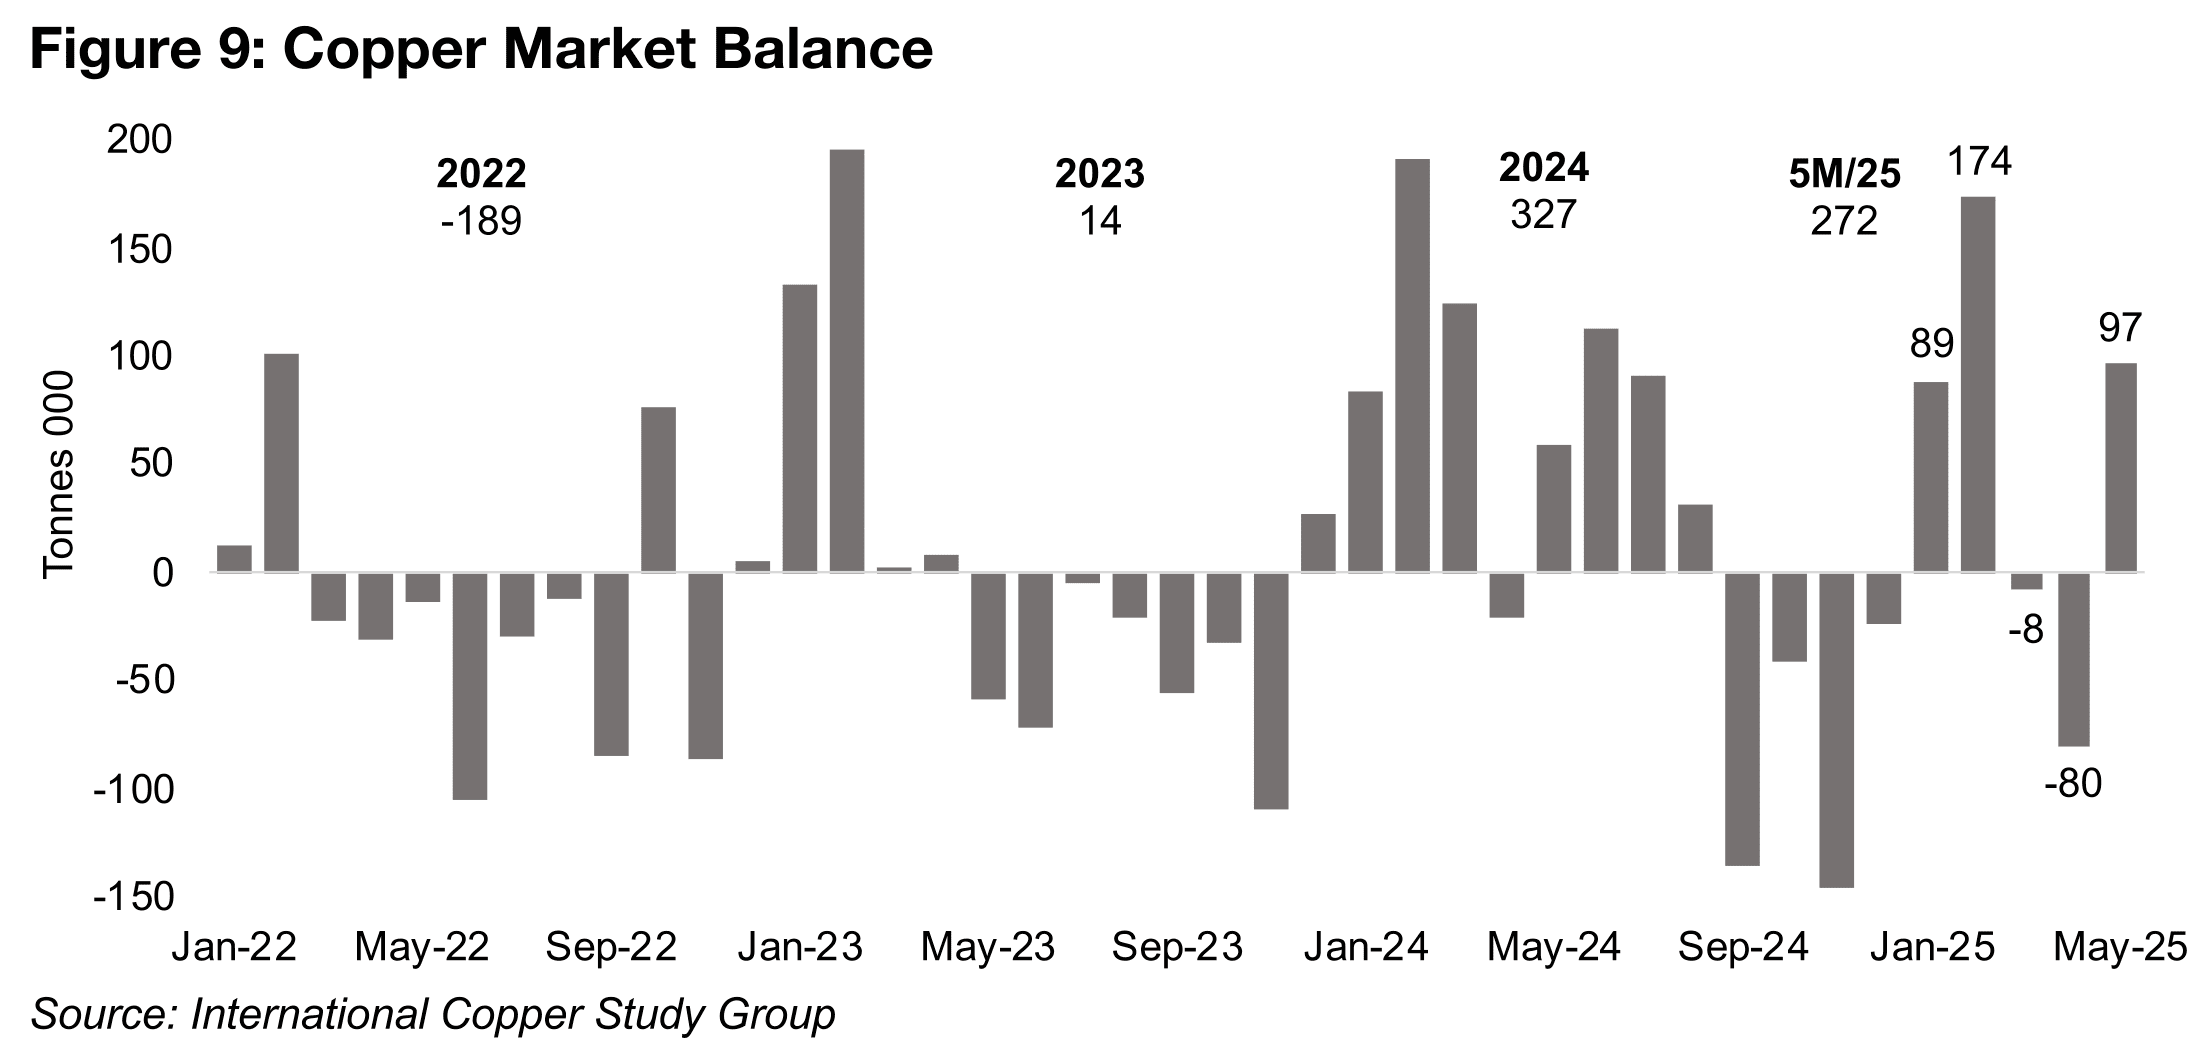
The International Copper Study Group is forecasting a copper surplus of 289k tonnes
for 2025, continuing into 2026 with 209k tonnes. For the first five months of the year
they have already reported a 272 tonne surplus, which puts it in position to beat the
current forecasts, unless there is a substantial rise in demand (Figure 9). The 5M/25
figure is also already on track to surpass the 327k tonne surplus for the full year in
2024, with the market roughly balanced in 2023 with a 14k tonne surplus, and in a
deficit in 2022 of -189k tonnes. With relatively weak global growth for 2025 seeming
to be the current consensus outlook, this could be already be priced into these
forecasts, making them already conservative. However, we still see the probability of
a surprise to growth this year as more likely to the downside than the upside, which
could hit the demand side of the copper forecasts.
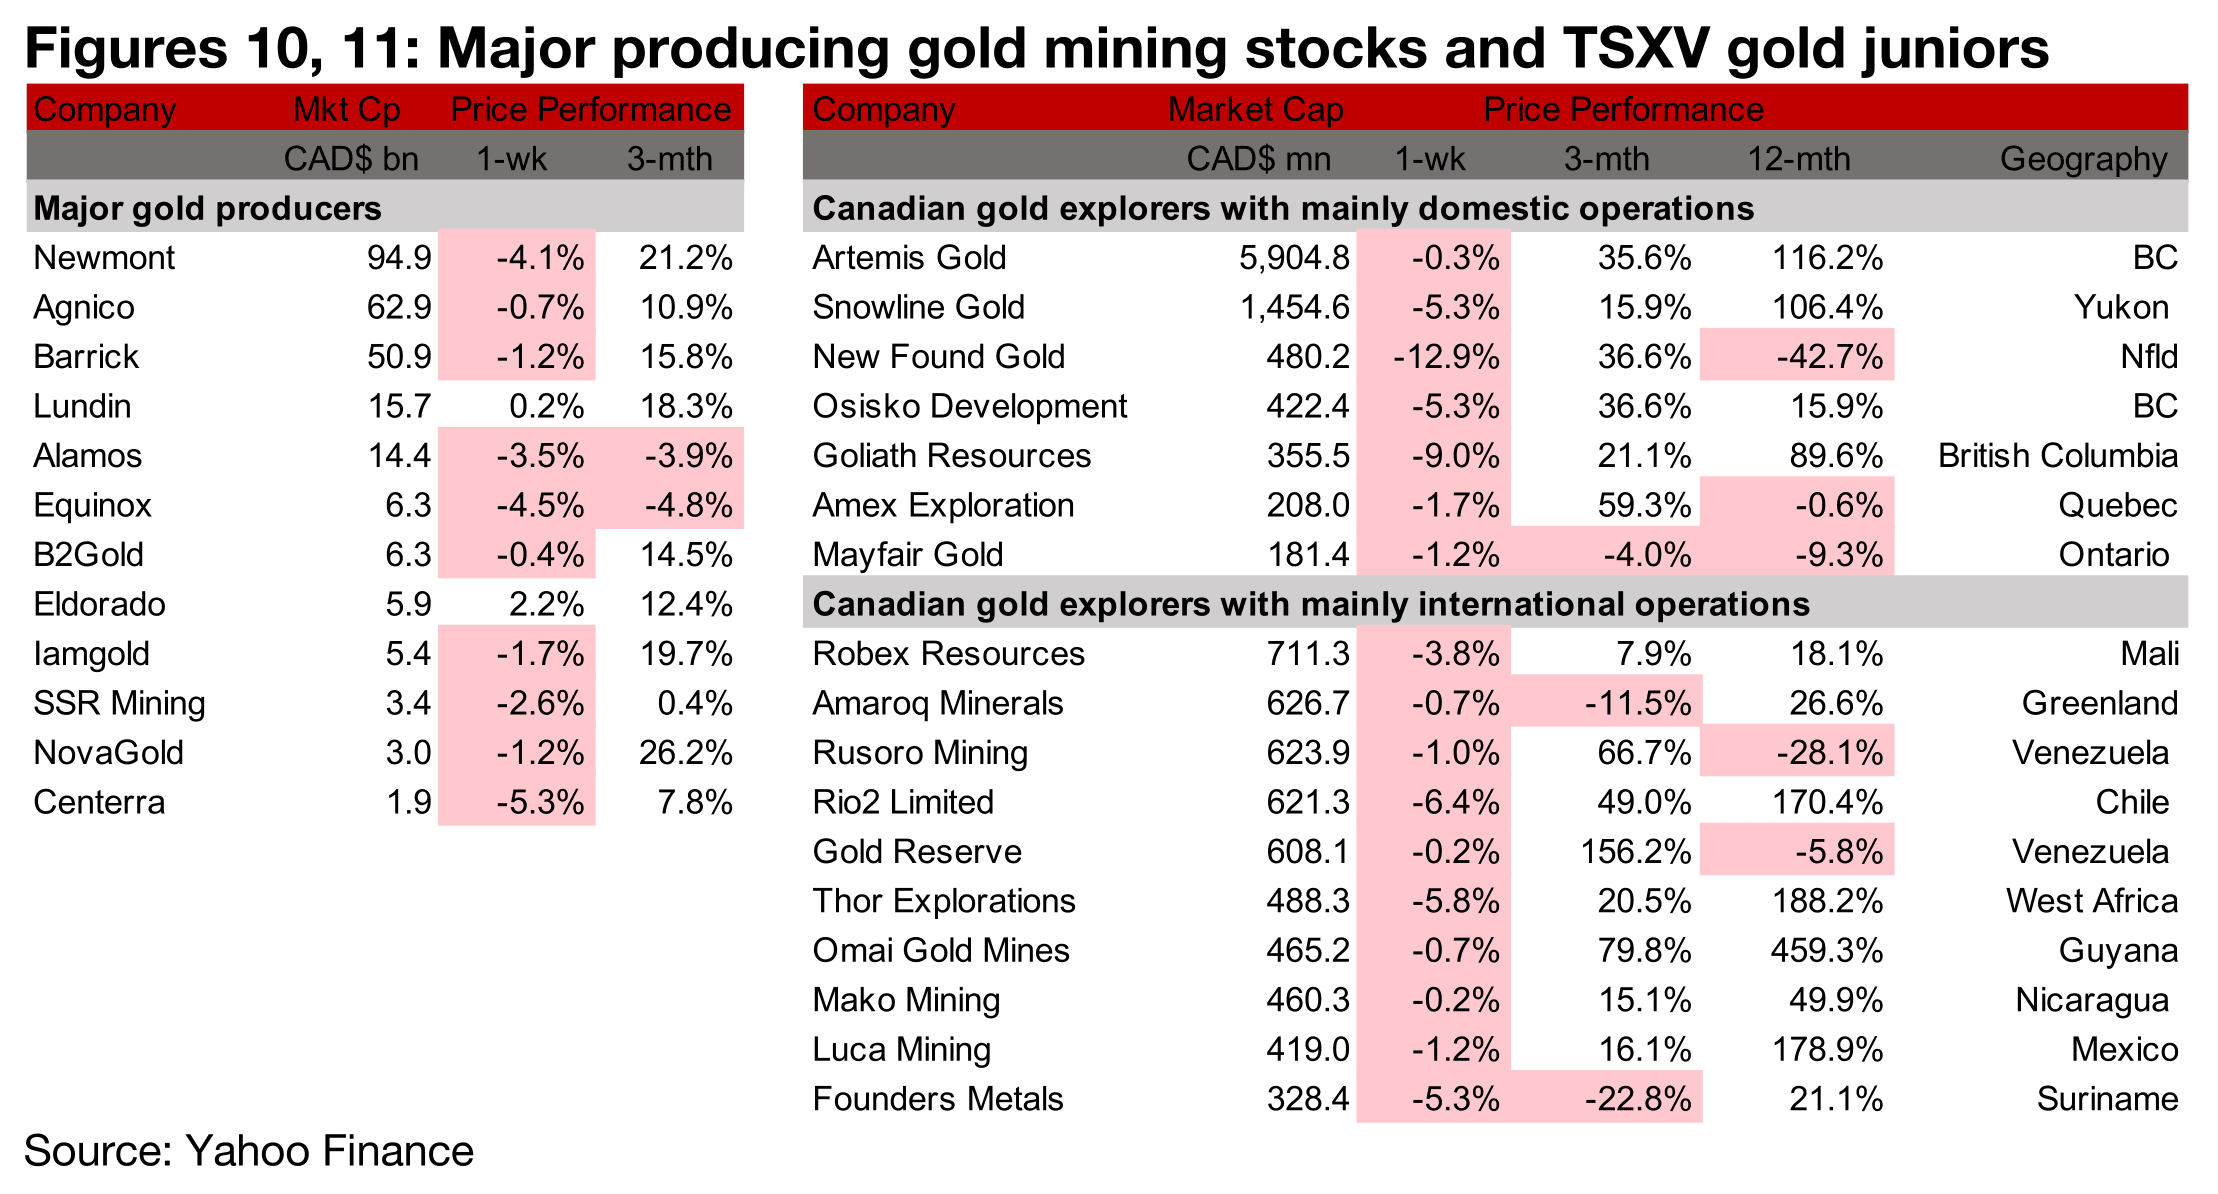
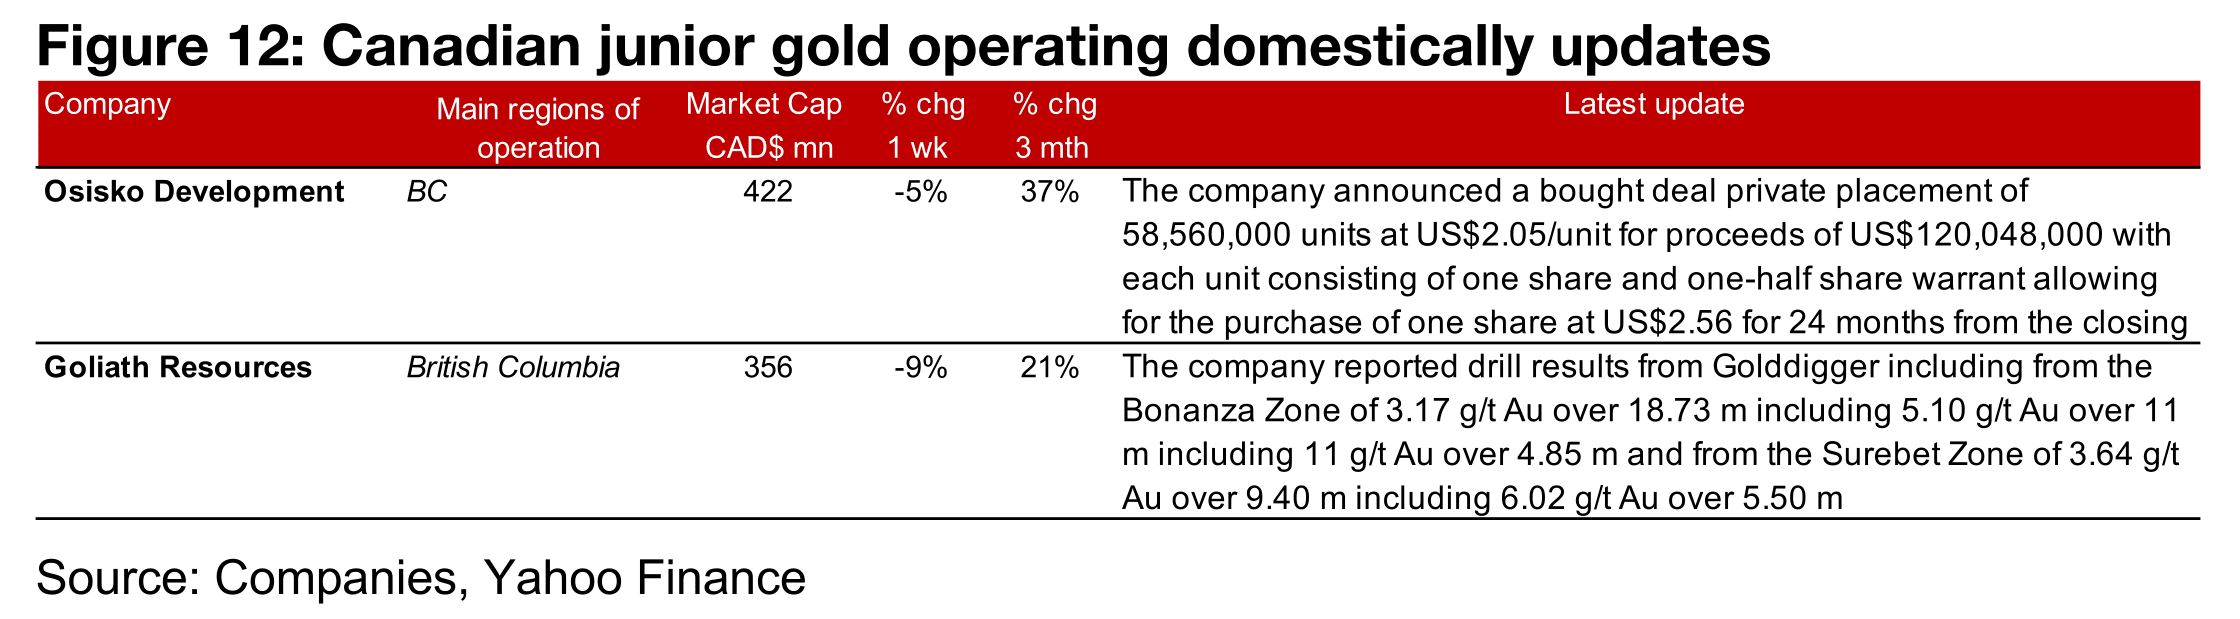
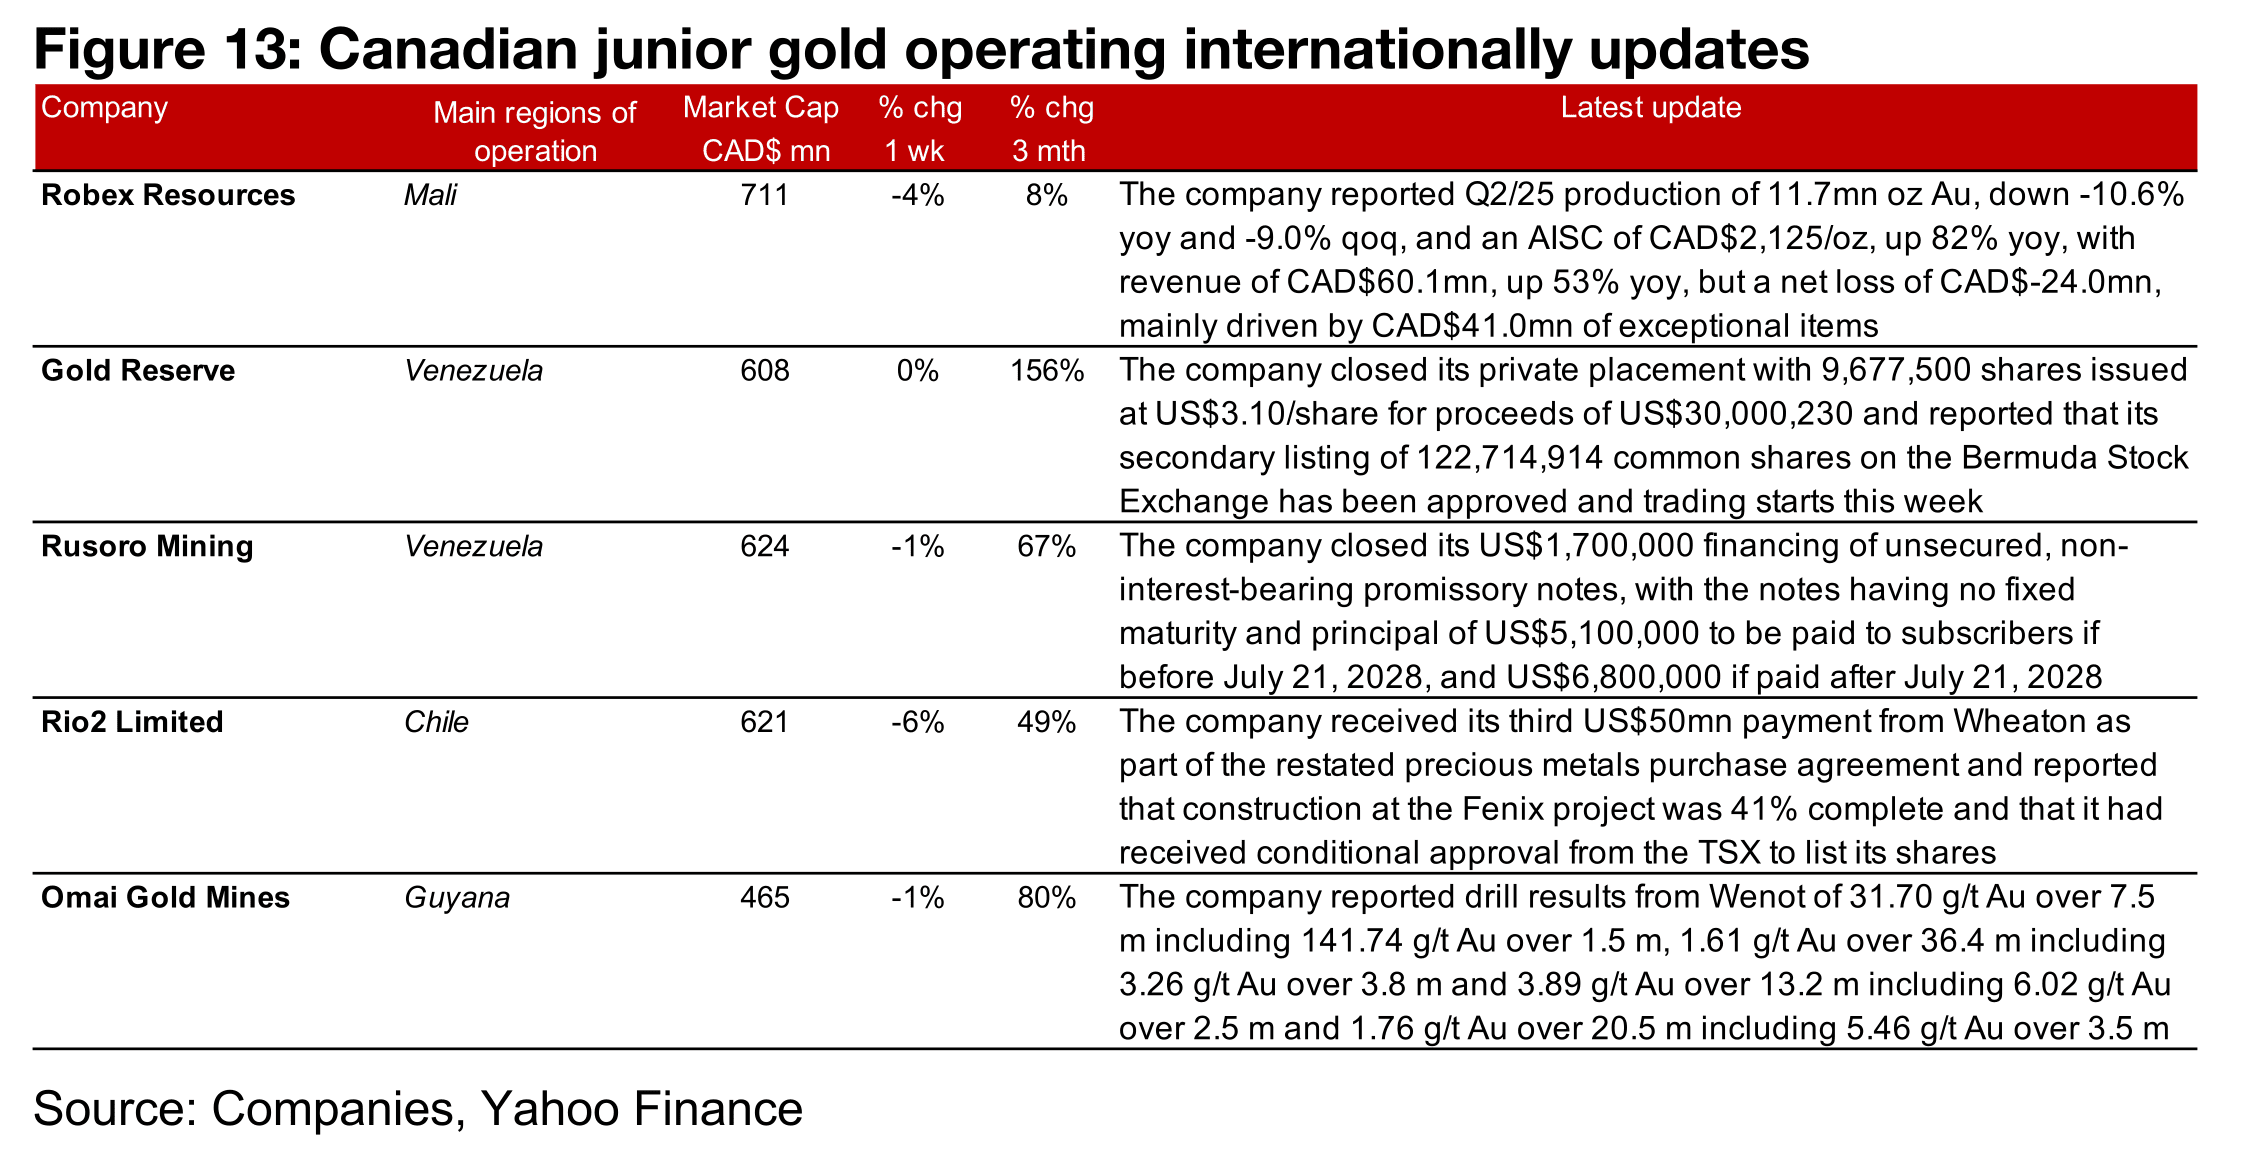
Most of the major gold producers and all of the TSXV gold stocks declined on the drop in equity markets (Figures 10, 11) For the TSXV gold companies operating mainly domestically, Osisko Development reported a US$120.0mn private placement and Goliath Resources reported drill results from the Bonanza and Surebet Zones of Golddigger (Figure 12). For the TSXV gold companies operating mainly internationally, Robex Resources reported Q2/25 production, AISC and other operating and financial statistics, Gold Reserve closed its US$30.0mn financing and its secondary listing in Bermuda was approved and Rusoro Mining closed its US$1.7mn financing of unsecured non-interest bearing promissory notes. Rio2 received its third US$50mn payment from Wheaton, reported that construction at Fenix was 41% completed, and received conditional approval for a TSX listing and Omai reported drill results from Wenot (Figure 13).
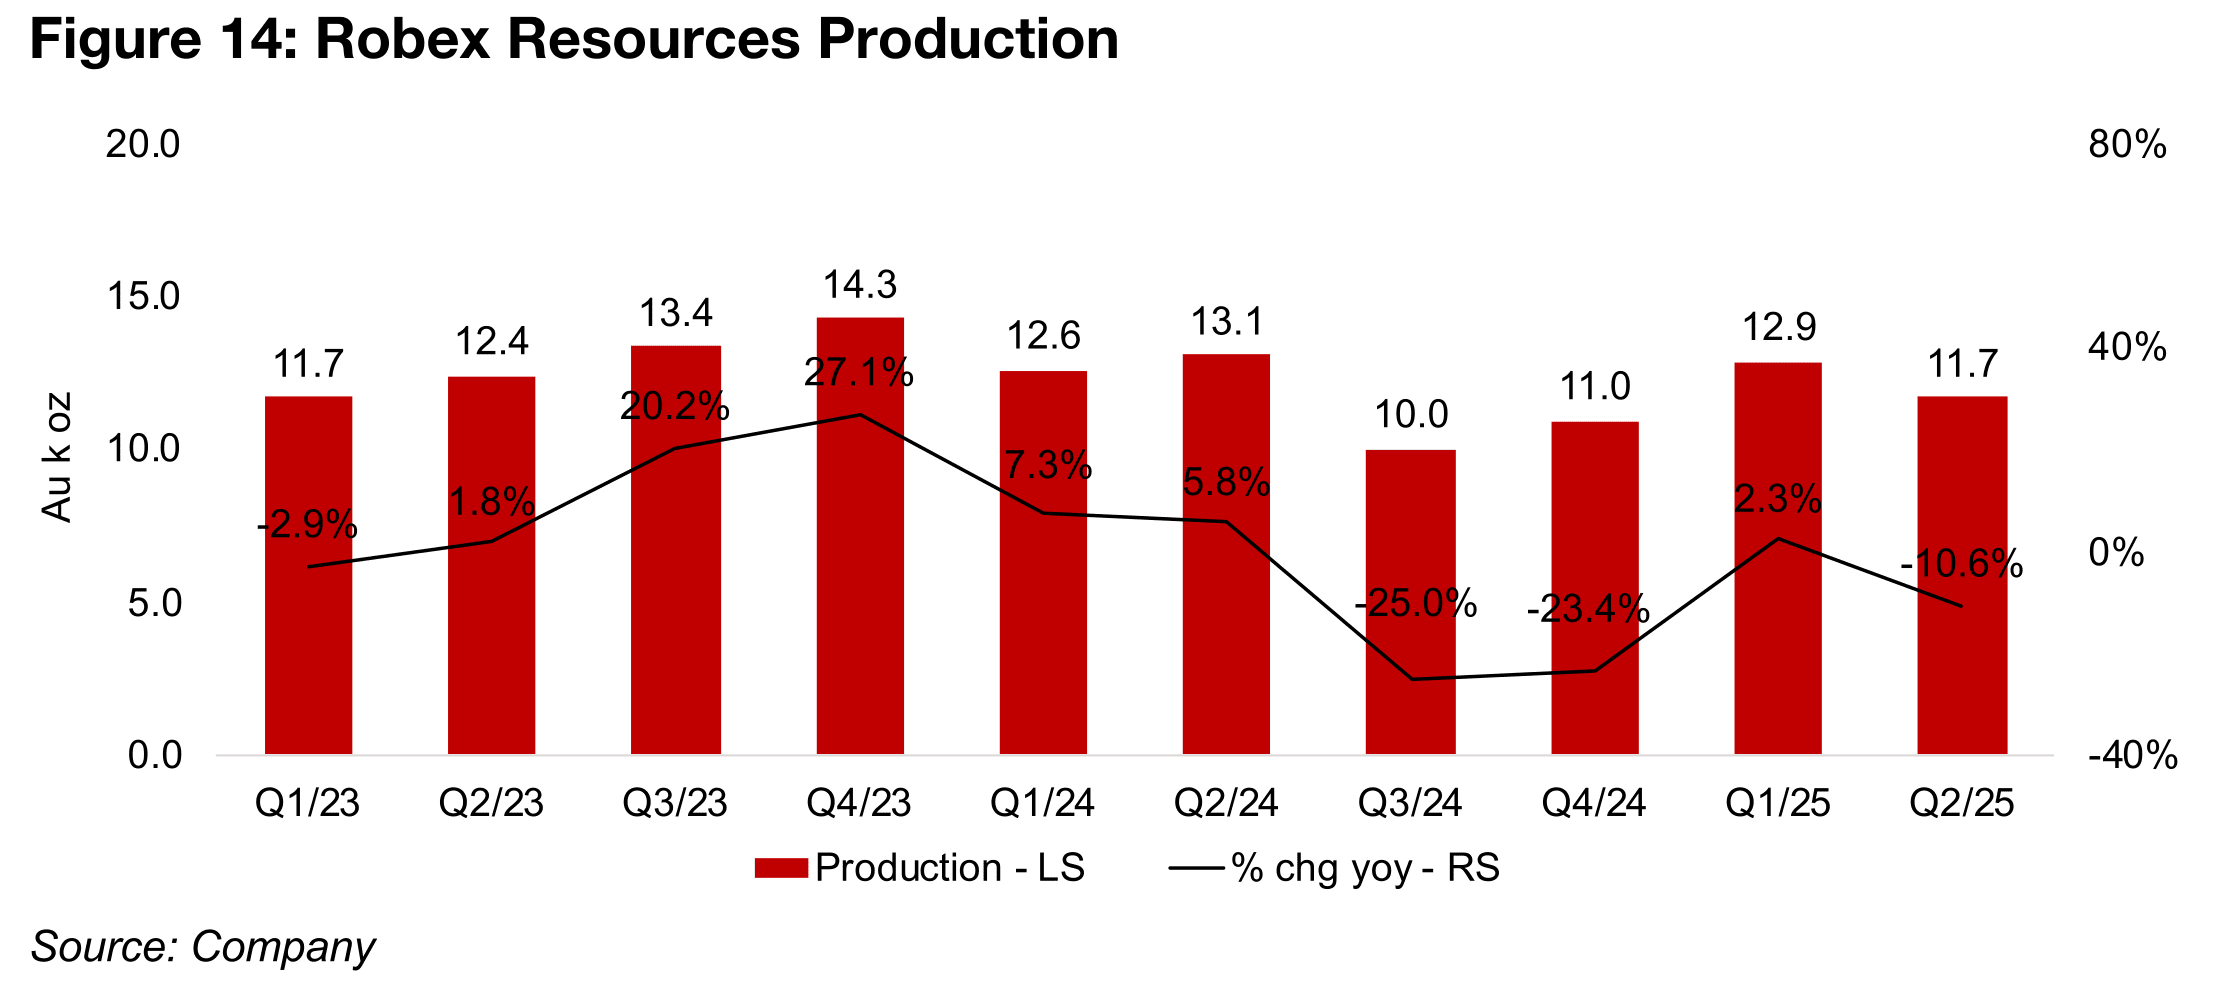
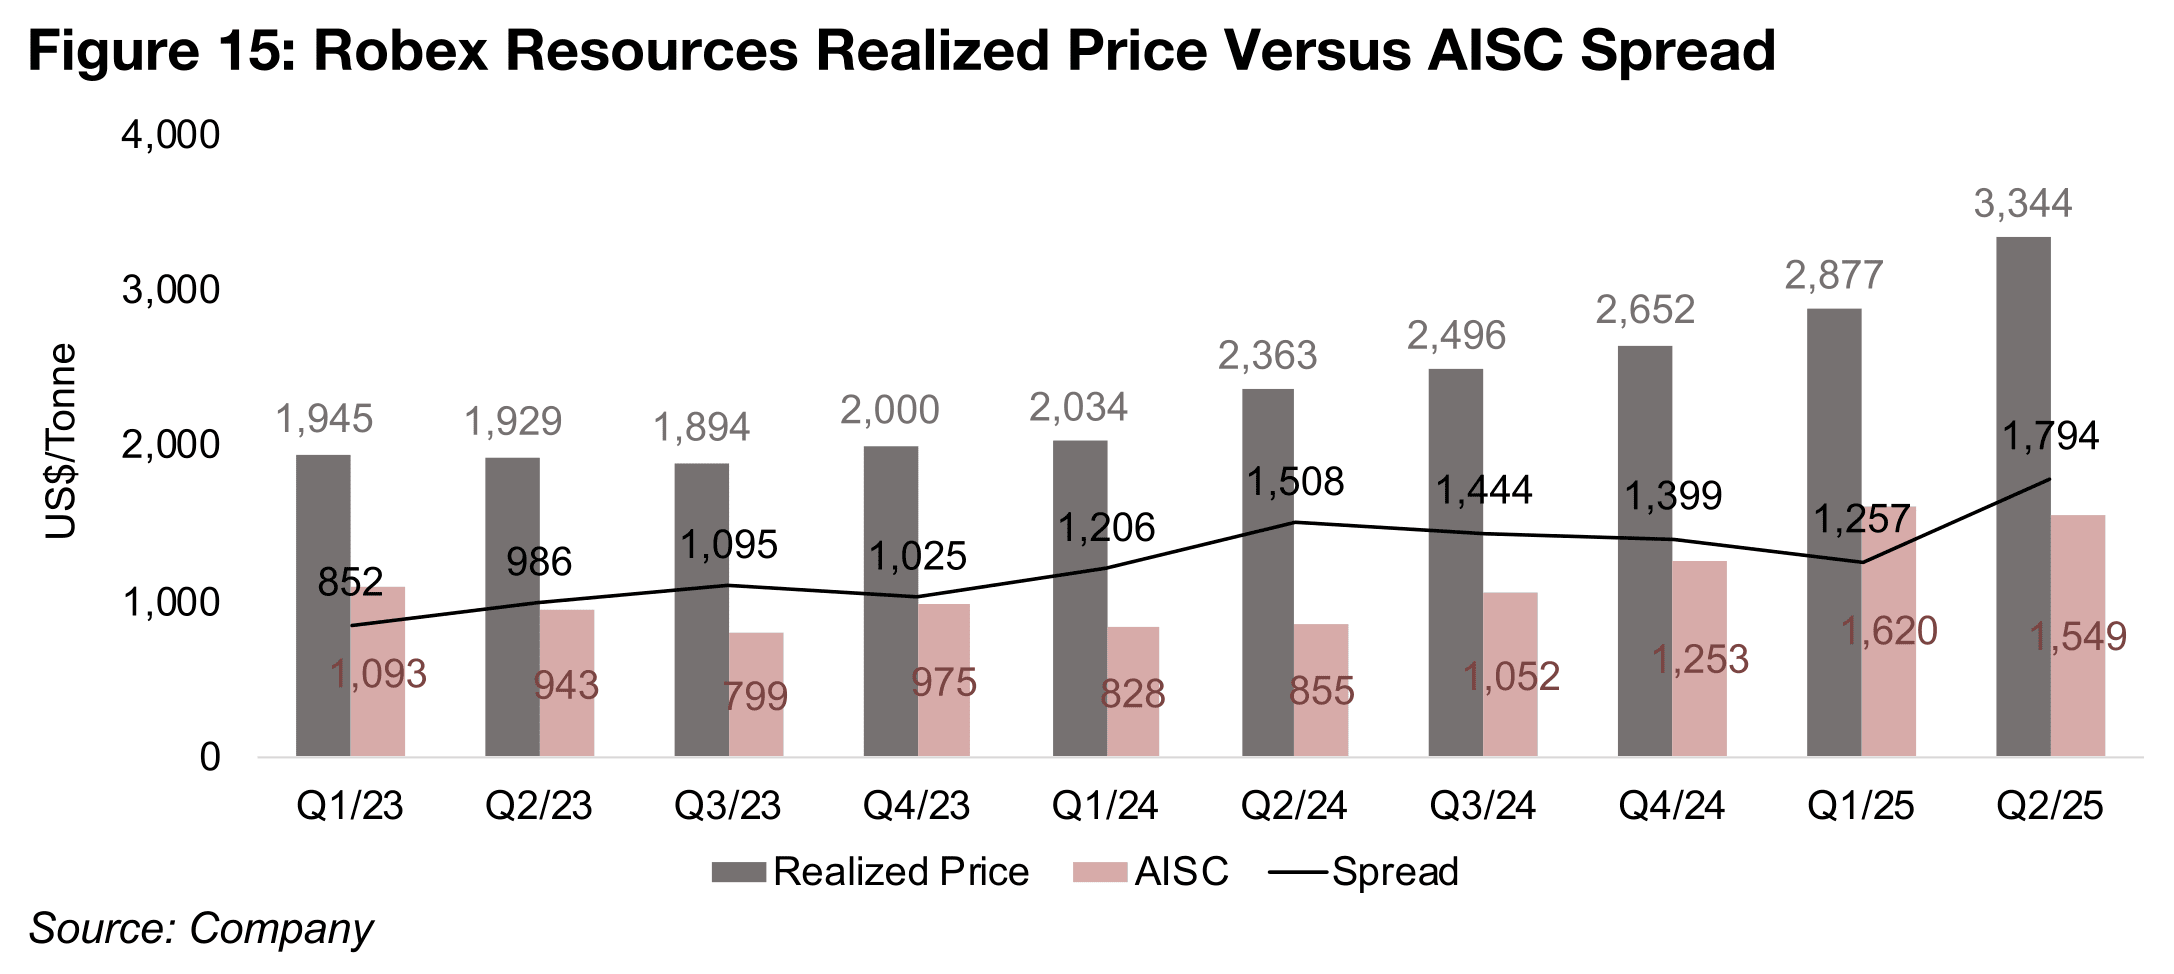
Robex reported Q2/25 operating results, with production from Nampala down -10.6% yoy and -9.0% qoq to 11.7mn oz Au (Figure 14). This was driven by a decline in the grade and recovery in Q2/25 yoy while the ore mined remained near flat. However, revenue still rose substantially, by 21.7% yoy to CAD$60.1mn, as the average realized gold price jumped 51.5% yoy and 16.2% qoq to US$3,344/oz (Figure 15). This outpaced a substantial jump in operating costs, with the AISC up 81.2% yoy to US$1,549/oz, although it declined -9.3% qoq. This saw the realized price to AISC spread rebound to US$1,794/oz, after declining for three quarters from US$1,508/oz in Q2/24 to US$1,257/oz in Q1/25.
The company’s operating income declined substantially to CAD$-24.0mn, down from
CAD$11.4mn in Q2/24 and CAD$16.3mn in Q1/25. However, this was mainly from
exceptional items, including a CAD$20mn loss on the disposal of its subsidiary Africa
Peak Trading House and a CAD$21.6mn settlement that was related to the
company’s acquisition of Sycamore. Excluding the total CAD$41.6 costs from these
two items, the operating profit would rise to CAD$17.6mn, or a 52.7% yoy and 8.1%
qoq increase.
The company’s listing on the ASX on June 5, 2025, raised CAD$107.9mn, and it
amended its US$130mn facility from Sprott Resource Lending, removing the Agent’s
right to the cash sweep, which then allowed for the CAD$34mn to be released to
Robex. The company’s cash balance was CAD$21.1mn as of Q2/25, down from
CAD$41.4mn at the end of 2024, partly from a reduction of debt, which declined to
CAD$20.6mn from CAD$36.1mn over the same two periods.
In addition to the production from Nampala in Mali, the company also has the Kineiro
gold project in Guinea under construction, with it on schedule and budget and first
gold pour is estimated by December 2025. The resources of Kiniero of 2.7mn oz Au
are substantially above the 0.8mn oz Au of Nampala. The company also continues
exploration at Kiniero, with 61,700 m of drilling in Q2/25. Capital expenditure at
Kiniero was CAD$65.3mn in Q2/25 and CAD$99.2mn over H1/25, remaining within
the total guidance of CAD$210mn-CAD$225mn for the project.
Disclaimer: This report is for informational use only and should not be used an alternative to the financial and legal advice of a qualified professional in business planning and investment. We do not represent that forecasts in this report will lead to a specific outcome or result, and are not liable in the event of any business action taken in whole or in part as a result of the contents of this report.
Author
Ben McGregor authors the Weekly Roundup at CanadianMiningReport.com, providing sharp analysis of the metals and mining sector. With a talent for spotting trends, Ben distills complex market shifts into clear, engaging insights on TSXV junior miners. His weekly updates cover gold, copper, uranium, and more, blending data-driven perspectives with a knack for identifying opportunities. A vital resource for investors, Ben’s work navigates the dynamic junior mining landscape with precision.