

September 21, 2026
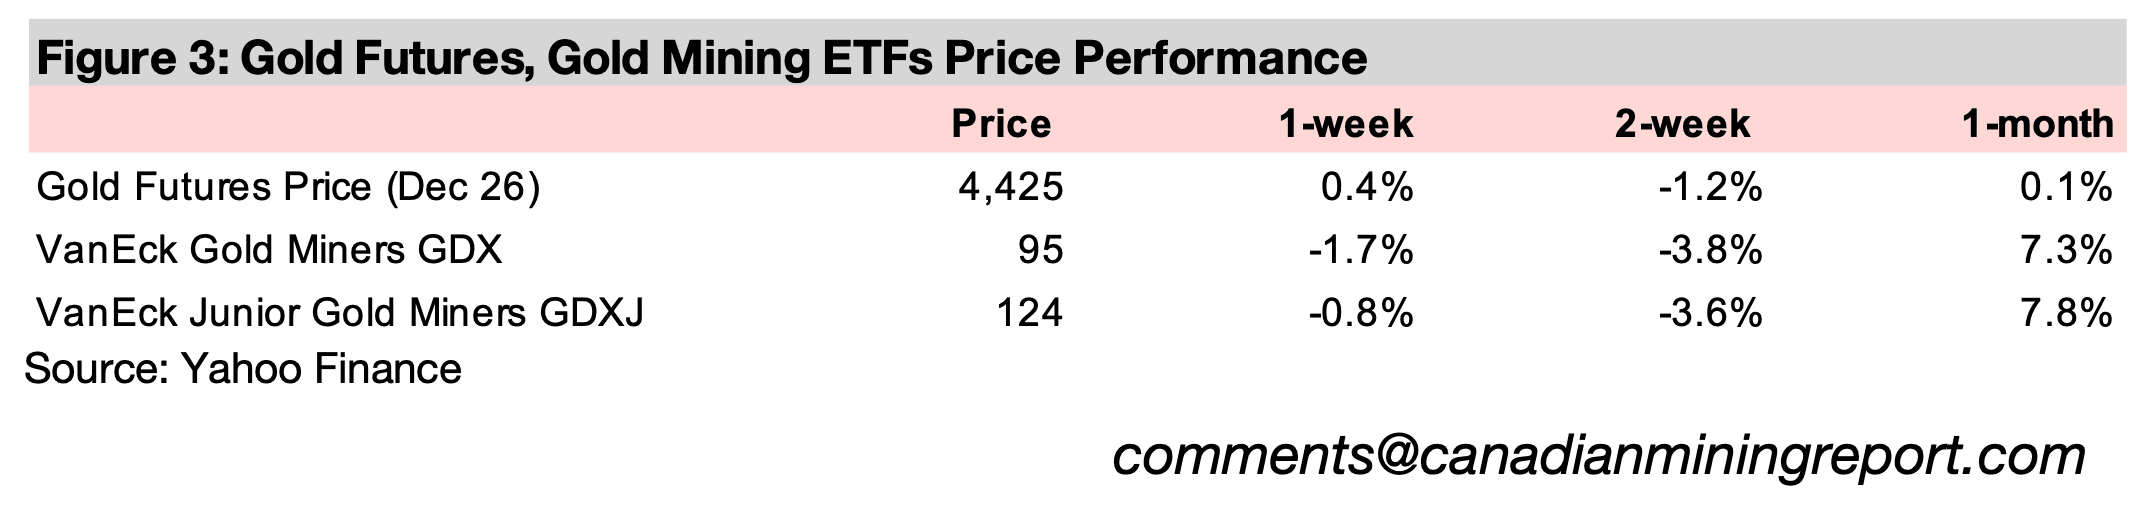
The gold price rose 0.4% to US$4,425/oz, even as the Fed hiked rates and indicated another potential increase this year, driving up bond yields and the US$, which move inversely to the metal, as the move was widely expected by the market.
Even with rates rising, the gold price has been supported by offsetting factors including relatively loose global financial conditions with the money supply still expanding and economic and trade policy and geopolitical risks still elevated.
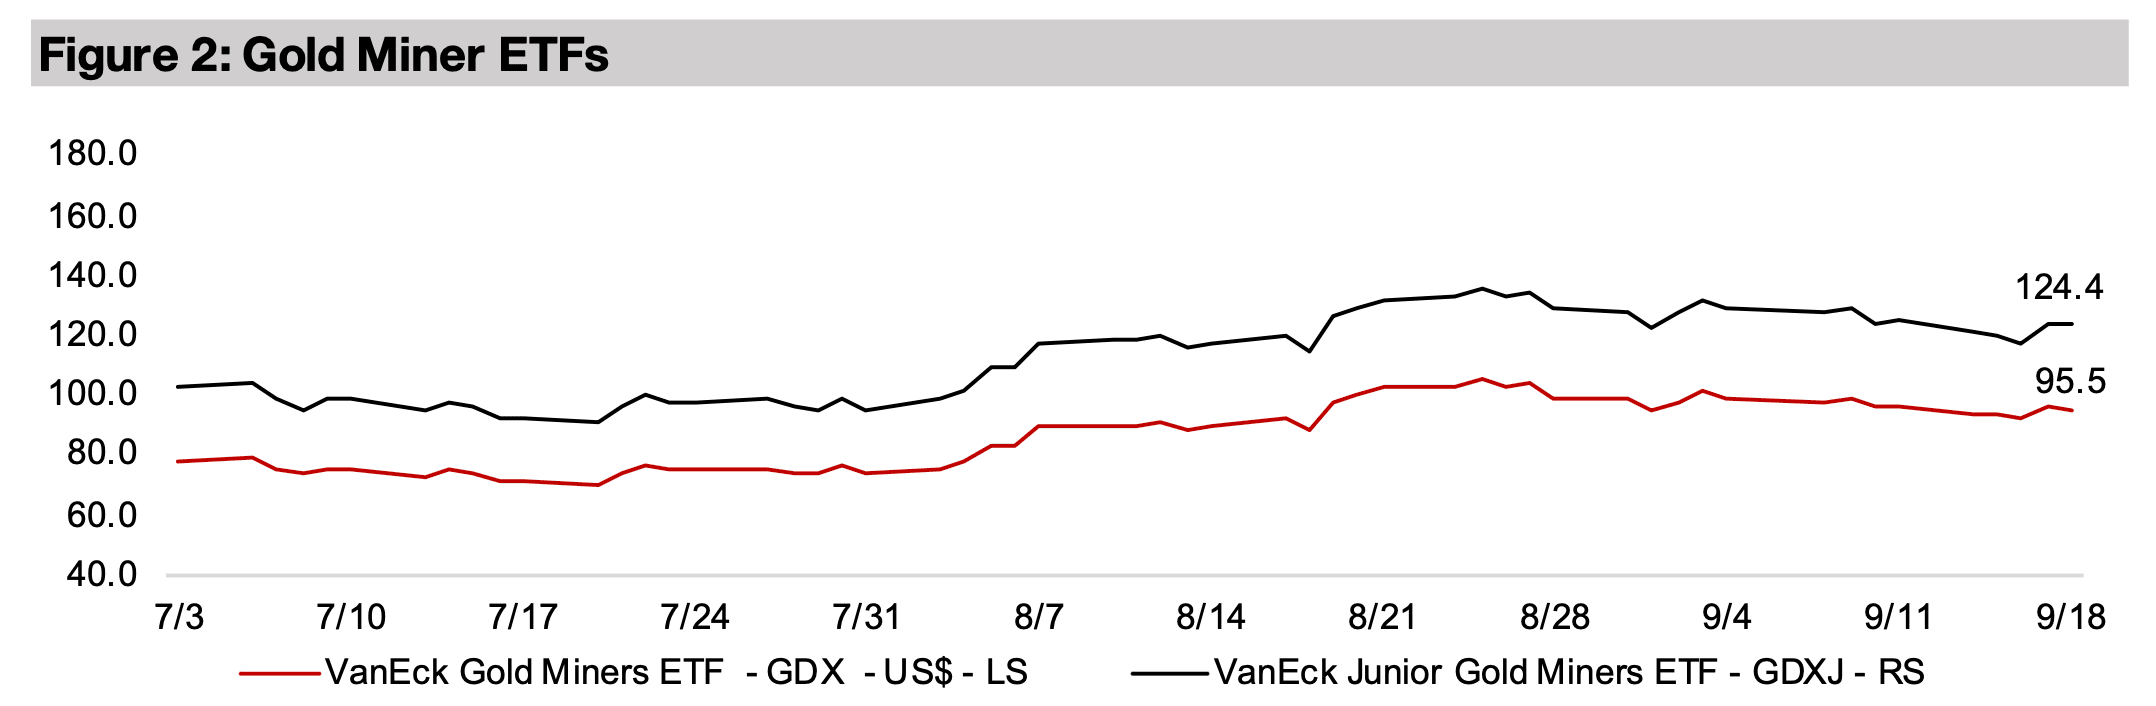
The gold stocks declined, with the GDX down -1.8% and the GDXJ outperforming with only a -0.8% drop, as it was boosted by a rebalancing which included the addition of a much higher number of new stocks than usual.


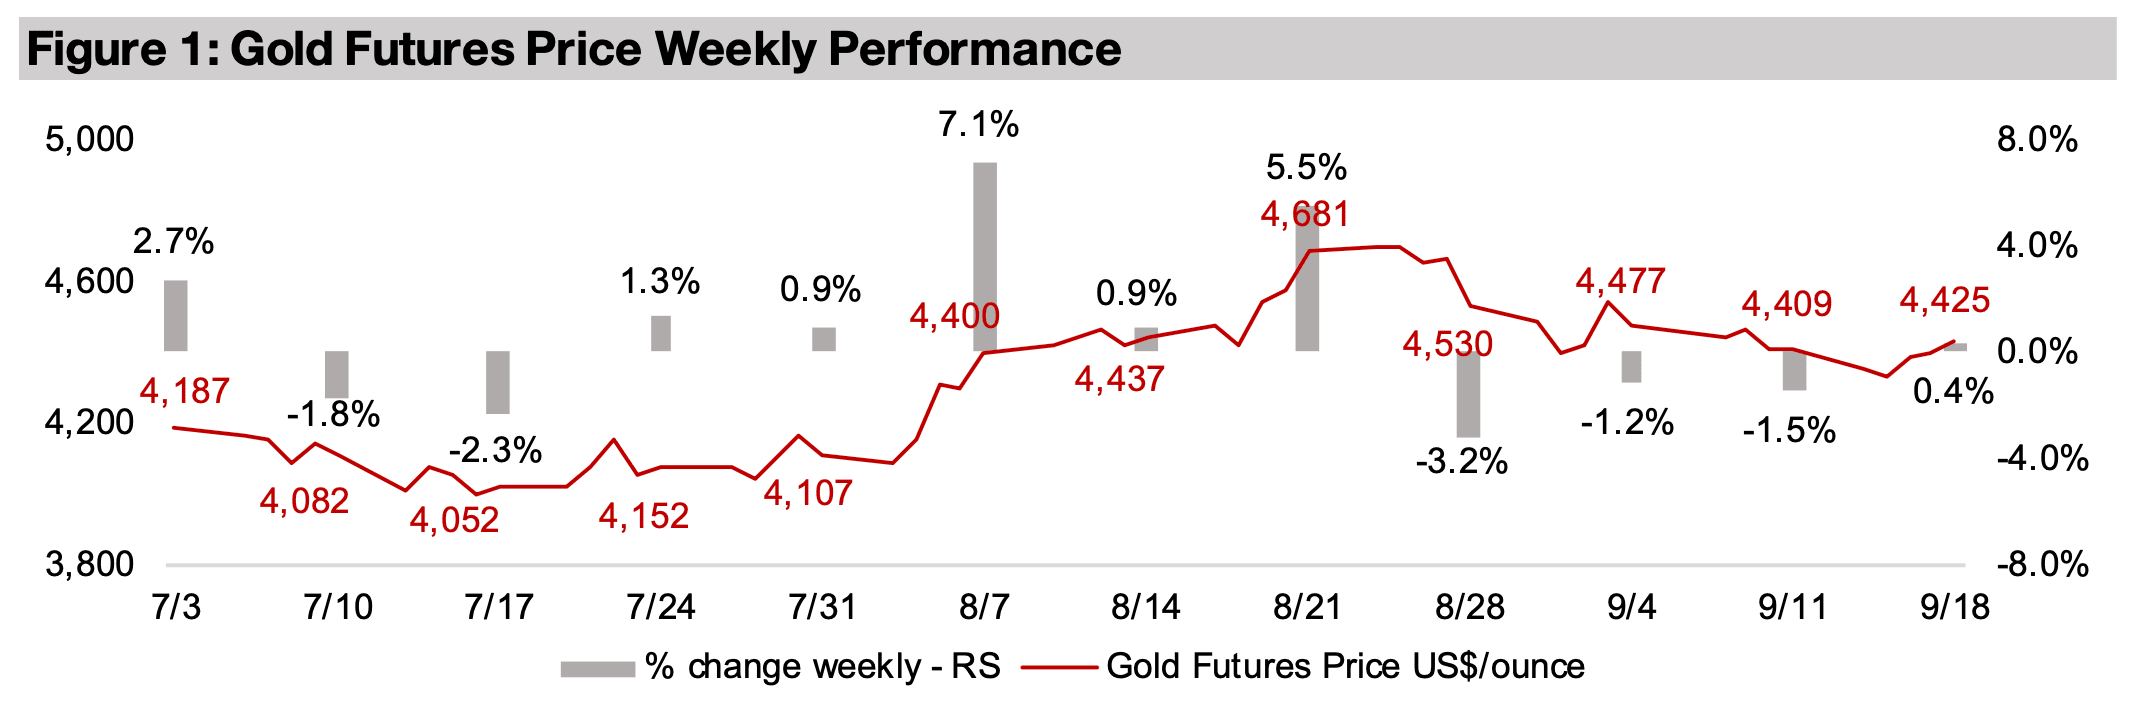
The gold price rose 0.4% to US$4,425/oz as the Fed boosted interest rates, even
though a decline might have been expected, as this drove an increase in bond yields
and the US$, with both tending to move inversely to the metal. This may have partly
been because a 0.25% rate hike was widely expected, having reached a probability
of 86.5%, and a worst case scenario of a 0.50% increase was not realized. The hike
was driven by still elevated inflation in the US and the recent jump in oil prices that
implied that this could continue or worsen. It was also supported by a very low US
employment rate versus the long-term average, and while recent US job additions
have been mixed, the overall slowdown was not severe enough to see rates held flat.
Some quite hawkish commentary followed from the central bank indicating a high
likelihood of an additional hike this year, and the market sees an 88% probability of
at least another 0.25% by December 2026.
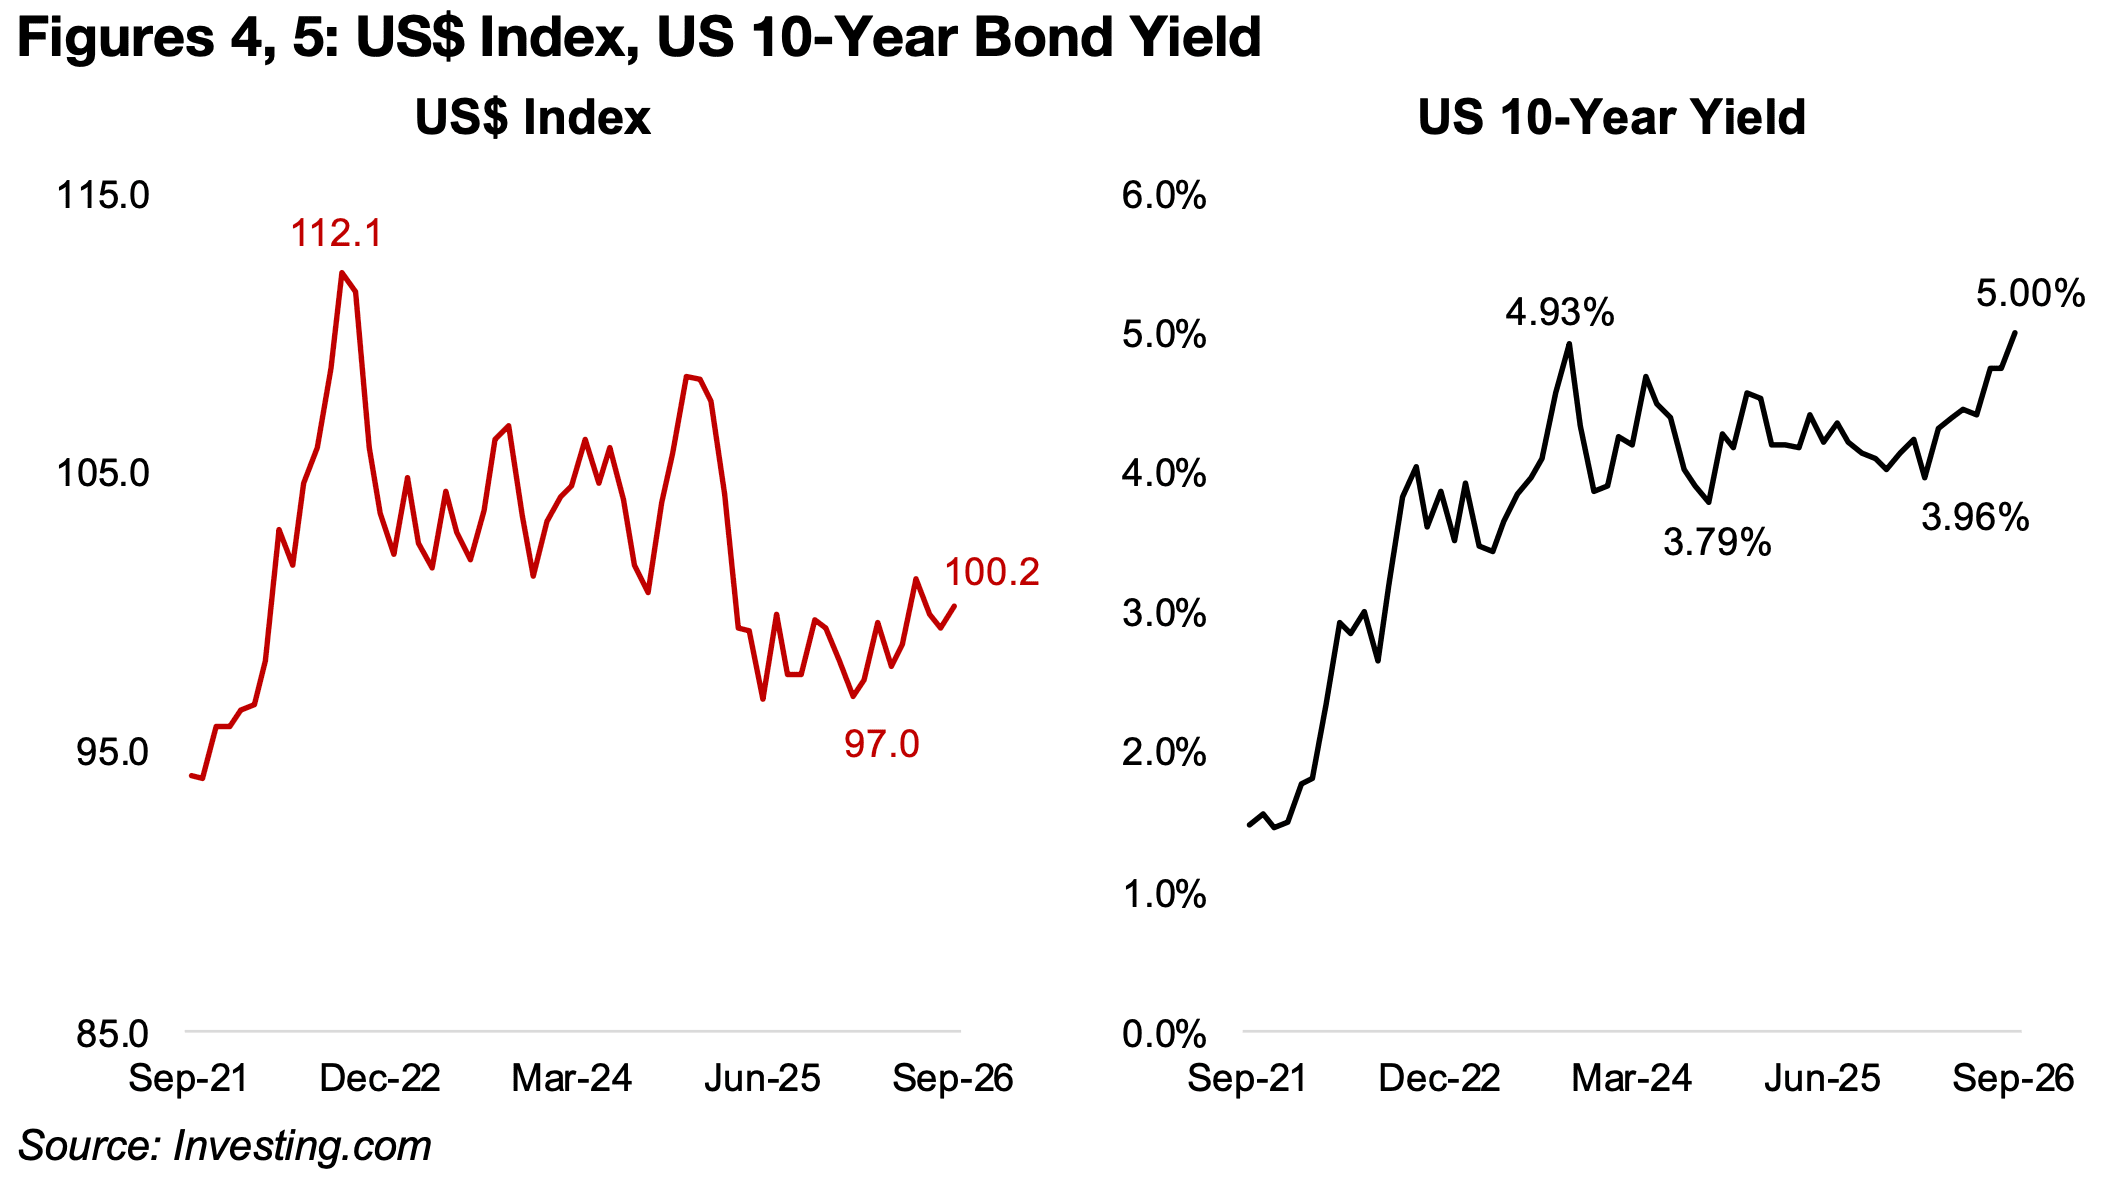
The US dollar index rose to 100.2, just under its most recent June 2026 highs of 101.1
and continuing an overall uptrend for most of this year from lows of 97.0 in January
2026 (Figure 4). The 10-year bond yield reached 5.0%, the highest level in twenty
years, and widely considered a critical benchmark in terms of potentially dampening
economic activity (Figure 5). This will increase pressure from interest payments on
heavily indebted global governments, and we have already seen the US intervene in
both bond and currency markets, especially the Yen, attempting to reduced longerterm rates and decrease Japan’s incentive to sell off its large US debt holdings.
Higher yields could also curb corporate and household borrowing, especially
mortgages for the latter, with the sector a key driver of economic growth.
The larger cap equities shrugged off these risks, with the S&P 500 up 0.5%, and the
Nasdaq jumping 1.9%, although small caps declined, with the Russell 2000 losing -
0.5%, showing that the higher rates did drive a degree of risk off. While the gold
stocks fell, the GDXJ outperformed with a -0.8% drop, as it saw a major rebalancing
with a substantially larger number of new additions than is typical, versus the -1.7%
decline for GDX. Both ETFs have made reasonable gains this year overall, even with
the slump in the gold price earlier this year, with GDX up 11.4% and GDXJ adding
9.9%. They have been outpaced by MSCI Metals and Mining ETF, up 18.0%, which
is driven mainly by companies producing copper, which has risen strongly this year,
and iron ore. The mining sector overall been outpaced by US tech, up 28.5%, while
energy has taken the lead this year on the Middle East war, rising 37.5%.
There has not been a full shift into risk on this year however, as evidenced by the
underperformance of Bitcoin, down -9.7%, one of the weaker performing major
sectors. However, there has also not been a clear swing towards defensives either,
with the gold sector up, but the utilities sector still down -4.8%. However, it is
debatable how much of a pure defensive sector utilities has been for the past year,
and it has seen a strong boost from electricity demand from the data centers driving
the AI boom, and therefore has also become somewhat of a growth sector.
While the tech and mining sectors have been in an extended battle for the stronger
performance several times over the past few years if we consider only one or two
quarters at a time, for the entire period back to 2024, there is only one definitive
winner. It is the mining sector, and it is really not even close, with the GDXJ up 234.3%
and GDX gaining 212.4%, almost double the 114.9% gain in US tech (Figure 6).
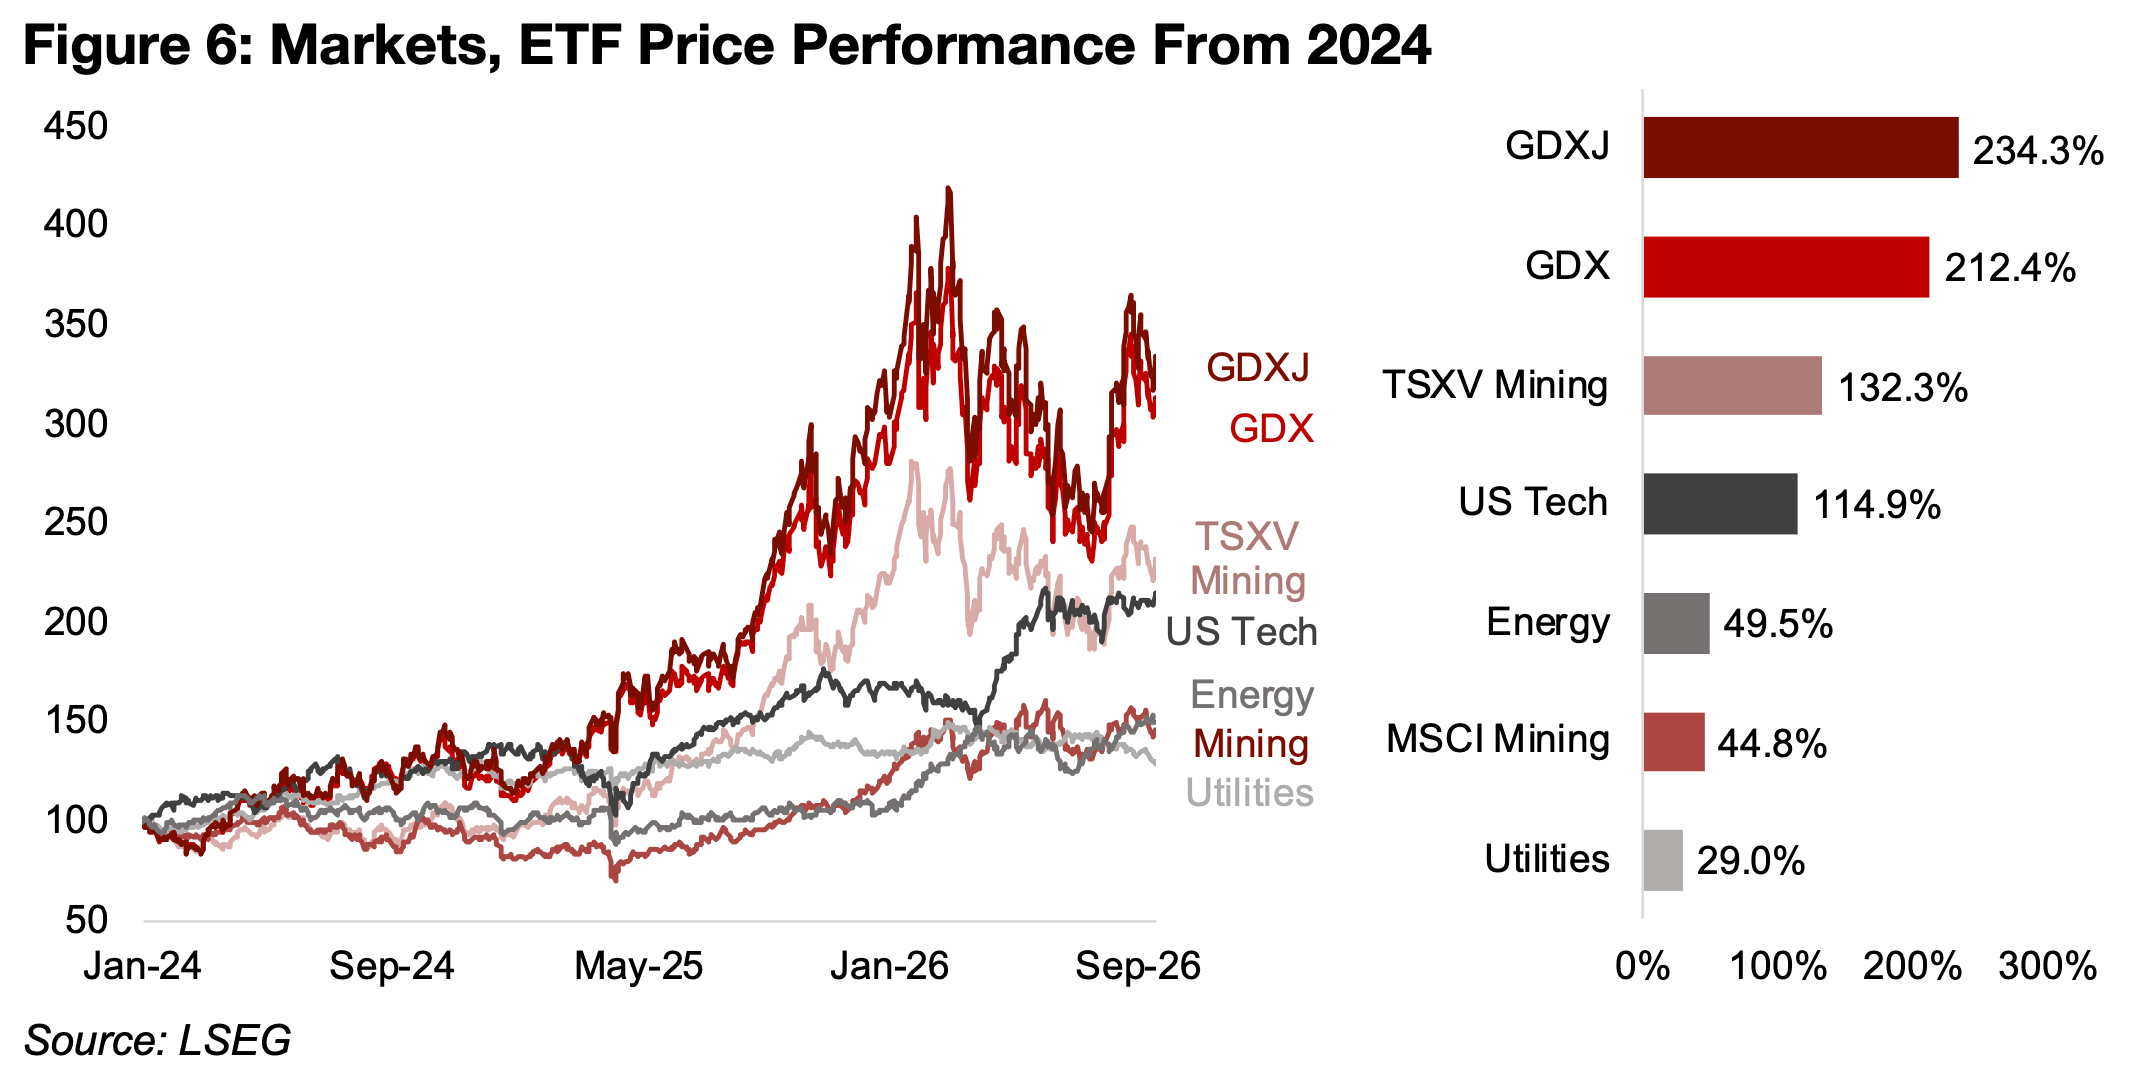
Also interesting is that even the TSXV Mining index, which is comprised almost entirely of microcap stocks, with usually only about twenty or so small caps, has actually moderately outperformed US tech since 2024, with a 132.3% increase. Of course the enormous size of global tech’s market cap and its high weighting in indices makes it one of the only places that very large funds either can, or must, invest. However, for small non-institutional investors where the absolute size of the sector is less of an issue, the TSXV Mining would have returned more than US tech over the past three years. The energy sector has lagged, up only 49.5%, as a significant increase only began in March 2026 this year, just ahead of the 44.8% gain in the MSCI Mining ETF, while the utilities sector is up just 29.0%.
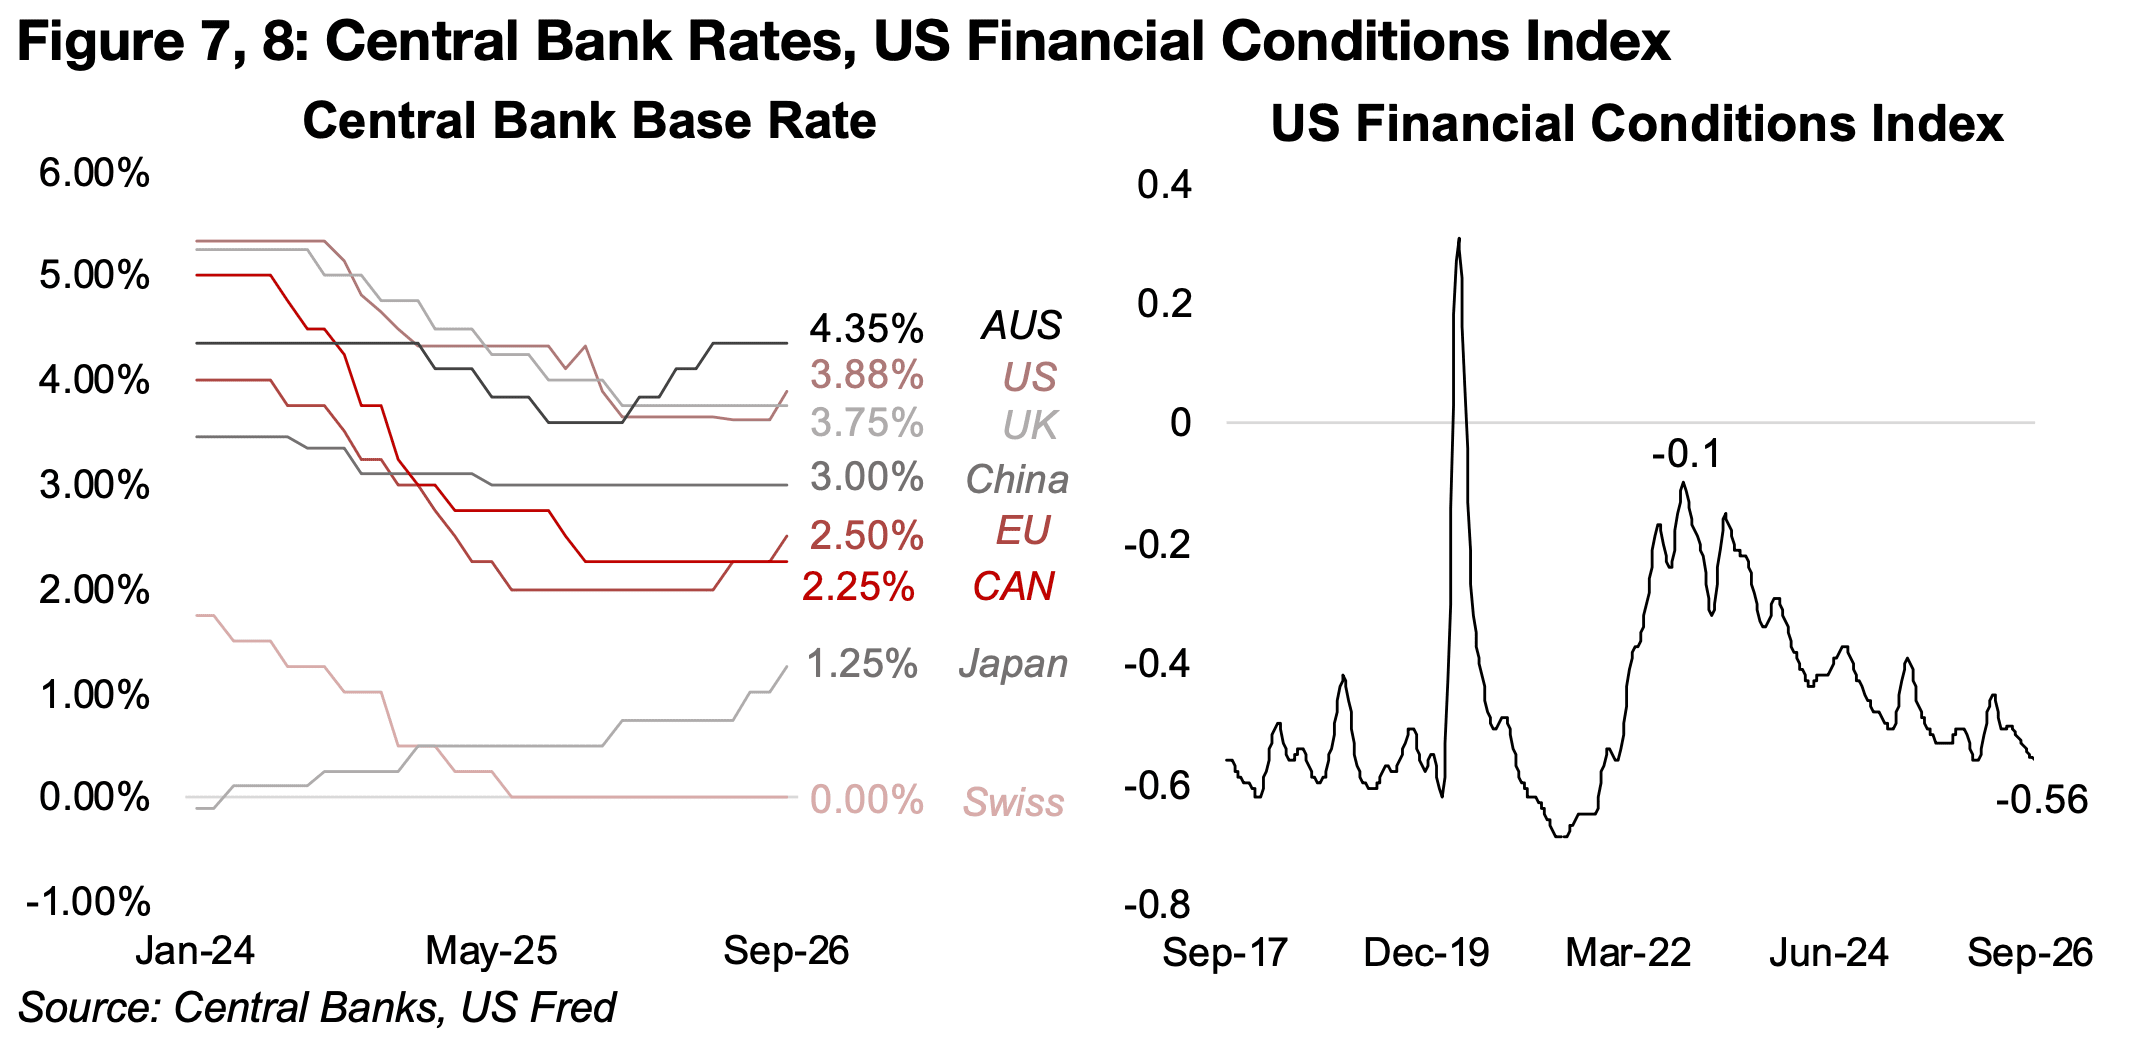
While the US finally hiking rates does point to a degree of monetary tightening, overall
global financial conditions still remain relatively loose. The most significant hikes have
come from the Reserve Bank of Australia, giving it the highest rate of the major central
banks at 4.35%, with the EU and Japan also both having boosted rates recently
(Figure 7). However, China, the UK and Canada have all maintained rates for an
extended period, and Switzerland has been at zero for over a year. This still does not
indicate a major tightening of global monetary policy overall.
The US Financial Conditions index, with values below zero showing an easing
monetary situation, has had a continued a downtrend to -0.56, from highs near zero
in late 2022 (Figure 8). The sudden spike towards tighter conditions in 2020 was
driven by the global health crisis, and another rapid rise in 2022 was still caused by
its aftermath. The low level of the index currently gives some room for tightening
before any major deterioration of financial conditions, and without the extraordinary
driver of the global health crisis there could be a more gradual increase.
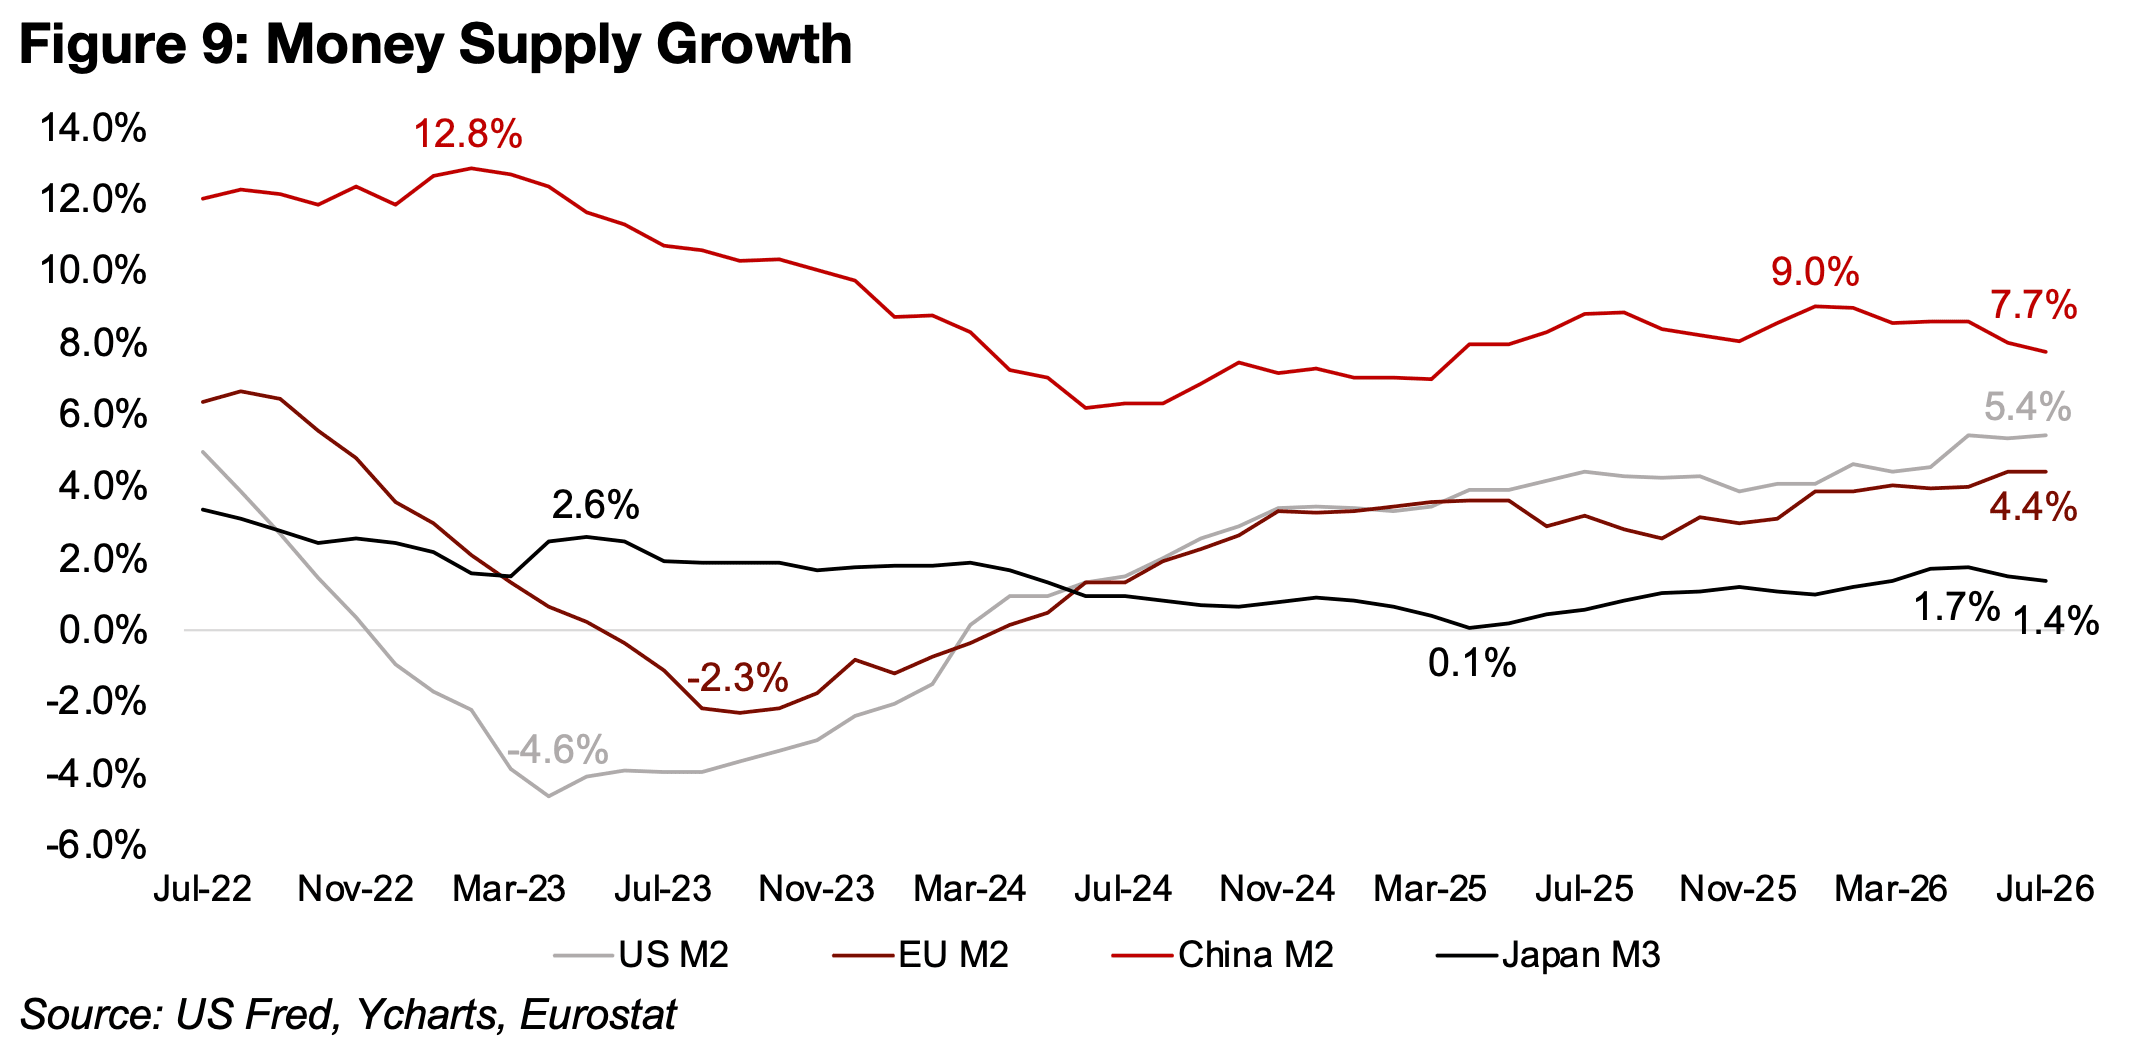
Money supply growth has continued to be strong, with the M2 of the US rising at 5.4%
yoy as of July 2026 and trending up consistently from lows of -4.6% in early 2023
(Figure 9). The M2 for Europe was up 4.4% in July 2026, up from lows of -2.3% in the
middle of 2023, with the growth somewhat more flat than the US over the past year.
While China’s M2 growth has declined to 7.7% from a peak of 9.0% in late 2025, this
is still by far the highest increase of the world’s four largest money supplies. This has
also come even as China has left rates on hold, indicating that the pressure on money
supply growth is not coming from central bank policy, but somewhere further down
the line. This could include reduced demand for credit by industry and households
given lower economic growth rates for the country in recent years. The rising interest
rate in Japan seems to be starting to affect the money supply, with the rise in the M3
declining to 1.4% from the recent high of 1.7% in May 2026.
However, for none of these regions are we seeing an actual contraction in the money
supply, with gold’s main driver over the longer-term tending to be a rise in the
monetary base. While the recent US and EU rate hikes have come only this month
and will not be reflected yet in these growth rates, we suspect that changes have
been marginal enough that we are unlikely to see the money supplies of these two
decline significantly. The global money supply therefore could continue to grow into
2027 and support the gold price, unless there are several rapid hikes into near year.
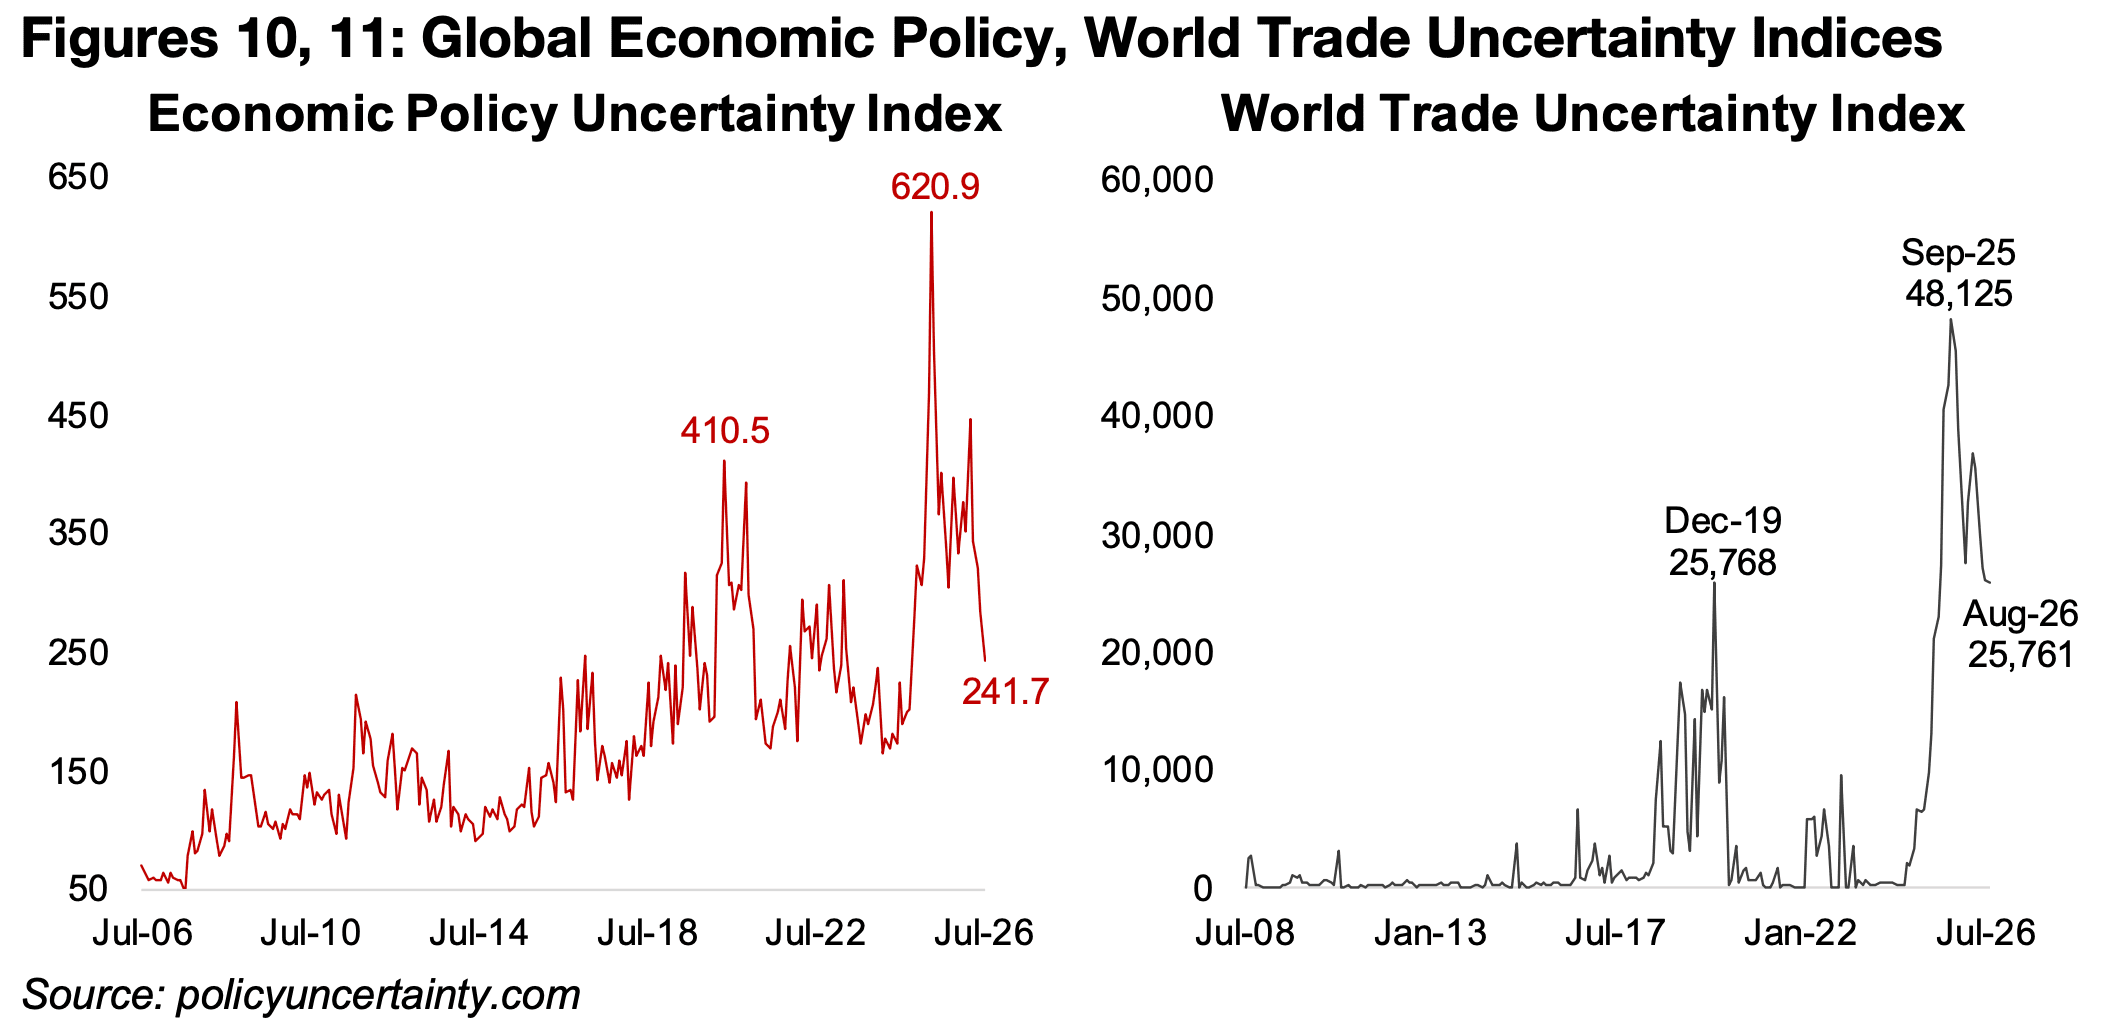
The gold price is also likely currently being support by still highly elevated broader
global risks. While the Economic Policy Uncertainty Index has dropped to just 241.7
in August 2025 from a 620.9 peak, this level is still towards its highs if we exclude
extraordinary spikes during the global health crisis and then as the new US
administration started to implement policies from early 2025 (Figure 10).
The World Trade Uncertainty Index has similarly plunged to 25,761 in August 2025
from the 48,125 peak which was driven by US trade policy, but is still extremely high
versus its history (Figure 11). This has been driven by the major shift towards US trade
protectionism, where the country had previously been leading the global system
towards more open trade for several decades, indicating that a historic shift in policy.
With gold a hedge against overall risk, it does seem that there could be somewhat of
a premium in the metal for economic risks that are likely at their highest in at least
twenty years, if not fifty, or even seventy.
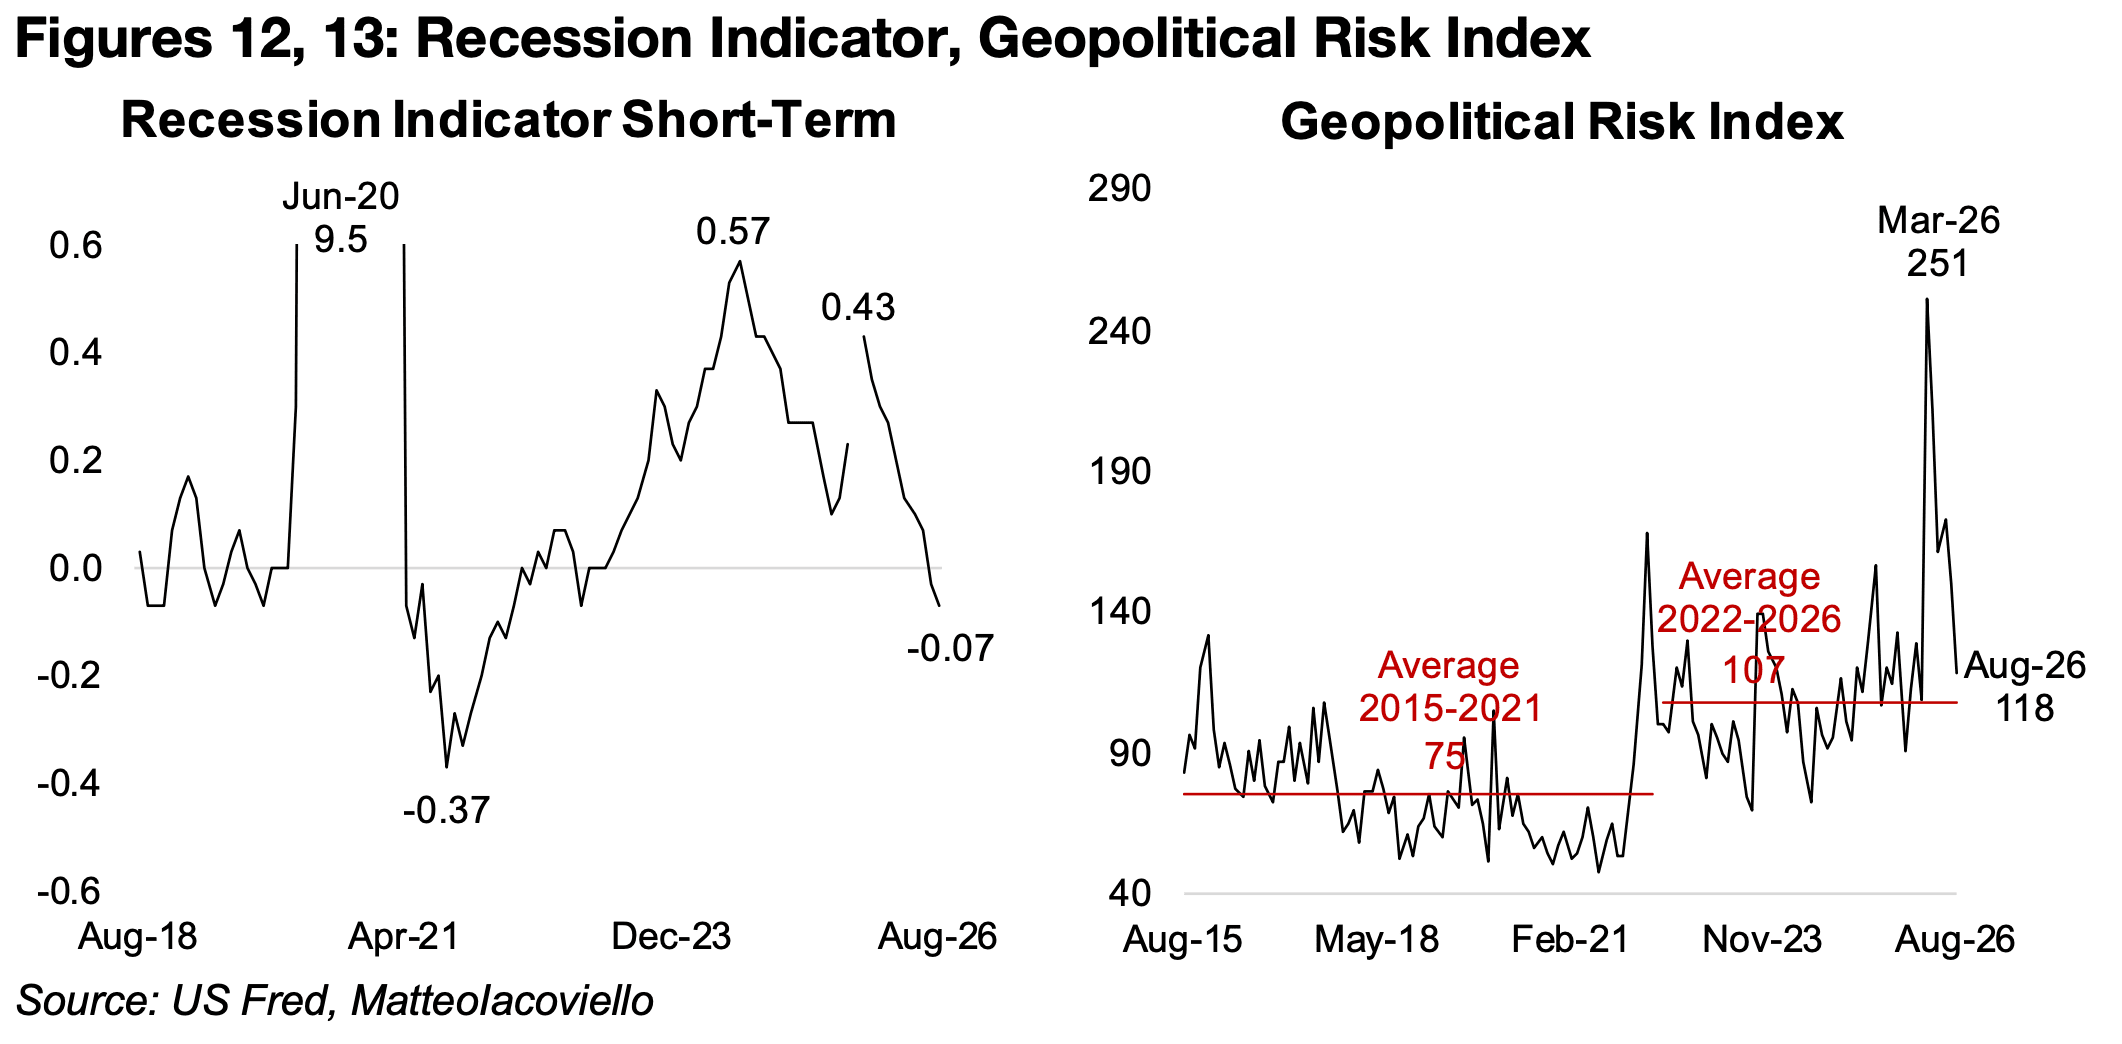
Currently there is limited indication of a US recession from the Real Time Sahm Rule
Recession Indicator, which seeks to use more current data to track the economy than
the GDP reported by the government which generally has a lag of a few months
(Figure 12). For this indicator levels below zero are considered to show a relatively
low level of recession risk and as of August 2026, it has dropped to -0.07, suggesting
that the US economy remained healthy as of last month. This indicator could be
considered as actually negative for the gold price, as it might support rate hikes and
imply higher real yields.
The Geopolitical Risk Index is another indicator that has slumped from its highs, at
251 in March 2026, to 118 as of August 2026, but still remains elevated versus the
historical average (Figure 13). The current level is just above the 107 average from
2022-2026, which is far above the average of 75 from 2015-2021, indicating the last
four years have been quite politically volatile. With conflict in the Middle East generally
rising since September 2026 this Index could potentially increase again, and high
geopolitical risk tends to be supportive of the gold price.
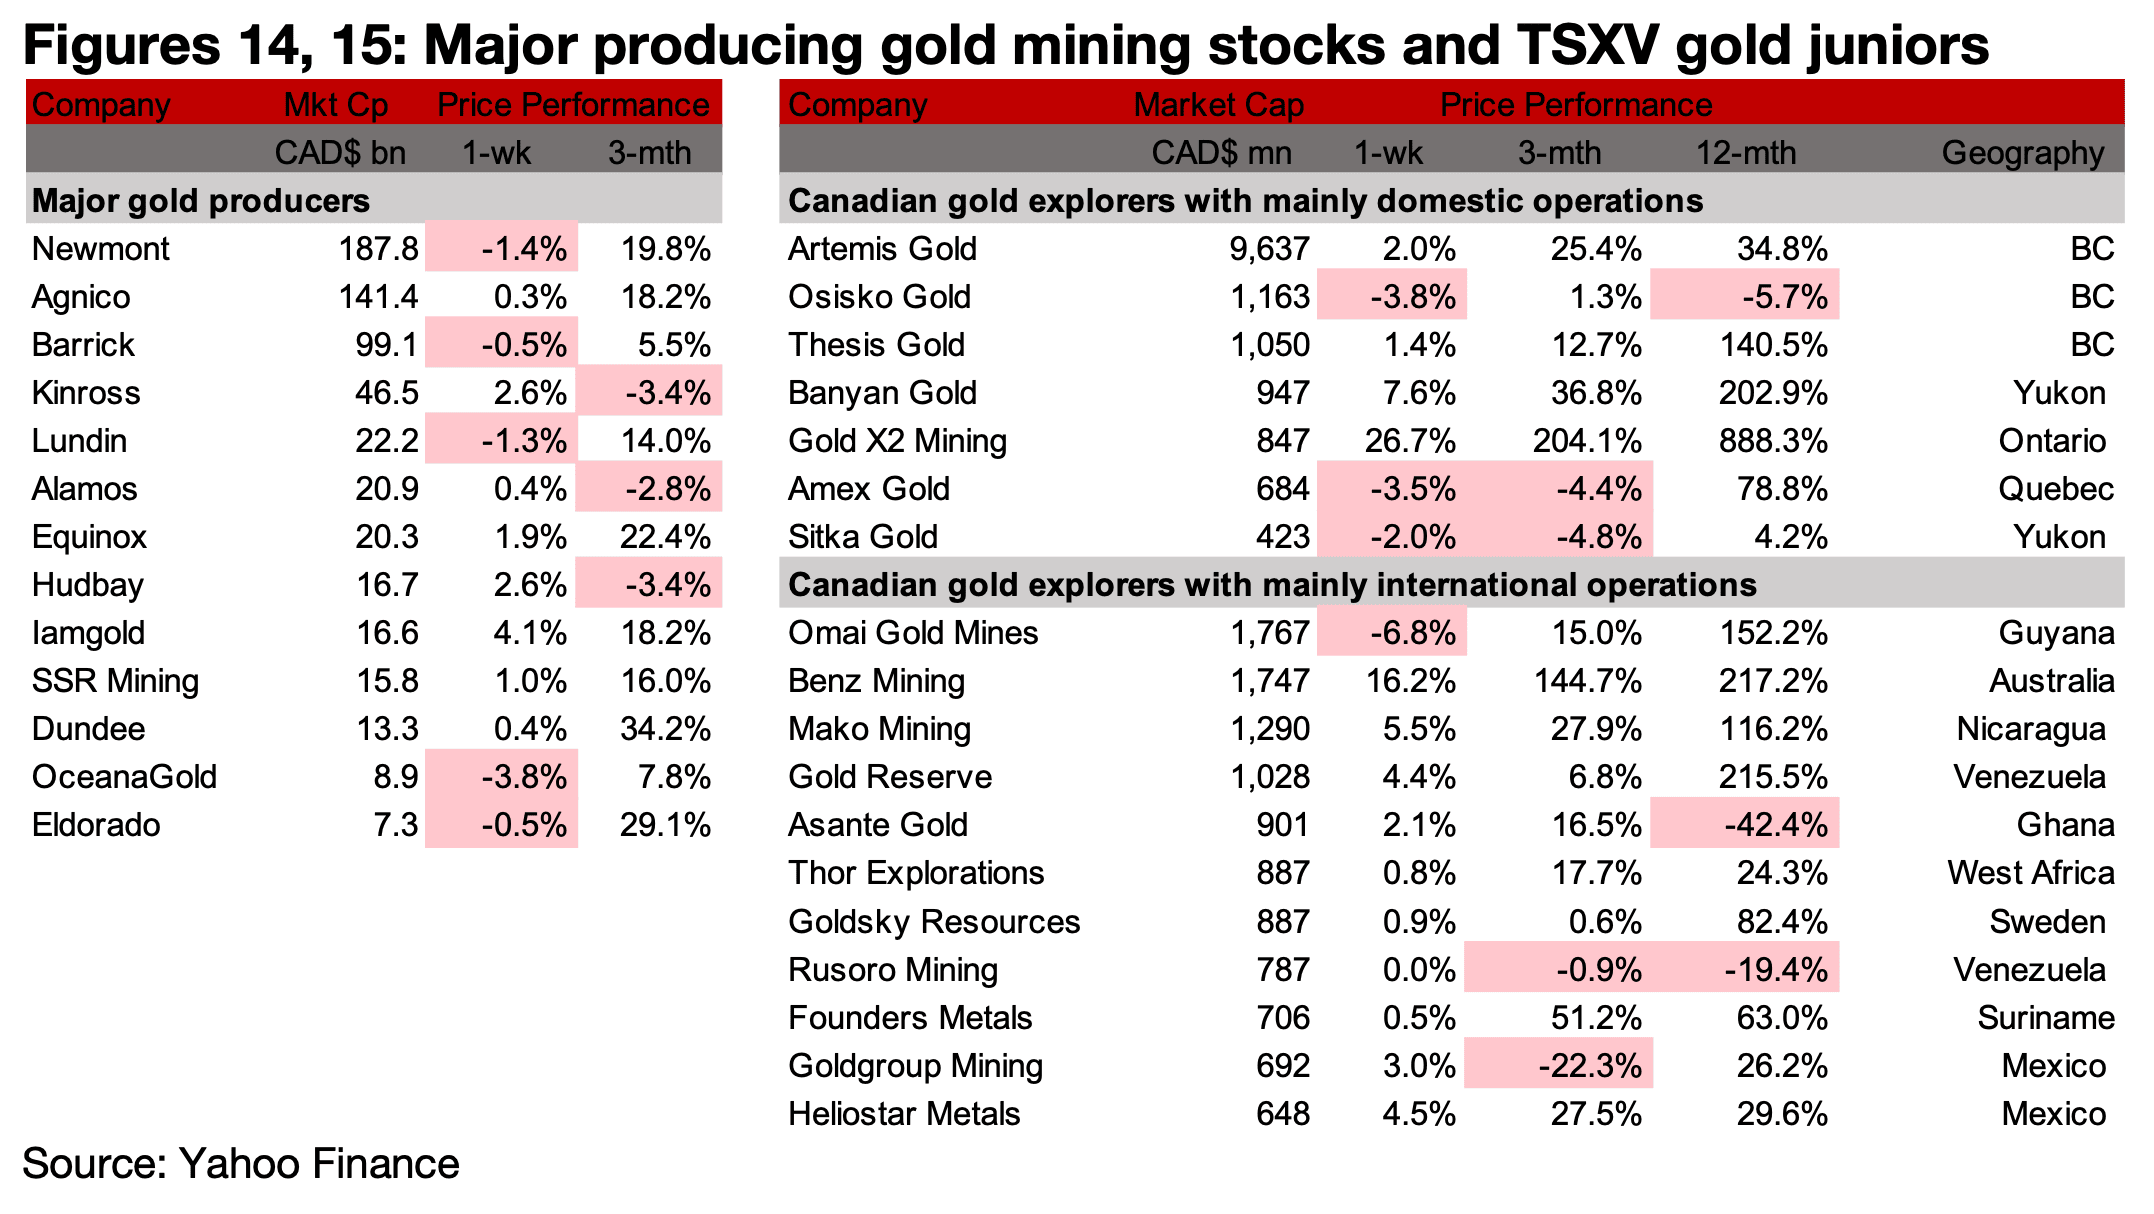
The major producers and TSXV gold mainly rose on the slight gain in the metal price
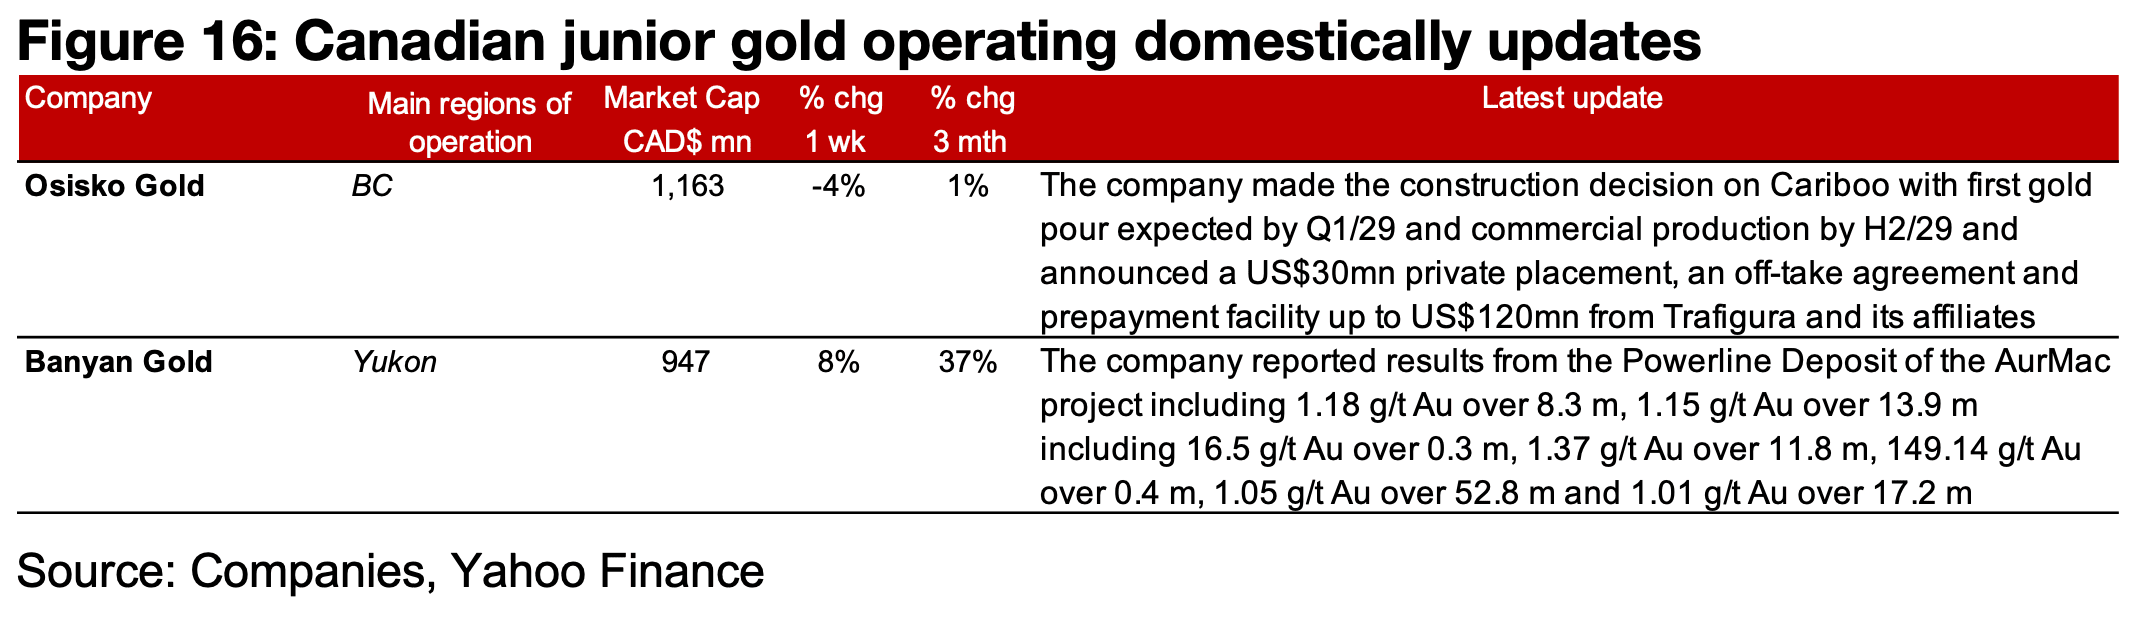
(Figures 14, 15). For the TSXV gold companies operating mainly domestically Osisko
Gold made the construction decision on Cariboo with first gold expected by Q2/29
and commercial production by H2/29 and announced a private placement, off-take
agreement and prepayment facility with Trifigura and its associates and Banyan
reported drill results from the Powerline Deposit of the AurMac project (Figure 16).
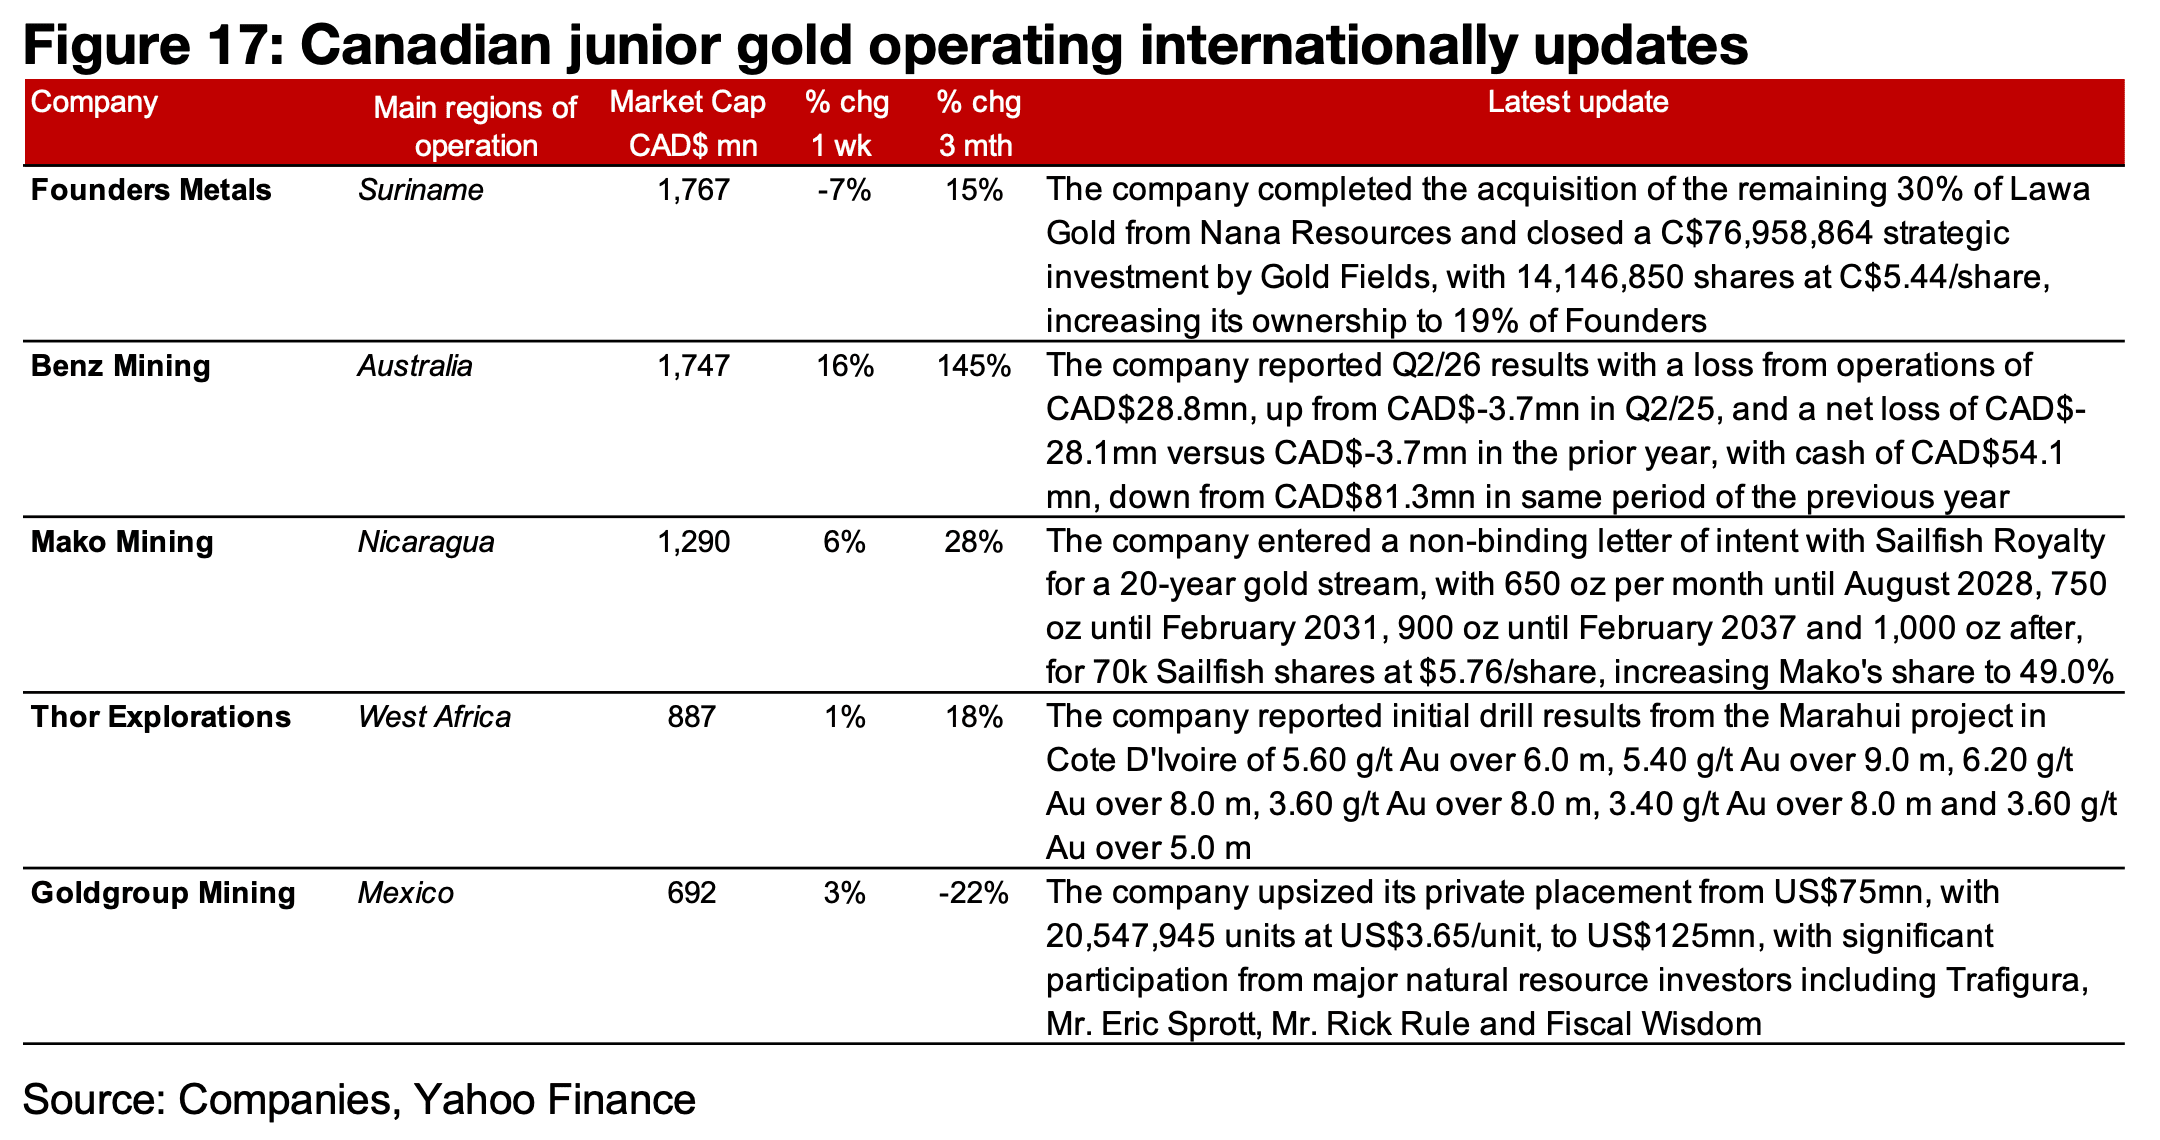
For the companies operating mainly internationally, Founders completed the
acquisition of the remaining 30% of Lawa from Nana Resources and closed a
C$76.9mn strategic investment from Gold Fields, Benz reported Q2/26 results, Mako
announced a 20-year gold royalty with Sailfish, Thor reported drill results from the
Marahui project and Goldgroup upsized its placement to US$125mn to US$75mn.
(Figure 17). Several of the large TSXV gold companies also reported being included
in the GDXJ ETF after the new rebalancing including Omai, Banyan, Goldsky, Gold
X2 and Heliostar.
Disclaimer: This report is for informational use only and should not be used an alternative to the financial and legal advice of a qualified professional in business planning and investment. We do not represent that forecasts in this report will lead to a specific outcome or result, and are not liable in the event of any business action taken in whole or in part as a result of the contents of this report.
Author
Ben McGregor authors the Weekly Roundup at CanadianMiningReport.com, providing sharp analysis of the metals and mining sector. With a talent for spotting trends, Ben distills complex market shifts into clear, engaging insights on TSXV junior miners. His weekly updates cover gold, copper, uranium, and more, blending data-driven perspectives with a knack for identifying opportunities. A vital resource for investors, Ben’s work navigates the dynamic junior mining landscape with precision.