
June 16, 2025
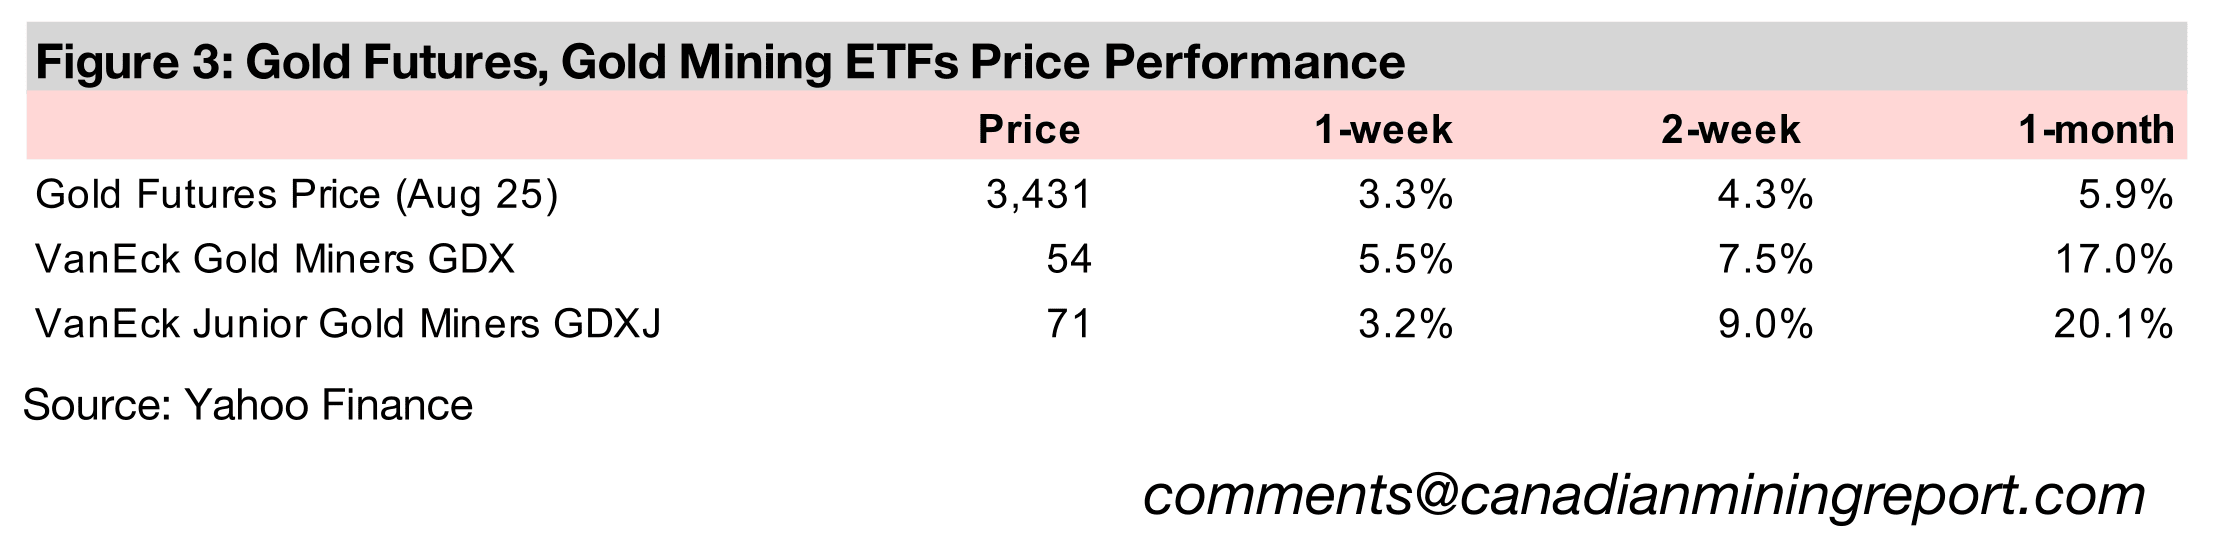
Gold rose 3.3% to US$3,431/oz on the rise in geopolitical risk with the extreme escalation of conflict in the Middle East, breaking moderately out of the US$4,200/oz- US$4,400/oz range that had persisted for the past two months.
Platinum rose 3.7%, and is up 23.2% over the past month, as the market is expected to have a major deficit this year on rising demand from the jewellery segment and declining supply from South Africa, the number one global producer of the metal.
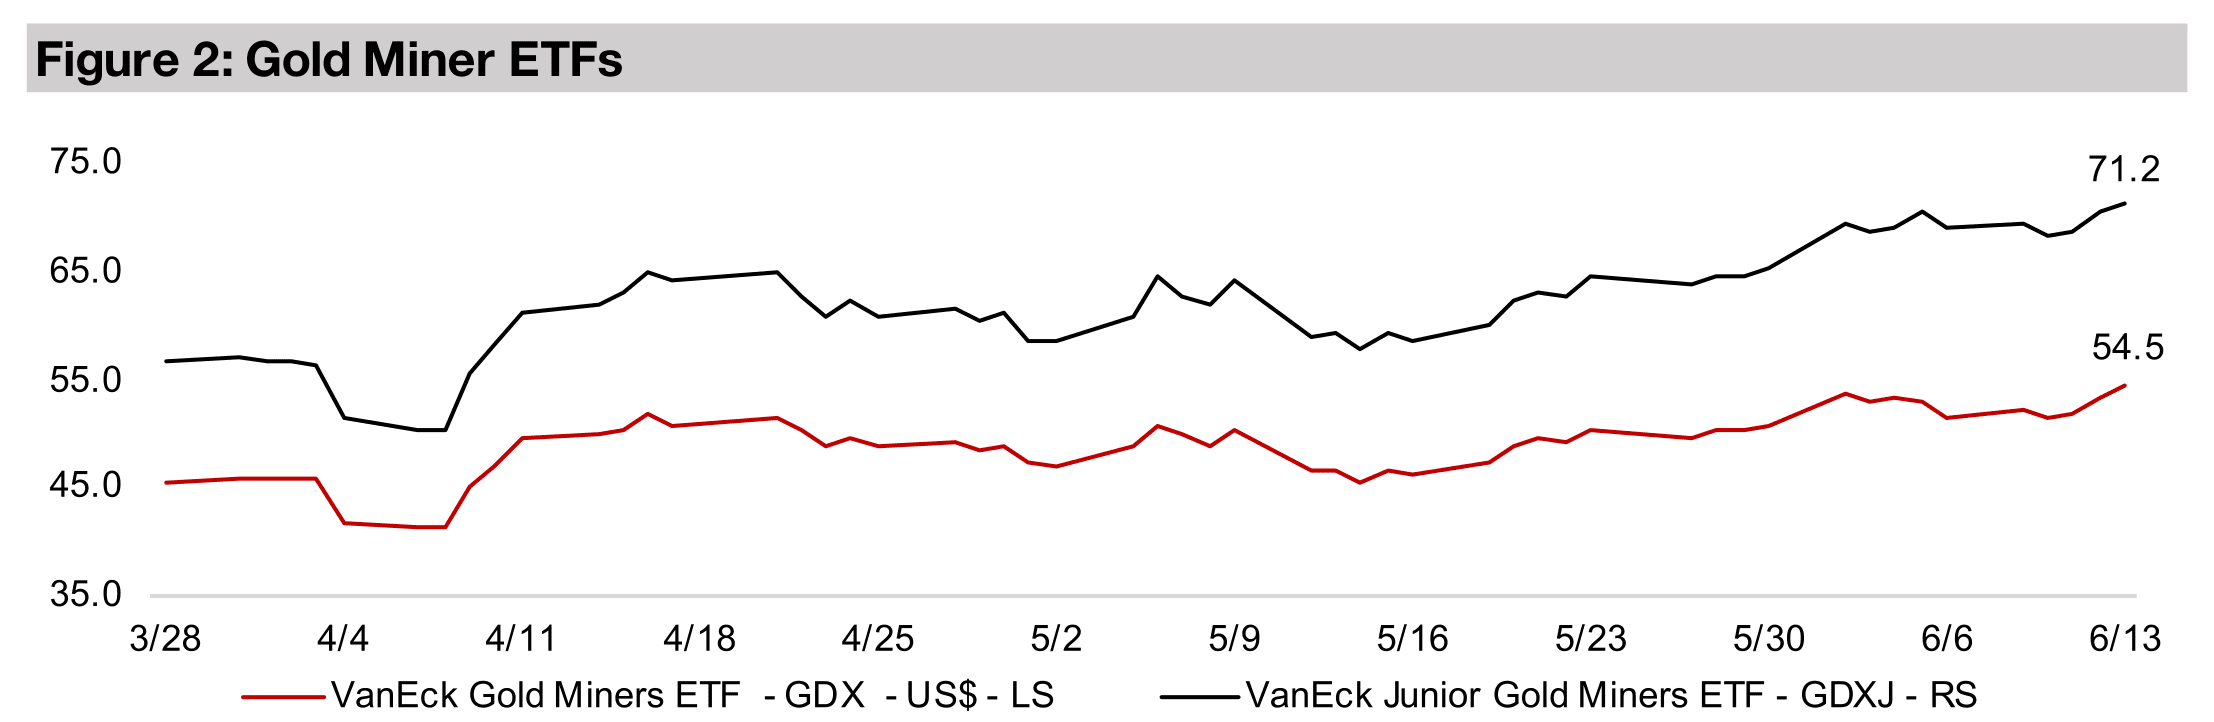
The gold stocks rose, with the majors taking the lead for the first time in two weeks, with the GDX up 5.5%, although the juniors were also strong, gaining 3.2%, even as equities overall declined, with the S&P 500 down -1.1% and Nasdaq off -1.3%.


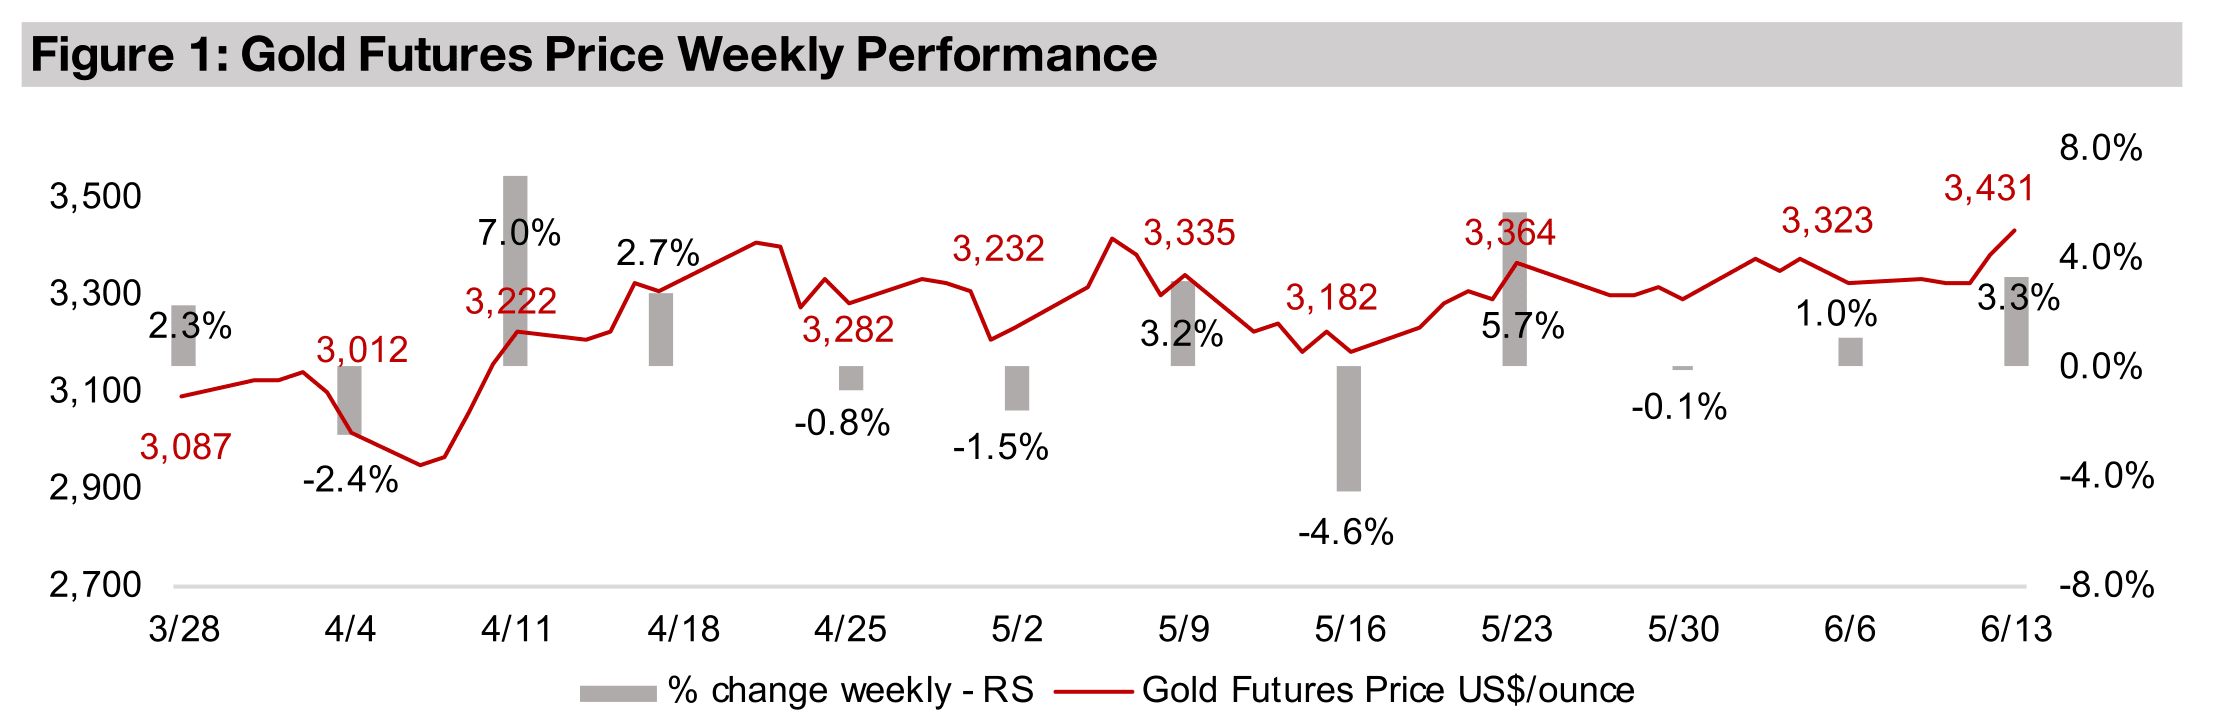
The gold price rose 3.3% to US$4,431/oz, its highest ever, and moving just above
the US$4,200/oz-US$4,400/oz range of the past three months. The biggest driver
was the rise in geopolitical risk with a severe escalation of the conflict between Israel
and Iran. This also drove an 11.7% jump in the oil price, and has boosted inflation
risks, given it is a core cost for many sectors. This could affect a trend of declining
US inflation, with the headline May 2025 CPI reported this week at 2.4%, down from
3.0% in January 2025, although it rose mom from 2.3%. Core inflation has been flat
at 2.8% for three months, but is down from 3.3% in January 2025.
Even with the strong gains, gold was outpaced by platinum, up 3.7% and continuing
a strong recent run, but was ahead of the 0.6% rise in silver and -1.7% drop in
palladium. The ‘other’ precious metals have all pulled ahead of gold’s 6.3% rise over
the past month, with platinum surging 23.2%, silver gaining 9.8% and palladium up
7.8%. Gold’s ratios versus these metals had risen far above historical averages this
year, and a rebalancing was becoming increasingly likely, with this so far being driven
by the ‘other’ precious metals rising rather than a pullback in gold.
Gold stocks rose, with the majors leading for the first time in two weeks, with the GDX
up 5.5%, although the juniors were also strong, with the GDXJ gaining 3.2%. This
was even as equities overall declined, with the S&P 500 falling -1.1%, the Nasdaq
down -1.3% and Russell 2000 losing -1.9%. The combination of surging geopolitical
tensions, rising oil prices and high valuations may be starting to weigh on the risk on
rally. It has persisted for past two months and seen the S&P 500 up 20.0% from the
April 8, 2025 lows, the Nasdaq rise 27.1% and the Russell 2000 add 19.3%.
Platinum’s continued big move has seen it move clearly ahead of the palladium price
for the first time in seven years. Through most of 2024 and into early 2025, the prices
of the metals were at similar levels, with the platinum to palladium ratio close to 1.0x,
but this has risen to 1.19x (Figure 4). However, this is still close to parity compared to
the historical swings in the ratio. In early 2010, the platinum price was far higher than
palladium, with the ratio at 3.45x, although the prices gradually converged, mainly on
a decline in platinum, and they reached parity in 2017.
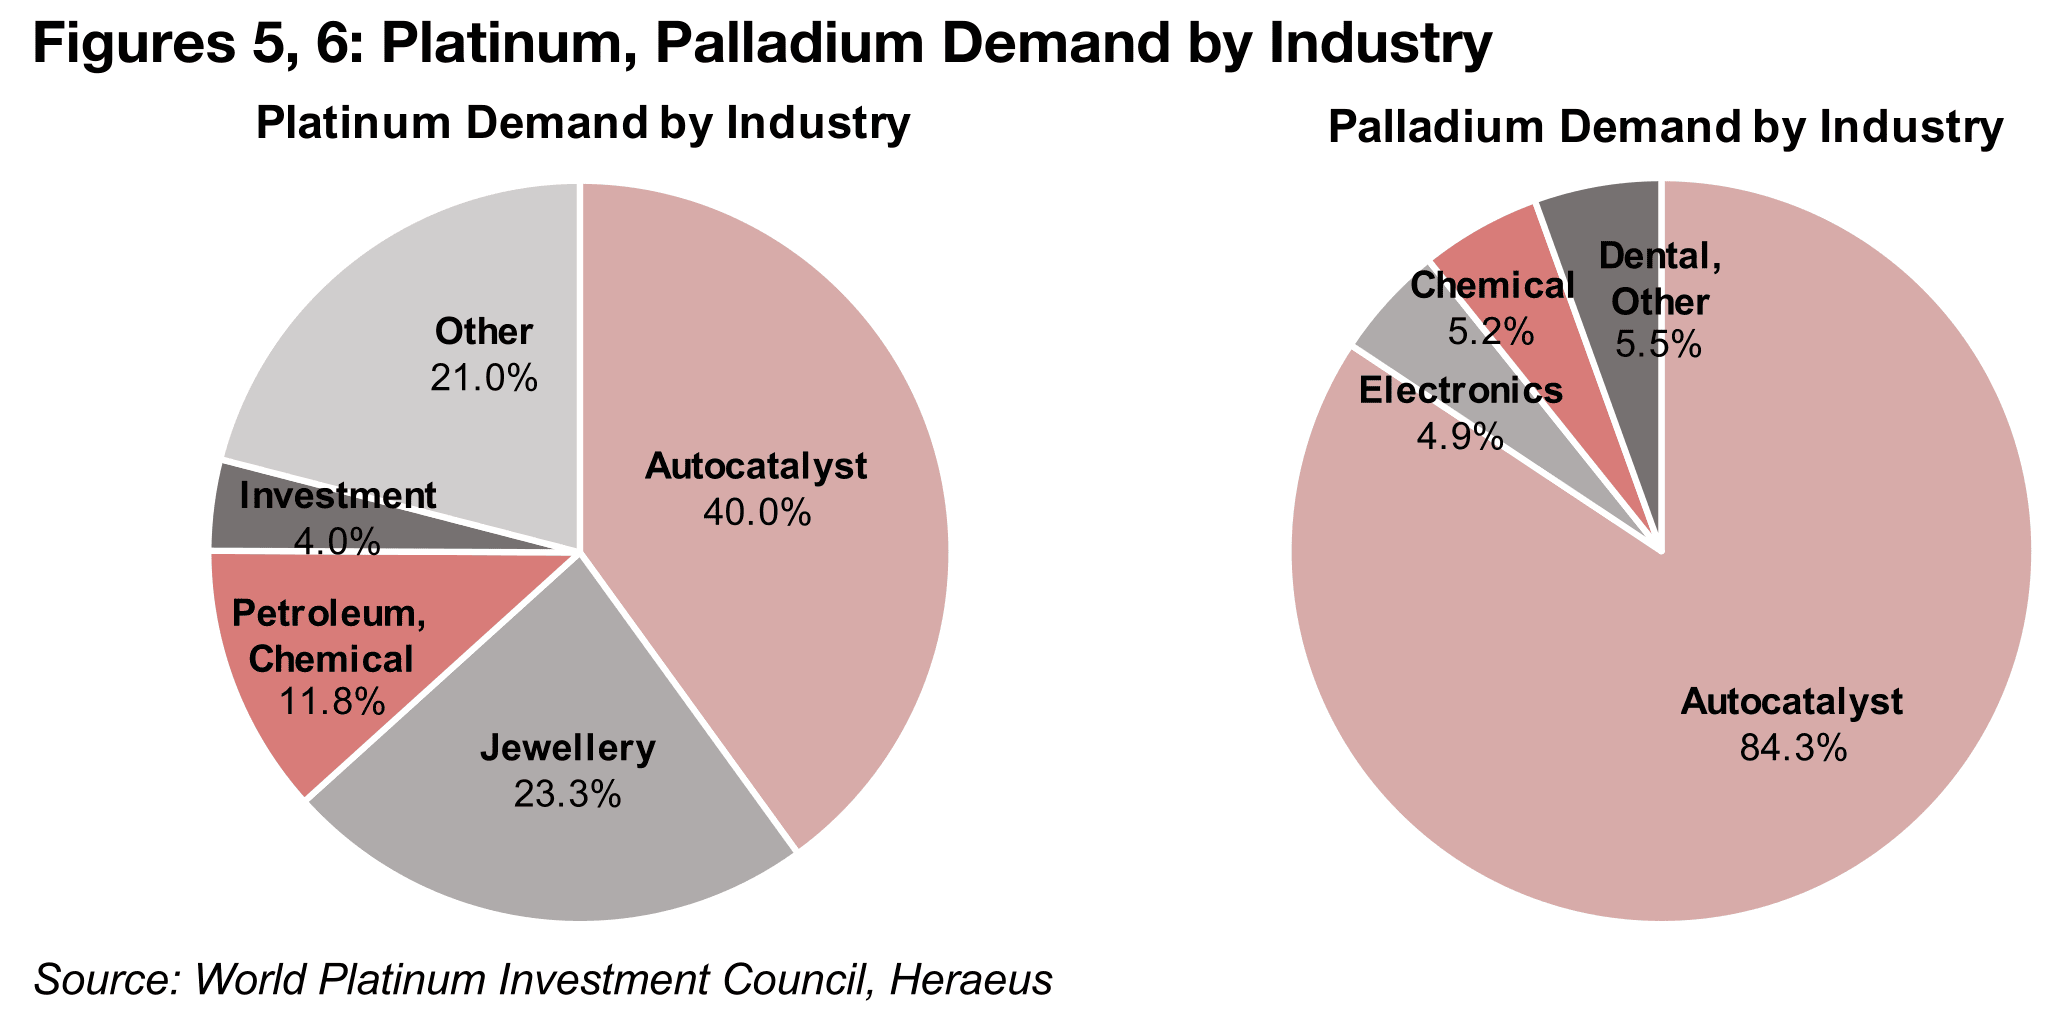
This was driven by the heavy use of both the metals in autocatalysts, which
comprises 40% of platinum demand and 84% of palladium demand (Figures 5, 6).
From 2010 to 2017, the high platinum price drove the industry to substitute towards
palladium, and technical changes reduced the palladium to platinum substitution ratio
from 2.0x to 1.0x. The shift in the auto industry towards palladium continued from
2017, seeing its price move far above platinum, and coupled with supply constraints
saw the ratio between the metals hitting a low of 0.30x in March 2020.
The high palladium price, with a peak reached in April 2021, drove the auto industry
to substitute back towards platinum. However, platinum remained relatively flat from
2021 through to 2024 and the convergence between the metals was mainly from a
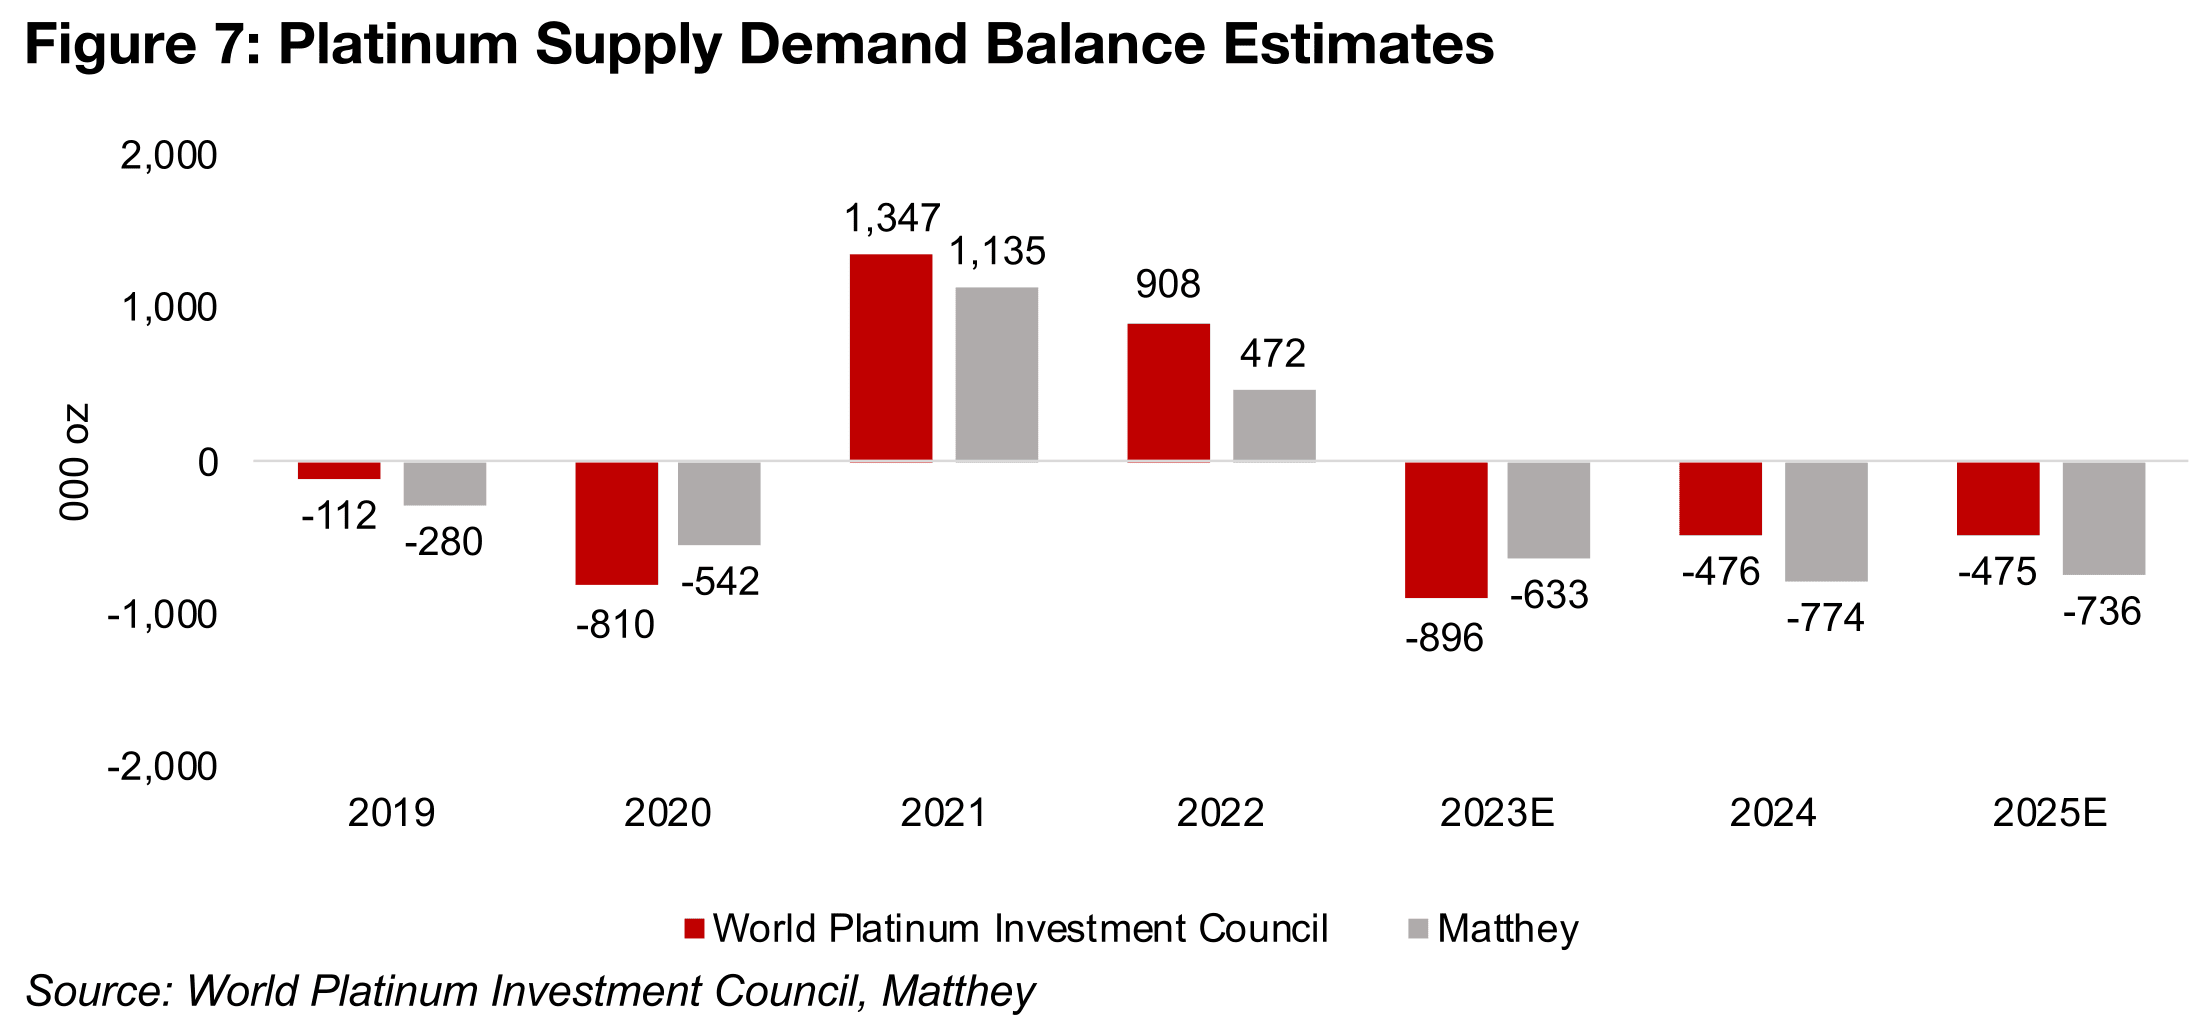
plunge in palladium. The platinum market is forecast to have its third consecutive
year of deficit in 2025, with the level varying across two key sources, the World
Platinum Investment Council (WPIC) and Matthey (Figure 7). WPIC forecasts a -475k
oz deficit and Matthey -736k oz, at a substantial 8.8% and 13.3% of their respective
supply estimates. The platinum market’s large surpluses in 2021 and 2022 partly
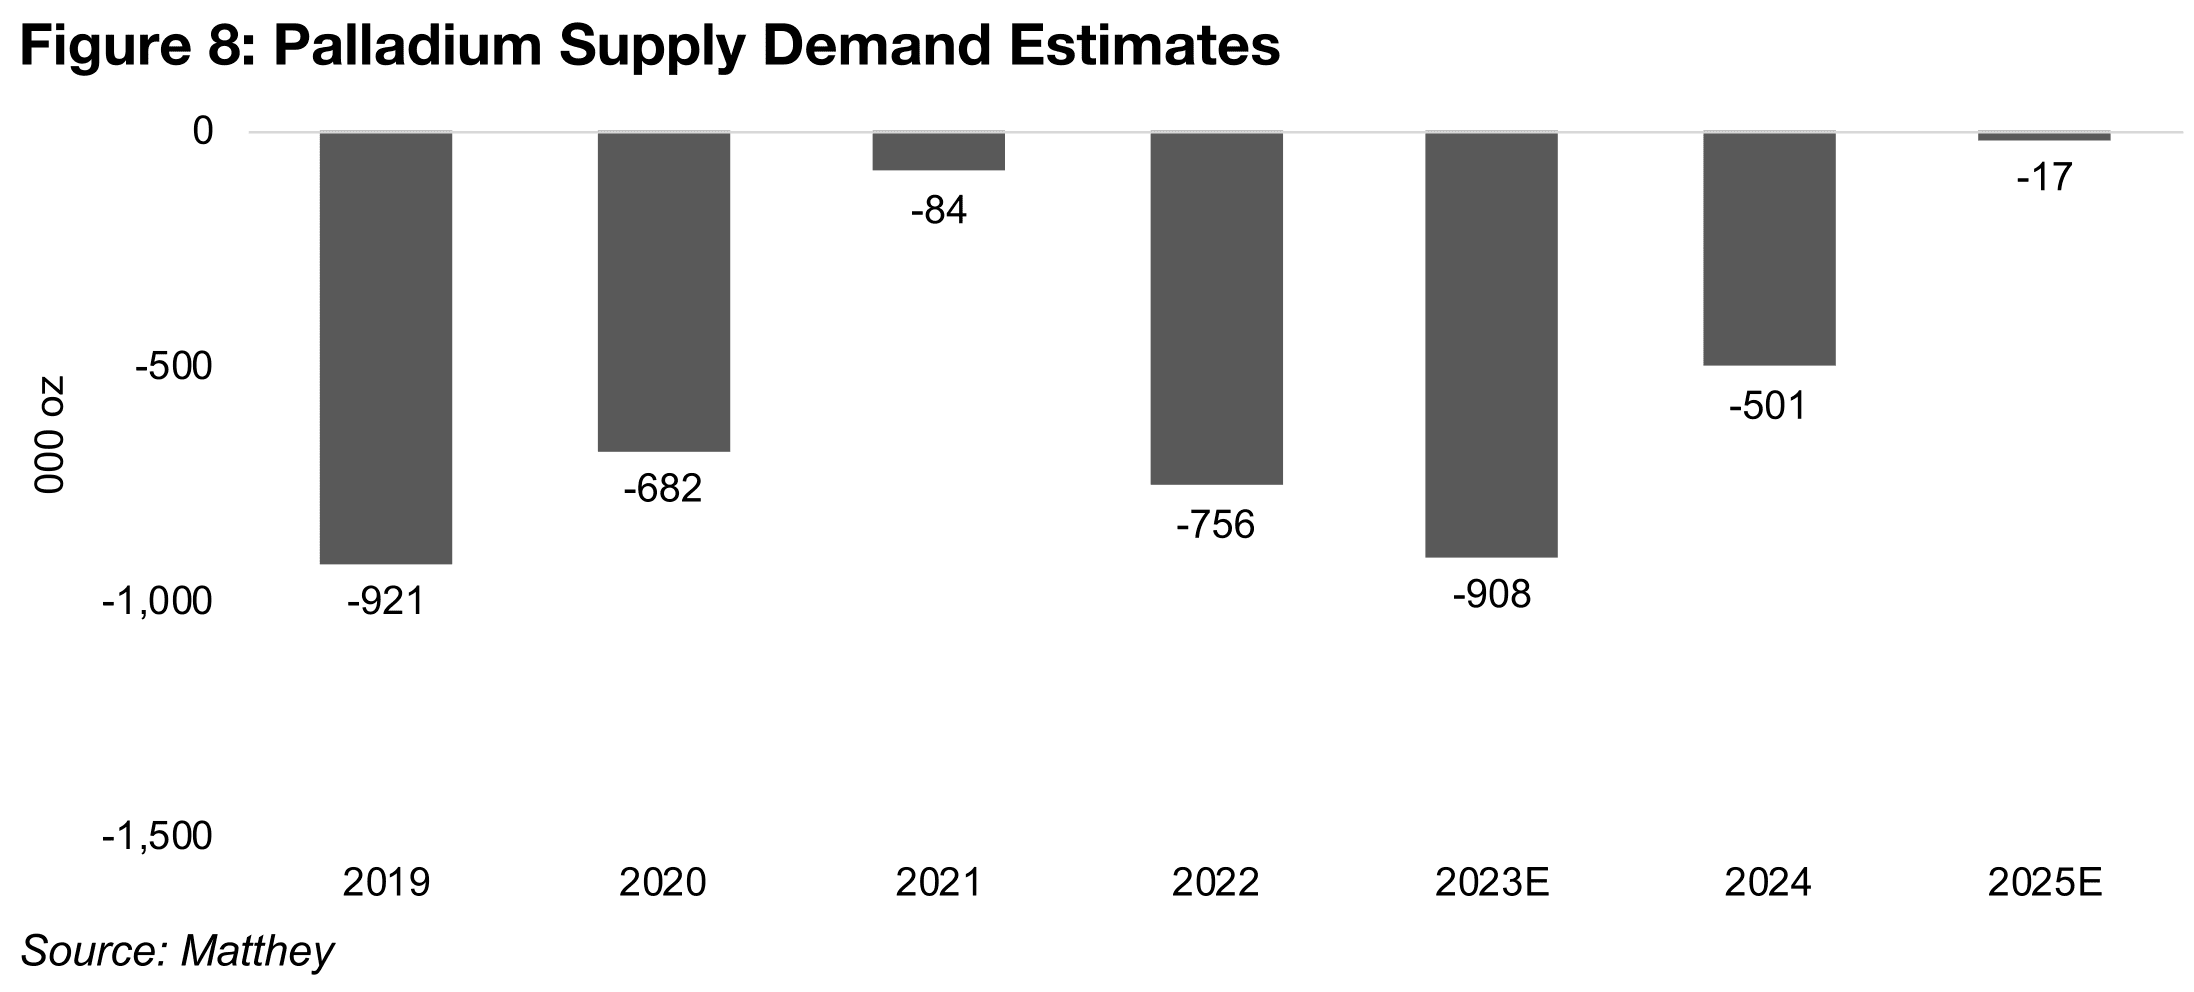
explain why its price significantly lagged palladium in those periods. In contrast the
palladium market was near balanced in 2021, with major deficits in 2022 and 2023
(Figure 8). However, this shortfall contracted considerably in 2024 and the market is
forecast to be balanced for 2025, with the deficit of just -17k oz at 0.3% of supply.
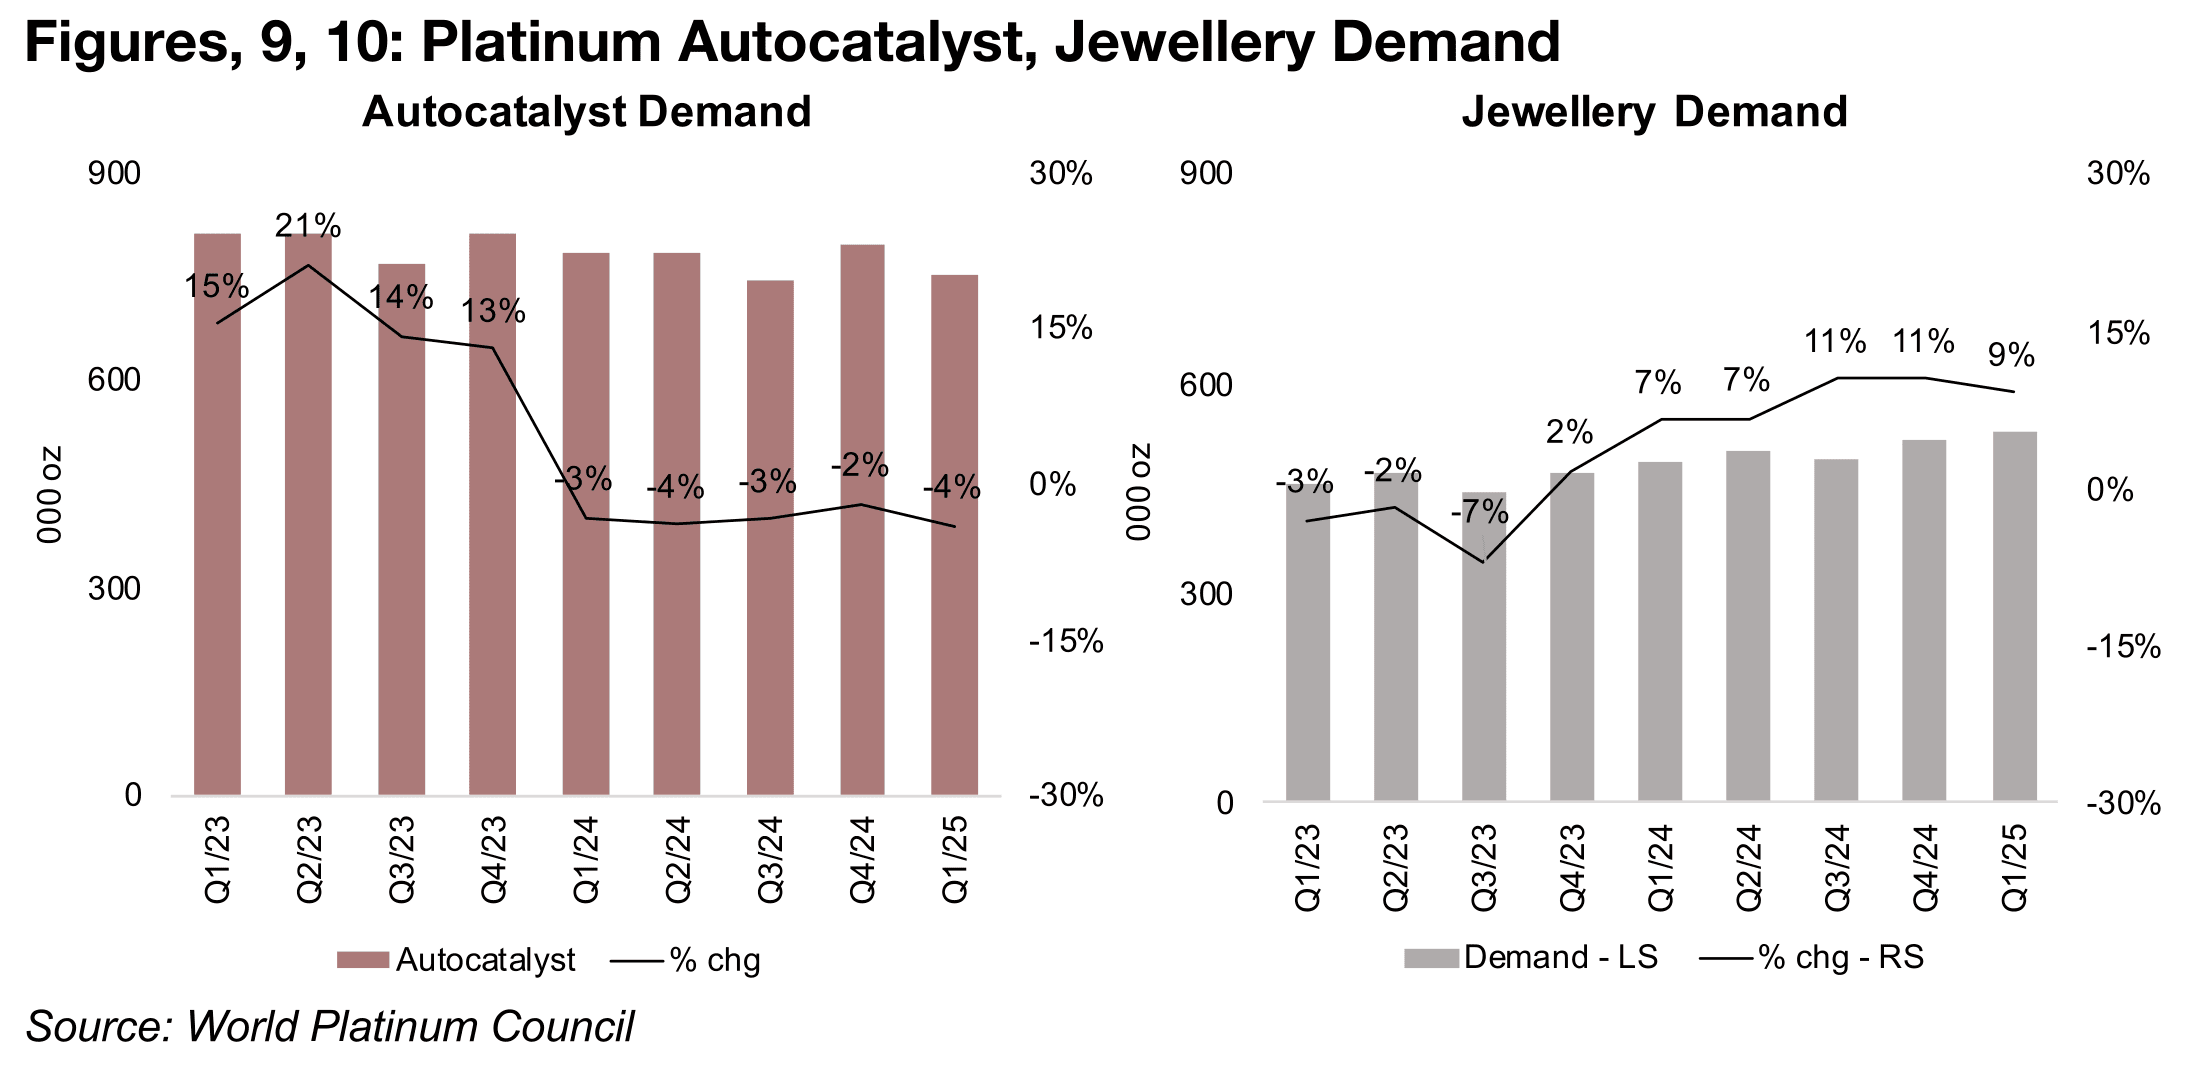
Platinum demand is forecast to decline in 2025 by both the WPIC, estimating a -5.6%
drop versus a -6.2% fall in supply, and Matthey, with a -3.4% contraction compared
to a -3.2% drop in supply. One of the drivers is likely to be lower autocatalyst demand,
as the auto industry is expected to slowdown this year. Autocatalyst demand has
already dropped over the past four quarters by low single digits, after double digit
growth in the first three quarters of 2024 (Figure 9). A major issue for the segment has
been a shift in the auto industry towards electric vehicles (EVs), which do not require
autocatalysts. This could create a long-term secular decline for both platinum and
palladium if EVs become more rapidly adopted and sales of gasoline powered autos
which require autocatalysts actually start to go into decline. Hybrid cars do require
autocatalysts and could support demand, but pure EVs require only very minimal
amounts of these metals.
Jewellery demand for platinum has been rising significantly, and was up by 7% yoy
for H1/24, 11% for H2/24, and 9% in Q1/25, after declining by single digits for the
first three quarters of 2024 (Figure 10). This has been driven especially by demand
from China, with the market looking for a substitute to increasingly expensive gold
jewellery. China is the largest gold jewellery market in world, followed by India, with
it used mainly as a store of value, so it could be considered more monetary demand
than consumption. With the gold price continuing to rise, its seems that this
substitution could continue this year, although with platinum’s recent gains, both
types of jewellery may start to be considered expensive in China and other markets.
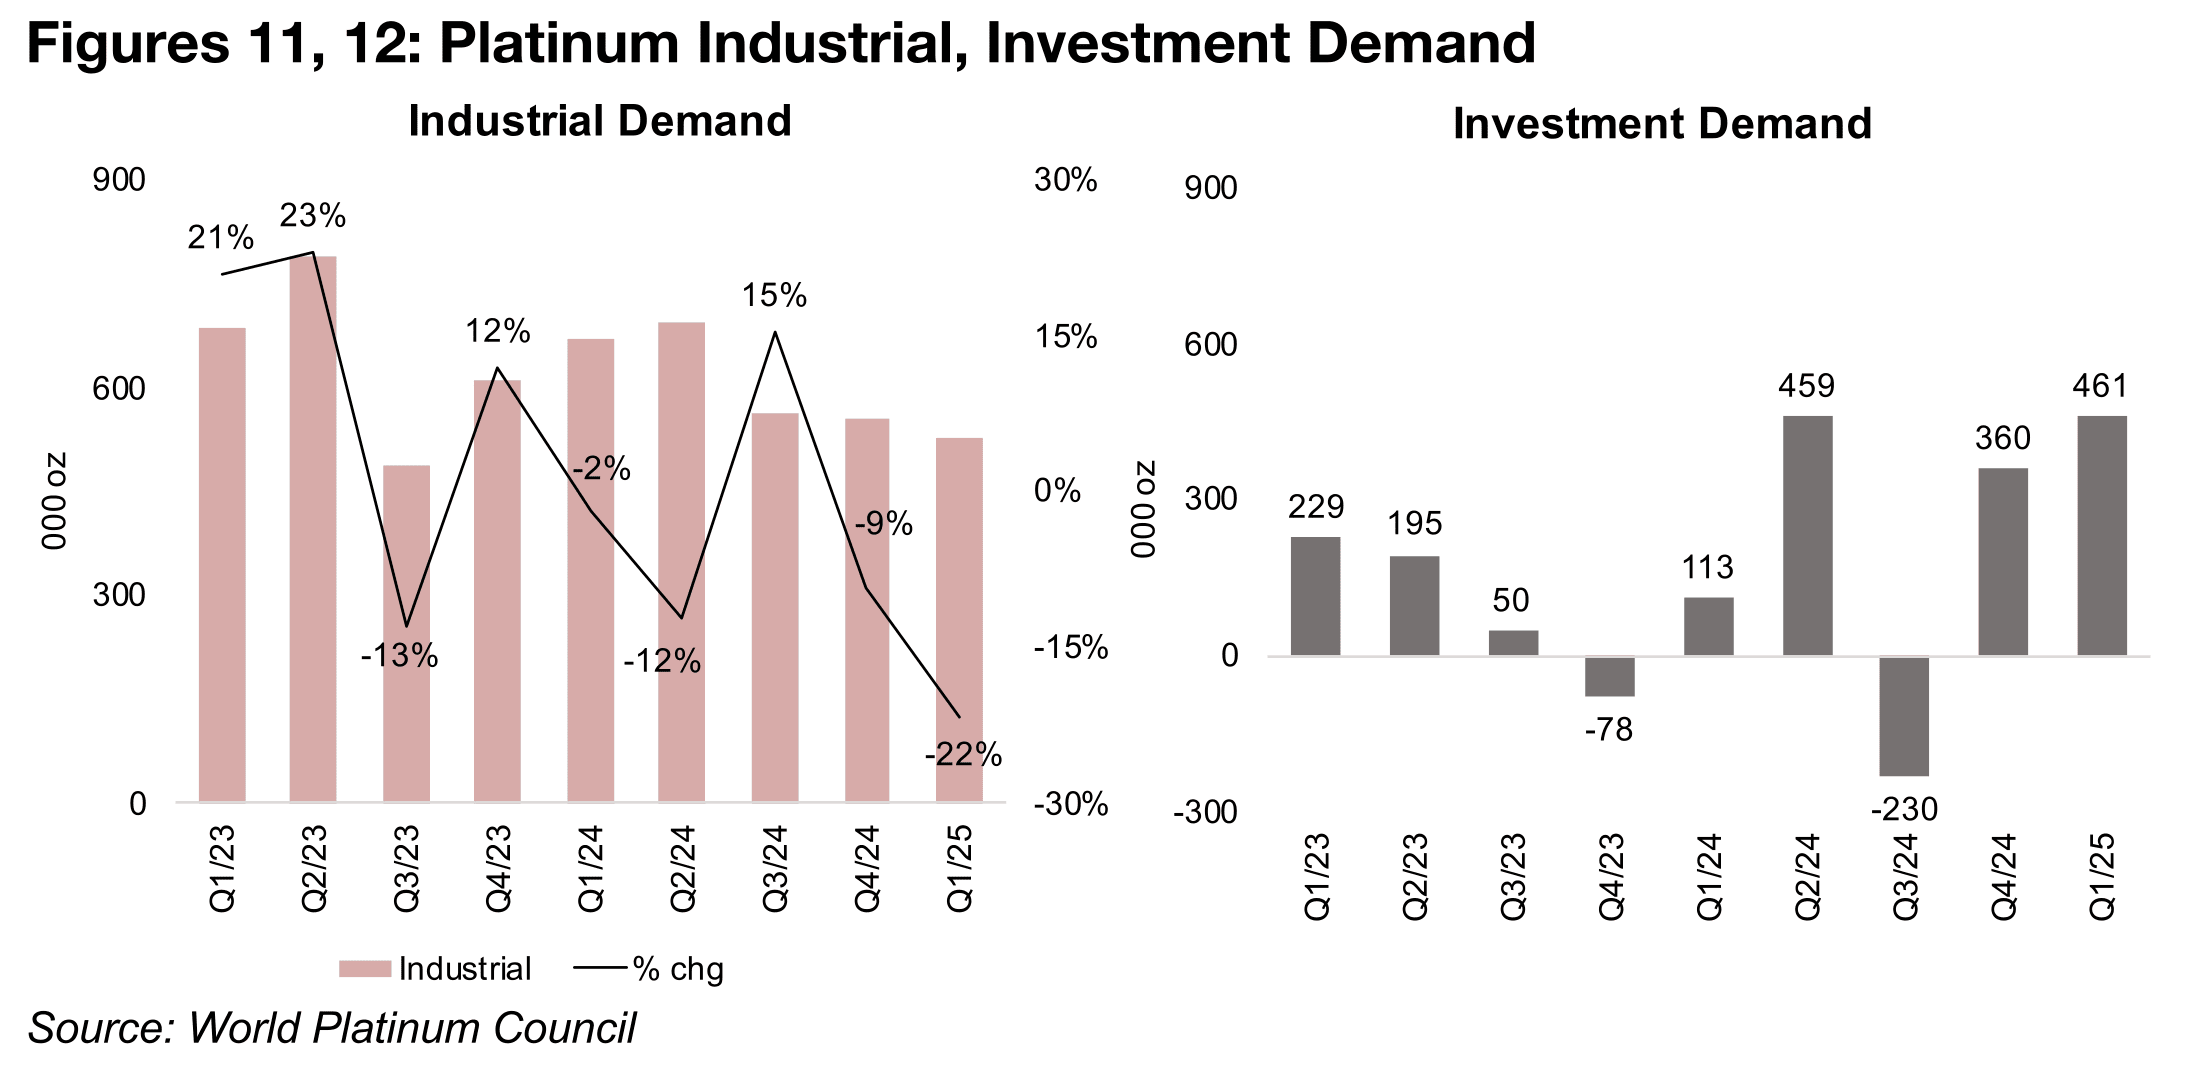
Industrial demand, which includes petroleum, chemicals and other sectors, has been
weak for the past two quarters, declining -9% in Q4/24 and -22% in Q1/25 (Figure
11). The slowdown is expected to continue, with the segment forecast to decline in
2025 by the WPIC. This segment tends to be more volatile than the autocatalyst or
jewellery segments, although the biggest swings are from the investment demand
segment.
Investment demand functions differently from the other sectors, comprising four
categories, the change in bars and coins, China bar sales above 500 g, the change
in ETF holdings and change in stocks held by exchanges. With the exception of China
bar sales, all these can actually turn negative. This explains the large swings in this
segment and the negative demand in Q4/23 and Q3/24, versus the other segments
where demand would not suddenly slump toward zero, and would not be negative
(Figure 12). The WPIC expects the segment to decline in 2025 especially from
negative ETF flows.
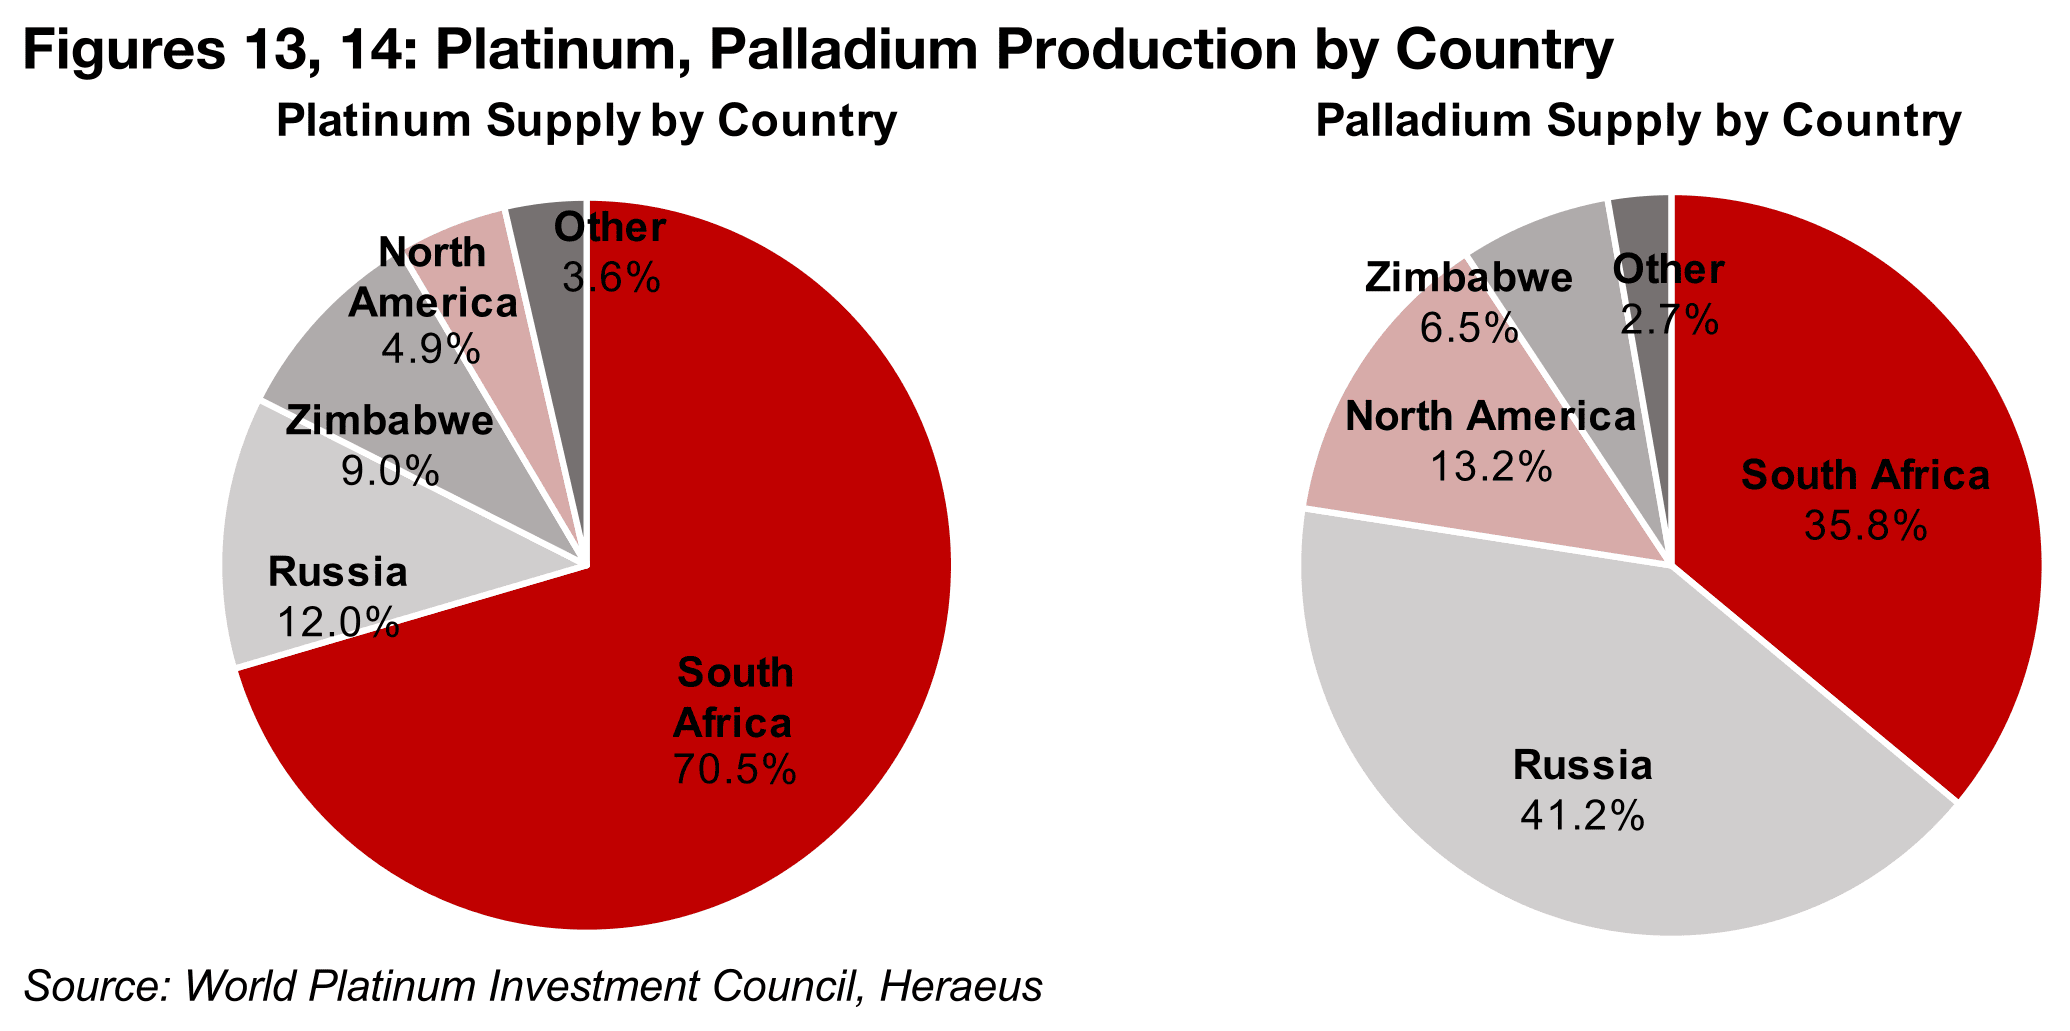
There are also issues on the supply side for platinum, especially from South Africa, which accounts for the majority of supply, at 70.5% (Figure 13). For palladium, production is less concentrated in South Africa, at 35.8% of the total, with Russia the largest supplier at 41.2% of the total (Figure 14). The long stagnation in platinum prices has driven many producers in South Africa to reduce the scale of their operations and hold back expansion plans on profitability concerns. The potential decline in demand from a shift to EVs and away from gas powered vehicles has been another factor making platinum and palladium producers cautious on major expansions, as the sector is a large proportion of demand for both metals.
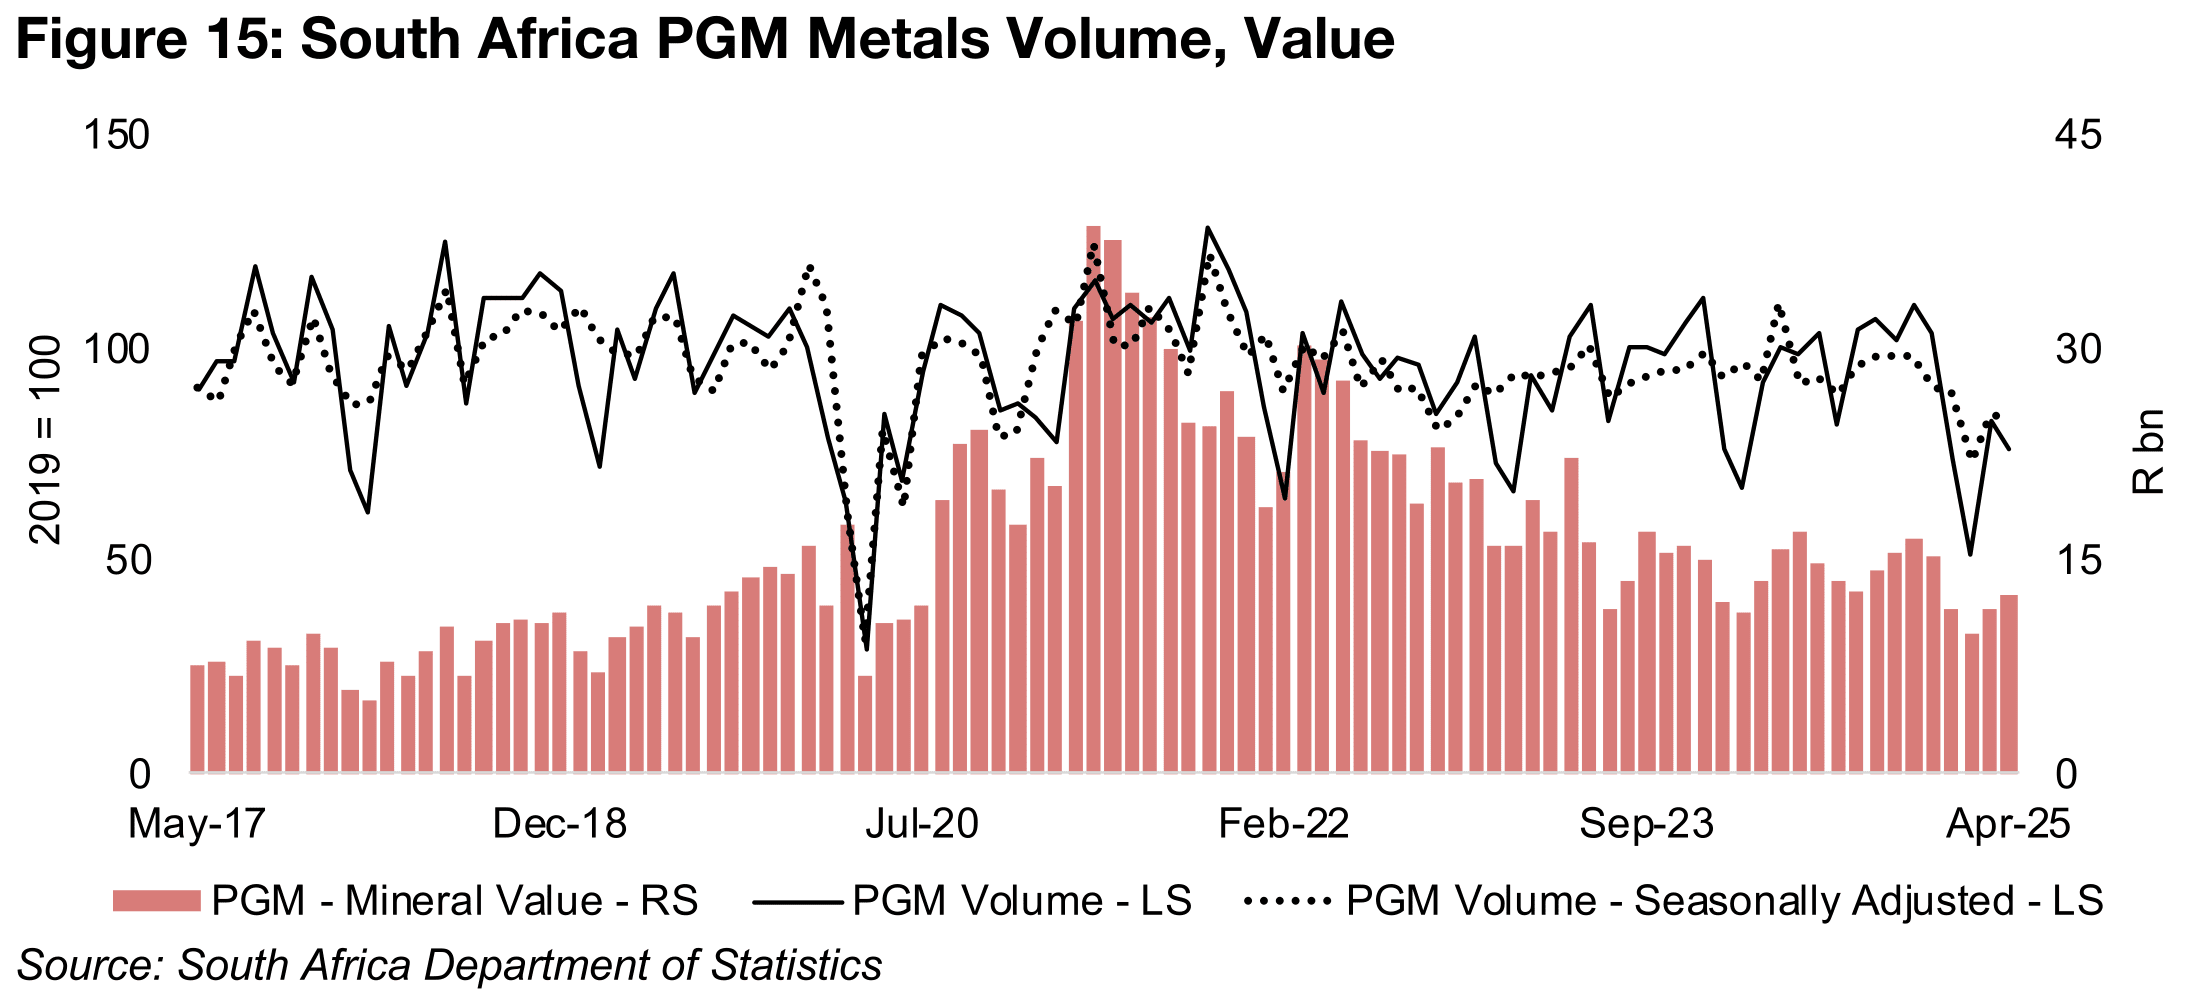
The output volume of South African platinum group metals (PGM), of which the two largest metals are platinum and palladium, has declined this year (Figure 15). The production index hit 51.1 in February 2025, its lowest level since 31.1 in April 2020. The production index has remained relatively low since, and was at 75.9 as of the most recently reported April 2025 figures. The value of South African PGM has declined steadily from a peak in April 2021, mainly on the drop in the palladium price, with the platinum price flat over the period, except for the rise of the past month.
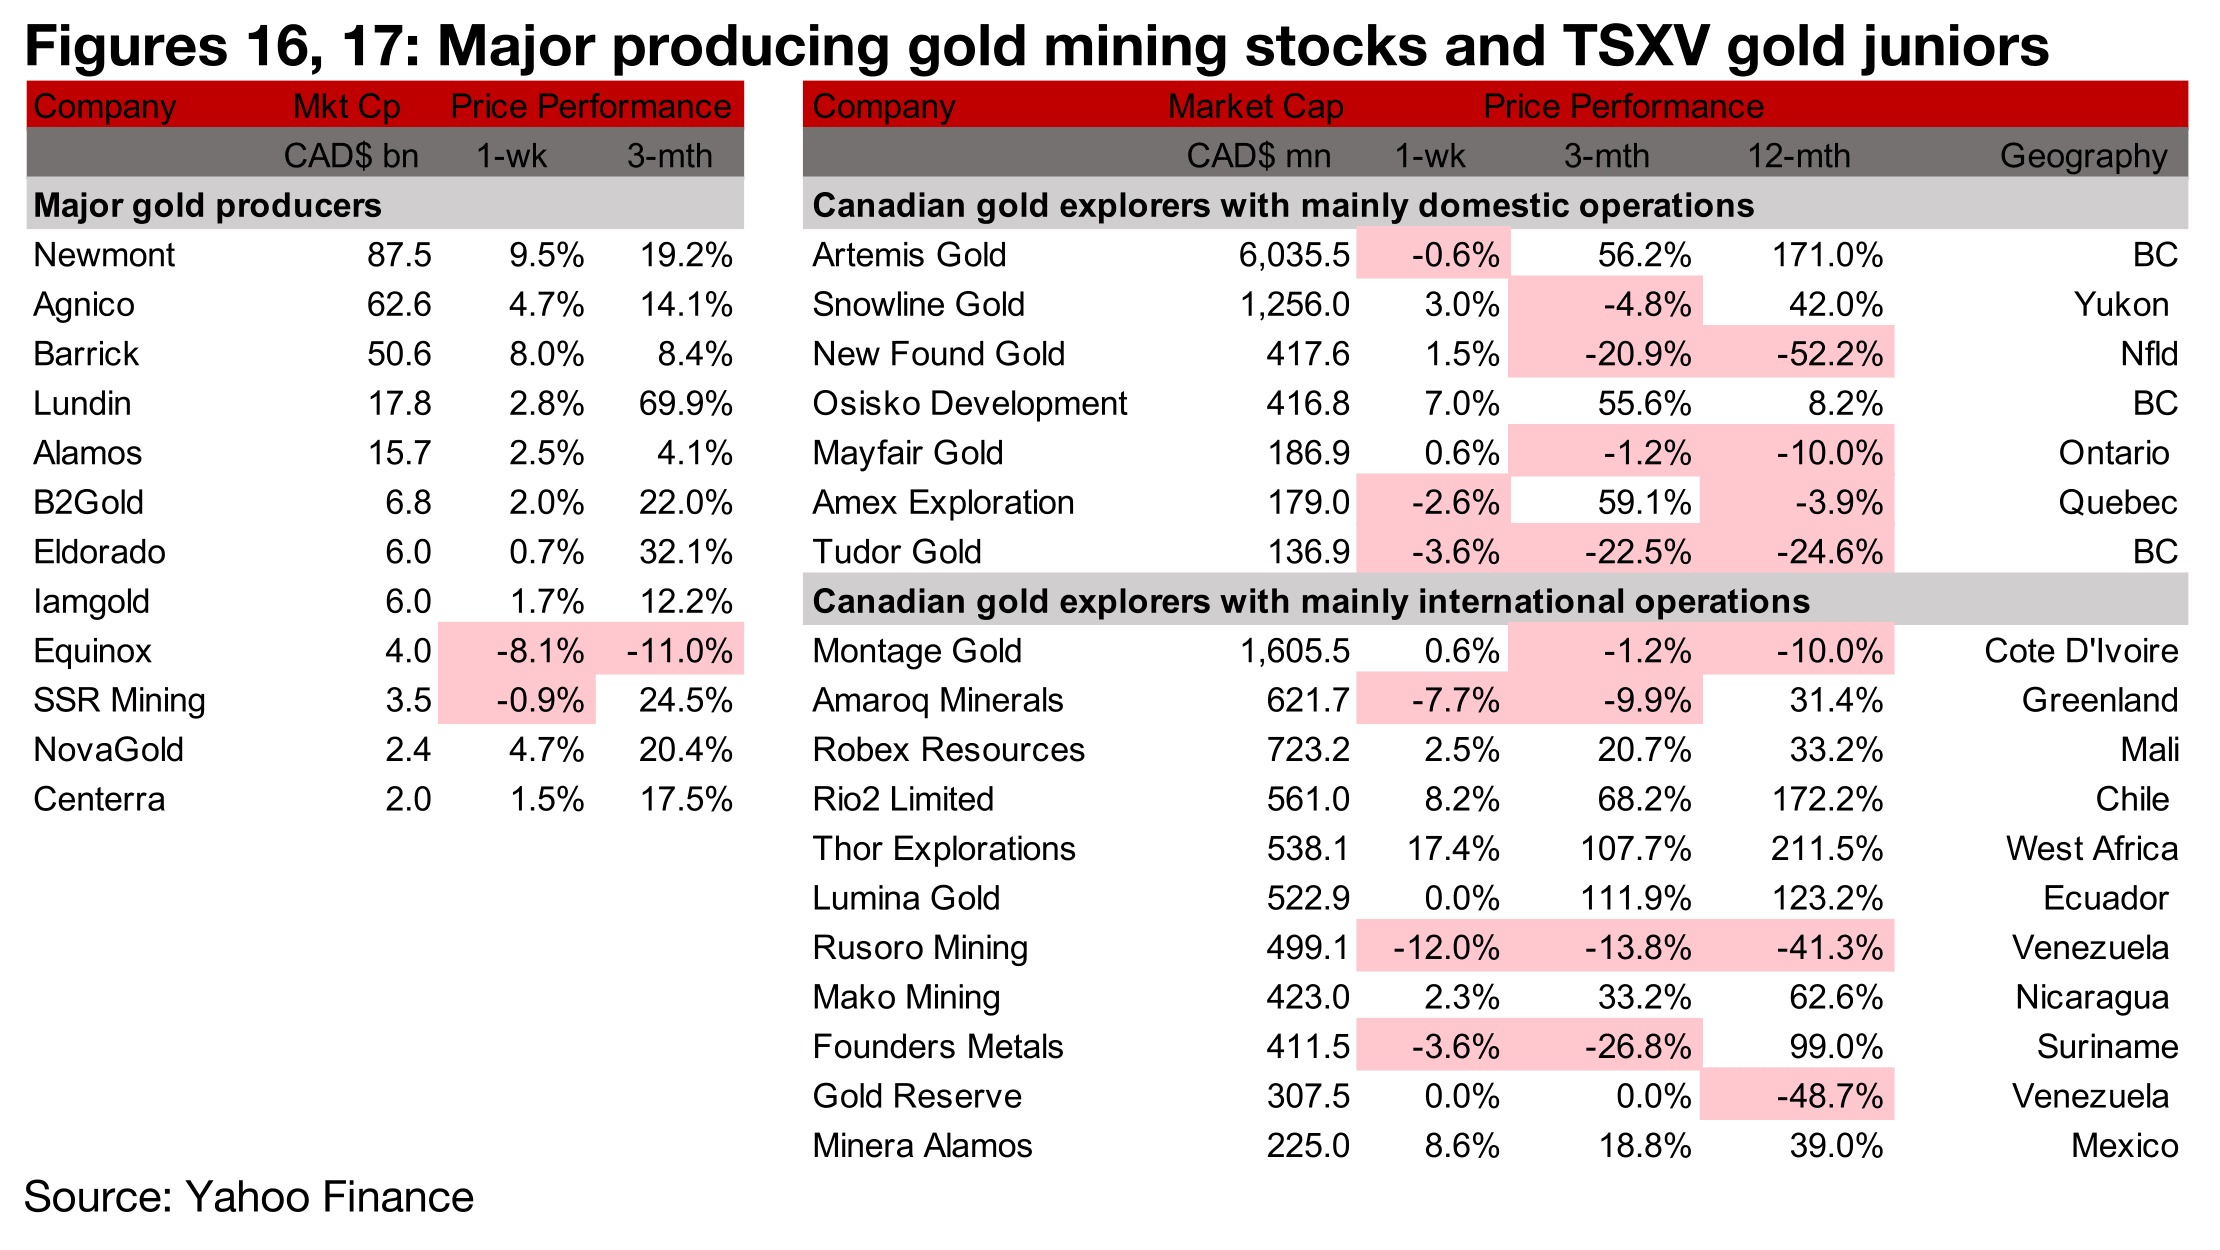
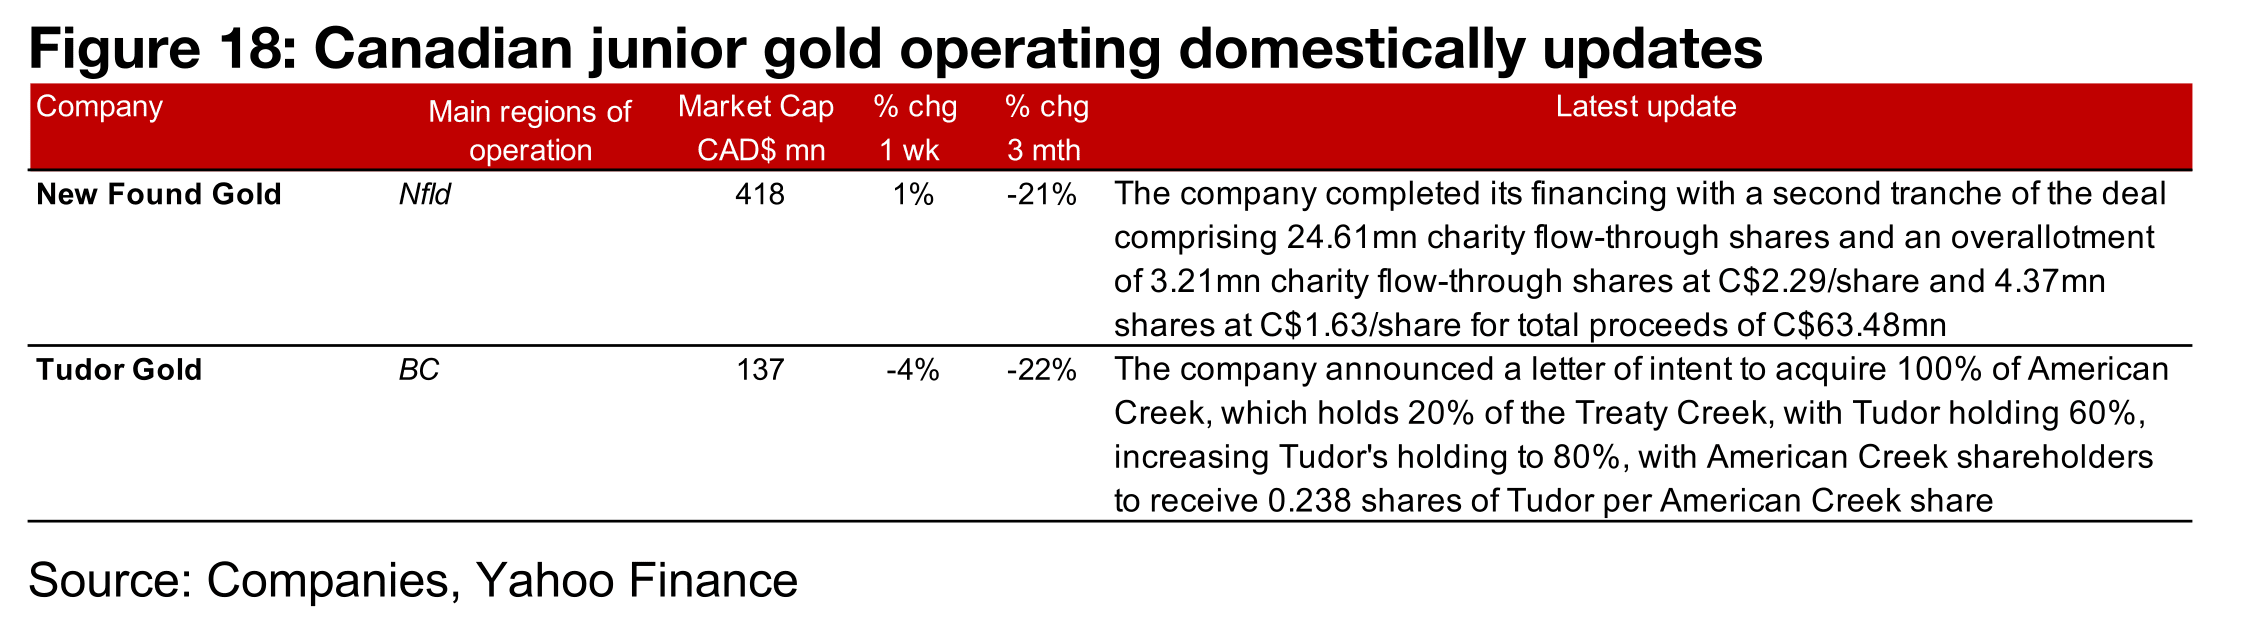
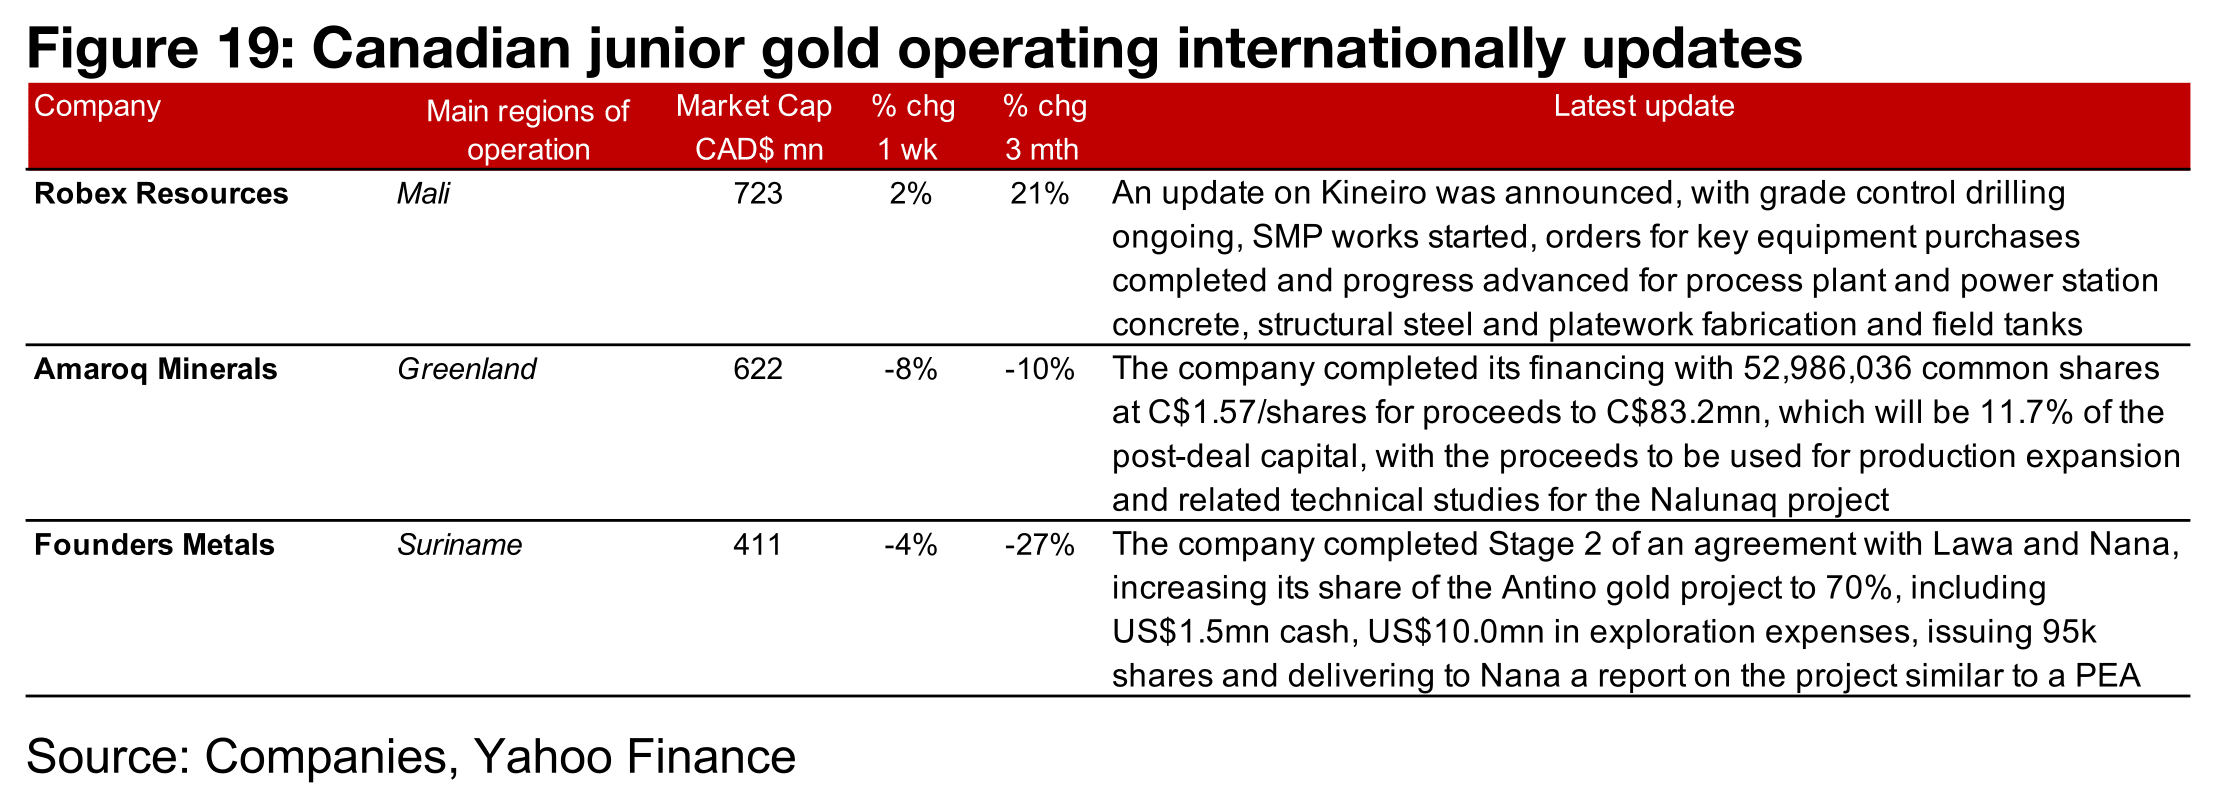
Most of the major producers and TSXV gold gained on the rise in the gold price. (Figures 16, 17). For the TSXV gold companies operating mainly domestically, New Found Gold completed its financing, closing the second tranche, and Tudor Gold announced a letter of intent to purchase American Creek, which would increase its holding of Treaty Creek to 80% (Figure 18). For the TSXV gold companies operating mainly internationally, Robex Resources provided an update the progress of construction at Kineiro, Amaroq Minerals completed its financing and Founders Metals completed Stage 2 of an agreement with Lawa and Nana, increasing its share in the Antino gold project to 70%. (Figure 19).
Disclaimer: This report is for informational use only and should not be used an alternative to the financial and legal advice of a qualified professional in business planning and investment. We do not represent that forecasts in this report will lead to a specific outcome or result, and are not liable in the event of any business action taken in whole or in part as a result of the contents of this report.
Author
Ben McGregor authors the Weekly Roundup at CanadianMiningReport.com, providing sharp analysis of the metals and mining sector. With a talent for spotting trends, Ben distills complex market shifts into clear, engaging insights on TSXV junior miners. His weekly updates cover gold, copper, uranium, and more, blending data-driven perspectives with a knack for identifying opportunities. A vital resource for investors, Ben’s work navigates the dynamic junior mining landscape with precision.