
December 22, 2025
Gold rose 1.3% to US$4,361/oz as US inflation came in lower, and payrolls higher, than expected in November 2025, with both releases having been delayed by the government shutdown and seeming to back up the Fed rate cut last week.
The gold stocks rose with the GDX up 2.5% and GDXJ gaining 2.9%, outperforming the slide in equity markets as markets shifted into risk-off, with the S&P 500 declining -0.4%, the Nasdaq edging down -0.1% and Russell 2000 losing -1.3%.


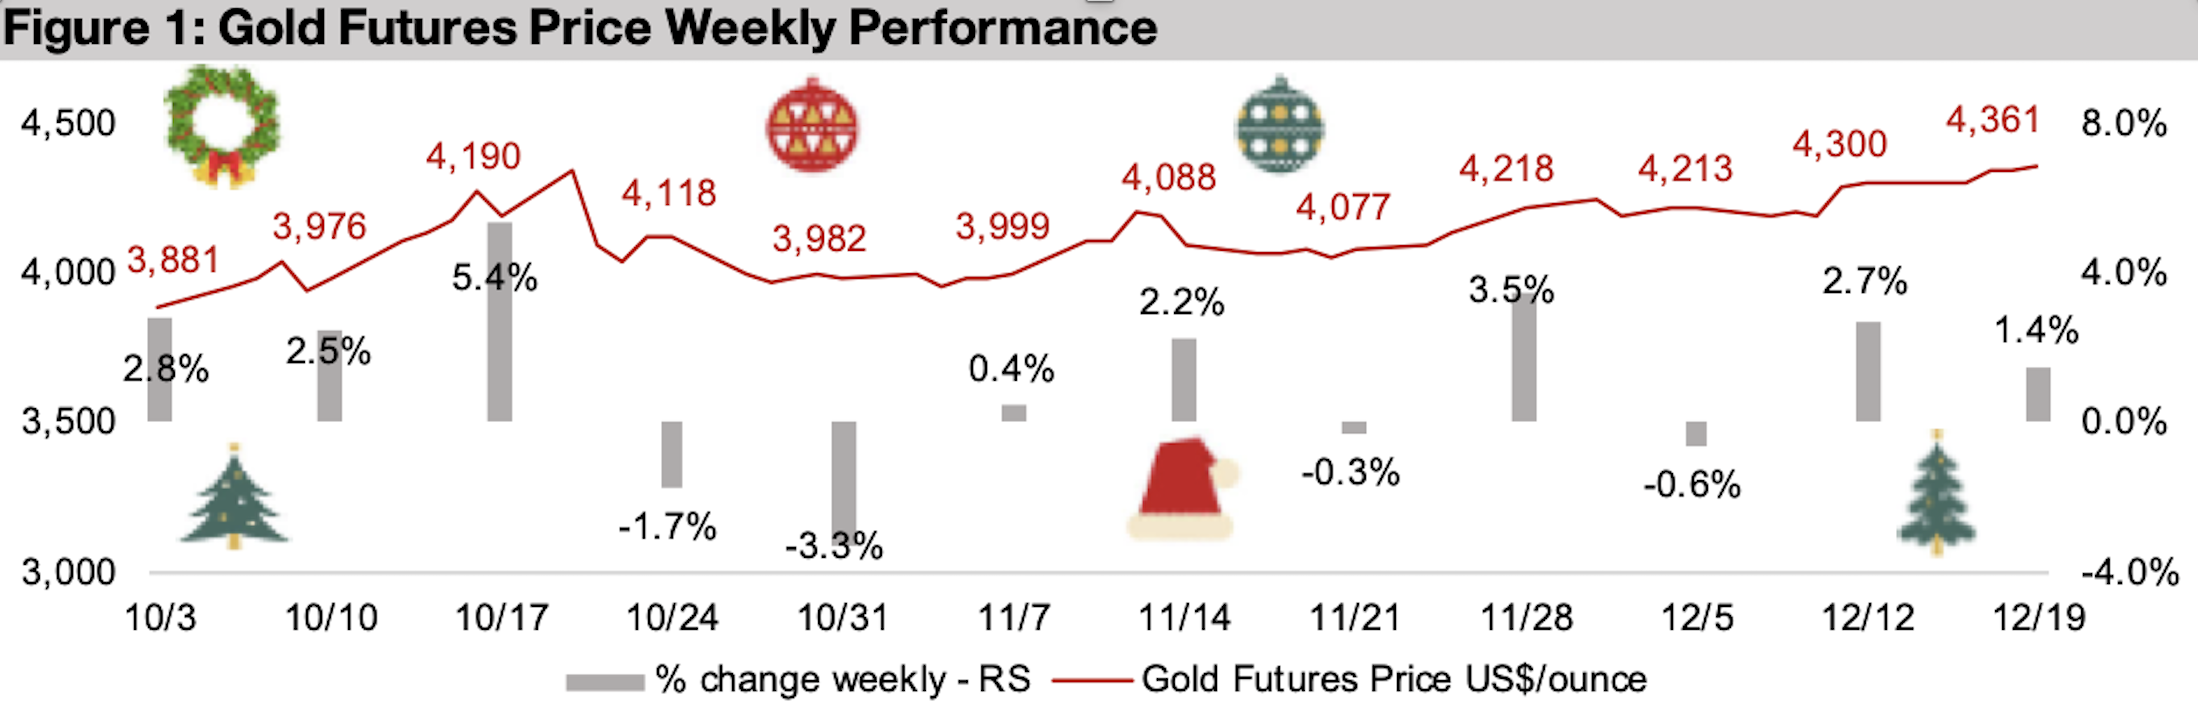
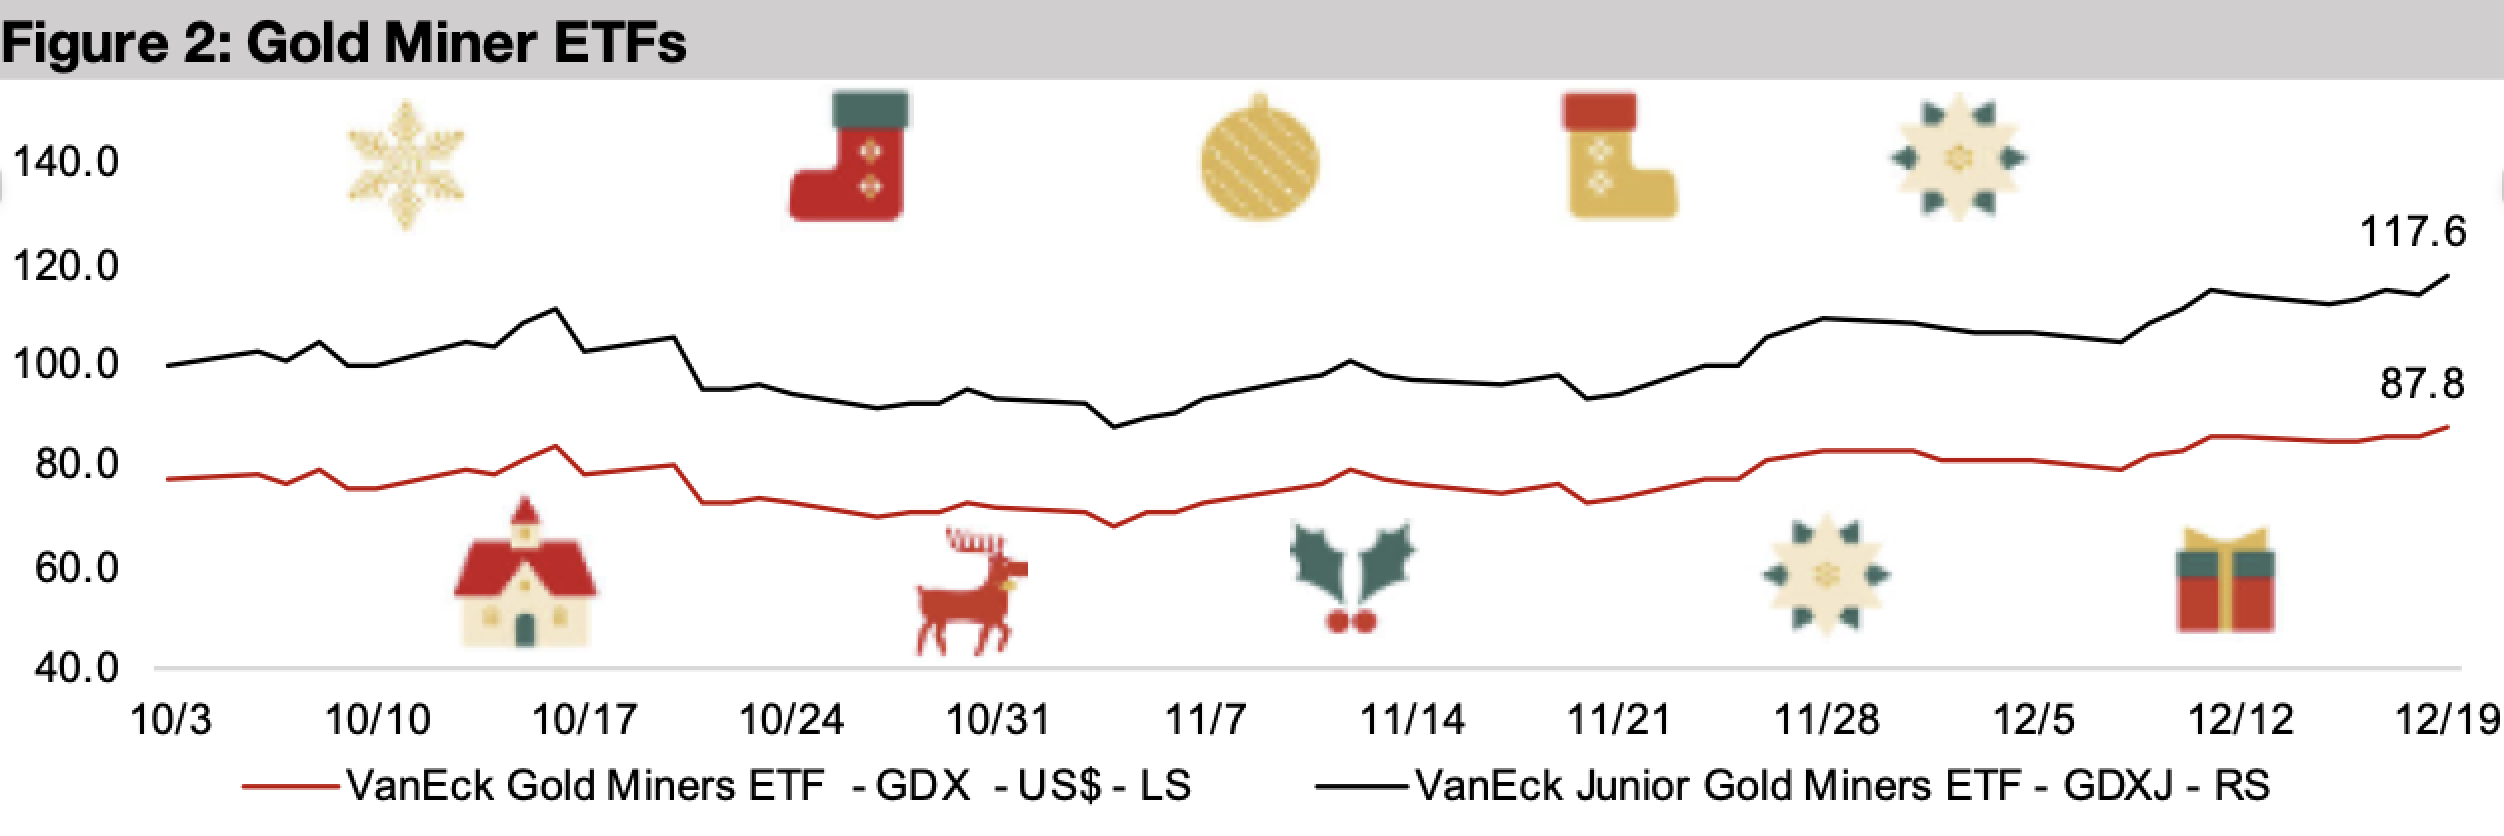
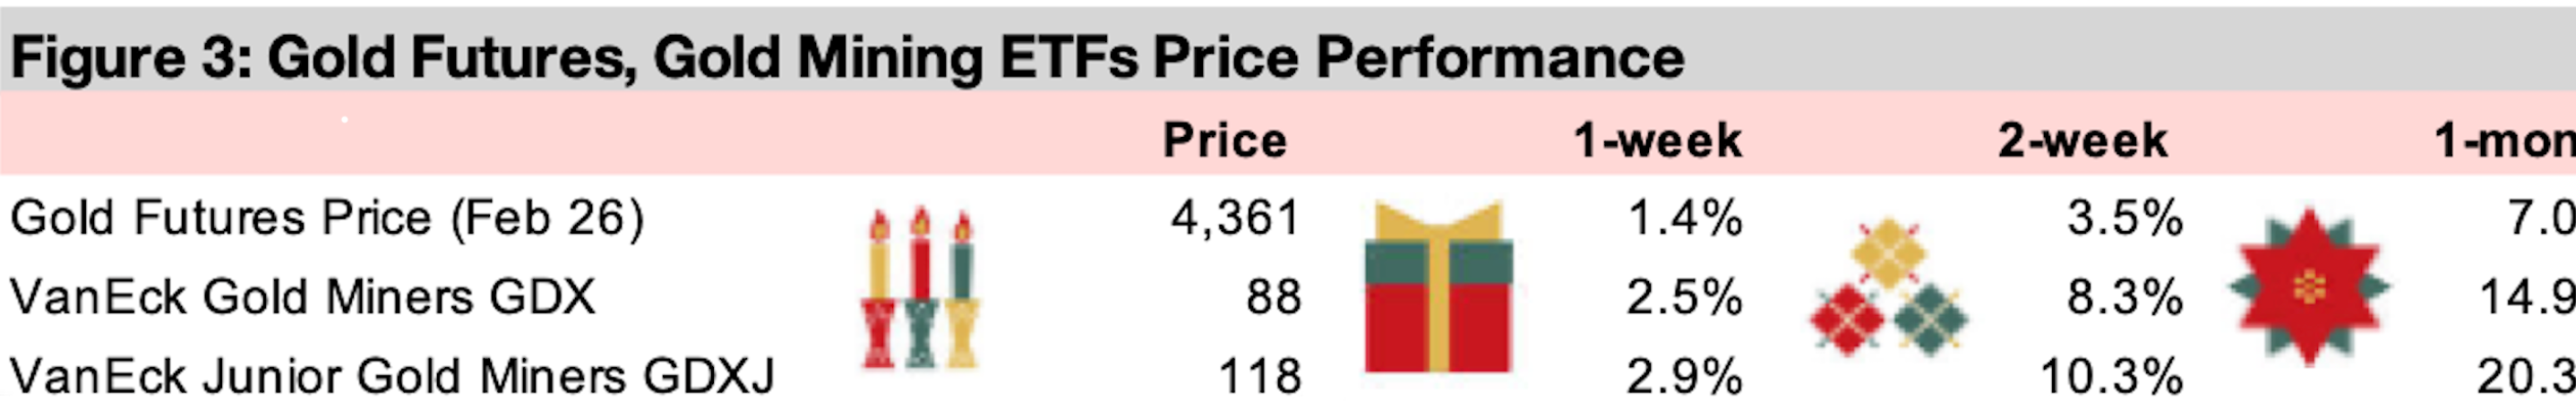
The gold price jumped 1.4% to US$4,361/oz, as US CPI data came in under expectations and jobs numbers beat estimates, although the unemployment rate rose, for November 2025. Both these figures were reported late on the government shutdown and seemed to back up the Fed’s recent rate cut. Even as this data implied some support for further rate cuts into 2026, which the Fed indicated were a possibility in comments at their recent meeting, the markets still shifted into risk-off mode. The S&P 500 declined -0.4%, the Nasdaq edged down -0.1% and the Russell 2000 index lost -1.3%, although apart from gold, there was no major hedging with defensives sectors, with US Utilities and US Consumer Staples both losing -1.6% and underperforming the overall markets. The gold stocks outperformed, with the GDX up 2.5% and GDXJ adding 2.9%, and both reaching news highs.
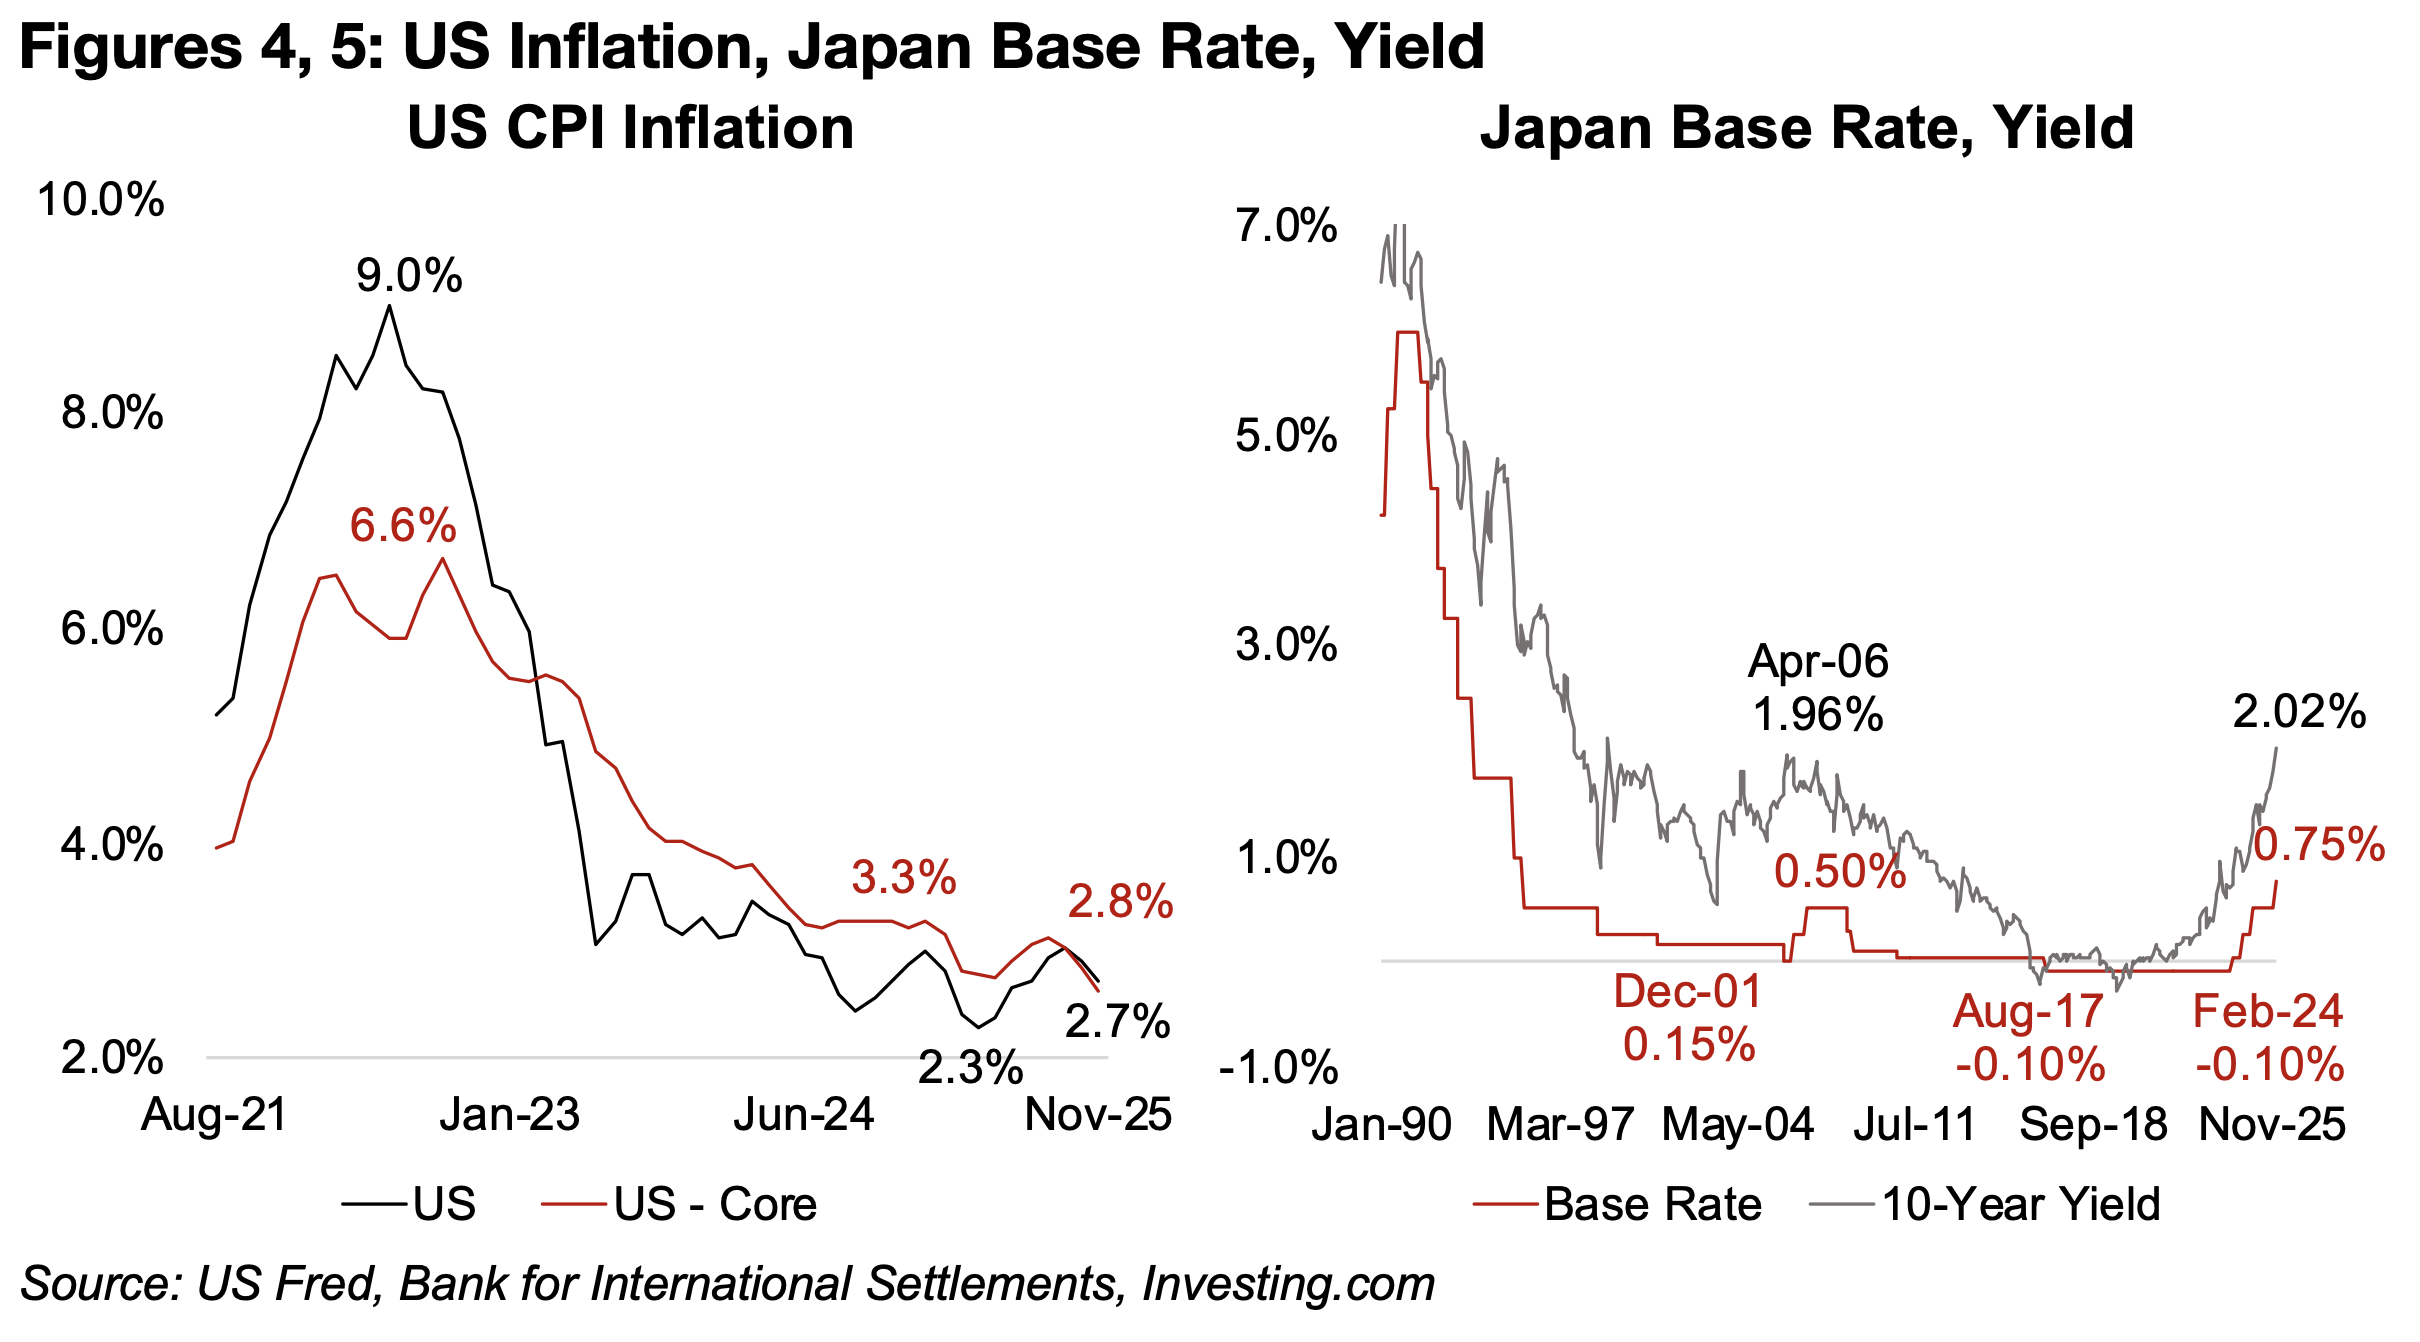
US headline CPI inflation dipped to 2.7% in November 2025, down from a recent peak of 3.1% in August 2025, while core inflation also declined to 2.7% from a 3.0% peak in September 2025 (Figure 4). After declining in Q1/25, inflation had started to rise, and with the delay in reporting from the government shutdown, it had been unclear whether inflation had declined enough to justify the Fed’s recent rate cut. Inflation could be easing in part because of rising unemployment, which reached 4.6% in November 2025, up from lows of 3.4% in early 2023, and a deteriorating jobs situation would tend to support to further rate cuts by the Fed heading into 2026. However, the employment data this week was not entirely negative, with US seasonally adjusted nonfarm payrolls of 64k in November considerably ahead of estimates for 45k and recovering from a -105k slump in October 2025.
One of the most significant macroeconomic moves this week came from Japan, with
its central bank boosting its base rate by 0.25% to 0.75% (Figure 5). This contrasts
with most major global central banks which have been in a rate cutting cycle since
as early as mid-2024, with the US joining relatively late, with its first cut in September
2025. This has put Japan’s base rate at its highest level in twenty years, and has seen
its 10-year yield reach 2.02%, above a previous peak of 1.96% in April 2006. This
has caused some concern in markets, as it implies a continued unwinding of the
‘Japan carry trade’, a persistent feature of markets for over two decades.
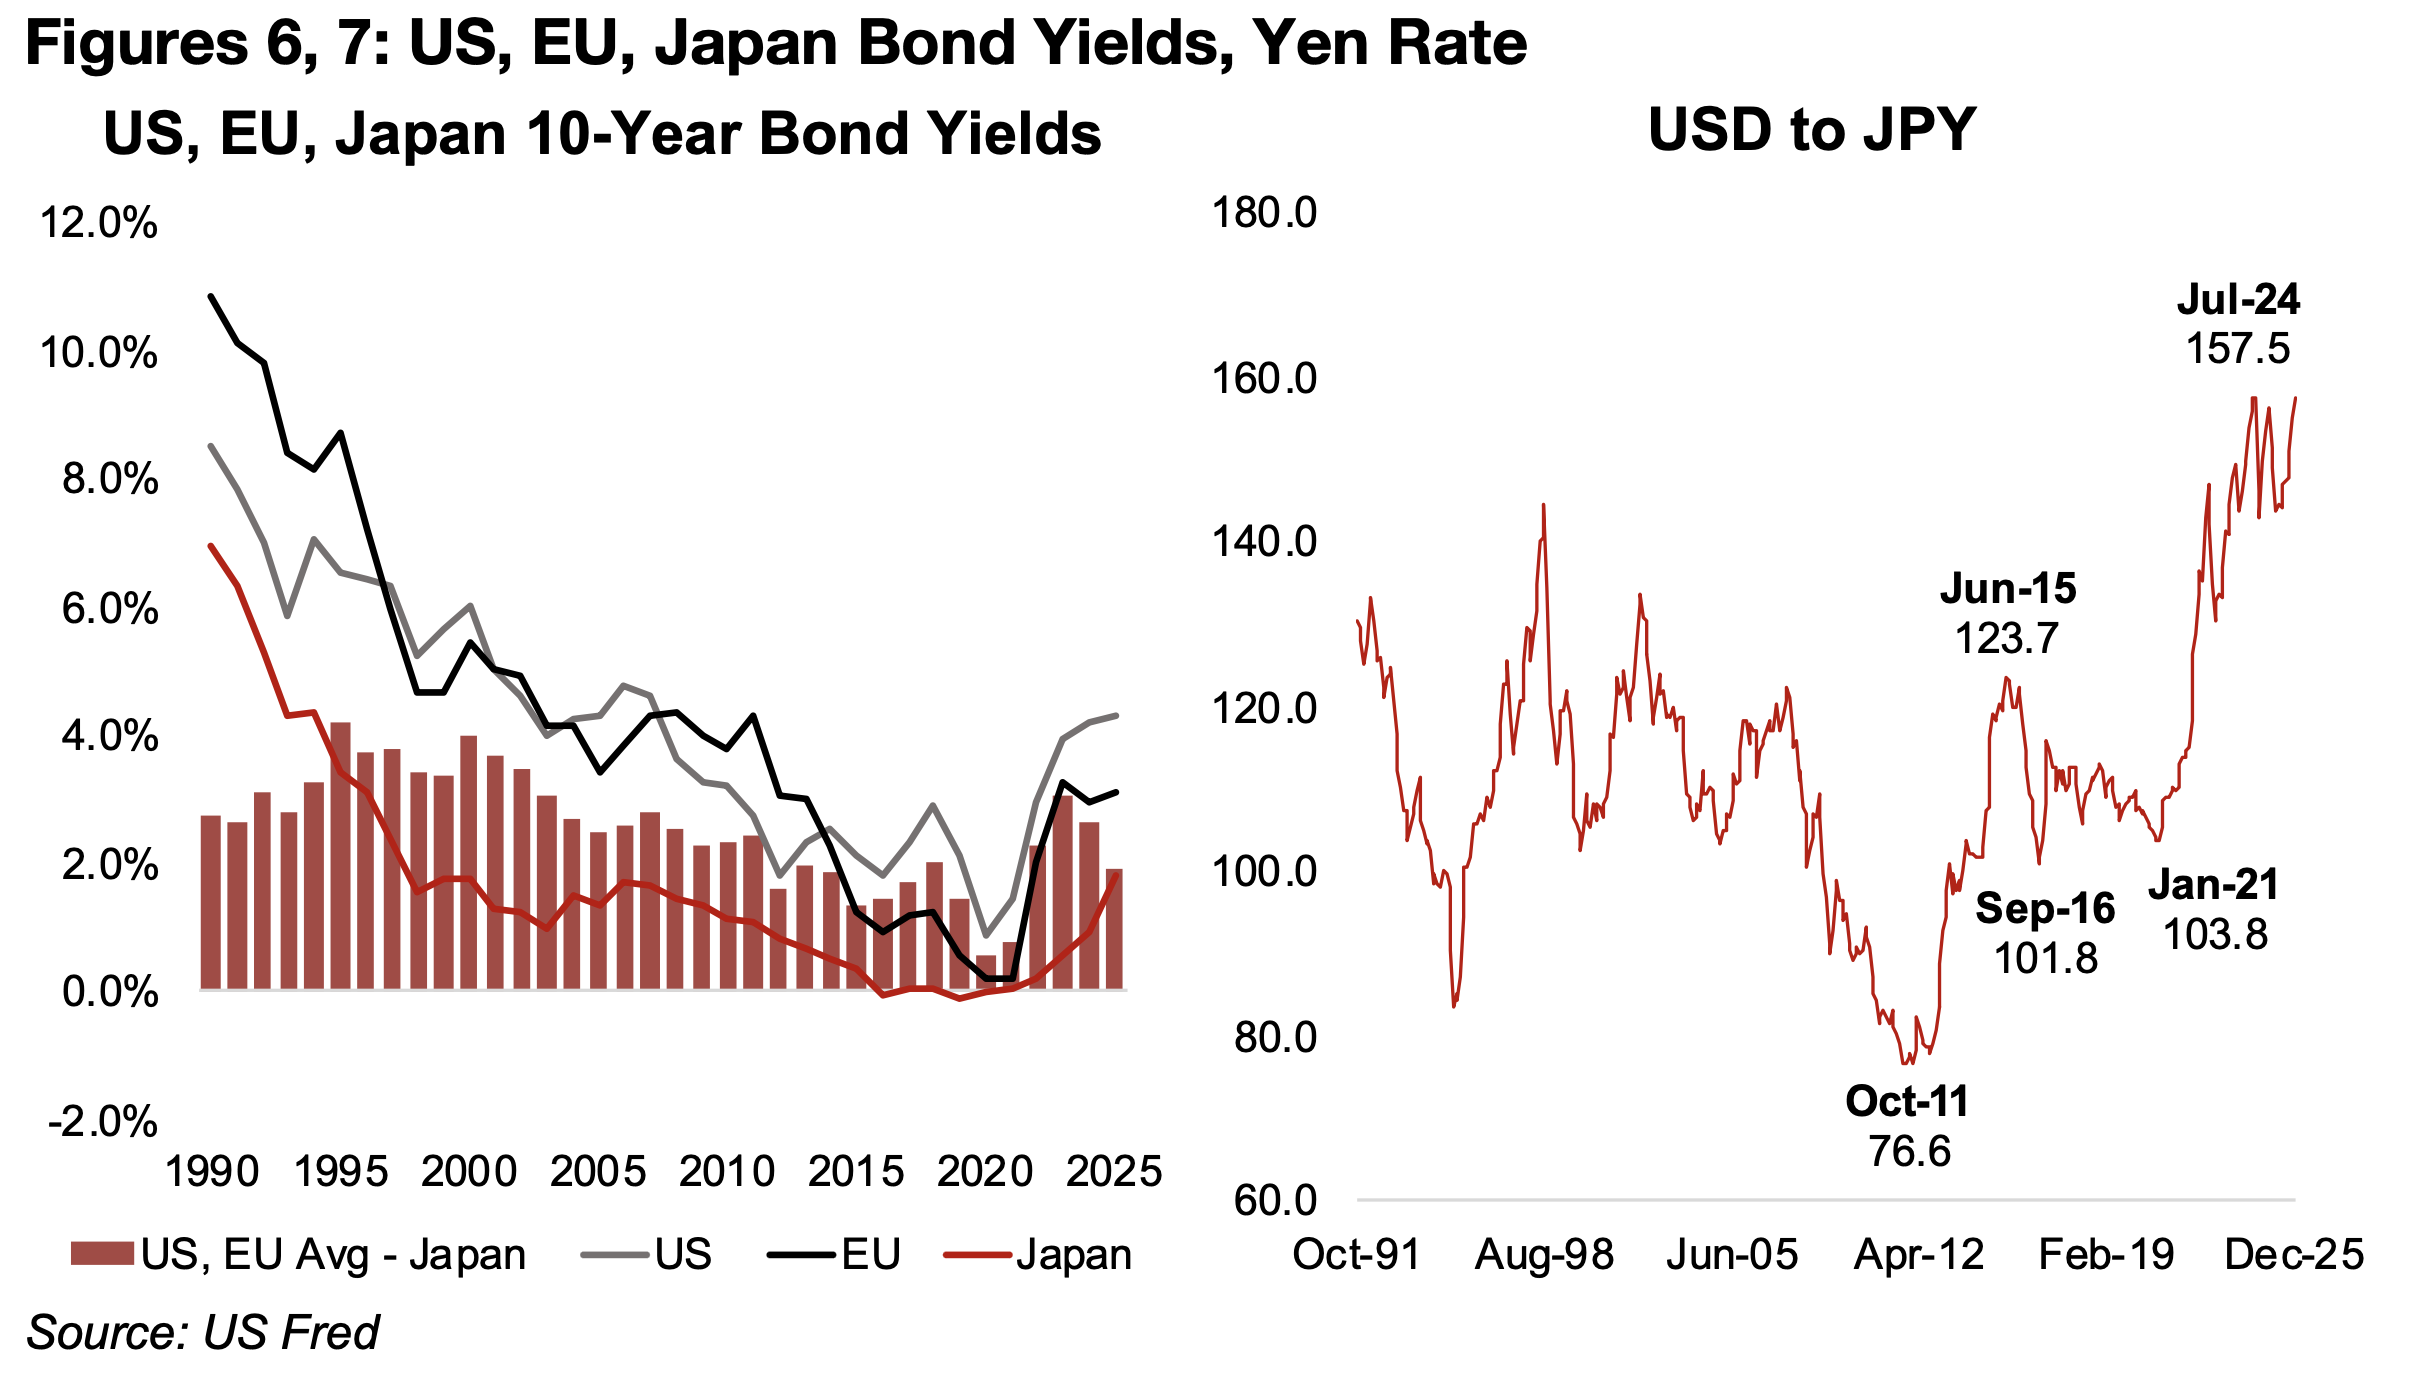
The trade was based on very low interest rates in Japan versus the rest of the world,
with the base rate near zero from the late-1990s until early 2024. This created a
substantial spread between the average 10-year yield in the US and EU versus Japan,
allowing the market to borrow in Yen at low rates, convert to other currencies and
then invest globally at far higher yields (Figure 6). As long as the exchange rate was
relatively stable versus other currencies, the trade remained low risk, as markets
could eventually convert their foreign currency back into Yen and lock in gains.
While there was some volatility in the US$ to JPY exchange rate from 2005 to 2022,
it averaged JPY105.3/US$, ranging between JPY76.6/US$ to JPY123.7/US$ (Figure
7). After the spread narrowed to near zero in 2021 and 2022, it widened again as the
US and EU boosted interest rates substantially in 2023 and early 2024, driving a
substantial depreciation in the Yen, further increasing the attractive of the carry trade.
However, with the BoJ expected to increase rates as high as 1.5%, and the US and
EU both cutting rates, the spread has again narrowed.
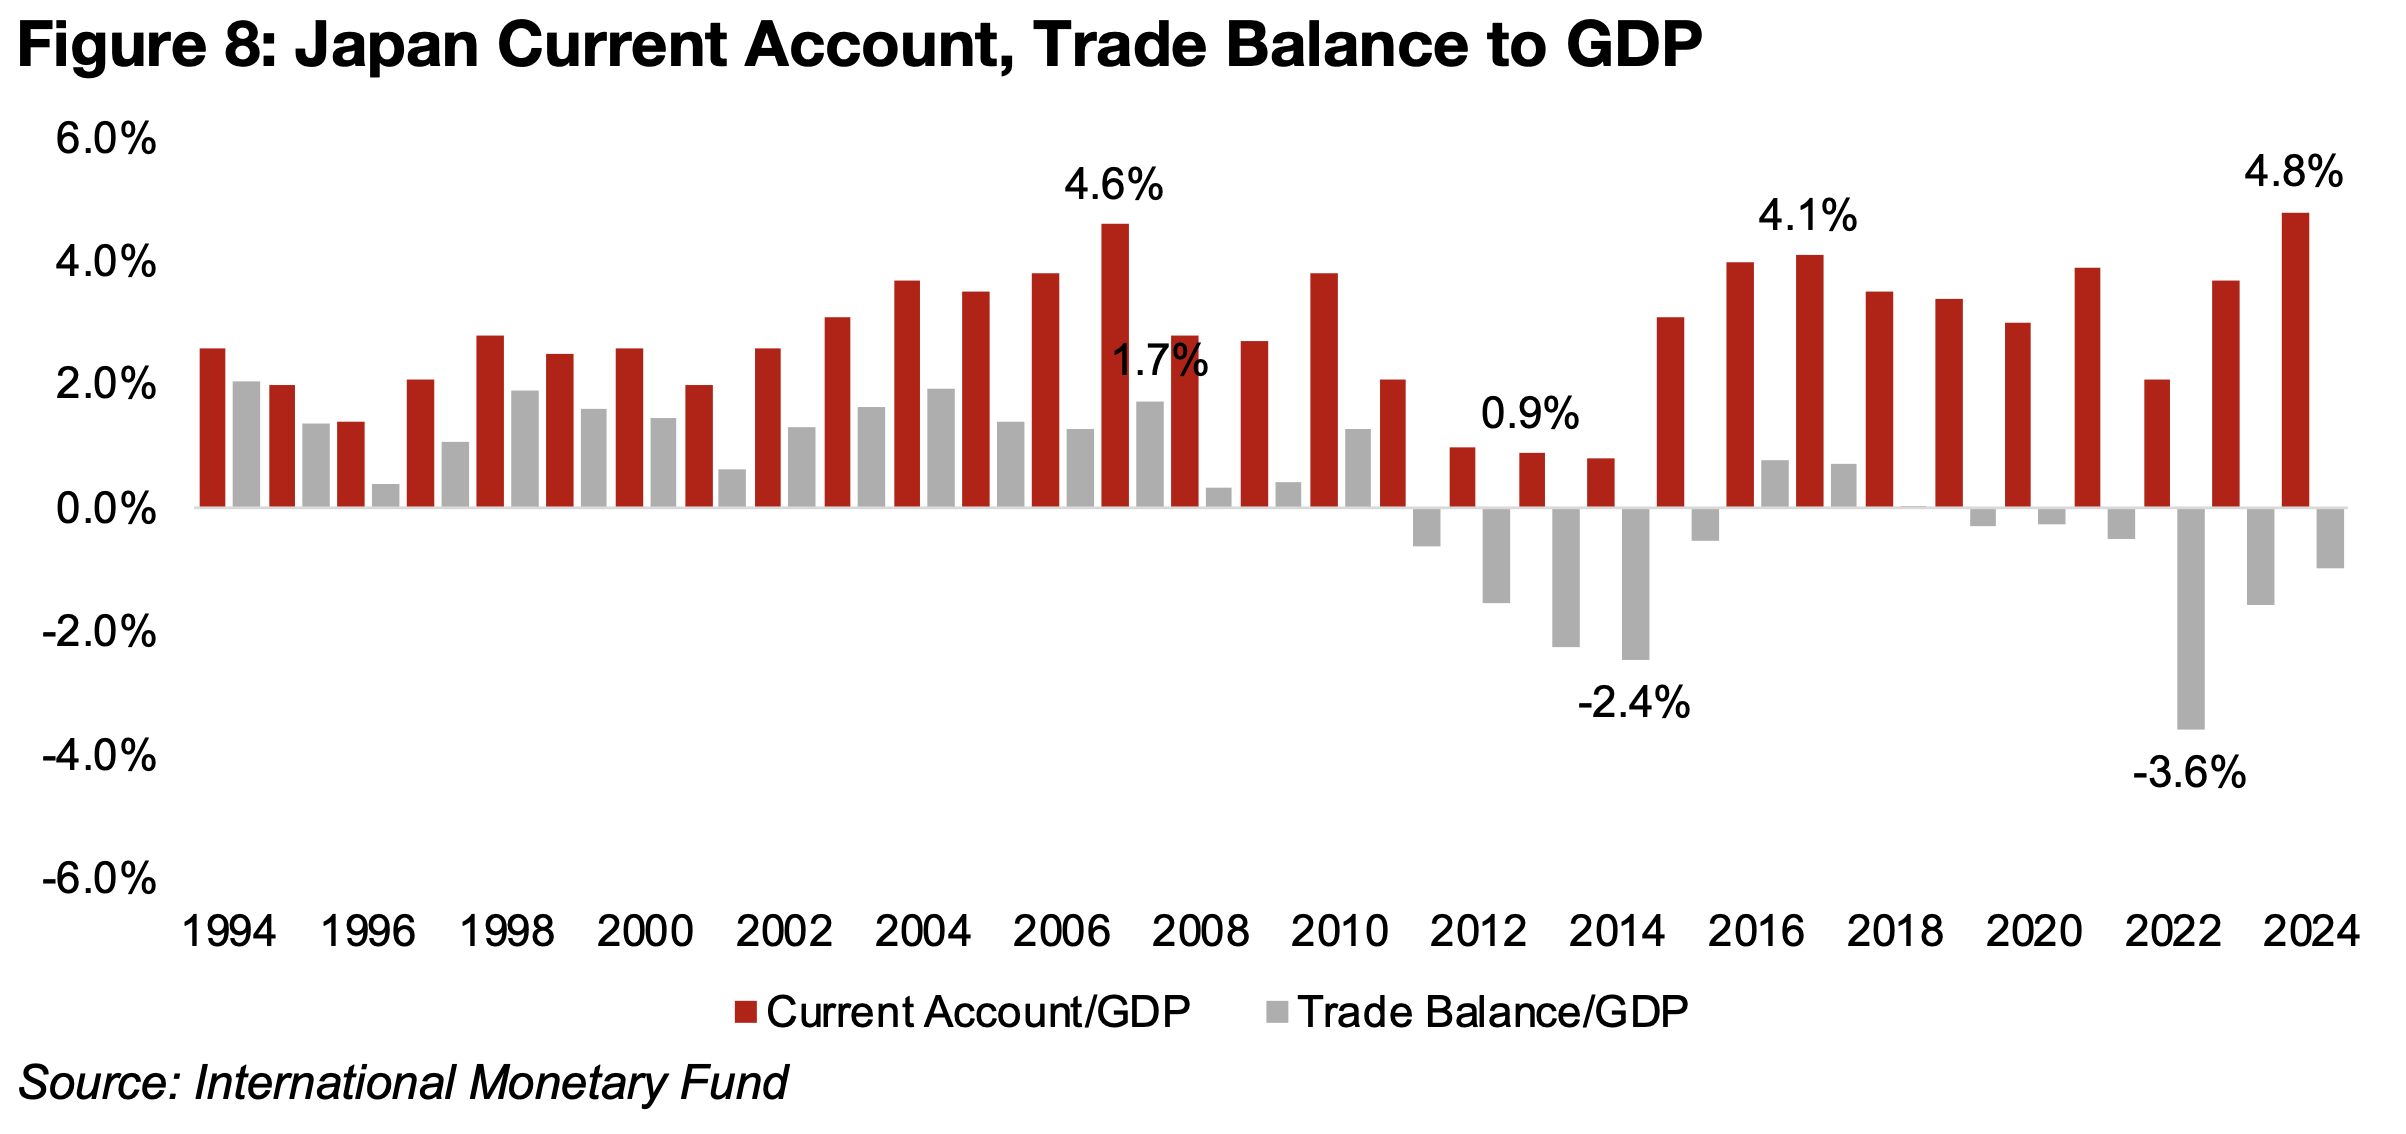
One key reason that the carry trade could persist is that Japan runs a very large current account surplus to GDP, which can come from two factors. The first is that a country has higher exports than imports, and the second is that there is higher income coming in from investments abroad than going out from foreign countries’ investment domestically. Overall a current account surplus indicates that the country is a net lender globally and a current account deficit shows that it is a net borrower. Japan has had a current account surplus for the past three decades, driven in part by a considerable trade surplus from 1994-2011 (Figure 8). However, since 2012, there has been a trade deficit in every year except for two, but this has been more than offset by Japan’s considerable investments abroad, which boost the current account.
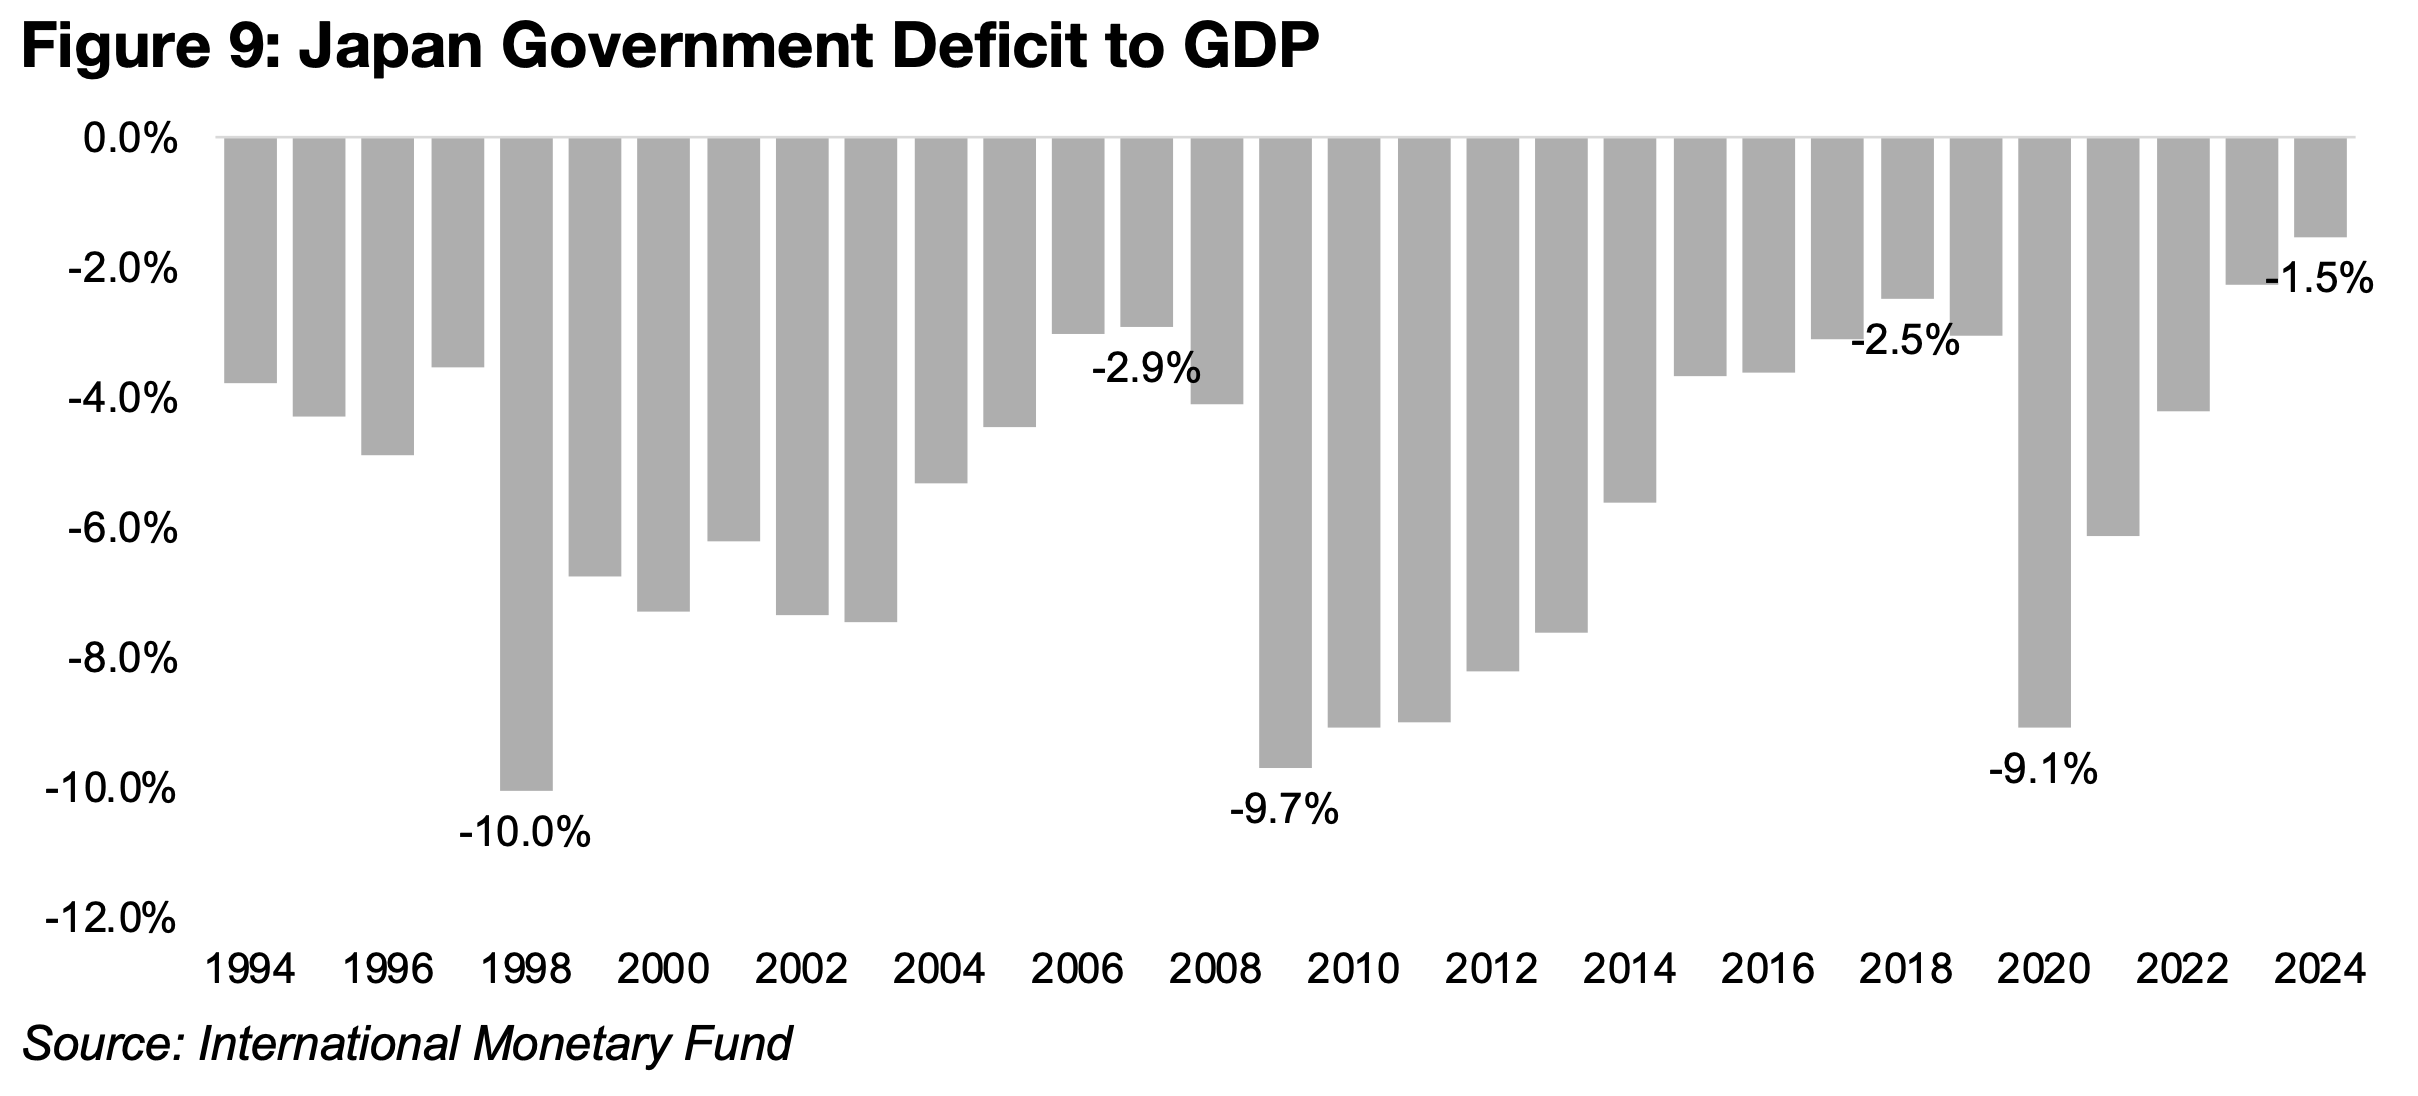
This current account surplus has also been key in balancing Japan’s domestic fiscal
situation, with it running a large government budget deficits in every year for the past
three decades, averaging -5.5%, making it a net borrower domestically (Figure 9). A
key macroeconomic identity is that a country’s private savings minus investment (S-
I) plus its government savings, taxes minus expenditure (T-G), must equal its net
foreign position, or exports minus imports and inflows from foreign investments
minus outflows from foreigners investing domestically (X-M).
For Japan, while government expenditure has outpaced taxes, this has been
balanced by a high net saving from the private and corporate sectors, and the high
net foreign income from investing globally. This high net savings in Japan has likely
been a key factor in keeping the interest rates so low, as this makes capital more
abundant domestically, and therefore less likely to drive up the interest rate. As
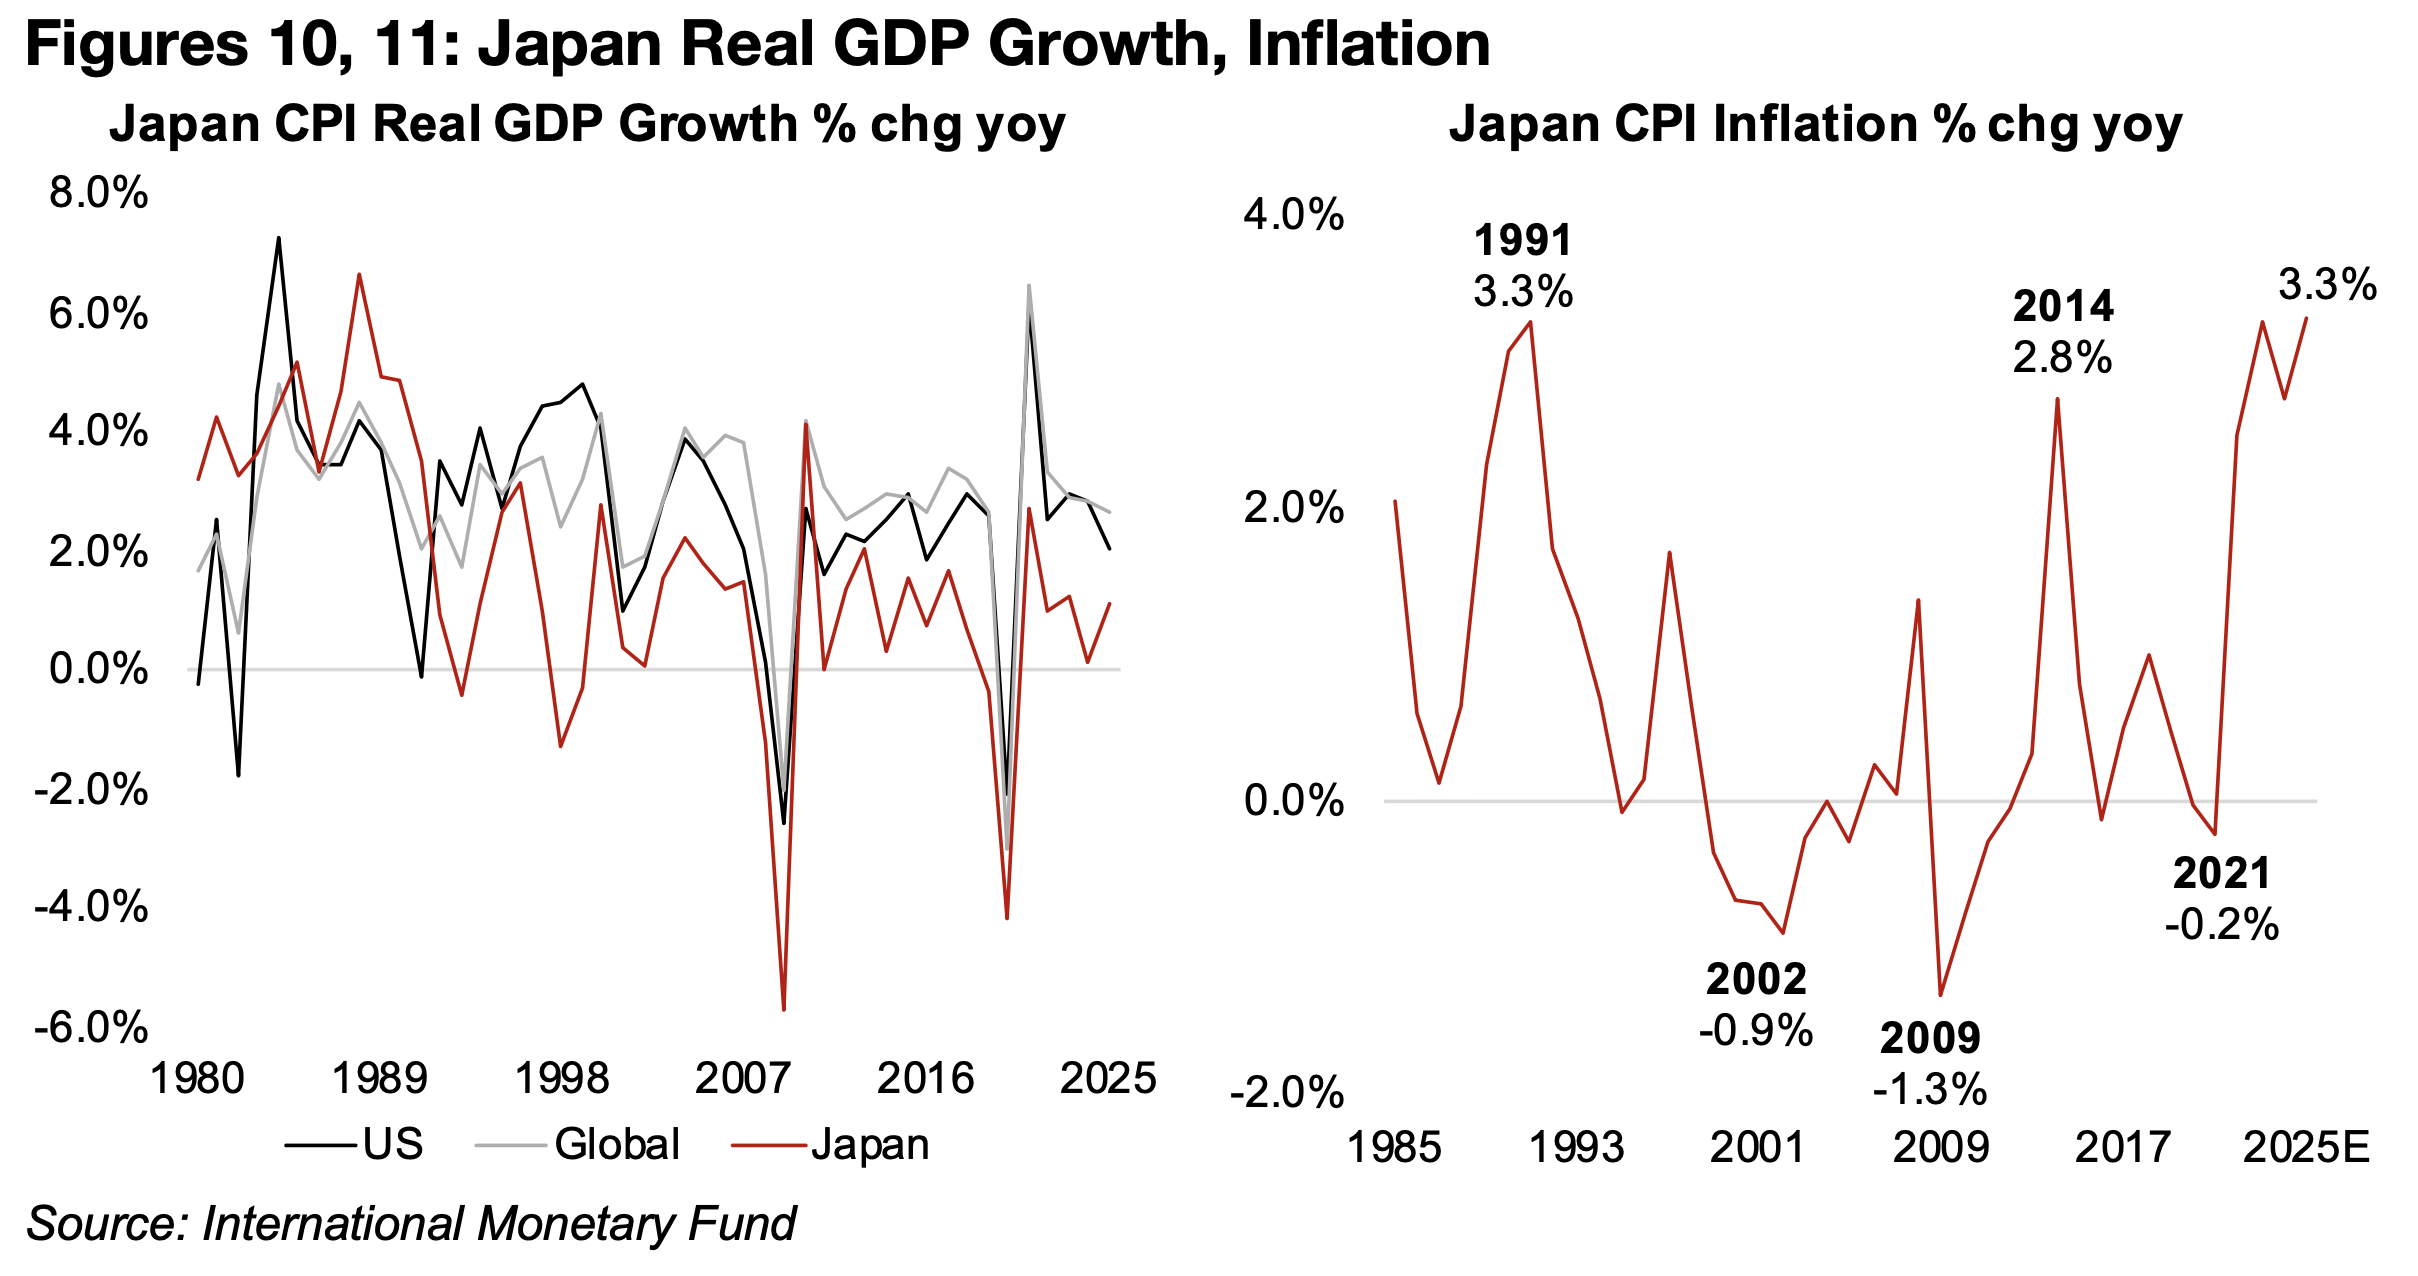
Japan’s economic real GDP growth has also been relatively low versus other major
countries, it will have also been a factor keeping demand for these funds relatively
low, and leading to a lower interest rate (Figure 10).
However, the weak Yen has made import costs for Japan considerably higher, and
wage growth has risen to its highest levels in decades from 2023-2025E. This has
driven inflation up to an average 3.1% from 2023-2025E, versus just 0.2%, from 1995
to 2022 (Figure 11). There was a spike in inflation during this period only in a single
year, to 2.8% in 2014, before the rise in recent years, and the last time prices rose
this much was as far back as 1991, with a 3.3% increase. As this is significantly above
the Bank of Japan’s 2.0% inflation target, it has driven the hike in interest rates, which
look set to continue into 2026, and could see three additional 0.25% hikes before
reaching the 1.5% expected. A continued trend of rising rates in Japan and declining
rates in the US and EU will see the Japan carry trade narrow and could also see the
currency eventually appreciate, further reducing the attractiveness of the trade.
For gold, if the Yen carry trade continues to unwind, it could mean some disruption
to markets as a key source of liquidity becomes smaller, with risk assets potentially
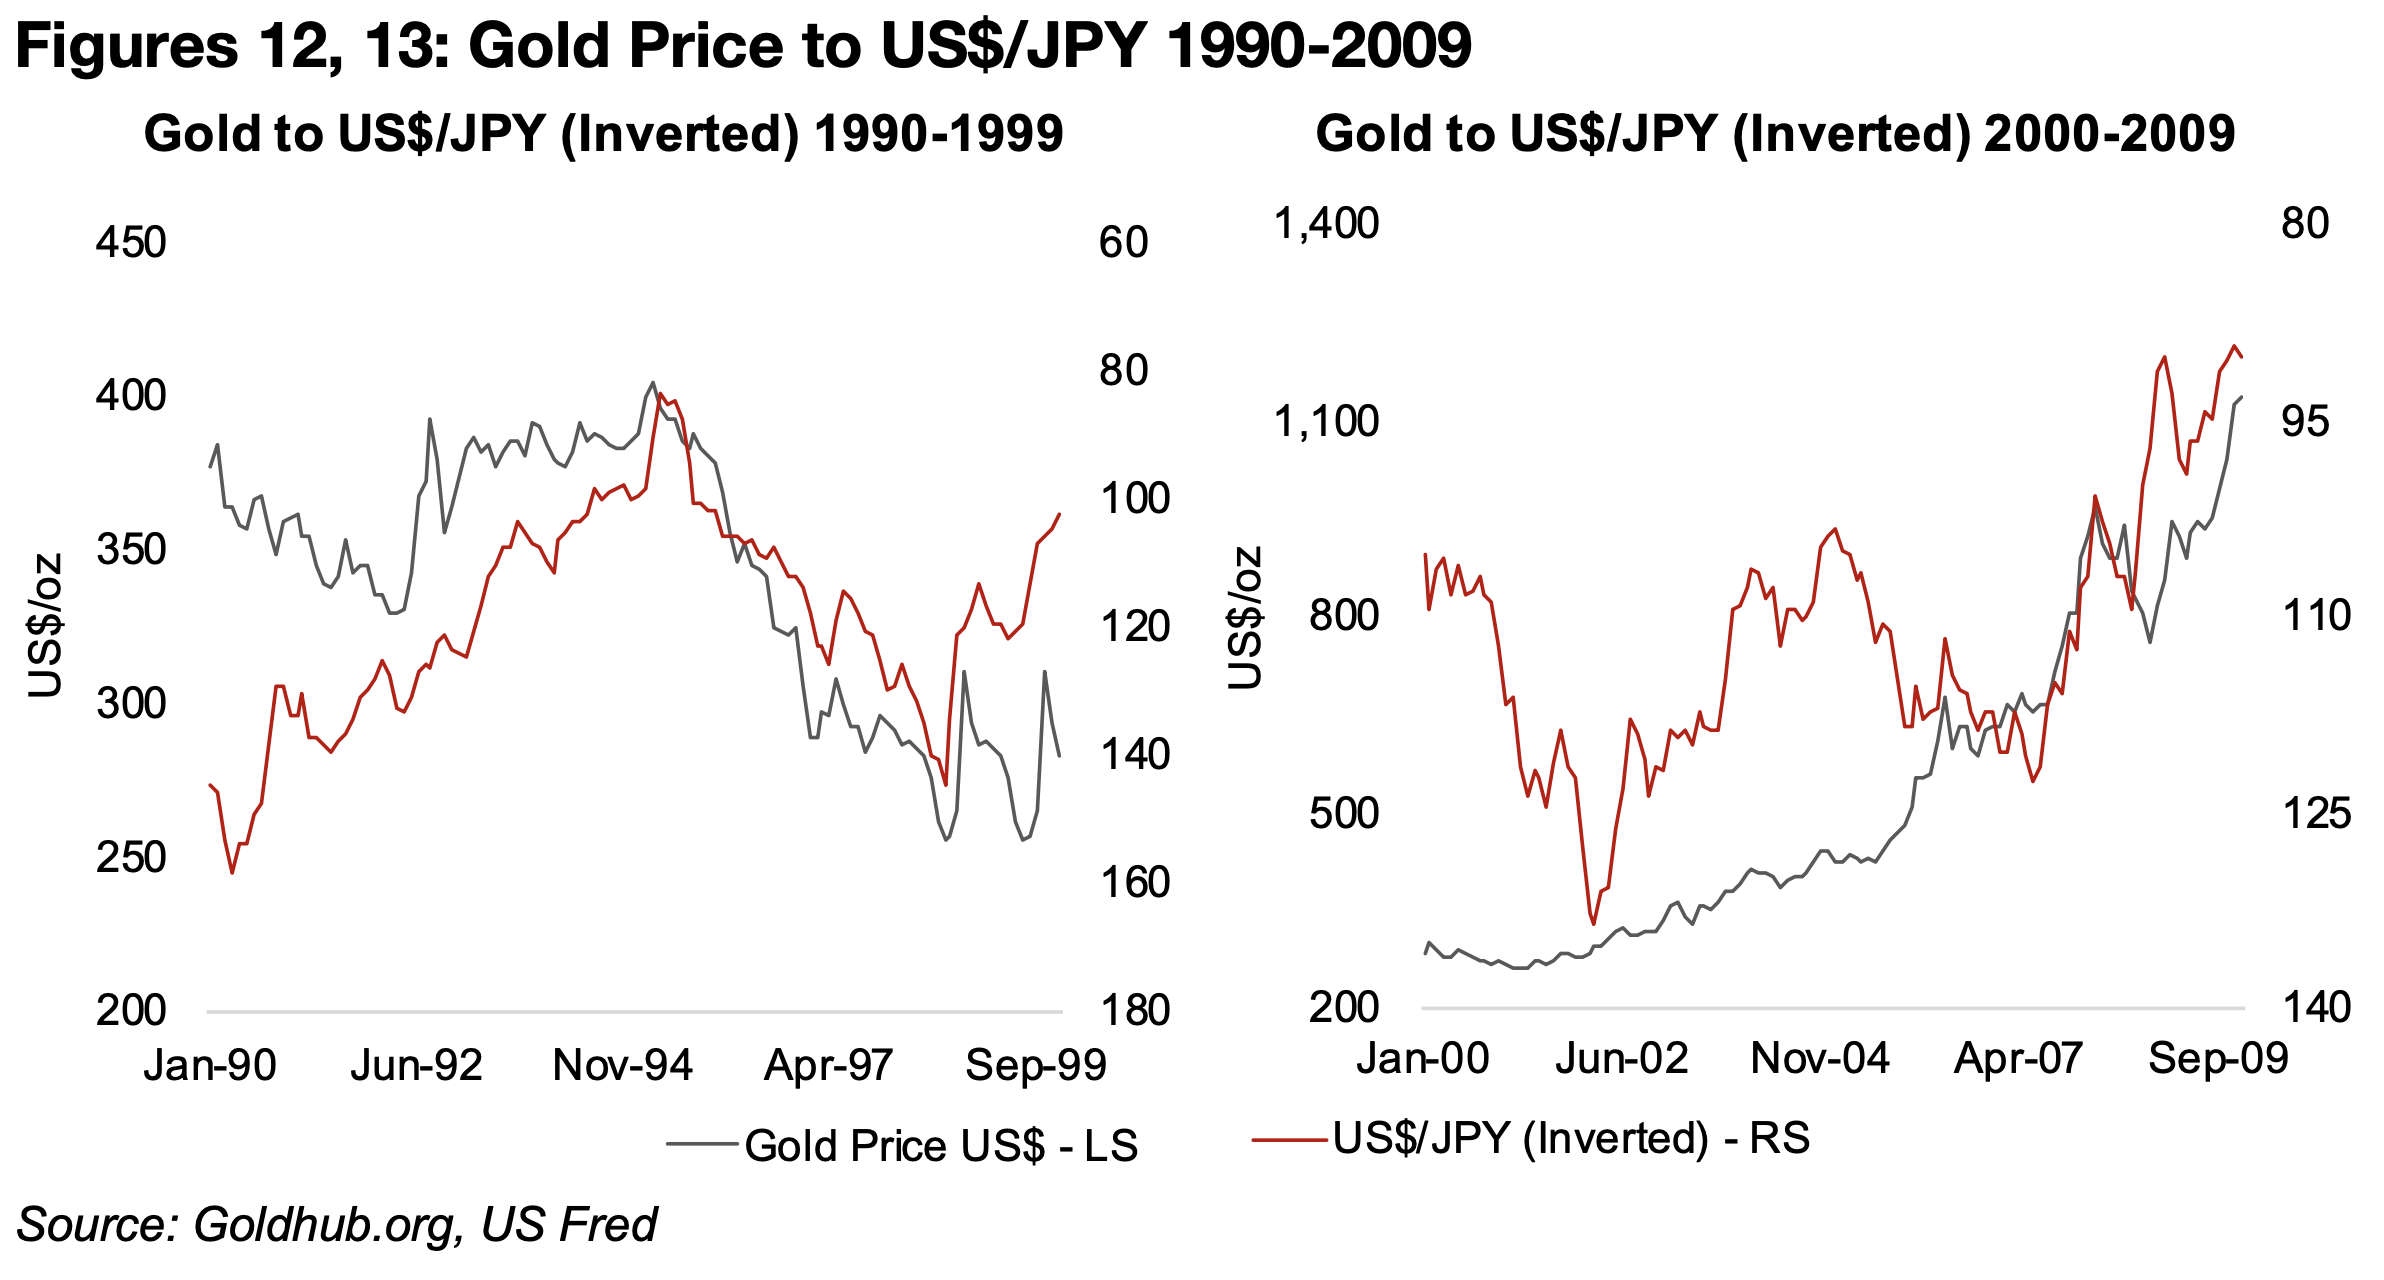
taking a hit, and driving a move into safe haven assets like the metal. Both gold and
the Yen have historically been considered safe haven assets and tended to move in
tandem. This was the case through most of the 1990s, with a lower correlation
between the two in the first half of the 2000s, but them coming back into line for the
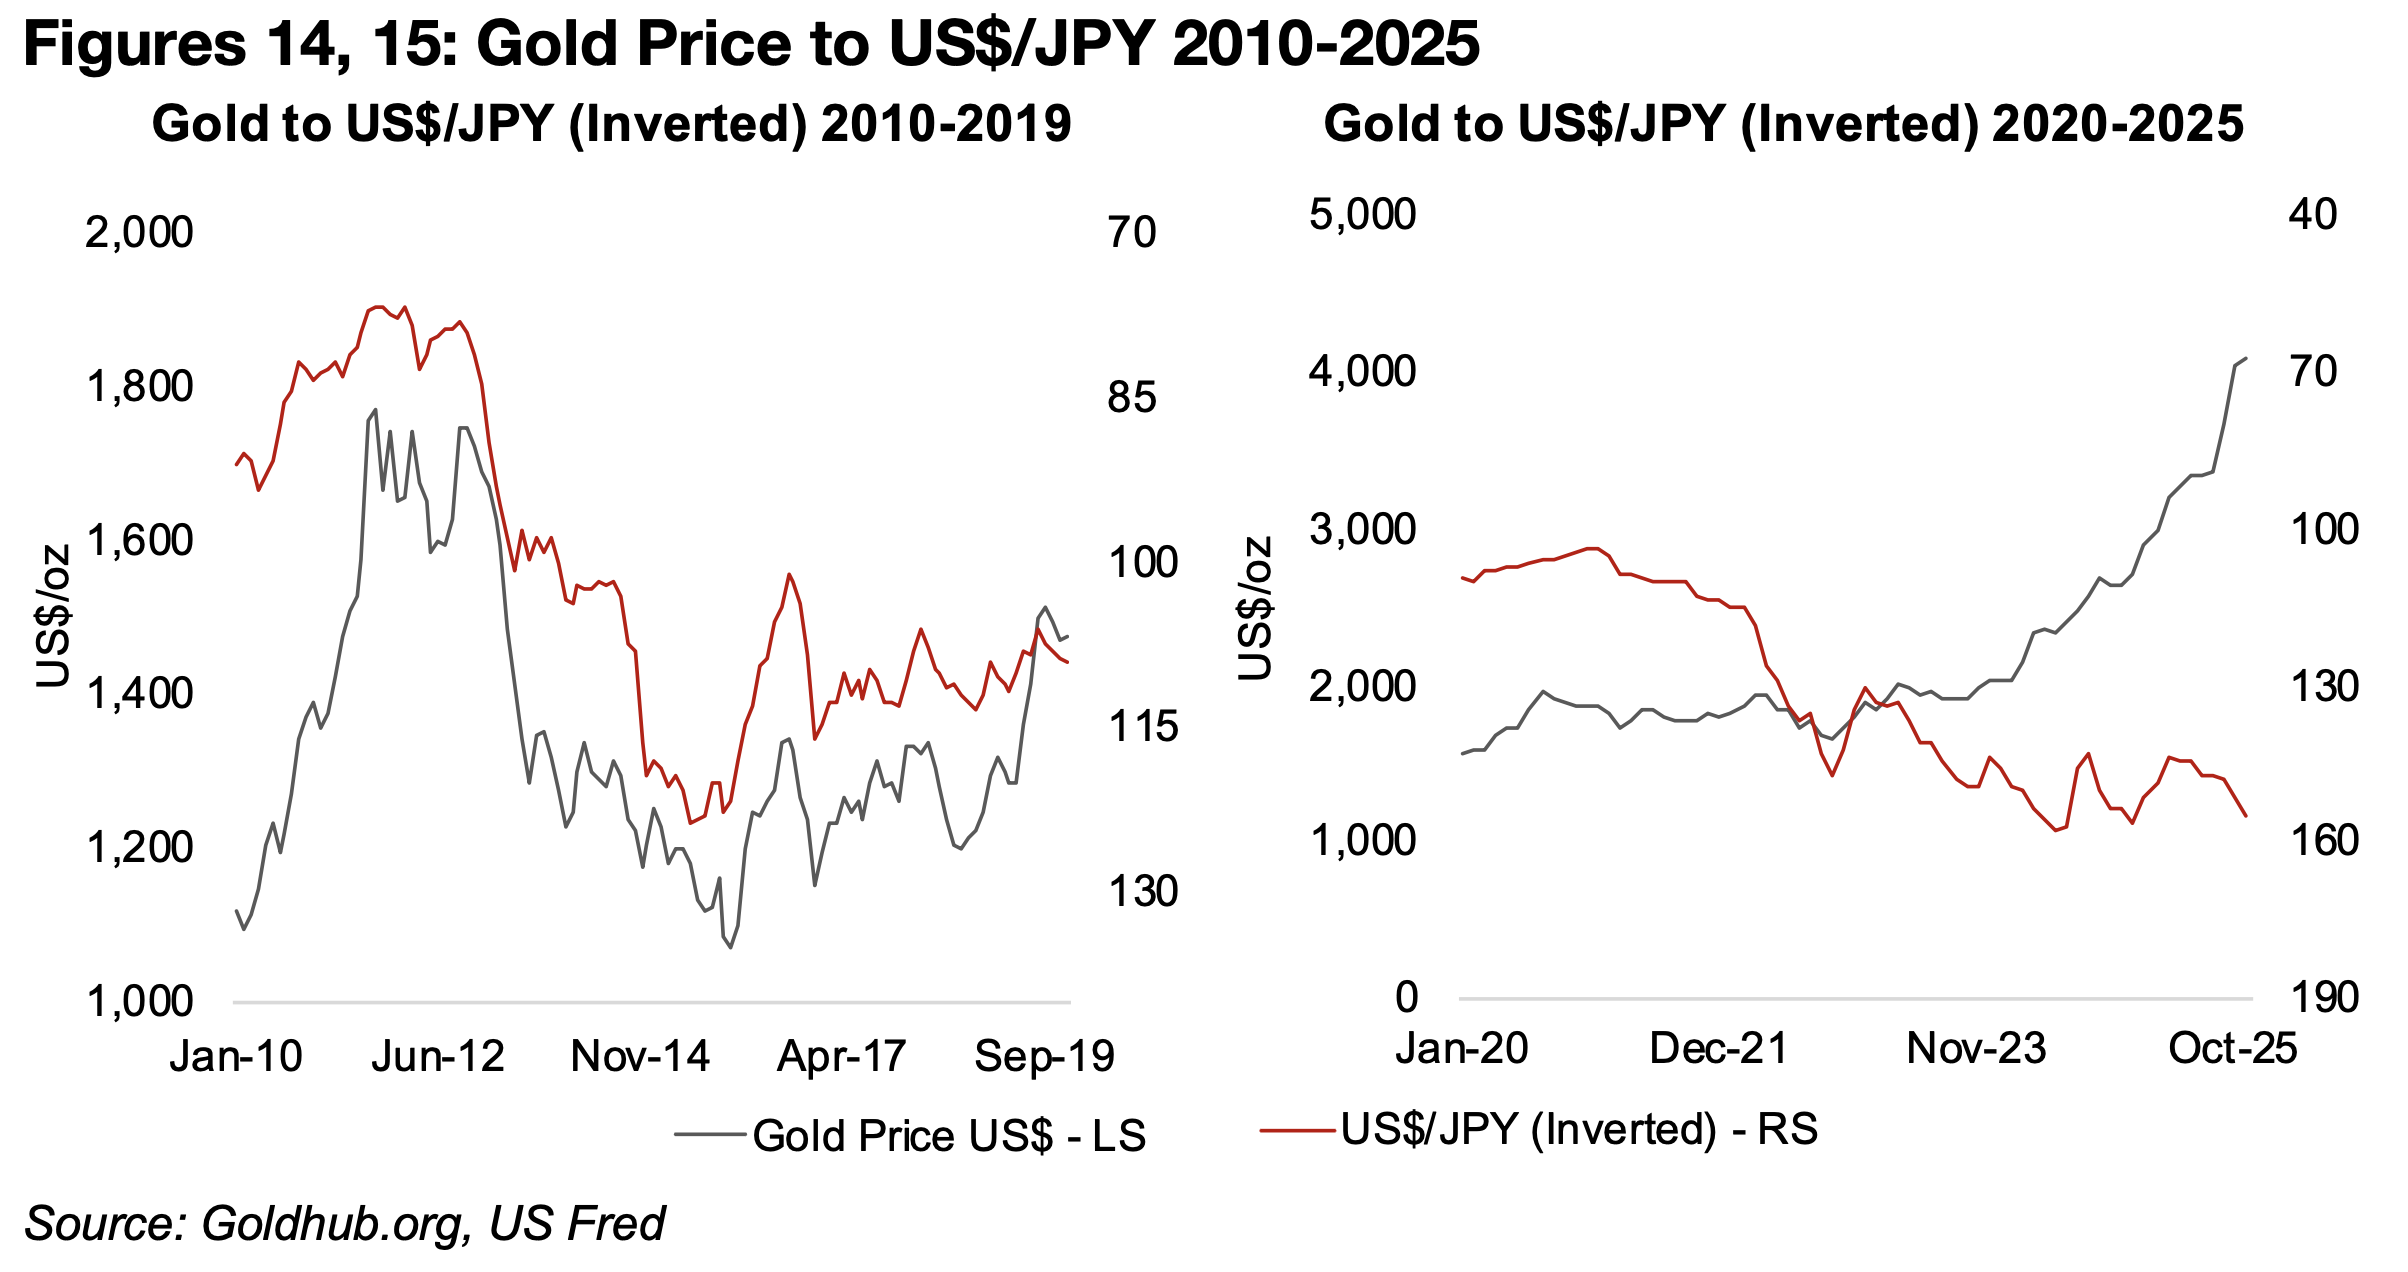
second half of that decade and from 2019 to 2019 (Figures 12-14).
However, since 2020, the assets have gone through another period of low correlation,
with gold surging since 2023 but the Yen depreciating (Figure 15). There is a question
of whether this will persist, as rising rates could eventually see the Yen appreciate
from several decade lows, bringing the two assets more back inline. There is also the
issue of whether Japan is entering a new period of sustained higher inflation and
normalized interest rates, which would be a major fundamental shift in markets versus
the past thirty years, and could benefit gold as a hedge to this new risk.
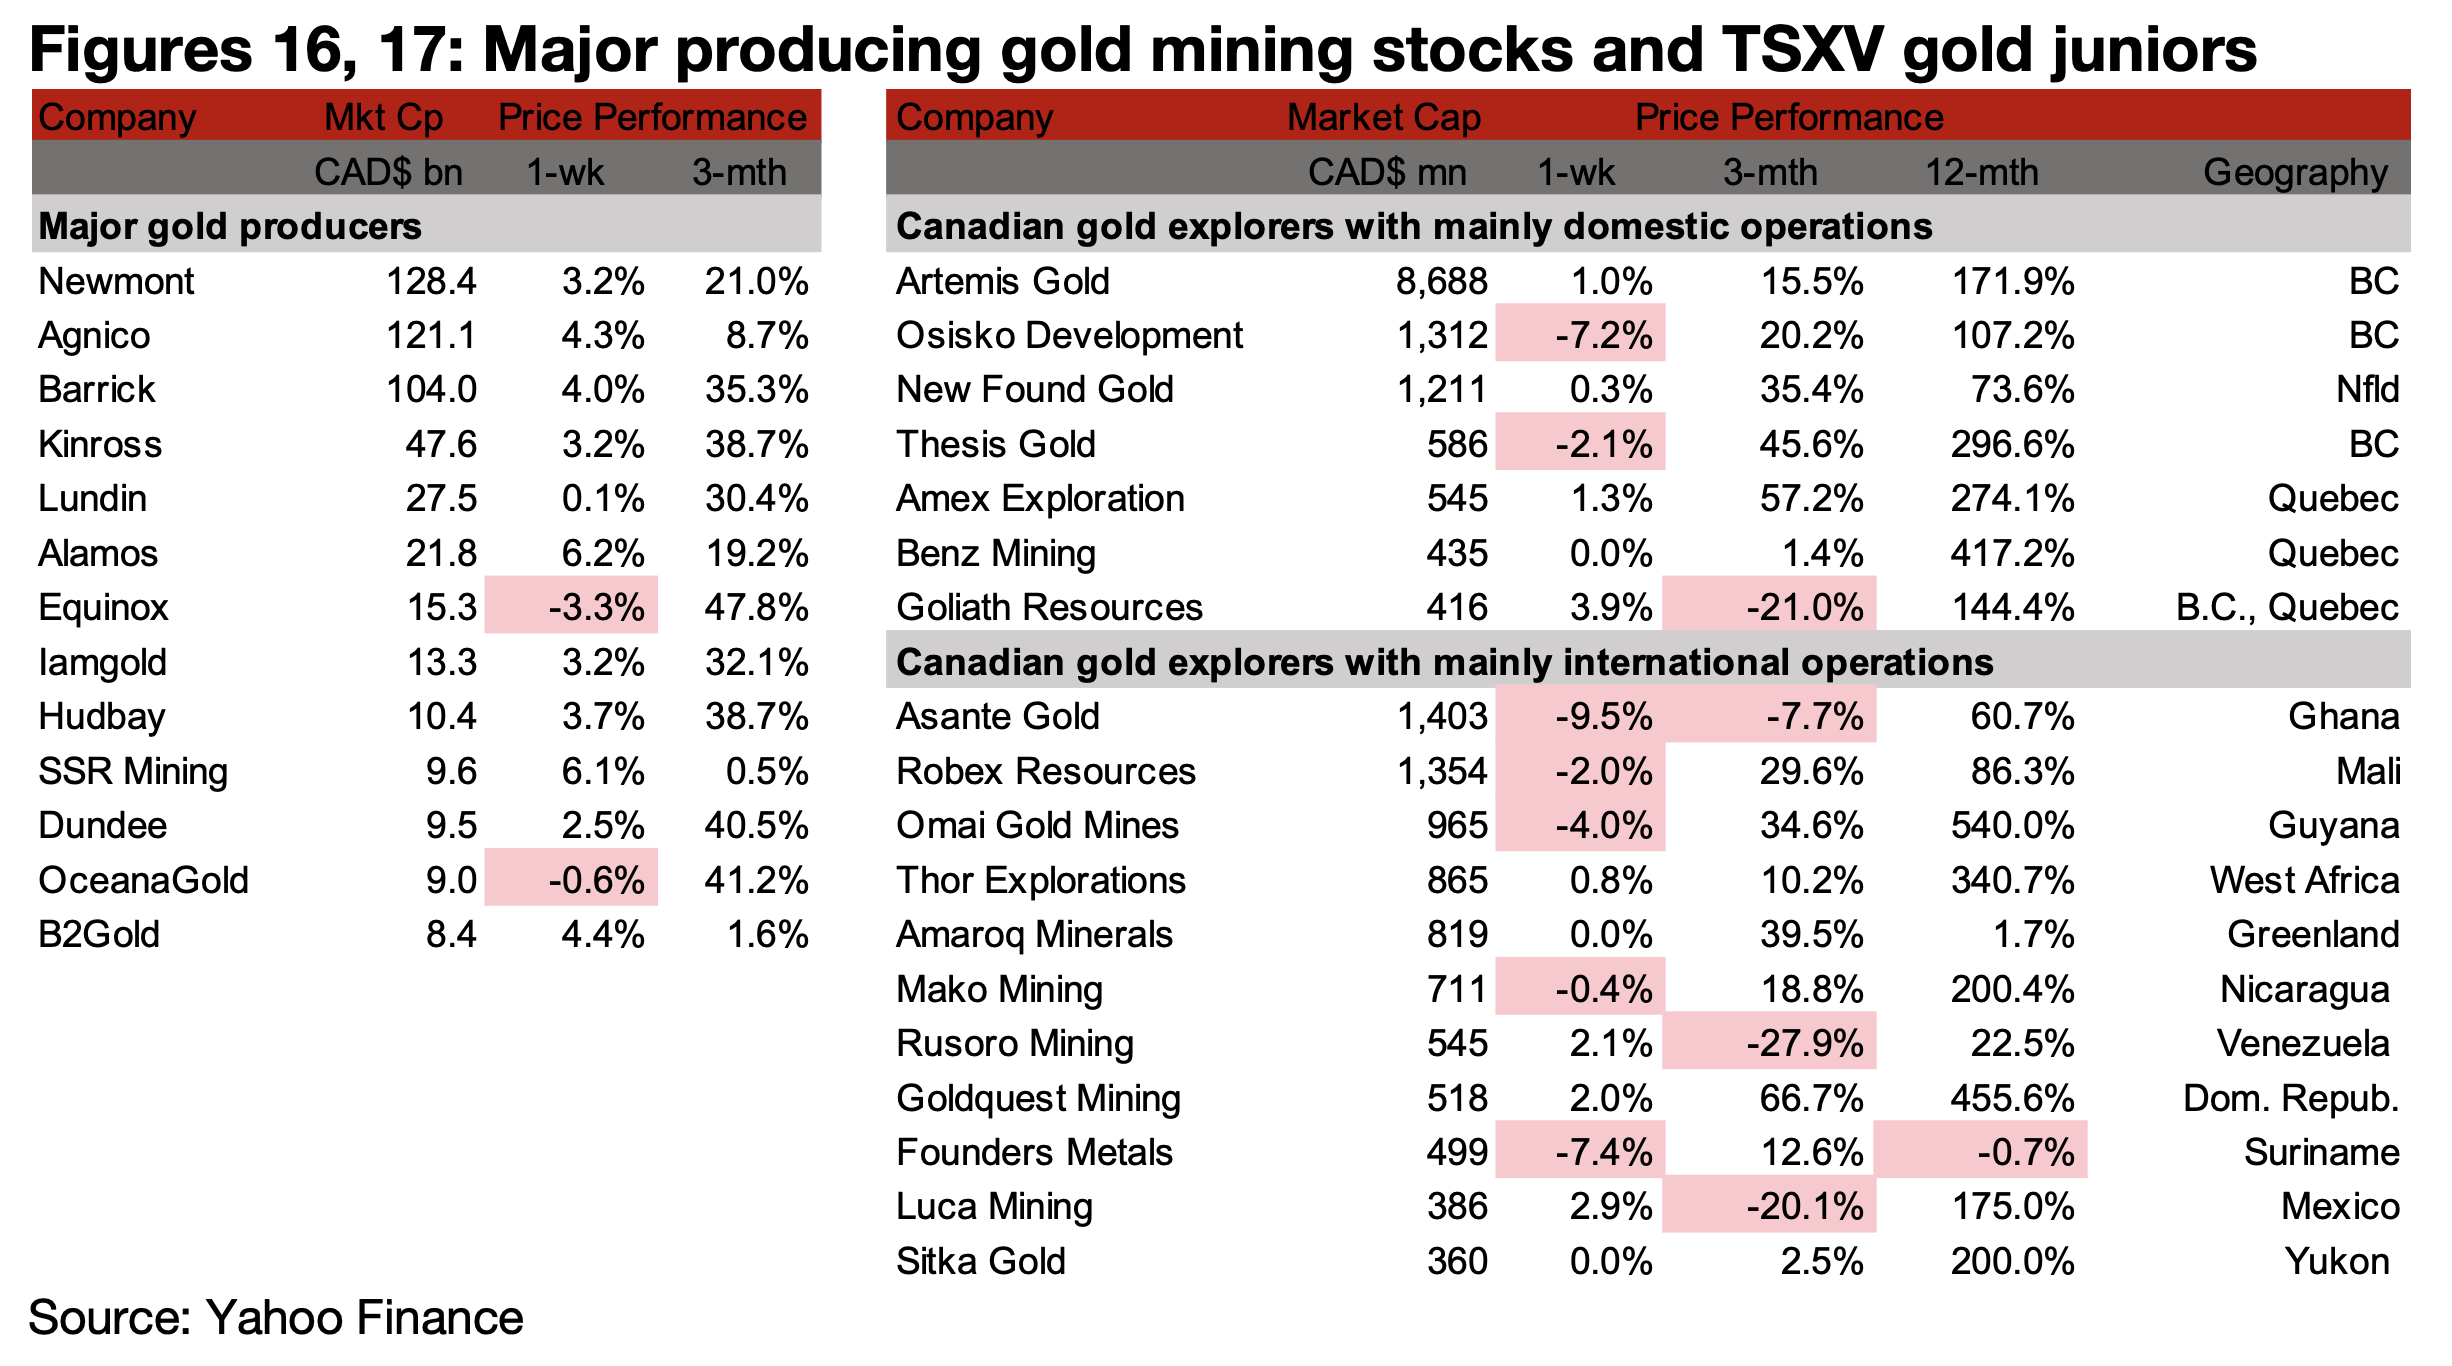
While the major producers mostly gained, TSXV gold was mixed on the decline in
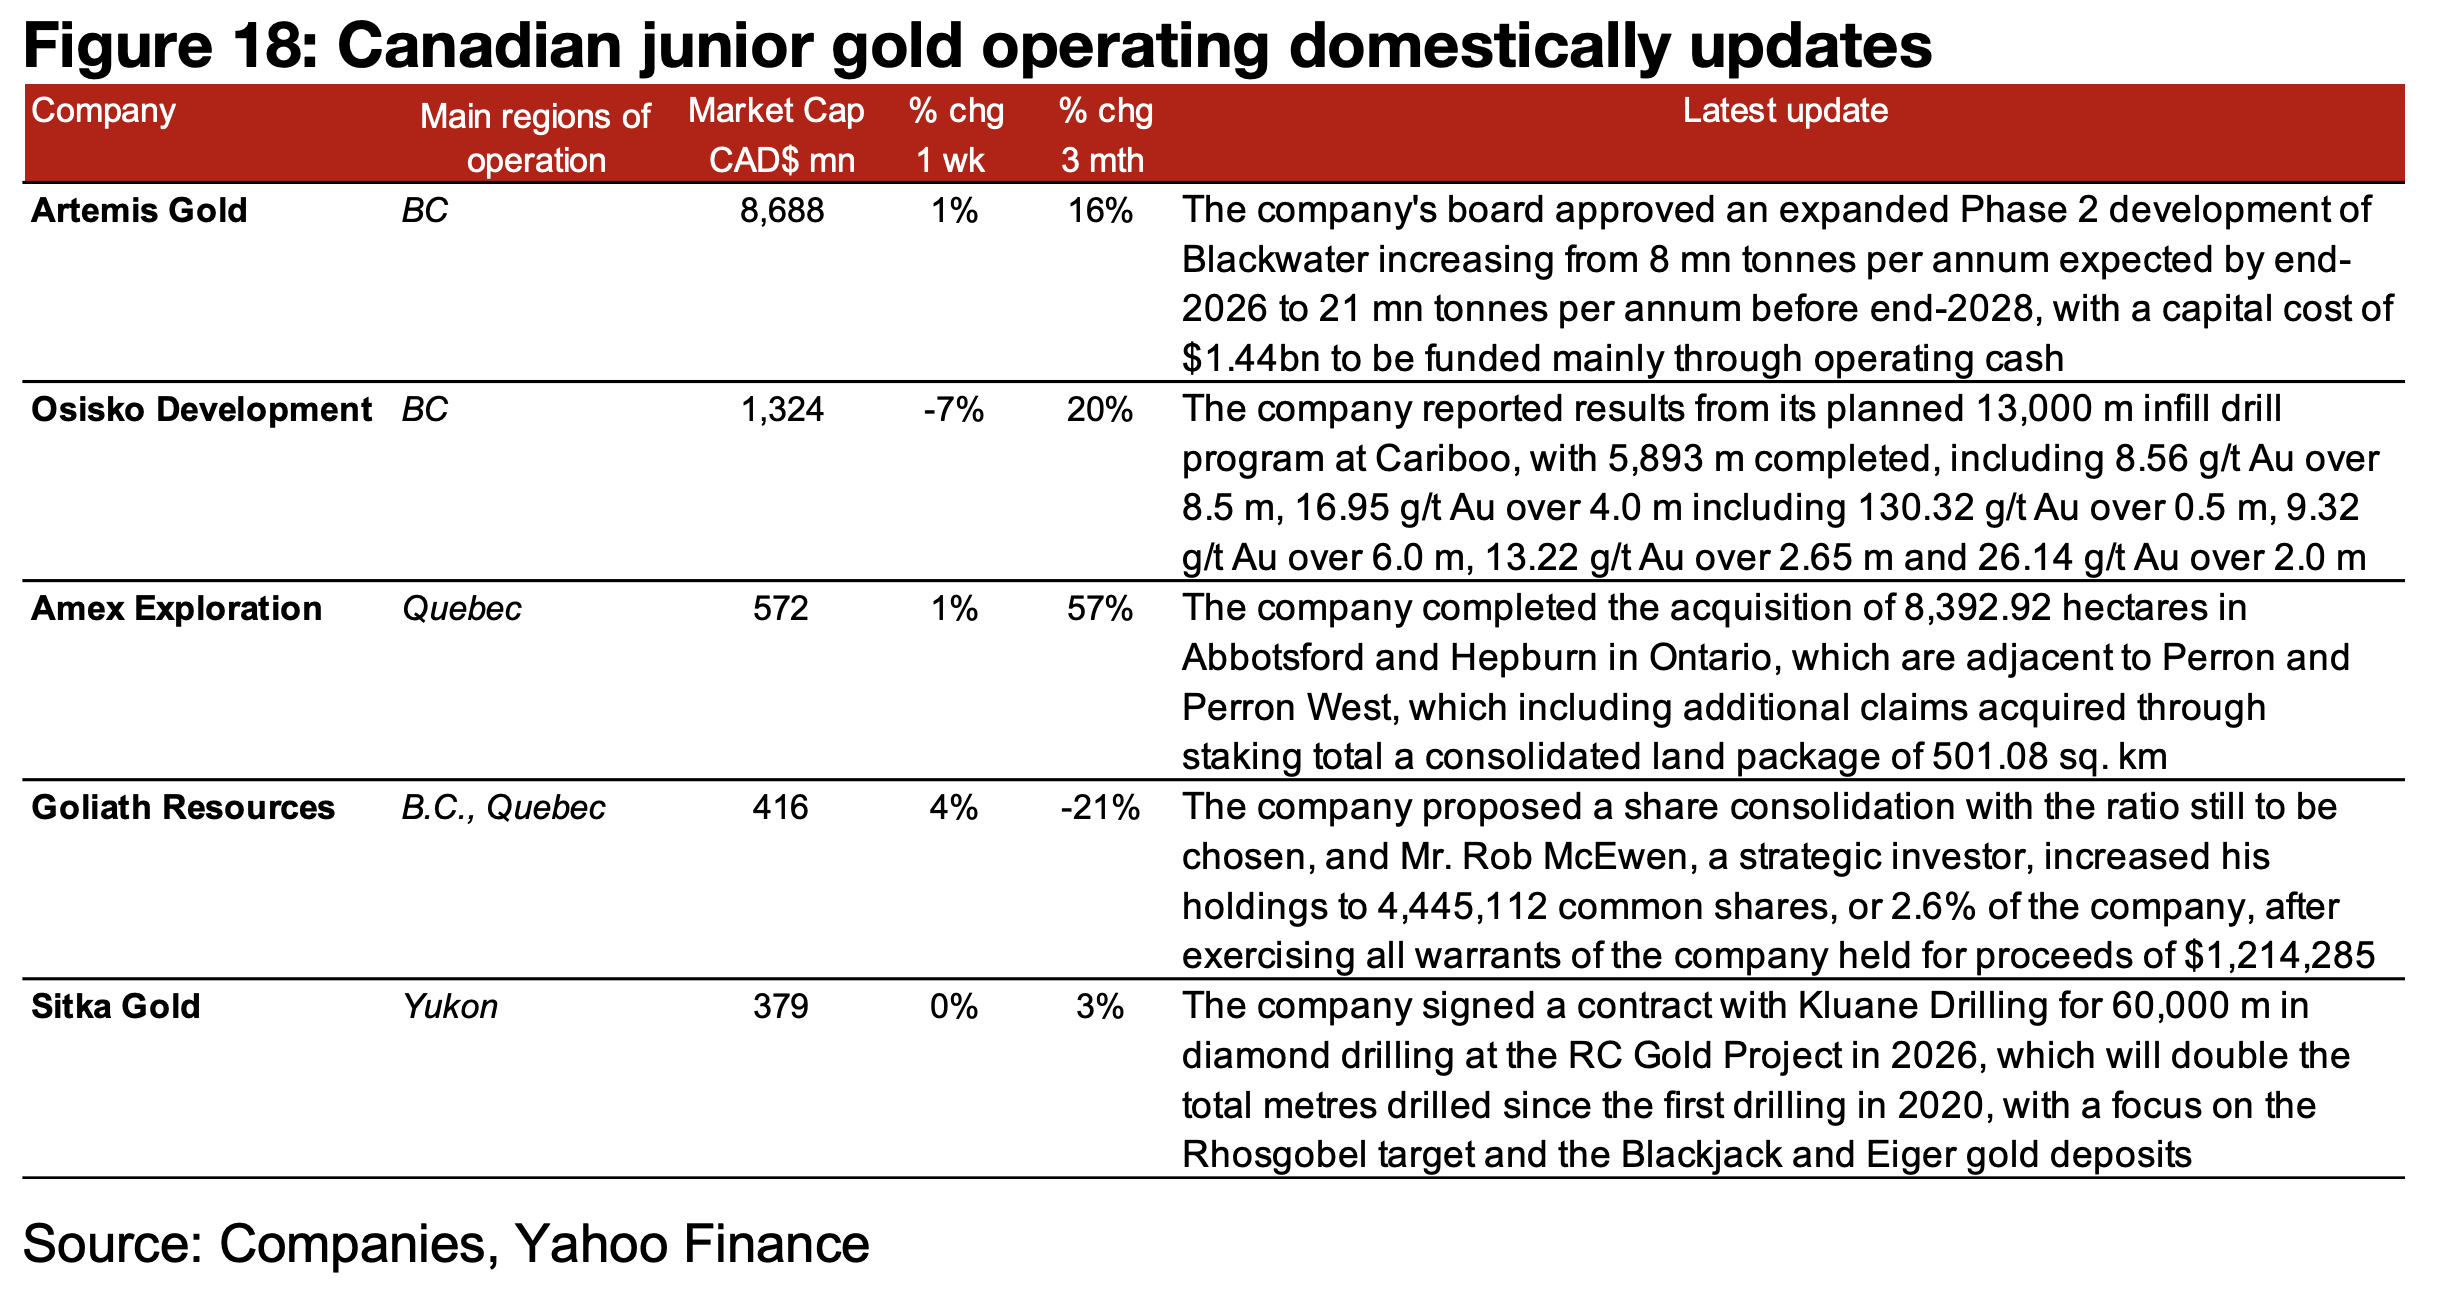
small caps equities overall (Figures 16, 17). For the TSXV gold companies operating
mainly domestically, Artemis approved the Blackwater Phase 2 expansion, Osisko
Development reported drill results from Cariboo, Amex completed the acquisition of
two properties, Goliath proposed a share consolidation and Mr. Rob McEwen
increased his stake in the company and Sitka signed a contract with Kluane drilling
for a 60,000 m program at the RC Gold project (Figure 18).
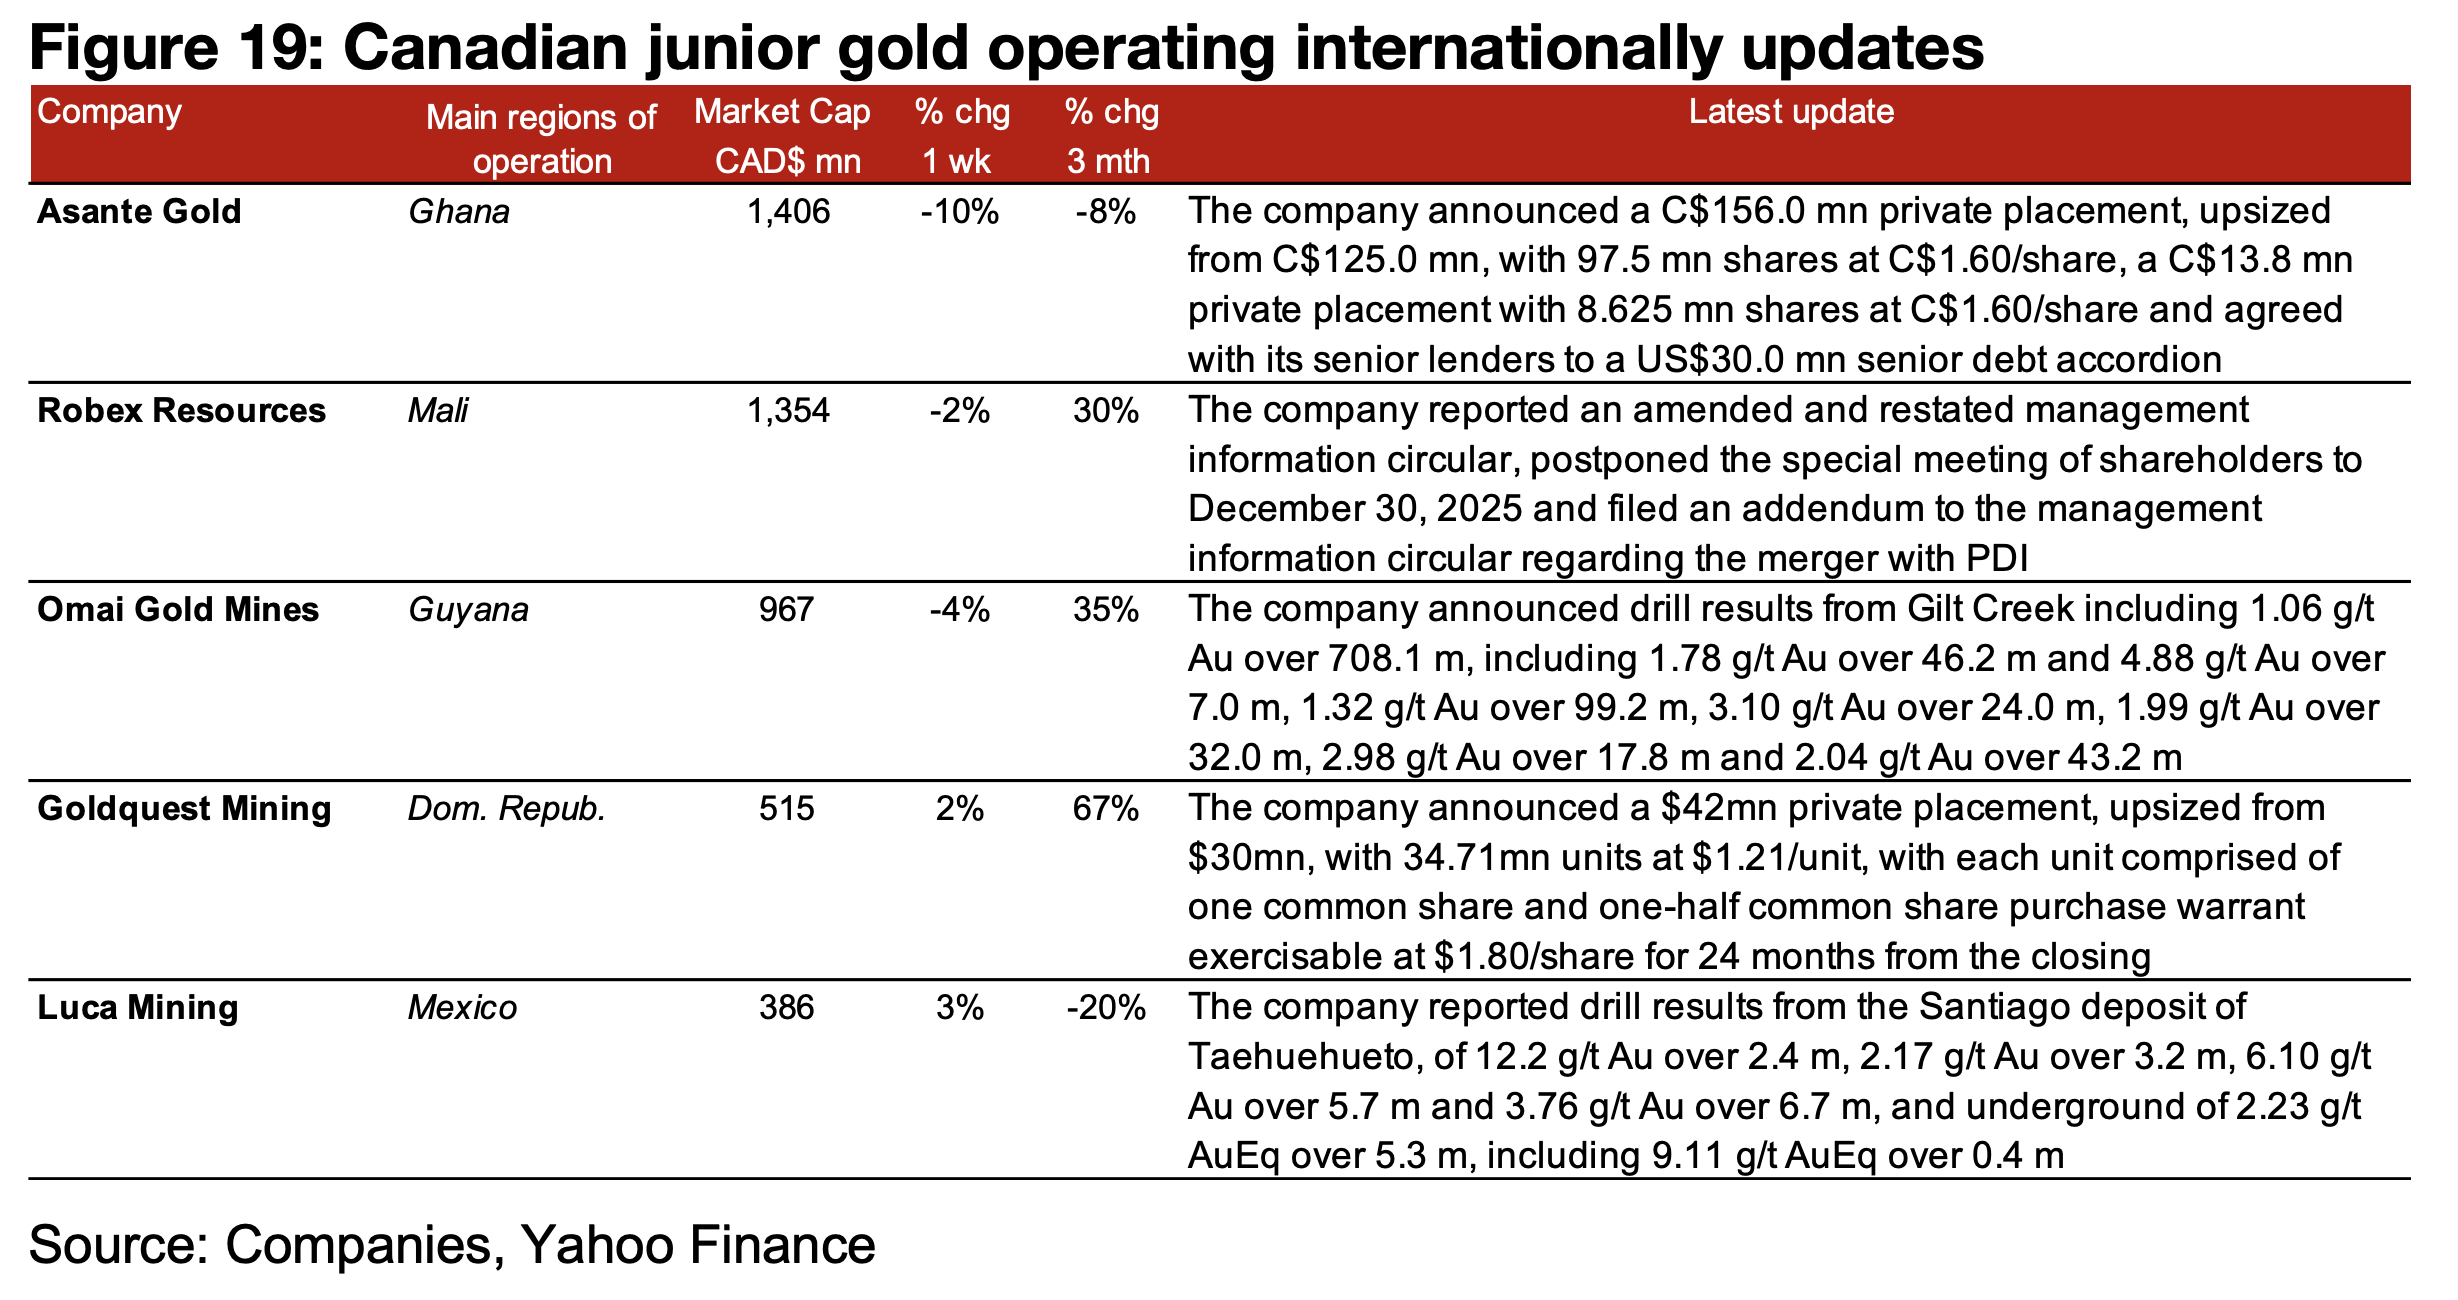
For the TSXV gold companies operating mainly internationally, Asante announced an
upsized US$156mn private placement, another US$13mn private placement and a
US$30mn senior debt accordion, Robex reported an amended and restated
management circular, postponed its special shareholders meeting and filed an
addendum to the circular for its planned merger with PDI, Omai reported drill results
from Gilt Creek, Goldquest announced an upsized US$42mn private placement and
Luca reported drill results from Santiago at Tahuehueto (Figure 19).
Disclaimer: This report is for informational use only and should not be used an alternative to the financial and legal advice of a qualified professional in business planning and investment. We do not represent that forecasts in this report will lead to a specific outcome or result, and are not liable in the event of any business action taken in whole or in part as a result of the contents of this report.
Author
Ben McGregor authors the Weekly Roundup at CanadianMiningReport.com, providing sharp analysis of the metals and mining sector. With a talent for spotting trends, Ben distills complex market shifts into clear, engaging insights on TSXV junior miners. His weekly updates cover gold, copper, uranium, and more, blending data-driven perspectives with a knack for identifying opportunities. A vital resource for investors, Ben’s work navigates the dynamic junior mining landscape with precision.